
Sensient Technologies Corporation
777 East Wisconsin AvenueMilwaukee, Wisconsin 53202-5304www.sensient-tech.com
20
04
AN
NU
AL
RE
PO
RT

world headquarters
777 East Wisconsin AvenueMilwaukee, Wisconsin 53202-5304(414) 271-6755(800) 558-9892Fax: (414) 347-4795E-mail: [email protected] site: www.sensient-tech.com
transfer agent and registrar
Wells Fargo Bank Minnesota, N.A.Shareowner Services P. O. Box 64854St. Paul, Minnesota 55164-0854(800) 468-9716Web site: www.wellsfargo.com/com/shareowner_services/
common stock
Sensient Technologies Corporation Common Stock is traded on the New York Stock Exchange. Ticker symbol: SXT.
There were 3,915 shareholders of record of Common Stock as of January 31, 2005.
annual meeting of shareholders
The Annual Meeting of Shareholders will be held at 2:00 p.m. (EDT) on Thursday, April 21, 2005, at The Four Seasons Hotel, 200 Boylston Street, Boston, Massachusetts.
form 10-k
The Company’s annual report filed with the Securities and Exchange Commission on Form 10-K is available without charge from the Company’s Investor Relations Department and on its Web site at www.sensient-tech.com.
dividends
Quarterly dividends are typically paid on the first business day of March, June, September and December.
automatic dividend reinvestment plan
The Sensient Technologies Corporation Dividend Reinvestment Plan provides shareholders with a con-venient, economical way to increase their ownership of Sensient Technologies Corporation Common Stock. Through the plan, shareholders can automatically reinvest their dividends to acquire additional shares and make supplemental stock purchases without paying fees or commissions. An enrollment form and brochure describing the plan can be obtained by contacting the plan administrator, Wells Fargo Bank Minnesota at (800) 468-9716 or the Company’s Investor Relations Department at (414) 347-3779.
investor relations
Communications concerning the transfer of shares, lost certificates, duplicate mailings or change of address should be directed to the transfer agent.
Other shareholder information, such as news releases and information regarding corporate governance, is available on the Company’s Web site: www.sensient-tech.com. Shareholders can also register to receive notification via e-mail when new information is added to the site. The Company’s Web address is provided as an inactive textual reference only, and the contents of the Web site are not incorporated in or otherwise to be regarded as part of this annual report.
Other requests for information should be directed to the Company’s Investor Relations Department at (414) 347-3779.
The Company maintains a direct mailing list for news releases and quarterly reports. If you would like your name added to this list, please contact the Company’s Investor Relations Department.
I N V E S T O R information
Letter to Shareholders 2
Business Profile 4
Building Value 6
Financial Review 16
Board of Directors 50
Officers 50
Investor Information Inside Back Cover
Table of Contents
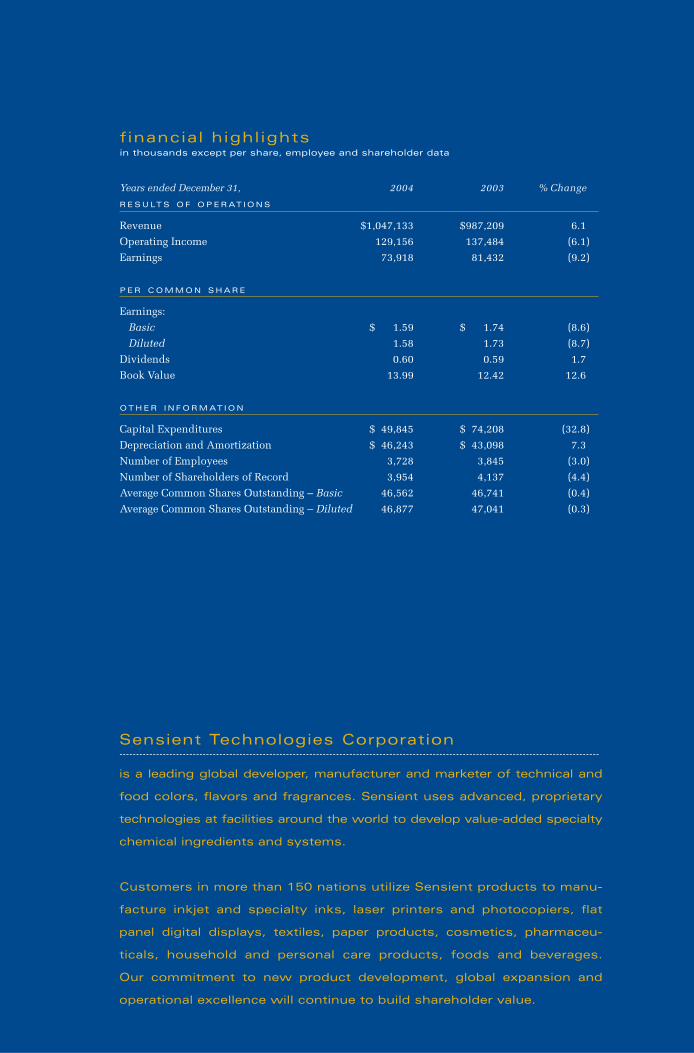
financial highlightsin thousands except per share, employee and shareholder data
Years ended December 31, 2004 2003 % Change
R E S U LT S O F O P E R AT I O N S
Revenue $1,047,133 $987,209 6.1
Operating Income 129,156 137,484 (6.1)
Earnings 73,918 81,432 (9.2)
P E R C O M M O N S H A R E
Earnings:
Basic $ 1.59 $ 1.74 (8.6)
Diluted 1.58 1.73 (8.7)
Dividends 0.60 0.59 1.7
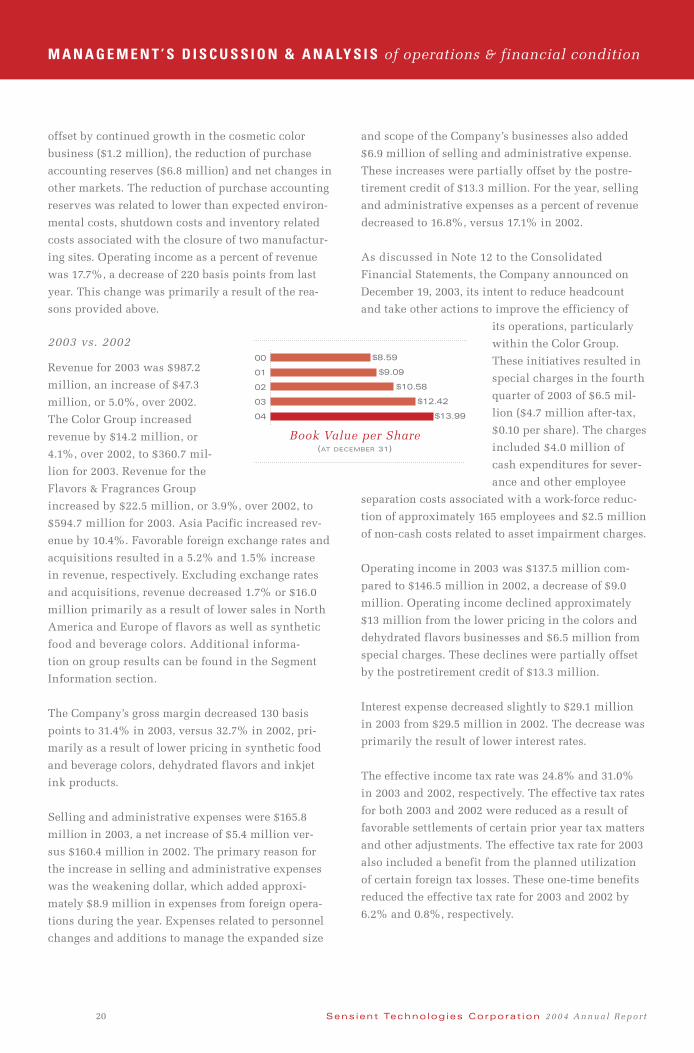
Book Value 13.99 12.42 12.6
O T H E R I N F O R M AT I O N
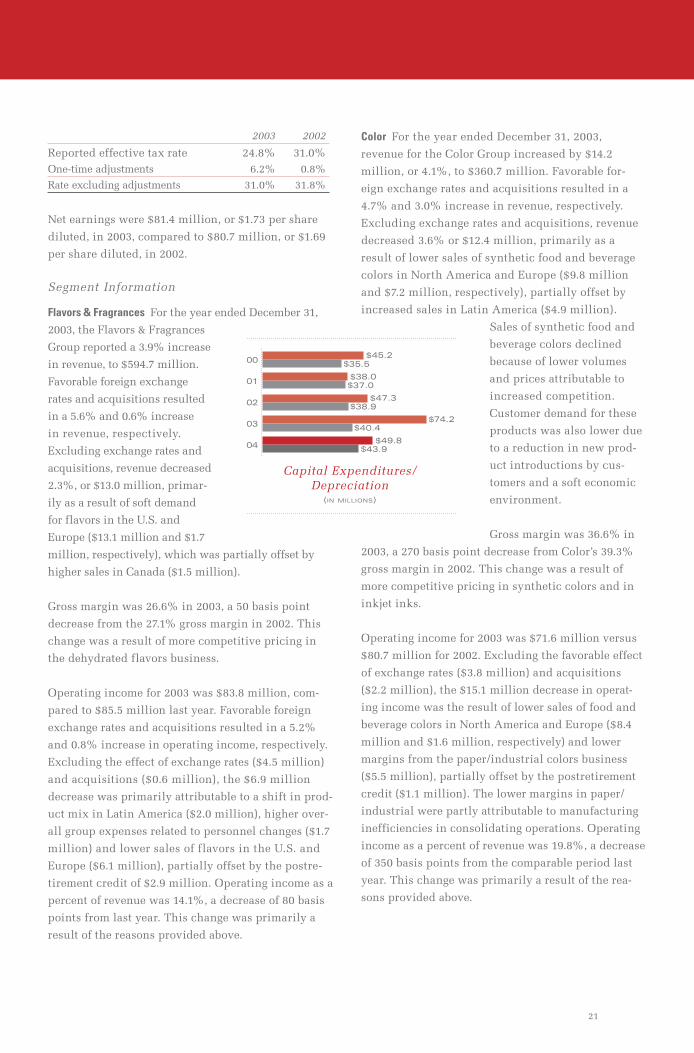
Capital Expenditures $ 49,845 $ 74,208 (32.8)
Depreciation and Amortization $ 46,243 $ 43,098 7.3
Number of Employees 3,728 3,845 (3.0)
Number of Shareholders of Record 3,954 4,137 (4.4)
Average Common Shares Outstanding – Basic 46,562 46,741 (0.4)
Average Common Shares Outstanding – Diluted 46,877 47,041 (0.3)
is a leading global developer, manufacturer and marketer of technical and
food colors, fl avors and fragrances. Sensient uses advanced, proprietary
technologies at facilities around the world to develop value-added specialty
chemical ingredients and systems.
Customers in more than 150 nations utilize Sensient products to manu-
facture inkjet and specialty inks, laser printers and photocopiers, fl at
panel digital displays, textiles, paper products, cosmetics, pharmaceu-
ticals, household and personal care products, foods and beverages.
Our commitment to new product development, global expansion and
operational excellence will continue to build shareholder value.
Sensient Technologies Corporation
In 2004, Sensient Technologies Corporation surpassed $1 billion in annual revenue for
the fi rst time in the Company’s history. We are fi nancially and strategically positioned to
continue building shareholder value.
2004 Results: Achieving a Milestone
Total 2004 revenue was $1.047 billion, which represents a 6.1% annual increase over 2003. Attaining the $1 billion mark is the result of a successful long-term growth strategy that emphasizes high-performance, technology-based products. The Company’s leadership and international workforce deserve recognition for reaching this important milestone.
In 2004, we also made great strides in improving cash fl ow and reducing debt. The Company’s total debt declined $39.5 million from December 31, 2003, to December 31, 2004. In the same period, cash fl ow from operating activities was $125.7 million.
Efficiency and Excellence
Sensient focused on integrating and improving operations on a worldwide basis in 2004. We participate in several highly competitive markets that demand effi ciency and reward excellence.
The Company implemented profi t improvement initiatives in several areas of the business. We have consolidated production for some of our more mature products into lower-cost facilities and reduced headcount where possible. We are also improving our raw material sourcing and warehousing for greater cost savings.
Operational improvements and cost reduction will continue to increase profi tability. But improved effi ciency is only one part of Sensient’s operational focus. We have also made substantial investments in facilities around the world that make our Company a dynamic leader in colors, fl avors and fragrances.
In 2004, we completed the expansion of our St. Louis Color Group headquarters and research facility. We also made important investments in China. We built a new Flavor facility in Qingdao, China, to source low-cost product for this region. We also added pharmaceutical color laboratories and production to our primary Chinese production and research facilities in Guangzhou.
An intensive period of capital investment in facilities improvement around the world is now largely completed. Our highly automated, state-of-the-art facilities refl ect the world-class nature of our Company and the global Sensient brand. We have also developed a complex facilities management model that enables us to maintain the quality and effi ciency of our plants.
Proprietary Products and Technology
Sensient seeks to deliver long-term sustainable growth by maximizing the potential of the global infrastructure that we have built over the last decade. We are leveraging our facilities and expert personnel to develop new high-performance products for digital imaging, specialty printing, personal and home care products, cosmetics, pharmaceuticals, and food and beverages.
Our products for nonfood markets offer the best opportunities for growth, but we continue to compete aggressively in our traditional food and beverage markets with a strong roster of new technologies such as unique dispersions, emulsions, coatings and extraction technologies.
letter to S H A R E H O L D E R S
2

Our expertise in high-performance colors now ranges far beyond food. We continue to see double-digit annual revenue growth opportunities from our products for the pharmaceutical and cosmetics industries as well as digital imaging and specialty printing. In these markets, we offer color systems that help our customers grow successfully in competitive environments.
Valuable intellectual property (IP) forms the basis of Sensient’s products. In addition, scientists working at Sensient facilities in the United States, Europe and Asia continue to develop new proprietary formulations and processes. In order to protect our IP and maximize its value, we are increasing our patent fi lings signifi cantly.
Positioned for Sustainable Growth
In the last decade, Sensient’s name has become known around the world. We now operate from 77 locations in 30 countries. We sell products in more than 150 nations. Two-thirds of our workforce are citizens of countries other than the United States. Our presence in regions around the globe is providing value to every part of the Company’s operations.
In 2004, we began to see improvements in several markets that were fl at in 2003. The North American food and beverage industry improved in 2004, and we expect additional strength in 2005. Pressure from low-cost retailers continues to impact food and beverage, but we are able to fi nd continued growth from our high-performance customized products. We see signifi cant opportunities arising from our position in dynamic global markets like digital and display imaging and cosmetics.
Sensient’s leadership in established and emerging markets will continue to build share-holder value. I remain confi dent about our future progress.
Sincerely,
KENNETH P. MANNING
Chairman, Presidentand Chief Executive Offi cer
Kenneth P. Manning Chairman, President and Chief Executive Offi cer
3

Sensient is a leading global developer, manufacturer and supplier of natural and synthetic color
systems for customers in a wide range of industries. The Company’s technology and products
play an integral role in the manufacture of inkjet inks, laser printers and copiers, fl at panel
digital displays, cosmetics, pharmaceuticals, textiles, paper products, foods and beverages.
compet i t ive advantages
· Product breadth in all markets
· Proprietary technologies for food and nonfood products
· Technical expertise in specialty chemicals and purifi cation processes
· Operations in key regions around the world
g rowth st rateg ies
· Develop application and product-line extensions
· Expand technical color business in Asia and Europe
· Streamline distribution and logistics
· Generate valuable intellectual property and build patent portfolio
18% inkjet inks
16% other technical colors
19% natural food colors
28% synthetic food colors
16% cosmetics
3% pharmaceuticals
revenue by product l ine
business P R O F I L E
c o l o r
4

f l a v o r s & f r a g r a n c e s
Sensient develops, manufactures and supplies fl avor and fragrance systems that are found
in thousands of consumer products around the globe. The Company’s unique formulations
provide the foundation for food, beverage, household and personal care products. Sensient’s
expertise, service and broad product line make the Company a preferred supplier to several
market-leading multinationals.
10% other flavors
9% fragrances
23% dehydrated flavors
13% beverage flavors
18% savory flavors
5% confectionery & bakery flavors
22% dairy flavors
compet i t ive advantages
· Broadest product line in the industry
· Global facilities offering direct access to customers
· Ability to respond rapidly to local market trends
· Exceptional service and technical support
g rowth st rateg ies
· Build strategic alliances with new and existing customers
· Promote advantages of higher-margin, value-added products
· Speed time-to-market of new products
· Leverage global presence to add customers and improve effi ciencies
revenue by product l ine
5

LOCATIONS
Corporate
Milwaukee, Wisconsin, U.S.A.
Flavors & Fragrances
Indianapolis, Indiana, U.S.A.Amboy, Illinois, U.S.A.Harbor Beach, Michigan, U.S.A.Juneau, Wisconsin, U.S.A.Greenfi eld, California, U.S.A.Livingston, California, U.S.A. (2) Turlock, California, U.S.A.Delta, British Columbia, CanadaCornwall, Ontario, CanadaMississauga, Ontario, Canada Rexdale, Ontario, Canada Tara, Ontario, Canada Celaya, Mexico Mexico City, MexicoTlalnepantla, Mexico São Paulo, Brazil Brussels, BelgiumHeverlee, Belgium Marchais, France Paris, France Strasbourg, FranceBremen, GermanyMilan, Italy Elburg, Netherlands Naarden, Netherlands Barcelona, Spain Granada, Spain Kristianstad, Sweden Milton Keynes, U.K. Ceredigion (Felinfach), U.K.
Color
St. Louis, Missouri, U.S.A. Escondido, California, U.S.A. Elmwood Park, New Jersey, U.S.A. South Plainfi eld, New Jersey, U.S.A. (3)Charlotte, North Carolina, U.S.A.Kingston, Ontario, Canada Lerma, Mexico Tijuana, Mexico Buenos Aires, Argentina São Paulo, Brazil Prague, Czech Republic La Plaine Saint-Denis, France Paris, France Hamburg, Germany Leipzig, Germany Budapest, Hungary Reggio Emilia, Italy (2) Amersfoort, Netherlands Warsaw, Poland Oradea, Romania Zenta, Serbia Barcelona, SpainLausanne, Switzerland King’s Lynn, U.K. Johannesburg, South Africa
Asia Pacific
Singapore Melbourne, Australia Sydney, Australia Beijing, ChinaGuangzhou, ChinaHong Kong, China Qingdao, China Shanghai, ChinaMumbai, India Jakarta, Indonesia Tokyo, Japan Osaka, Japan Hitachi, Japan Seoul, Korea Auckland, New Zealand Manila, Philippines Bangkok, Thailand
6
Sensient draws on its expertise in specialty chemicals
with unique process and application technologies to create
new products that BUILD VALUE for our shareholders.
The following pages share recent RESULTS of our
commitment to developing innovative products and
moving them rapidly into the marketplace.
7

COATING SYSTEM for pharmaceuticals
Sensient provides manufacturers of pharmaceutical products world-Sensient provides manufacturers of pharmaceutical products world-
wide with Spectrablend, a high-performance tablet coating system. wide with Spectrablend, a high-performance tablet coating system.
This patented polymer fi lm technology offers several advantages over This patented polymer fi lm technology offers several advantages over
competitor products that help speed manufacturing time. Spectrablend competitor products that help speed manufacturing time. Spectrablend
enables our customers to apply safe and stable pigmented or clear enables our customers to apply safe and stable pigmented or clear
coatings to a range of end products, including vitamins, over-the- coatings to a range of end products, including vitamins, over-the-
counter medications and prescription drugs.counter medications and prescription drugs.
8

PIGMENT DISPERSIONfor inkjet printing
Sensient Imaging Technologies develops high-performance pigment
dispersions for inkjet printing. These chemical systems provide
brilliant and durable colors for inks used in digital printing for
photography, desktop publishing and textile products, including
banners, industrial fabrics, home furnishings and apparel. In the
fast-changing world of fashion and design, pigmented inkjet inks
help reduce waste, improve supply chain management and enable
rapid customization.
9

ULTRAPURE COLORS for cosmetics
Sensient’s products for the cosmetics industry continue to achieve
annual double-digit percentage sales growth. This performance is the
result of the Company’s ongoing commitment to developing high-
performance products that cannot be equaled in the marketplace.
In 2004, we introduced our new Unipure Color Line—an exceptional
line of organic and inorganic colors that meet regulatory guidelines in
markets around the globe.
10

E X TRACTION technologies Botanical extracts have long been used to fl avor foods and beverages.
To improve on what has become a traditional, industry-wide process,
Sensient Flavors has developed new extraction technologies that
produce signifi cantly more concentrated fl avor than other processes.
Sensient is able to integrate these new extracts into fl avoring systems
for beverages such as coffee and tea, as well as offer them as stand-
alone products.
11

ORGANIC photo conductors
Sensient Imaging Technologies creates sophisticated chemicals called
organic photo conductors (OPCs) that are essential components of
high-speed laser printers and photocopiers. These unique compounds
generate and transfer electrical charges, which enable pigmented
toner to be transferred from a printer’s drum onto paper. We produce
these unique, highly purifi ed chemicals using proprietary technology
developed at our facility in Germany.
12

FOOD-GRADE inkjet inks
Sensient is building value by combining our core competencies in
creative new ways. Scientists working in food color and inkjet
technology jointly developed food-grade inkjet inks that enable
high-speed printing on food products. Manufacturers of crackers, potato
chips, baked goods and snack foods can promote their brands, create
novel products and stand out in the crowded marketplace by making
use of this new technology.
13

NON-MIGRATING natural food colors
At the Sensient Colors operation in Germany, we recently developed
a new line of natural food colors with non-migrating properties.
This characteristic enables colors in various processed foods, including
seafood products, layered yogurts and sausage casings, to remain
stable, distinct and bright. We drew on our expertise in pigment
dispersion and emulsion technology to develop the innovative
manufacturing process that results in this exceptional product.
14

FINISHING savory flavors
Food manufacturers have long sought higher-quality, more cost-
effective fl avorings for savory products. To meet this demand,
Sensient Flavors developed a line of fi nishing savory fl avors that
combine top notes and other fl avors. These sophisticated fl avoring
systems provide truer fl avor fi delity and greater thermal stability than
traditional savory fl avors. Sensient’s fi nishing savory fl avors enhance
soups, sauces and prepared foods.
15

financial R E V I E W
Management’s Discussion & Analysis of Operations & Financial Condition 17
Consolidated Statements of Earnings 27
Consolidated Balance Sheets 28
Consolidated Statements of Cash Flows 29
Consolidated Statements of Shareholders’ Equity 30
Notes to Consolidated Financial Statements 32
Management’s Report on Internal Control Over Financial Reporting 45
Report of Independent Registered Public Accounting Firm 45
Report of Independent Registered Public Accounting Firmon Internal Control Over Financial Reporting 46
Quarterly Data 47
Common Stock Prices and Dividends 47
Five Year Review 48
Table of Contents
16
17
Overview
During 2004, Sensient Technologies Corporation (the
“Company”) focused on implementing the cost sav-
ings programs announced in 2003, improving cash
flows and reducing debt. As a result, the Company
generated over $125 million of cash flow from opera-
tions for the first time in its history. The Company
also reduced debt by nearly $40 million during the
year. These actions strengthened the balance sheet
and better positioned the Company for future oppor-
tunities. The Company also improved its top line
results in 2004. The Company achieved a milestone
of $1 billion of revenue.
Sensient Technologies Corporation continued to
respond to a challenging market environment during
2004. The Company continued to face price compe-
tition in several of its businesses, including dehy-
drated flavors and certain technical colors. Based
on the actions taken by the Company, the impact of
these factors was mitigated by cost savings. During
2004, the Company recognized pre-tax savings of
approximately $7.5 million from the initiatives begun
in the fourth quarter of 2003 to improve profitability.
These initiatives and other work undertaken in 2004
helped improve the results of the Company’s busi-
nesses. In addition, the Company’s product lines pro-
vided solid growth in other areas, such as cosmetic
colors and traditional flavors.
During 2004, the Company substantially completed
several projects in the Asia Pacific Group in order to
increase the Company’s presence in this promising
region. Projects completed include a research facil-
ity in Australia, a new dehydrated flavors plant in
China and a sales office in Indonesia. Management
believes the completion of these projects will help
the Company to grow in the region by improving the
Company’s ability to provide technical support, inter-
act with local customers and realize cost efficiencies.
The Company also continued to invest in upgrading
its facilities in North America and Europe.
M A N A G E M E N T ’ S D I S C U S S I O N & A N A LY S I S of operations & financial condition
There were certain special charges and a special
credit that were taken in 2003, which affect the
comparison of results in 2004 and 2003.
• In the fourth quarter of 2003, the Company imple-
mented a number of specific initiatives to improve
profitability and growth opportunities within its
businesses, particularly within the Color Group.
These initiatives resulted in special 2003 charges
of $6.5 million ($4.7 million after-tax, or $0.10 per
share). The charges included $4.0 million of cash
expenditures for severance and other employee
separation costs associated with a work-force
reduction of approximately 165 employees and $2.5
million of non-cash costs related to asset impair-
ment charges. The Company spent $1.2 million of
this amount through December 31, 2003, and paid
out most of the remainder in 2004. These initia-
tives are ultimately expected to deliver annualized
pre-tax savings of approximately $9 million, with
related savings of approximately $7.5 million expe-
rienced in 2004.
• The Company also took actions during the fourth
quarter of 2003 to significantly reduce its liabilities
for certain postretirement benefit programs. The
Company no longer subsidizes the cost of health
care coverage offered to retirees. As a result of this
change in benefits, the Company recognized a one-
time, non-cash credit of $13.3 million ($8.2 million
after-tax, or $0.17 per share) in 2003.
The Company achieved operating income in 2004
of $129.2 million, compared to operating income of
$137.5 million in 2003. The 2003 one-time special
charge and postretirement credit discussed above
had the net effect of increasing the 2003 operating
income by $6.8 million. Net earnings in 2004 were
$73.9 million, compared to net earnings of $81.4
million in 2003. The one-time special charge and
postretirement credit in 2003 had the net effect of
increasing net earnings in 2003 by $3.5 million.
Diluted earnings per share were $1.58 in 2004, com-
pared to diluted earnings per share of $1.73 in 2003.
The net effect of the one-time special charge and
postretirement credit in 2003 increased 2003 diluted
earnings per share by $0.07.

M A N A G E M E N T ’ S D I S C U S S I O N & A N A LY S I S of operations & financial condition
Sensient Technologies Corporat ion 2 0 0 4 A n n u a l R e p o r t18
Results of Operations
2004 vs. 2003
Revenue for 2004 was $1,047.1 million, an increase
of $59.9 million, or 6.1%, over 2003. Revenue for the
Flavors & Fragrances Group increased by $34.1 mil-
lion, or 5.7%, over 2003, to $628.8 million for 2004.
The Color Group increased revenue by $23.1 million,
or 6.4%, over 2003, to $383.8 million for 2004. The
Asia Pacific Group increased
revenue by 8.8%. Favorable
foreign exchange rates and
an acquisition resulted in
a 3.3% and 0.3% increase
in consolidated revenue,
respectively. Excluding the
impact of exchange rates and
the acquisition, consolidated
revenue increased 2.4% or $23.5 million, primarily
as a result of increases in sales of flavors in North
America as well as higher sales of inkjet inks due to
special factors discussed below. Additional informa-
tion on group results can be found in the Segment
Information section.
The Company’s gross margin decreased 160 basis
points to 29.8% in 2004, versus 31.4% in 2003.
Approximately one-half of the margin decrease was
due to lower pricing in the dehydrated flavors busi-
ness and in technical colors. The decrease in selling
prices was a result of increased competitive activity.
The remainder of the decrease primarily related to
lower production costs in 2003 from the buildup of
inventory in anticipation of manufacturing consoli-
dations at the Company, which were completed in
the first half of 2004.
Selling and administrative expenses as a percent of
revenue increased to 17.5% in 2004, versus 16.8% in
2003. The increase in percentage was a result of the
one-time postretirement credit of $13.3 million in
2003, partially offset by savings in 2004 from the cost
reduction programs initiated in 2003 and 2004.
Operating income in 2004 was $129.2 million com-
pared to operating income of $137.5 million in 2003.
The 2003 one-time special charge and postretirement
credit discussed above had the net effect of increas-
ing 2003 operating income by $6.8 million. Favorable
exchange rates increased operating income by 2.4%
compared to 2003.
Interest expense increased to $31.3 million in 2004
from $29.1 million in 2003. The increase was primar-
ily the result of higher interest rates.
The effective income tax rate
was 24.5% and 24.8% in 2004
and 2003, respectively. The
effective tax rates for both 2004
and 2003 were reduced as a
result of favorable settlements
of certain prior year tax mat-
ters, benefits for the planned
use of foreign tax losses and other adjustments. These
one-time benefits reduced the effective tax rate for
2004 and 2003 by 4.2% and 6.2%, respectively.
2004 2003
Reported effective tax rate 24.5% 24.8%
One-time adjustments 4.2% 6.2%
Rate excluding adjustments 28.7% 31.0%
The effective tax rate for 2005 is expected to be
approximately 30.0%.
On October 22, 2004, the American Jobs Creation
Act of 2004 (the “Act”) was signed into law. The Act
is not anticipated to have a significant impact on
the Company’s results of operations or cash flows in
2005. Beginning in 2006, the Company expects the
Act to increase its effective annual tax rate by 0.5%.
Segment Information
Flavors & Fragrances For the year ended December 31,
2004, revenue for the Flavors & Fragrances segment
increased 5.7%, to $628.8 million. Favorable foreign
exchange rates resulted in a 3.5% increase in rev-
enue. Excluding exchange rates, revenue increased
2.2%, or $13.2 million, the result of higher sales of
traditional flavors in North America ($9.9 million),
Revenue(IN MILLIONS)
00
01
02
03
04
$809.2
$816.9
$939.9
$987.2
$1,047.1
19
beverage colors ($5.2 million). Cosmetic colors and
pharmaceuticals each showed double-digit growth.
Within technical colors, revenue related to OEM
inkjet ink products increased due to the wind-up
of a supply agreement and a shift to spot purchas-
ing by a major customer. The customer decided to
consolidate inkjet ink purchases with other sup-
pliers, but increased purchases in advance of the
changeover. The Company will continue to sell to
this customer, but expects that
inkjet ink revenue and income
will decline substantially until
the Company is able to obtain
additional business from new
and existing inkjet ink custom-
ers. During 2004, this customer
represented 12% or approxi-
mately $47 million and 15% or
approximately $10 million of Sensient’s Color Group
total revenue and operating income, respectively.
Excluding the increase in sales to this customer, the
rest of technical colors revenue decreased due to
competitive pressures reducing pricing and volume.
Gross margin was 33.2% in 2004, a 340 basis point
decrease from Color’s 36.6% gross margin in 2003.
Approximately half of this change was a result of
more competitive pricing in synthetic colors and in
technical colors. The remainder of the decrease pri-
marily related to lower production costs in 2003 from
the buildup of inventory in anticipation of manufac-
turing consolidations at the Company, which were
completed in the first half of 2004.
Operating income for 2004 was $68.0 million versus
$71.6 million for 2003. Excluding the favorable effect
of exchange rates (2.8% or $2.0 million) and acquisi-
tions (1.2% or $0.8 million), the $6.4 million decrease
in operating income was the result of several factors.
These factors include the $1.1 million postretirement
credit recorded in 2003, declines in the food and
beverage colors in North America and Europe ($7.2
million and $2.7 million, respectively) and lower
margins from the paper/industrial colors business
($3.6 million). These lower margins were attribut-
able to pricing declines and change in product mix
to lower margin products. These items were partially
higher fragrance sales due to the expansion in the
aroma chemical product line ($2.3 million) and net
changes in other markets.
Gross margin was 26.1% in 2004, a 50 basis point
decrease from the 26.6% gross margin in 2003. This
change was primarily a result of more competitive
pricing in the dehydrated flavors business.
Operating income for 2004
was $81.3 million compared
to $83.8 million last year.
Excluding the favorable effect
of exchange rates (1.5%,
or $1.3 million), operating
income decreased $3.7 mil-
lion primarily attributable to
one-time events. In the fourth
quarter of 2004, operating income was reduced by
the write-off of a $3.0 million receivable related to
a previously divested product line. The $2.9 mil-
lion one-time postretirement credit recorded in the
fourth quarter of 2003 also unfavorably impacted
comparability. Besides these one-time items, operat-
ing income was impacted by favorable product mix
and increased sales of traditional flavors in North
America ($8.6 million), offset by lower profits in
the dehydrated flavors business due to lower pric-
ing ($3.7 million), and lower profits in fragrances
due to lower pricing and higher costs of produc-
tion ($3.1 million), net of changes in other markets.
Operating income as a percent of revenue was
12.9%, a decrease of 120 basis points from last year.
This change was primarily a result of the reasons
provided above.
Color For the year ended December 31, 2004, revenue
for the Color segment increased 6.4% to $383.8
million. Favorable foreign exchange rates and an
acquisition resulted in a 3.3% and a 0.9% increase
in revenue, respectively. Excluding the impact
of exchange rates and the acquisition, revenue
increased 2.2% or $7.8 million, primarily due to
revenue increases in technical colors ($7.1 million),
cosmetic colors ($4.8 million) and pharmaceuticals
($1.0 million). These revenue increases were par-
tially offset by lower volumes and prices in food and
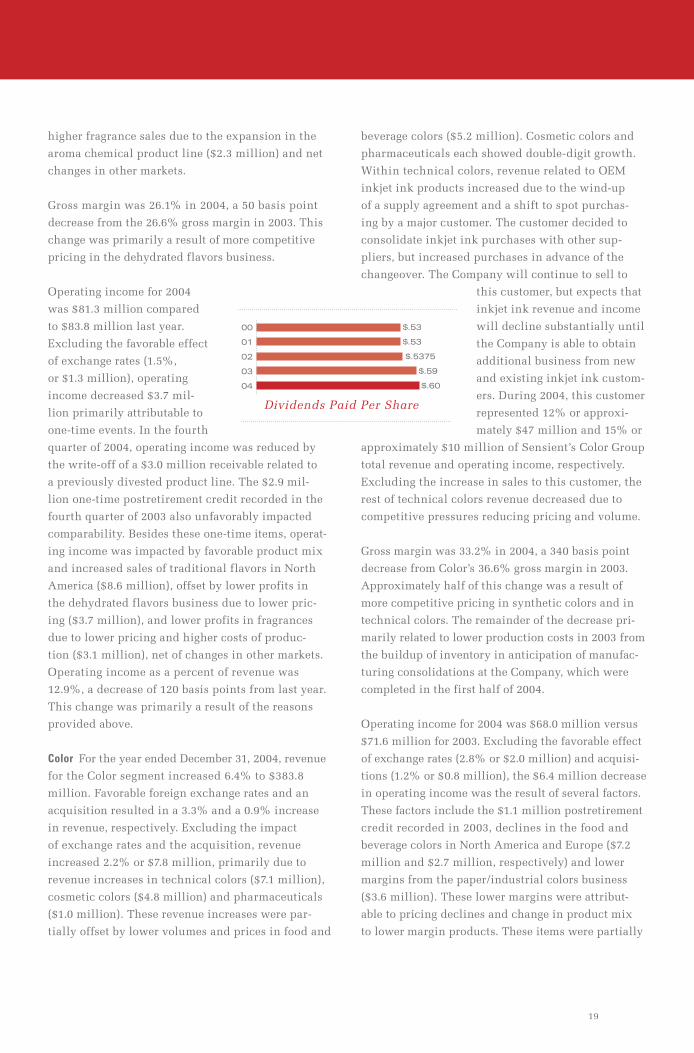
Dividends Paid Per Share
00
01
02
03
04
$.53
$.53
$.5375
$.59
$.60
M A N A G E M E N T ’ S D I S C U S S I O N & A N A LY S I S of operations & financial condition
Sensient Technologies Corporat ion 2 0 0 4 A n n u a l R e p o r t20
offset by continued growth in the cosmetic color
business ($1.2 million), the reduction of purchase
accounting reserves ($6.8 million) and net changes in
other markets. The reduction of purchase accounting
reserves was related to lower than expected environ-
mental costs, shutdown costs and inventory related
costs associated with the closure of two manufactur-
ing sites. Operating income as a percent of revenue
was 17.7%, a decrease of 220 basis points from last
year. This change was primarily a result of the rea-
sons provided above.
2003 vs. 2002
Revenue for 2003 was $987.2
million, an increase of $47.3
million, or 5.0%, over 2002.
The Color Group increased
revenue by $14.2 million, or
4.1%, over 2002, to $360.7 mil-
lion for 2003. Revenue for the
Flavors & Fragrances Group
increased by $22.5 million, or 3.9%, over 2002, to
$594.7 million for 2003. Asia Pacific increased rev-
enue by 10.4%. Favorable foreign exchange rates and
acquisitions resulted in a 5.2% and 1.5% increase
in revenue, respectively. Excluding exchange rates
and acquisitions, revenue decreased 1.7% or $16.0
million primarily as a result of lower sales in North
America and Europe of flavors as well as synthetic
food and beverage colors. Additional informa-
tion on group results can be found in the Segment
Information section.
The Company’s gross margin decreased 130 basis
points to 31.4% in 2003, versus 32.7% in 2002, pri-
marily as a result of lower pricing in synthetic food
and beverage colors, dehydrated flavors and inkjet
ink products.
Selling and administrative expenses were $165.8
million in 2003, a net increase of $5.4 million ver-
sus $160.4 million in 2002. The primary reason for
the increase in selling and administrative expenses
was the weakening dollar, which added approxi-
mately $8.9 million in expenses from foreign opera-
tions during the year. Expenses related to personnel
changes and additions to manage the expanded size
and scope of the Company’s businesses also added
$6.9 million of selling and administrative expense.
These increases were partially offset by the postre-
tirement credit of $13.3 million. For the year, selling
and administrative expenses as a percent of revenue
decreased to 16.8%, versus 17.1% in 2002.
As discussed in Note 12 to the Consolidated
Financial Statements, the Company announced on
December 19, 2003, its intent to reduce headcount
and take other actions to improve the efficiency of
its operations, particularly
within the Color Group.
These initiatives resulted in
special charges in the fourth
quarter of 2003 of $6.5 mil-
lion ($4.7 million after-tax,
$0.10 per share). The charges
included $4.0 million of
cash expenditures for sever-
ance and other employee
separation costs associated with a work-force reduc-
tion of approximately 165 employees and $2.5 million
of non-cash costs related to asset impairment charges.
Operating income in 2003 was $137.5 million com-
pared to $146.5 million in 2002, a decrease of $9.0
million. Operating income declined approximately
$13 million from the lower pricing in the colors and
dehydrated flavors businesses and $6.5 million from
special charges. These declines were partially offset
by the postretirement credit of $13.3 million.
Interest expense decreased slightly to $29.1 million
in 2003 from $29.5 million in 2002. The decrease was
primarily the result of lower interest rates.
The effective income tax rate was 24.8% and 31.0%
in 2003 and 2002, respectively. The effective tax rates
for both 2003 and 2002 were reduced as a result of
favorable settlements of certain prior year tax matters
and other adjustments. The effective tax rate for 2003
also included a benefit from the planned utilization
of certain foreign tax losses. These one-time benefits
reduced the effective tax rate for 2003 and 2002 by
6.2% and 0.8%, respectively.
Book Value per Share(AT DECEMBER 31)
00
01
02
03
04
$8.59
$9.09
$10.58
$12.42
$13.99
21
2003 2002
Reported effective tax rate 24.8% 31.0%One-time adjustments 6.2% 0.8%
Rate excluding adjustments 31.0% 31.8%
Net earnings were $81.4 million, or $1.73 per share
diluted, in 2003, compared to $80.7 million, or $1.69
per share diluted, in 2002.
Segment Information
Flavors & Fragrances For the year ended December 31,
2003, the Flavors & Fragrances
Group reported a 3.9% increase
in revenue, to $594.7 million.
Favorable foreign exchange
rates and acquisitions resulted
in a 5.6% and 0.6% increase
in revenue, respectively.
Excluding exchange rates and
acquisitions, revenue decreased
2.3%, or $13.0 million, primar-
ily as a result of soft demand
for flavors in the U.S. and
Europe ($13.1 million and $1.7
million, respectively), which was partially offset by
higher sales in Canada ($1.5 million).
Gross margin was 26.6% in 2003, a 50 basis point
decrease from the 27.1% gross margin in 2002. This
change was a result of more competitive pricing in
the dehydrated flavors business.
Operating income for 2003 was $83.8 million, com-
pared to $85.5 million last year. Favorable foreign
exchange rates and acquisitions resulted in a 5.2%
and 0.8% increase in operating income, respectively.
Excluding the effect of exchange rates ($4.5 million)
and acquisitions ($0.6 million), the $6.9 million
decrease was primarily attributable to a shift in prod-
uct mix in Latin America ($2.0 million), higher over-
all group expenses related to personnel changes ($1.7
million) and lower sales of flavors in the U.S. and
Europe ($6.1 million), partially offset by the postre-
tirement credit of $2.9 million. Operating income as a
percent of revenue was 14.1%, a decrease of 80 basis
points from last year. This change was primarily a
result of the reasons provided above.
Color For the year ended December 31, 2003,
revenue for the Color Group increased by $14.2
million, or 4.1%, to $360.7 million. Favorable for-
eign exchange rates and acquisitions resulted in a
4.7% and 3.0% increase in revenue, respectively.
Excluding exchange rates and acquisitions, revenue
decreased 3.6% or $12.4 million, primarily as a
result of lower sales of synthetic food and beverage
colors in North America and Europe ($9.8 million
and $7.2 million, respectively), partially offset by
increased sales in Latin America ($4.9 million).
Sales of synthetic food and
beverage colors declined
because of lower volumes
and prices attributable to
increased competition.
Customer demand for these
products was also lower due
to a reduction in new prod-
uct introductions by cus-
tomers and a soft economic
environment.
Gross margin was 36.6% in
2003, a 270 basis point decrease from Color’s 39.3%
gross margin in 2002. This change was a result of
more competitive pricing in synthetic colors and in
inkjet inks.
Operating income for 2003 was $71.6 million versus
$80.7 million for 2002. Excluding the favorable effect
of exchange rates ($3.8 million) and acquisitions
($2.2 million), the $15.1 million decrease in operat-
ing income was the result of lower sales of food and
beverage colors in North America and Europe ($8.4
million and $1.6 million, respectively) and lower
margins from the paper/industrial colors business
($5.5 million), partially offset by the postretirement
credit ($1.1 million). The lower margins in paper/
industrial were partly attributable to manufacturing
inefficiencies in consolidating operations. Operating
income as a percent of revenue was 19.8%, a decrease
of 350 basis points from the comparable period last
year. This change was primarily a result of the rea-
sons provided above.
Capital Expenditures/Depreciation
(IN MILLIONS)
00
01
02
03
04
$45.2$35.5
$38.0 $37.0
$47.3 $38.9
$74.2 $40.4
$49.8 $43.9

M A N A G E M E N T ’ S D I S C U S S I O N & A N A LY S I S of operations & financial condition
Sensient Technologies Corporat ion 2 0 0 4 A n n u a l R e p o r t22
Liquidity and Financial Posit ion
The Company’s financial position remains strong,
enabling it to meet cash requirements for operations,
capital expansion programs and dividend payments
to shareholders. The Company intends to fund
acquisitions (if any), working capital requirements,
principal and interest payments and other liabilities
with cash provided by operations, to the extent avail-
able, and short-term and long-term borrowings under
existing credit facilities.
In the Consolidated Statements
of Cash Flows, the changes in
operating assets and liabilities
are presented excluding the
effects of changes in foreign cur-
rency exchange rates, as these
do not reflect actual cash flows.
Accordingly, the amounts in
the Consolidated Statements of
Cash Flows do not agree with changes in the operat-
ing assets and liabilities that are presented in the
Consolidated Balance Sheets.
The Company’s ratio of debt to total capital improved
to 48.3% as of December 31, 2004 from 53.0% as
of December 31, 2003. The improvement resulted
primarily from a reduction in debt of $39.5 mil-
lion during 2004. The reduction of debt resulted
from record cash provided by operating activities,
which exceeded $125 million for the first time in the
Company’s history.
Cash provided by operating activities was $125.7 mil-
lion in 2004, $56.5 million in 2003 and $94.1 million
in 2002. Operating cash flow provided the primary
source of funds to finance operating needs, capital
expenditures, shareholder dividends and reduce net
borrowings. The increase in cash provided by operat-
ing activities in 2004 was primarily due to a $6.0 mil-
lion decrease in working capital during 2004 versus
a $70.1 million increase in working capital during
2003. Of the $76.1 million comparable improvement,
nearly half related to inventories, while the income
tax accounts also provided significant improvement.
The net income tax accounts decreased due to the
timing of payments and collection of income tax
refunds. The improvement in inventories resulted
from a significant increase during 2003 primarily
to accommodate the consolidation of three manu-
facturing facilities in the second half of 2003, versus
a modest decrease this year. Partially offsetting the
2004 decrease in inventories was a one-time purchase
of approximately $6.5 million of dehydrated flavor
inventory from a competitor that exited the market.
In 2003, the decrease in cash provided by operating
activities compared to 2002
was the result of increased
levels of inventories and other
working capital combined
with the $13.3 million postre-
tirement credit, which was a
non-cash transaction.
Cash used in investing activi-
ties was $44.8 million in 2004,
$85.2 million in 2003 and $88.2 million in 2002. Cash
proceeds from the sale of assets were $2.0 million in
2004, $8.2 million in 2003 and $8.9 million in 2002.
Cash used for acquisitions was $19.3 million in 2003
and $48.5 million in 2002. There were no acquisitions
in 2004. Acquisitions in 2003 include Formulabs
Iberica S.A., a Barcelona, Spain, manufacturer and
marketer of specialty inks, primarily for inkjet appli-
cations, and certain assets of Kyowa Koryo Kagaku
Kabushiki Kaisha, a former Japanese flavor producer.
Capital expenditures were $49.8 million in 2004,
$74.2 million in 2003 and $47.3 million in 2002. In
2004, capital expenditures included a St. Louis Color
Group headquarters and research facility, a research
facility in Australia, a vegetable cleaning facility in
China and several facility improvements in Europe.
The high level of capital expenditures in 2003 was
partly attributable to the integration of recently
acquired businesses, as well as initiatives to upgrade
certain of the Company’s Flavor and Color facili-
ties. Capital expenditures in 2005 are expected to be
approximately $50 million.
Cash used in financing activities was $83.5 million
in 2004 and $6.8 million in 2002, compared to cash
provided of $28.4 million in 2003. The Company
Debt to Total Capital(AT DECEMBER 31)
00
01
02
03
04
55.7%
53.3%
52.8%
53.0%
48.3%
23
had a net reduction in debt of $59.7 million in 2004,
versus net borrowings of $69.7 million in 2003 and
$25.5 million in 2002. On September 2, 2004, the
Company entered into a new $150 million credit
facility to replace the former facility scheduled to
mature in June 2005. At December 31, 2004, the
Company had direct borrowings under the revolving
loan agreement of $17.6 million. The Company also
had $49.8 million of outstanding commercial paper
obligations at December 31, 2004. The Company has
available credit facilities with domestic and foreign
banks for various purposes. The amount of unused
credit facilities at December 31, 2004 was $146.5
million. Additional information on the new facility
and the Company’s borrowings and available credit
is included in Note 4 to the Consolidated Financial
Statements. The Company maintains debt levels it
considers prudent based on its cash flows, interest
coverage and percentage of total debt to total capital.
The Company has paid uninterrupted quarterly cash
dividends since commencing public trading in its
stock in 1962. In 2004 and 2003, total dividends paid
per share were $0.60 and $0.59, respectively, and
total dividends paid were $28.1 million and $27.7
million, respectively. In 2003, $0.5 million was paid
to shareholders for a rights redemption that was
included in the Dividends Paid line of the Statement
of Cash Flows. See Note 6 to the Consolidated
Financial Statements for additional details.
The impact of inflation on both the Company’s
financial position and its results of operations has
been minimal and is not expected to adversely affect
2005 results.
Issuer Purchases of Equity Securit ies
The Company did not repurchase any shares of
Company stock during 2004. During 2003 and 2002,
the Company repurchased 0.9 million and 0.9 mil-
lion shares at a cost of $17.9 million and $18.9 mil-
lion, respectively. On April 27, 2001, the Company
approved a share repurchase program under which it
is authorized to repurchase up to 5.0 million shares
of Company stock. As of December 31, 2004, 4.3 mil-
lion shares were available under this authorization.
The Company’s share repurchase program has no
expiration date.
Crit ical Accounting Pol icies
In preparing the financial statements in accordance
with accounting principles generally accepted in
the U.S., management is required to make estimates
and assumptions that have an impact on the assets,
liabilities, revenue, and expense amounts reported.
These estimates can also affect supplemental infor-
mation disclosures of the Company, including
information about contingencies, risk, and financial
condition. The Company believes, given current facts
and circumstances, that its estimates and assump-
tions are reasonable, adhere to accounting principles
generally accepted in the U.S., and are consistently
applied. Inherent in the nature of an estimate or
assumption is the fact that actual results may dif-
fer from estimates and estimates may vary as new
facts and circumstances arise. The Company makes
routine estimates and judgments in determining the
net realizable value of accounts receivable, inven-
tories, property, plant and equipment, and prepaid
expenses. Management believes the Company’s most
critical accounting estimates and assumptions are in
the following areas:
Goodwill Valuation The Company reviews the carrying
value of goodwill annually utilizing several valu-
ation methodologies, including a discounted cash
flow model. Changes in estimates of future cash flows
caused by items such as unforeseen events or changes
in market conditions, could negatively affect the
reporting segment’s fair value and result in an impair-
ment charge. However, the current fair values of the
reporting segments are significantly in excess of car-
rying values. The Company estimates that a 100 basis
point increase in its weighted average cost of capital
would not result in impairment. Accordingly, manage-
ment believes that only significant changes in the cash
flow assumptions would result in impairment.

M A N A G E M E N T ’ S D I S C U S S I O N & A N A LY S I S of operations & financial condition
Sensient Technologies Corporat ion 2 0 0 4 A n n u a l R e p o r t24
Income Taxes The Company estimates its income
tax expense in each of the taxing jurisdictions in
which it operates. The Company is subject to a tax
audit in each of these jurisdictions, which could
result in changes to the estimated tax expense. The
amount of these changes would vary by jurisdiction
and would be recorded when known. These changes
could impact the Company’s financial statements.
Management has recorded valuation allowances to
reduce its deferred tax assets to the amount that is
more likely than not to be realized. In doing so, man-
agement has considered future taxable income and
ongoing tax planning strategies in assessing the need
for the valuation allowance. An adjustment to the
recorded valuation allowance as a result of changes
in facts or circumstances could result in a significant
change in the Company’s tax expense.
Commitments and Contingencies The Company is
subject to litigation and other legal proceedings
arising in the ordinary course of its businesses or
arising under provisions related to the protection
of the environment. Estimating liabilities and costs
associated with these matters requires the judgment
of management, which relies in part on information
from Company counsel. When it is probable that the
Company has incurred a liability associated with
claims or pending or threatened litigation matters
and the Company’s exposure is reasonably estimable,
the Company records a charge against earnings. The
estimate of any exposure to the Company may change
as further facts and circumstances become known.
Market Risk Factors
The Company is exposed to market risks, including
changes in interest rates, currency exchange rates
and commodity prices. To manage the volatility relat-
ing to these exposures on a consolidated basis, the
Company nets the exposures to take advantage of
natural offset. The Company also enters into various
derivative transactions for some of the remaining
exposures pursuant to the Company’s policies cover-
ing hedging practices. The financial impacts of these
hedging instruments are offset by corresponding
changes in the underlying exposures being hedged.
The Company does not hold or issue derivative
financial instruments for trading purposes. Note 1
and Note 5 to the Consolidated Financial Statements
include a discussion of the Company’s accounting
policies for financial instruments.
A key part of the Company’s strategy is to expand
into new geographic markets. Because the Company
manufactures and sells its products throughout the
world, it is exposed to movements in foreign cur-
rency exchange rates. The major foreign currency
exposures involve the markets in Western Europe,
Mexico and Canada. The primary purpose of the
Company’s foreign currency hedging activities is to
protect against the volatility associated with foreign
currency sales, purchases of materials and other
assets and liabilities created during the normal
course of business. The Company utilizes foreign
exchange contracts with durations of generally less
than 12 months that qualify as cash flow hedges
under SFAS No. 133, “Accounting for Derivative
Instruments and Hedging Activities,” as amended. At
December 31, 2004 and 2003, the fair values of these
instruments, based on dealer quotes, were liabilities
of $0.7 million and $0.5 million, respectively. At
December 31, 2004 and 2003, the potential gain or
loss in the fair value of the Company’s outstanding
foreign exchange contracts, assuming a hypothetical
10% fluctuation in the currencies of such contracts,
would be approximately $4.7 million and $2.8 mil-
lion, respectively. However, any change in the value
of the contracts, real or hypothetical, would be sig-
nificantly offset by an equivalent change in the value
of the underlying hedged items. In addition, this
hypothetical calculation assumes that each exchange
rate would change in the same direction relative to
the U.S. dollar.
The Company has certain long-term debt denomi-
nated in Swiss Francs, Euros and British Pounds.
These non-derivative debt instruments have been
designated as partial hedges of the Company’s Swiss
Franc, Euro and British Pound net asset positions.
The potential increase or decrease in the annual U.S.
dollar interest expense of the Company’s outstand-
ing foreign currency-denominated debt, assuming
25
at December 31, 2004 and 2003, assuming a hypo-
thetical 10% fluctuation in interest rates of such con-
tracts, would be approximately $2.9 million and $2.3
million, respectively. At December 31, 2004 and 2003,
the potential increase or decrease in annual interest
expense, assuming a hypothetical 10% fluctuation
in interest rates of floating rate debt, including the
impact of swap contracts, would be approximately
$0.7 million and $0.4 million, respectively.
The Company is the purchaser of certain commodi-
ties such as corn, sugar, soybean meal and fruits.
The Company generally purchases these commodi-
ties based upon market prices that are established
with the vendor as part of the purchase process. In
general, the Company does not use commodity finan-
cial instruments to hedge commodity prices due to a
high correlation between the commodity cost and the
ultimate selling price of the Company’s products. On
occasion, the Company may enter into non-cancelable
forward purchase contracts, as deemed appropriate,
to reduce the effect of price fluctuations on future
manufacturing requirements.
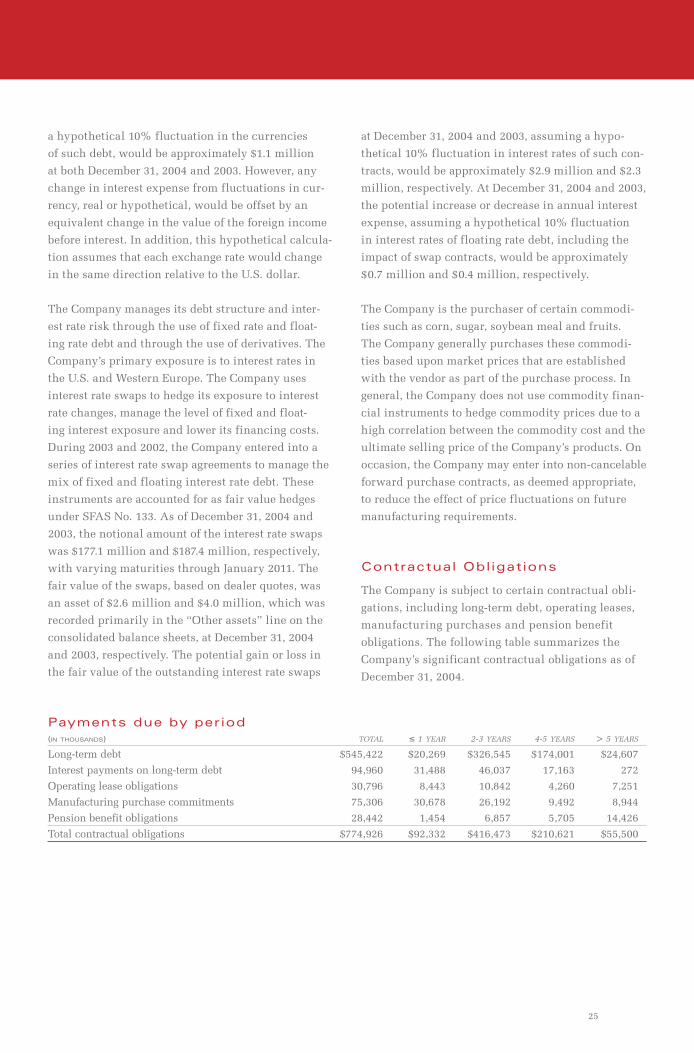
Contractual Obligations
The Company is subject to certain contractual obli-
gations, including long-term debt, operating leases,
manufacturing purchases and pension benefit
obligations. The following table summarizes the
Company’s significant contractual obligations as of
December 31, 2004.
a hypothetical 10% fluctuation in the currencies
of such debt, would be approximately $1.1 million
at both December 31, 2004 and 2003. However, any
change in interest expense from fluctuations in cur-
rency, real or hypothetical, would be offset by an
equivalent change in the value of the foreign income
before interest. In addition, this hypothetical calcula-
tion assumes that each exchange rate would change
in the same direction relative to the U.S. dollar.
The Company manages its debt structure and inter-
est rate risk through the use of fixed rate and float-
ing rate debt and through the use of derivatives. The
Company’s primary exposure is to interest rates in
the U.S. and Western Europe. The Company uses
interest rate swaps to hedge its exposure to interest
rate changes, manage the level of fixed and float-
ing interest exposure and lower its financing costs.
During 2003 and 2002, the Company entered into a
series of interest rate swap agreements to manage the
mix of fixed and floating interest rate debt. These
instruments are accounted for as fair value hedges
under SFAS No. 133. As of December 31, 2004 and
2003, the notional amount of the interest rate swaps
was $177.1 million and $187.4 million, respectively,
with varying maturities through January 2011. The
fair value of the swaps, based on dealer quotes, was
an asset of $2.6 million and $4.0 million, which was
recorded primarily in the “Other assets” line on the
consolidated balance sheets, at December 31, 2004
and 2003, respectively. The potential gain or loss in
the fair value of the outstanding interest rate swaps
Payments due by period (IN THOUSANDS) TOTAL ≤ 1 YEAR 2-3 YEARS 4-5 YEARS > 5 YEARS
Long-term debt $545,422 $20,269 $326,545 $174,001 $24,607
Interest payments on long-term debt 94,960 31,488 46,037 17,163 272
Operating lease obligations 30,796 8,443 10,842 4,260 7,251
Manufacturing purchase commitments 75,306 30,678 26,192 9,492 8,944
Pension benefit obligations 28,442 1,454 6,857 5,705 14,426
Total contractual obligations $774,926 $92,332 $416,473 $210,621 $55,500

Sensient Technologies Corporat ion 2 0 0 4 A n n u a l R e p o r t26
New Pronouncements
On January 1, 2004, the Company adopted the
remaining provisions of the Financial Accounting
Standards Board (“FASB”) Interpretation No. 46
(“46R”), “Consolidation of Variable Interest Entities,”
to clarify certain provisions of FIN No. 46, and
to exempt certain entities from its requirements.
The impact of adopting this interpretation was
not significant on the Company’s consolidated
financial statements.
In December 2004, the FASB issued Statement No.
123 (revised 2004), “Stock Based Compensation.” The
statement would require the Company to expense its
stock options during the vesting period based on the
fair value at the date of grant. This statement is effec-
tive for the Company on July 1, 2005. The Company
will adopt the statement using the modified prospec-
tive method. The impact of adoption of the revised
statement in 2005 is anticipated to reduce earnings
by approximately $0.02 per share.
Off-Balance Sheet Arrangements
The Company had no off-balance sheet arrangements
as of December 31, 2004.
Forward-looking Statements
This document contains forward-looking statements
that reflect management’s current assumptions and
estimates of future economic circumstances, indus-
try conditions, Company performance and financial
results. Forward-looking statements include state-
ments in the future tense and statements including
the terms “expect,” “believe,” “anticipate,” and other
similar terms that express expectations as to future
events or conditions. The Private Securities Litigation
Reform Act of 1995 provides a safe harbor for such
forward-looking statements. Such forward-looking
statements are not guarantees of future performance
and involve known and unknown risks, uncertain-
ties and other factors that could cause actual events
to differ materially from those expressed in those
statements. A variety of factors could cause the
Company’s actual results and experience to differ
materially from the anticipated results. These factors
and assumptions include the pace and nature of new
product introductions by the Company’s customers;
results of acquired businesses; the Company’s abil-
ity to successfully implement its growth strategies;
the outcome of the Company’s various productiv-
ity-improvement and cost-reduction efforts; changes
in costs of raw materials, including energy; indus-
try and economic factors related to the Company’s
domestic and international business; competition
from other suppliers of color and flavors and fra-
grances; growth or contraction in markets for prod-
ucts in which the Company competes; terminations
and other changes in customer relationships; indus-
try acceptance of price increases; currency exchange
rate fluctuations; and the matters discussed above
including the critical accounting policies described
therein. The Company does not undertake to publicly
update or revise its forward-looking statements even
if experience or future changes make it clear that any
projected results expressed or implied therein will
not be realized.
M A N A G E M E N T ’ S D I S C U S S I O N & A N A LY S I S of operations & financial condition

27
C O N S O L I D A T E D S T A T E M E N T S of earnings
in thousands except per share amounts Years ended December 31, 2004 2003 2002
Revenue $1,047,133 $987,209 $939,886
Cost of products sold 734,596 677,414 633,011
Selling and administrative expenses 183,381 165,835 160,380
Special charges (see Note 12) — 6,476 —
Operating Income 129,156 137,484 146,495
Interest expense 31,265 29,140 29,523
Earnings Before Income Taxes 97,891 108,344 116,972
Income taxes 23,973 26,912 36,282
Net Earnings $ 73,918 $ 81,432 $ 80,690
Earnings per share
Basic $ 1.59 $ 1.74 $ 1.70
Diluted $ 1.58 $ 1.73 $ 1.69
Average common shares outstanding – basic 46,562 46,741 47,379
Average common shares outstanding – diluted 46,877 47,041 47,788
See notes to consolidated financial statements.

Sensient Technologies Corporat ion 2 0 0 4 A n n u a l R e p o r t28
in thousands except share and per share amounts December 31, 2004 2003
Assets
Current Assets:
Cash and cash equivalents $ 2,243 $ 3,250
Trade accounts receivable, less allowance for losses of $6,629
and $4,843, respectively 172,912 168,073
Inventories 328,191 318,755
Prepaid expenses and other current assets 24,886 27,719
Deferred income taxes 8,012 18,933
Total current assets 536,244 536,730
Other assets 66,352 78,525
Intangible assets – at cost, less accumulated amortization of $4,794
and $3,484, respectively 17,904 17,553
Goodwill 452,427 428,922
Property, Plant and Equipment:
Land 33,203 29,042
Buildings 230,488 197,959
Machinery and equipment 530,922 479,799
Construction in progress 40,446 58,796
835,059 765,596
Less accumulated depreciation (419,408) (373,798)
415,651 391,798
Total assets $1,488,578 $1,453,528
Liabilities and Shareholders’ Equity
Current Liabilities:
Trade accounts payable $ 75,066 $ 67,535
Accrued salaries, wages and withholdings from employees 13,591 12,871
Other accrued expenses 58,133 61,464
Income taxes 18,392 11,817
Short-term borrowings 69,774 114,974
Current maturities of long-term debt 20,269 13,759
Total current liabilities 255,225 282,420
Deferred income taxes 10,470 23,529
Other liabilities 4,461 11,329
Accrued employee and retiree benefits 34,571 30,208
Long-term debt 525,153 525,924
Commitments and contingencies — —
Shareholders’ Equity:
Common stock, par value $.10 a share, authorized 100,000,000 shares;
issued 53,954,874 shares 5,396 5,396
Additional paid-in capital 72,117 72,194
Earnings reinvested in the business 720,625 674,803
Treasury stock, 6,887,161 and 7,230,781 shares, respectively, at cost (140,507) (147,472)
Unearned portion of restricted stock (5,500) (3,844)
Accumulated other comprehensive income (loss) 6,567 (20,959)
658,698 580,118
Total liabilities and shareholders’ equity $1,488,578 $1,453,528
See notes to consolidated financial statements.
C O N S O L I D A T E D balance sheets
29
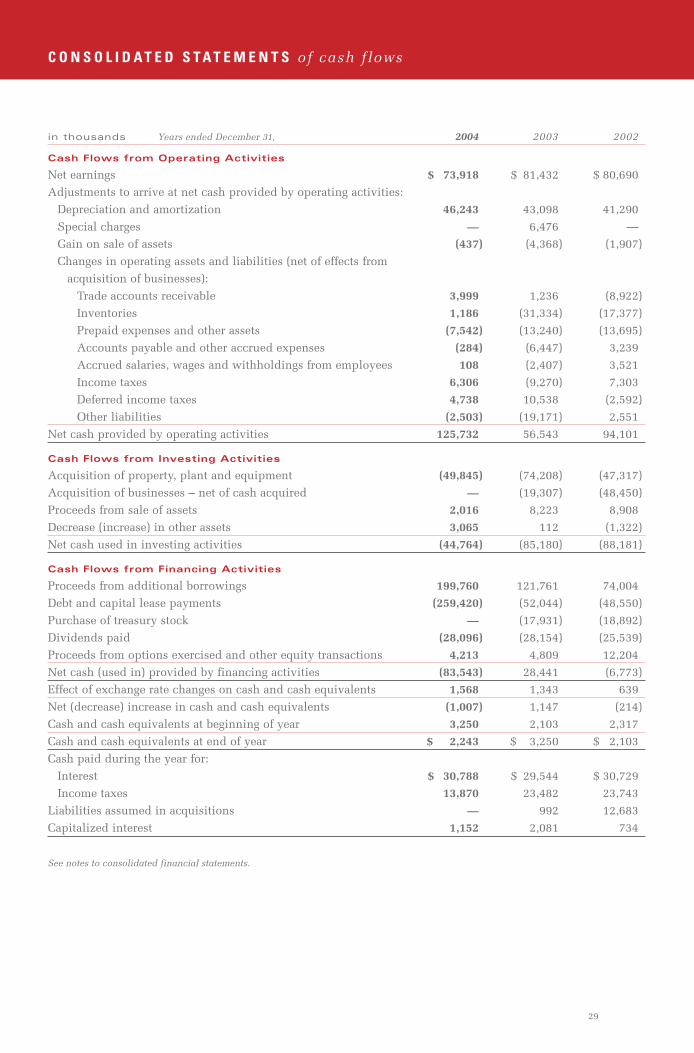
C O N S O L I D A T E D S T A T E M E N T S of cash flows
in thousands Years ended December 31, 2004 2003 2002
Cash Flows from Operating Activities
Net earnings $ 73,918 $ 81,432 $ 80,690
Adjustments to arrive at net cash provided by operating activities:
Depreciation and amortization 46,243 43,098 41,290
Special charges — 6,476 —
Gain on sale of assets (437) (4,368) (1,907)
Changes in operating assets and liabilities (net of effects from
acquisition of businesses):
Trade accounts receivable 3,999 1,236 (8,922)
Inventories 1,186 (31,334) (17,377)
Prepaid expenses and other assets (7,542) (13,240) (13,695)
Accounts payable and other accrued expenses (284) (6,447) 3,239
Accrued salaries, wages and withholdings from employees 108 (2,407) 3,521
Income taxes 6,306 (9,270) 7,303
Deferred income taxes 4,738 10,538 (2,592)
Other liabilities (2,503) (19,171) 2,551
Net cash provided by operating activities 125,732 56,543 94,101
Cash Flows from Investing Activities
Acquisition of property, plant and equipment (49,845) (74,208) (47,317)
Acquisition of businesses – net of cash acquired — (19,307) (48,450)
Proceeds from sale of assets 2,016 8,223 8,908
Decrease (increase) in other assets 3,065 112 (1,322)
Net cash used in investing activities (44,764) (85,180) (88,181)
Cash Flows from Financing Activities
Proceeds from additional borrowings 199,760 121,761 74,004
Debt and capital lease payments (259,420) (52,044) (48,550)
Purchase of treasury stock — (17,931) (18,892)
Dividends paid (28,096) (28,154) (25,539)
Proceeds from options exercised and other equity transactions 4,213 4,809 12,204
Net cash (used in) provided by financing activities (83,543) 28,441 (6,773)
Effect of exchange rate changes on cash and cash equivalents 1,568 1,343 639
Net (decrease) increase in cash and cash equivalents (1,007) 1,147 (214)
Cash and cash equivalents at beginning of year 3,250 2,103 2,317
Cash and cash equivalents at end of year $ 2,243 $ 3,250 $ 2,103
Cash paid during the year for:
Interest $ 30,788 $ 29,544 $ 30,729
Income taxes 13,870 23,482 23,743
Liabilities assumed in acquisitions — 992 12,683
Capitalized interest 1,152 2,081 734
See notes to consolidated financial statements.

Sensient Technologies Corporat ion 2 0 0 4 A n n u a l R e p o r t30
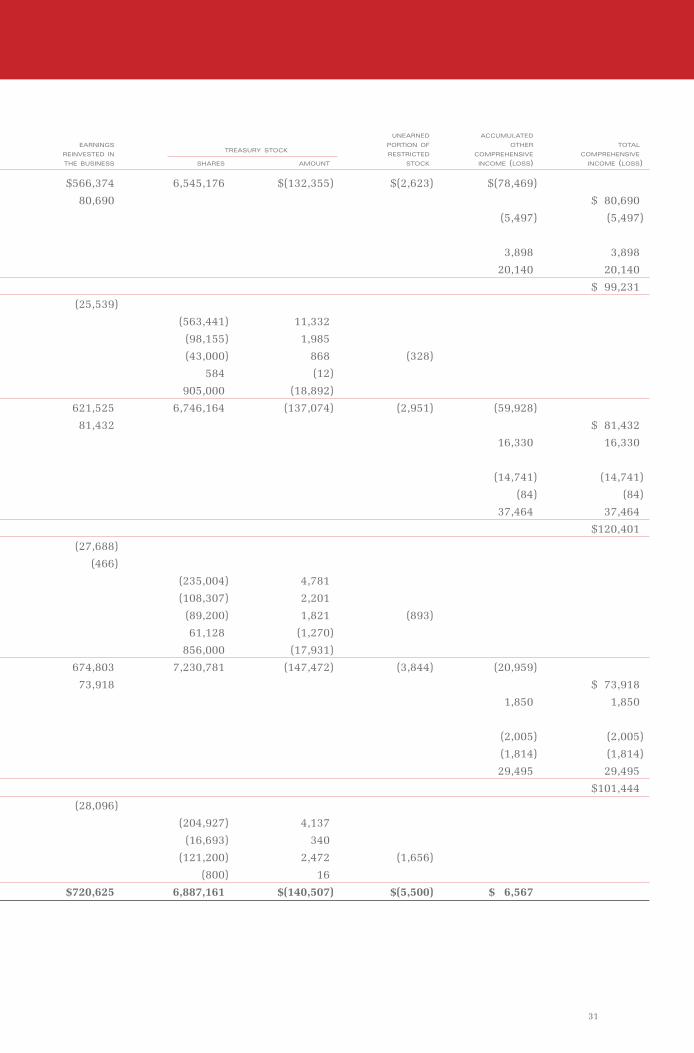
C O N S O L I D A T E D S T A T E M E N T S of shareholders’ equity
ADDITIONAL COMMON PAID-IN in thousands except share and per share amounts STOCK CAPITAL
Balances at December 31, 2001 $5,396 $72,493
Net earnings
Unrealized loss on cash flow hedges, arising during the period, net of tax of $522
Reclassification adjustment for cash flow hedges included in net income,
net of tax of $370
Foreign currency translation
Total comprehensive income
Cash dividends paid – $.5375 a share
Stock options exercised (342)
Benefit plans 54
Restricted stock 185
Other
Purchase of treasury stock
Balances at December 31, 2002 5,396 72,390
Net earnings
Unrealized gain on cash flow hedges, arising during the period, net of tax of $1,809
Reclassification adjustment for cash flow hedges included in net income,
net of tax of $1,633
Minimum pension liability, net of tax of $52
Foreign currency translation
Total comprehensive income
Cash dividends paid – $.59 a share
Redemption of rights – $.01 a share
Stock options exercised (285)
Benefit plans 216
Restricted stock (127)
Other
Purchase of treasury stock
Balances at December 31, 2003 5,396 72,194
Net earnings
Unrealized gain on cash flow hedges, arising during the period, net of tax of $205
Reclassification adjustment for cash flow hedges included in net income,
net of tax of $223
Minimum pension liability, net of tax of $418
Foreign currency translation
Total comprehensive income
Cash dividends paid – $.60 a share
Stock options exercised (378)
Benefit plans (2)
Restricted stock 302
Other 1
Balances at December 31, 2004 $5,396 $72,117
See notes to consolidated financial statements.
31
UNEARNED ACCUMULATED EARNINGS PORTION OF OTHER TOTAL
REINVESTED IN TREASURY STOCKMMMMMMMM RESTRICTED COMPREHENSIVE COMPREHENSIVE
THE BUSINESS SHARES AMOUNT STOCK INCOME (LOSS) INCOME (LOSS)
$566,374 6,545,176 $(132,355) $(2,623) $(78,469)
80,690 $ 80,690
(5,497) (5,497)
3,898 3,898
20,140 20,140
$ 99,231
(25,539)
(563,441) 11,332
(98,155) 1,985
(43,000) 868 (328)
584 (12)
905,000 (18,892)
621,525 6,746,164 (137,074) (2,951) (59,928)
81,432 $ 81,432
16,330 16,330
(14,741) (14,741)
(84) (84)
37,464 37,464
$120,401
(27,688)
(466)
(235,004) 4,781
(108,307) 2,201
(89,200) 1,821 (893)
61,128 (1,270)
856,000 (17,931)
674,803 7,230,781 (147,472) (3,844) (20,959)
73,918 $ 73,918
1,850 1,850
(2,005) (2,005)
(1,814) (1,814)
29,495 29,495
$101,444
(28,096)
(204,927) 4,137
(16,693) 340
(121,200) 2,472 (1,656)
(800) 16
$720,625 6,887,161 $(140,507) $(5,500) $ 6,567
32 Sensient Technologies Corporat ion 2 0 0 4 A n n u a l R e p o r t
N O T E S to consolidated financial statements
amounts in thousands except share, employee and per share data Years ended December 31, 2004, 2003 and 2002
N O T E S to consolidated financial statements
1) Summary of Significant Accounting Policies
Principles of Consolidation The consolidated finan-cial statements include the accounts of Sensient Technologies Corporation and its subsidiaries (the “Company”). All significant intercompany accounts and transactions are eliminated.
Use of Estimates The preparation of the consolidated financial statements in conformity with accounting principles generally accepted in the United States of America requires management to make estimates and assumptions that affect reported amounts of assets and liabilities and the disclosure of contingent assets and liabilities at the date of the financial statements and the reported amounts of revenue and expenses during the reporting periods. Actual results could differ from those estimates.
Revenue Recognition The Company recognizes revenue, net of estimated discounts, allowances and returns, upon shipment of goods to customers, at which time title passes, the customer is obligated to pay the Company, and the Company has no remaining obligations.
Cost of Products Sold Cost of products sold includes materials, labor and overhead expenses incurred in the manufacture of our products. Cost of products sold also includes charges for obsolete and slow mov-ing inventories, as well as costs for quality control, purchasing and receiving costs, inspection costs, warehousing costs, internal transfer costs, other costs of our internal distribution network and costs incurred for shipping and handling. The Company records fees billed to customers for shipping and handling as revenue.
Selling and Administrative Expenses Selling and admin-istrative expenses primarily include the salaries and related costs for executive, finance, accounting, human resources, research and development and legal person-nel as well as salaries and related costs of salesper-sons, and commissions paid to external sales agents.
Cash Equivalents The Company considers all highly liquid investments with maturities of three months or less at the date of acquisition as cash equivalents.
Inventories Inventories are stated at the lower of cost or market. Cost is determined using the first-in, first-
out (“FIFO”) method. Inventories include finished and in-process products totaling $242.8 million and $227.2 million at December 31, 2004 and 2003, respectively, and raw materials and supplies of $85.4 million and $91.6 million at December 31, 2004 and 2003, respectively.
Property, Plant and Equipment Property, plant and equip-ment are recorded at cost reduced by accumulated depreciation. Depreciation is provided over the esti-mated useful life using the straight-line method for financial reporting. The estimated useful lives for buildings ranges from 5 to 35 years. The buildings cat-egory consists of building improvements, which have useful lives ranging from 5 to 35 years, and buildings, which have useful lives ranging from 10 to 35 years. Machinery and equipment have useful lives ranging from 3 to 20 years.
Goodwill and Other Intangible Assets On January 1, 2002, the Company adopted Statement of Financial Accounting Standards (“SFAS”) No. 142, “Goodwill and Other Intangible Assets,” and accordingly amor-tization of goodwill and other intangible assets with indefinite useful lives is no longer recorded. Instead, the carrying value of goodwill is evaluated for impair-ment on an annual basis. The impairment assessment includes comparing the carrying amount of net assets, including goodwill, of each reporting unit to their respective fair value as of the date of the assessment. Fair value was estimated based upon an evaluation of future discounted cash flow as well as the public trading and private transaction valuation multiples for comparable companies. Such determination of fair value yielded no impairment.
The cost of intangible assets with determinable useful lives is amortized on a straight-line basis to reflect the pattern of economic benefits consumed, ranging from 5 to 20 years. These assets include technological know-how, customer relationships, patents, trade-marks and non-compete agreements among others.
Impairment of Long-lived Assets The Company reviews long-lived assets for impairment whenever events or changes in business circumstances indicate that the carrying amount of the assets may not be fully recover-able. The Company performs undiscounted cash flow analyses to determine if an impairment exists. If an impairment is determined to exist, any related impair-ment loss is calculated based on discounted future cash flows.

33
Financial Instruments The Company uses derivative financial instruments for the purpose of hedging cur-rency and interest rate exposures which exist as part of ongoing business operations. As a policy, the Company does not engage in speculative or leveraged transac-tions, nor does the Company hold or issue financial instruments for trading purposes.
Hedge effectiveness is determined by how closely the changes in the fair value of the hedging instrument offset the changes in the fair value or cash flows of the hedged item. Hedge accounting is permitted only if the hedging relationship is expected to be highly effective at the inception of the transaction and on an on-going basis. Any ineffective portions are to be recognized in earnings immediately.
Interest Rate Hedging The Company is exposed to inter-est rate risk through its corporate borrowing activi-ties. The objective of the Company’s interest rate risk management activities is to manage the levels of the Company’s fixed and floating interest rate exposure to be consistent with the Company’s preferred mix. The interest rate risk management program consists of entering into interest rate swaps, which qualify as fair value hedges, when there is a desire to modify the Company’s exposure to interest rates. Gains or losses on fair value hedges are recognized in earn-ings, net of gains and losses on the fair value of the hedged instruments.
The Company’s existing fair value hedges are 100% effective. As a result, there is no current impact on earnings due to fair value hedge ineffectiveness.
Currency Rate Hedging The primary objectives of the foreign exchange risk management activities are to understand and mitigate the impact of potential for-eign exchange fluctuations on the Company’s finan-cial results and its economic well-being. Generally, these risk management transactions involve the use of foreign currency derivatives to protect against expo-sure resulting from recorded accounts receivable and payable. The Company primarily utilizes forward exchange contracts with maturities of less than 12 months, which qualify as cash flow hedges. These foreign exchange contracts are intended to offset the effect of exchange rate fluctuations on recorded inter-company receivables and payables. Gains and losses
on these instruments are deferred in accumulated other comprehensive income (loss) (“OCI”) until the underlying transaction is recognized in earnings.
The Company’s existing cash flow hedges are 100% effective. As a result, there is no current impact on earnings due to cash flow hedge ineffectiveness.
Net Investments Hedging The Company may enter into foreign-denominated debt to be used as a non-deriva-tive instrument to hedge the Company’s net invest-ment in foreign subsidiaries. The change in the car-rying amount of the foreign-denominated debt on the Company’s books, attributable to changes in the spot foreign exchange rate, is a hedge of the net investment in its foreign subsidiaries.
Commodity Purchases The Company purchases certain commodities in the normal course of business which result in physical delivery of the goods and hence, are excluded from SFAS No. 133, as amended.
Translation of Foreign Currencies For all significant foreign operations, the functional currency is the local cur-rency. Assets and liabilities of foreign operations are translated into U. S. dollars at current exchange rates. Revenue and expense accounts are translated into U.S. dollars at average exchange rates prevailing during the year. Adjustments resulting from the translation of assets and liabilities to U.S. dollars are included in OCI as foreign currency translation adjustments. Transaction gains and losses are included in earnings and were not significant during the three-year period ended December 31, 2004.
Stock-Based Compensation The Company accounts for its stock-based compensation plans using the intrinsic value-based method in accordance with Accounting Principles Board Opinion No. 25, “Accounting for Stock Issued to Employees.” Stock options are granted at prices equal to the fair market value of the Company’s common stock on the grant dates. Accordingly, the Company did not record any compensation expense with respect to the grant of stock options during the three-year period ended December 31, 2004. If the Company had elected to recognize compensation cost based on the fair value of the options granted at grant date as prescribed by SFAS No. 123, net earnings and earnings per share

34 Sensient Technologies Corporat ion 2 0 0 4 A n n u a l R e p o r t
N O T E S to consolidated financial statements
would have been reduced to the proforma amounts indicated below:
(in thousands, except per share data) 2004 2003 2002
Net earnings:
As reported $73,918 $81,432 $80,690
Add: reported stock
compensation expense –
net of tax 693 493 449
Less: fair value stock
compensation expense –
net of tax (2,371) (2,442) (2,038)
Pro forma net earnings $72,240 $79,483 $79,101
Earnings per common share:
Basic as reported $ 1.59 $ 1.74 $ 1.70
Less: net impact of
fair value stock
expense – net of tax (.04) (.04) (.03)
Basic pro forma $ 1.55 $ 1.70 $ 1.67
Diluted as reported 1.58 $ 1.73 $ 1.69
Less: net impact of
fair value stock
expense – net of tax (.04) (.04) (.03)
Diluted pro forma $ 1.54 $ 1.69 $ 1.66
The weighted-average fair value per share of options granted was $4.81 in 2004, $4.68 in 2003 and $5.23 in 2002.
The fair value of each option granted was estimated on the date of grant using the Black-Scholes option-pricing model with the following weighted average assumptions:
2004 2003 2002
Dividend yield 2.8% 2.9% 2.4%
Volatility 27.3% 29.0% 28.8%
Risk-free interest rate 3.2% 3.1% 2.9%
Expected term (years) 5.4 5.5 5.4
Earnings Per Share The difference between basic and diluted earnings per share (“EPS”) is the dilutive effect of stock options and restricted stock. Diluted earnings per share assume that restricted stock has vested and all dilutive stock options, for which the average mar-ket price exceeds the exercise price (in-the-money), are exercised. Stock options for which the exercise price exceeds the average market price (out-of-the-money options) have an anti-dilutive effect on EPS, and accordingly, are excluded from the calculation. For the years ended December 31, 2004, 2003 and 2002,
options for 1.2 million, 1.2 million and 0.5 million shares were excluded from the diluted EPS calculation because they were anti-dilutive. All earnings per share amounts are presented on a diluted basis unless other-wise noted.
Accumulated Other Comprehensive Income (Loss) OCI is comprised primarily of foreign currency translation, minimum pension liability and unrealized losses on cash flow hedges. The components of OCI at December 31 were:
(in thousands) 2004 2003
Foreign currency translation $ 9,057 $(20,438)
Minimum pension liability (net of tax) (1,898) (84)
Unrealized losses on cash
flow hedges (net of tax) (592) (437)
Accumulated other
comprehensive income (loss) $ 6,567 $(20,959)
Research and Development Research and develop-ment costs are recorded in selling and administrative expenses in the year they are incurred. Research and development costs were $24.3 million, $22.9 million and $21.2 million during the years ended December 31, 2004, 2003 and 2002, respectively.
Advertising Advertising costs are recorded in selling and administrative expenses as they are incurred. Advertising costs were $1.6 million, $1.7 million and $1.2 million during the years ended December 31, 2004, 2003 and 2002, respectively.
New Pronouncements On January 1, 2004, the Company adopted the remaining provisions of the Financial Accounting Standards Board (“FASB”) Interpretation No. 46 (“46R”), “Consolidation of Variable Interest Entities,” to clarify certain provisions of FIN No. 46, and to exempt certain entities from its requirements. The impact of adopting this interpretation was not significant on the Company’s consolidated financial statements.
In December 2004, the FASB issued Statement No. 123 (revised 2004), “Stock Based Compensation.” The state-ment will require the Company to expense its stock options during the vesting period based on the fair value at the date of grant. This statement is effective for the Company on July 1, 2005. The Company will adopt the statement using the modified prospective method. The impact of adoption of the revised statement in 2005 is anticipated to reduce earnings by approxi-mately $0.02 per share, or 50% of the 2004 amounts disclosed in the stock based compensation table above.
Years ended December 31, 2004, 2003 and 2002
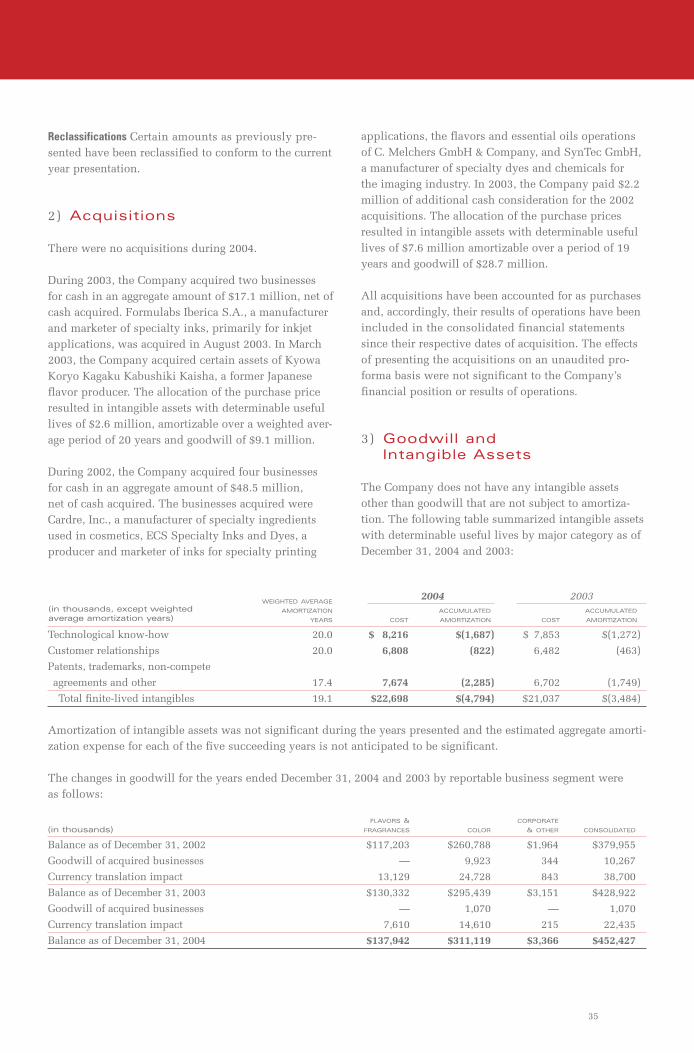
35
Reclassifications Certain amounts as previously pre-sented have been reclassified to conform to the current year presentation.
2) Acquisitions
There were no acquisitions during 2004.
During 2003, the Company acquired two businesses for cash in an aggregate amount of $17.1 million, net of cash acquired. Formulabs Iberica S.A., a manufacturer and marketer of specialty inks, primarily for inkjet applications, was acquired in August 2003. In March 2003, the Company acquired certain assets of Kyowa Koryo Kagaku Kabushiki Kaisha, a former Japanese flavor producer. The allocation of the purchase price resulted in intangible assets with determinable useful lives of $2.6 million, amortizable over a weighted aver-age period of 20 years and goodwill of $9.1 million.
During 2002, the Company acquired four businesses for cash in an aggregate amount of $48.5 million, net of cash acquired. The businesses acquired were Cardre, Inc., a manufacturer of specialty ingredients used in cosmetics, ECS Specialty Inks and Dyes, a producer and marketer of inks for specialty printing
applications, the flavors and essential oils operations of C. Melchers GmbH & Company, and SynTec GmbH, a manufacturer of specialty dyes and chemicals for the imaging industry. In 2003, the Company paid $2.2 million of additional cash consideration for the 2002 acquisitions. The allocation of the purchase prices resulted in intangible assets with determinable useful lives of $7.6 million amortizable over a period of 19 years and goodwill of $28.7 million.
All acquisitions have been accounted for as purchases and, accordingly, their results of operations have been included in the consolidated financial statements since their respective dates of acquisition. The effects of presenting the acquisitions on an unaudited pro-forma basis were not significant to the Company’s financial position or results of operations.
3) Goodwill and Intangible Assets
The Company does not have any intangible assets other than goodwill that are not subject to amortiza-tion. The following table summarized intangible assets with determinable useful lives by major category as of December 31, 2004 and 2003:
WEIGHTED AVERAGE 2004 2003 AMORTIZATION ACCUMULATED ACCUMULATED
YEARS COST AMORTIZATION COST AMORTIZATION
Technological know-how 20.0 $ 8,216 $(1,687) $ 7,853 $(1,272)
Customer relationships 20.0 6,808 (822) 6,482 (463)
Patents, trademarks, non-compete
agreements and other 17.4 7,674 (2,285) 6,702 (1,749)
Total finite-lived intangibles 19.1 $22,698 $(4,794) $21,037 $(3,484)
Amortization of intangible assets was not significant during the years presented and the estimated aggregate amorti-zation expense for each of the five succeeding years is not anticipated to be significant.
The changes in goodwill for the years ended December 31, 2004 and 2003 by reportable business segment were as follows:
(in thousands) FLAVORS & CORPORATE
FRAGRANCES COLOR & OTHER CONSOLIDATED
Balance as of December 31, 2002 $117,203 $260,788 $1,964 $379,955
Goodwill of acquired businesses — 9,923 344 10,267
Currency translation impact 13,129 24,728 843 38,700
Balance as of December 31, 2003 $130,332 $295,439 $3,151 $428,922
Goodwill of acquired businesses — 1,070 — 1,070
Currency translation impact 7,610 14,610 215 22,435
Balance as of December 31, 2004 $137,942 $311,119 $3,366 $452,427
(in thousands, except weightedaverage amortization years)
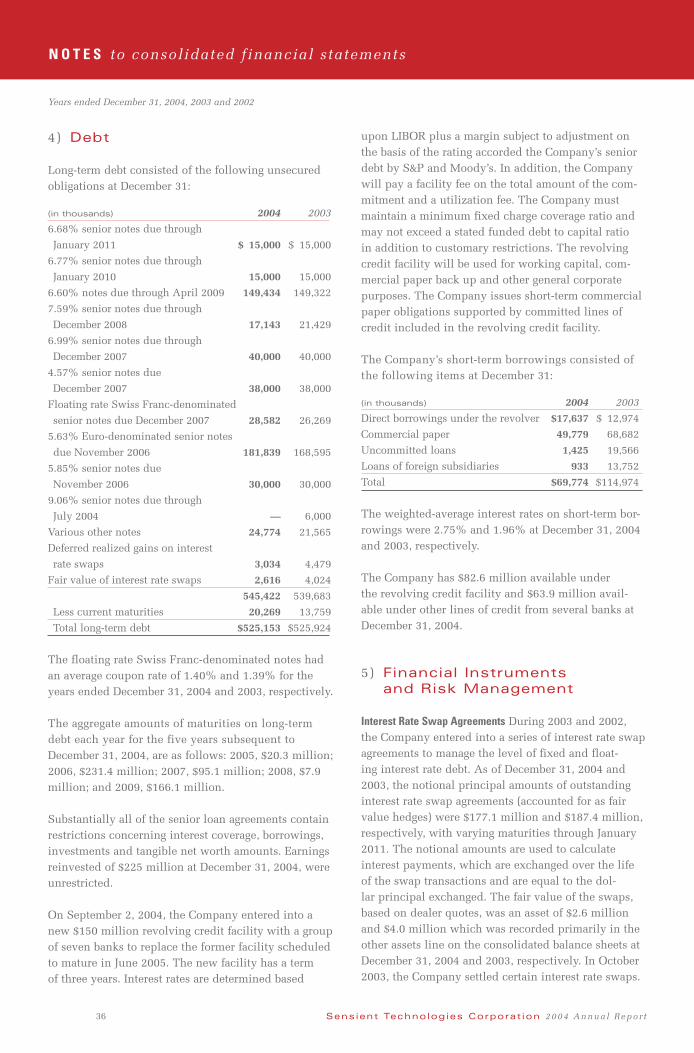
36 Sensient Technologies Corporat ion 2 0 0 4 A n n u a l R e p o r t
N O T E S to consolidated financial statements
4) Debt
Long-term debt consisted of the following unsecured obligations at December 31:
(in thousands) 2004 2003
6.68% senior notes due through
January 2011 $ 15,000 $ 15,000
6.77% senior notes due through
January 2010 15,000 15,000
6.60% notes due through April 2009 149,434 149,322
7.59% senior notes due through
December 2008 17,143 21,429
6.99% senior notes due through
December 2007 40,000 40,000
4.57% senior notes due
December 2007 38,000 38,000
Floating rate Swiss Franc-denominated
senior notes due December 2007 28,582 26,269
5.63% Euro-denominated senior notes
due November 2006 181,839 168,595
5.85% senior notes due
November 2006 30,000 30,000
9.06% senior notes due through
July 2004 — 6,000
Various other notes 24,774 21,565
Deferred realized gains on interest
rate swaps 3,034 4,479
Fair value of interest rate swaps 2,616 4,024
545,422 539,683
Less current maturities 20,269 13,759
Total long-term debt $525,153 $525,924
The floating rate Swiss Franc-denominated notes had an average coupon rate of 1.40% and 1.39% for the years ended December 31, 2004 and 2003, respectively.
The aggregate amounts of maturities on long-term debt each year for the five years subsequent to December 31, 2004, are as follows: 2005, $20.3 million; 2006, $231.4 million; 2007, $95.1 million; 2008, $7.9 million; and 2009, $166.1 million.
Substantially all of the senior loan agreements contain restrictions concerning interest coverage, borrowings, investments and tangible net worth amounts. Earnings reinvested of $225 million at December 31, 2004, were unrestricted.
On September 2, 2004, the Company entered into a new $150 million revolving credit facility with a group of seven banks to replace the former facility scheduled to mature in June 2005. The new facility has a term of three years. Interest rates are determined based
upon LIBOR plus a margin subject to adjustment on the basis of the rating accorded the Company’s senior debt by S&P and Moody’s. In addition, the Company will pay a facility fee on the total amount of the com-mitment and a utilization fee. The Company must maintain a minimum fixed charge coverage ratio and may not exceed a stated funded debt to capital ratio in addition to customary restrictions. The revolving credit facility will be used for working capital, com-mercial paper back up and other general corporate purposes. The Company issues short-term commercial paper obligations supported by committed lines of credit included in the revolving credit facility.
The Company’s short-term borrowings consisted of the following items at December 31:
(in thousands) 2004 2003
Direct borrowings under the revolver $17,637 $ 12,974
Commercial paper 49,779 68,682
Uncommitted loans 1,425 19,566
Loans of foreign subsidiaries 933 13,752
Total $69,774 $114,974
The weighted-average interest rates on short-term bor-rowings were 2.75% and 1.96% at December 31, 2004 and 2003, respectively.
The Company has $82.6 million available under the revolving credit facility and $63.9 million avail-able under other lines of credit from several banks at December 31, 2004.
5) Financial Instruments and Risk Management
Interest Rate Swap Agreements During 2003 and 2002, the Company entered into a series of interest rate swap agreements to manage the level of fixed and float-ing interest rate debt. As of December 31, 2004 and 2003, the notional principal amounts of outstanding interest rate swap agreements (accounted for as fair value hedges) were $177.1 million and $187.4 million, respectively, with varying maturities through January 2011. The notional amounts are used to calculate interest payments, which are exchanged over the life of the swap transactions and are equal to the dol-lar principal exchanged. The fair value of the swaps, based on dealer quotes, was an asset of $2.6 million and $4.0 million which was recorded primarily in the other assets line on the consolidated balance sheets at December 31, 2004 and 2003, respectively. In October 2003, the Company settled certain interest rate swaps.
Years ended December 31, 2004, 2003 and 2002
37
As a result of these settlements, the counterparty paid the Company $4.8 million. The net realized gains on the swaps have been deferred, classified as a separate component of debt and are being amortized to income as a reduction of interest expense over the remaining term of the debt.
Foreign Currency Contracts The Company uses forward exchange contracts to reduce the effect of fluctuating foreign currencies on short-term foreign currency-denominated intercompany transactions and other known foreign currency exposures. At December 31, 2004 and 2003, the Company had forward exchange contracts (accounted for as cash flow hedges), gener-ally with maturities of one year or less, of $96.9 mil-lion and $80.4 million, respectively. The fair values of these instruments, based on dealer quotes, were liabili-ties of $0.7 million and $0.5 million at December 31, 2004 and 2003, respectively.
Foreign-denominated Debt In December 2002, the Company entered into a 33 million Swiss Franc-denominated note agreement. In November 2001, the Company entered into a 134 million Euro-denomi-nated note agreement. These non-derivative instru-ments have been designated as partial hedges of the Company’s Swiss Franc and Euro net asset positions.
Concentrations of Credit Risk Counterparties to currency exchange and interest rate swap contracts consist of large international financial institutions. The Company continually monitors its positions and the credit rat-ings of the counterparties involved and limits the amount of credit exposure to any one party. While these counterparties may expose the Company to potential losses due to the credit risk of non-perfor-mance, losses are not anticipated. Concentrations of credit risk with respect to trade accounts receivable are limited by the large number of customers, gener-ally short payment terms, and their dispersion across geographic areas.
Fair Values The carrying amount of cash and cash equiv-alents, trade accounts receivable, accounts payable, accrued expenses and short-term borrowings approxi-mated fair value as of December 31, 2004 and 2003.
The fair value of the Company’s long-term debt, includ-ing current maturities, is estimated using discounted cash flows based on the Company’s current incre-mental borrowing rates for similar types of borrowing arrangements. The carrying value of long-term debt at December 31, 2004 and 2003 was $545.4 million and $539.7 million, respectively. The fair value of long-term
debt at December 31, 2004 and 2003 was approxi-mately $556.6 million and $569.5 million, respectively.
6) Shareholders’ Equity
On July 17, 2003, the Board of Directors authorized the redemption of the rights issued pursuant to the Company’s Shareholder Rights Plan. Under the rights plan, one right was attached to each outstanding share of common stock. The rights were redeemed at a price of $0.01 per right on September 3, 2003, to sharehold-ers along with the $0.15 per share quarterly dividend payment. The total amount paid to shareholders related to the rights redemption was $0.5 million and is reported on the Dividends Paid line of the 2003 Statement of Cash Flows.
7) Stock Plans
The Company has various stock option plans under which employees and directors may be granted options to purchase common stock at 100% of the market price on the day the options are granted. Generally, stock options become exercisable over a three-year vesting period and expire 10 years from the date of grant.
Awarded shares of restricted stock become freely transferable at the end of five years. During the period of restriction, the holder of restricted stock has voting rights and is entitled to receive all dividends and other distributions paid with respect to the stock.
Under the 2002 Stock Option Plan, up to 2.4 million shares of common stock are available for employee awards, of which no more than 0.6 million shares may be restricted stock. Under the 1998 Stock Option Plan, up to 2.4 million shares of common stock were avail-able for employee awards, of which no more than 0.6 million shares may be restricted stock. Under the 1994 Stock Option Plan, which expired in January 2004, up to 2.4 million shares of common stock were available for employee awards, of which no more than 0.5 mil-lion shares may be restricted stock. The 1994 Plan also authorized the grant of up to 0.8 million stock appre-ciation rights in connection with stock options. Under the amended 2002 Non-Employee Director Stock Plan, up to 0.09 million shares of common stock are avail-able for director awards of restricted stock. Under the 1999 Non-Employee Director Stock Option Plan, up to 0.25 million shares of common stock are available for director awards.

38 Sensient Technologies Corporat ion 2 0 0 4 A n n u a l R e p o r t
N O T E S to consolidated financial statements
The changes in outstanding stock options during the three years ended December 31, 2004, as well as details on exercisable options were as follows:
WEIGHTED- WEIGHTED-(in thousands OUTSTANDING AVERAGE EXERCISABLE AVERAGE
of shares) OPTIONS PRICE OPTIONS PRICE
Balances at
December 31, 2001 3,167 $19.14 2,140 $19.00
Granted 629 21.85
Exercised (583) 18.02
Cancelled (291) 19.80
Balances at
December 31, 2002 2,922 $19.88 1,808 $19.46
Granted 492 20.38
Exercised (236) 17.99
Cancelled (157) 21.23
Balances at
December 31, 2003 3,021 $20.04 2,041 $19.76
Granted 445 21.82
Exercised (219) 17.29
Cancelled (144) 20.55
Balances at
December 31, 2004 3,103 $20.46 2,233 $20.10
The following summarizes information concerning outstanding and exercisable stock options at December 31, 2004:
RANGE OF EXERCISE PRICE
$14.13- $19.50- $22.00-(in thousands of shares) 19.49- 21.99- 25.19-
Number outstanding 1,122 882 1,099
Weighted-average remaining
contractual life, in years 5.3 6.3 7.0
Weighted-average
exercise price $17.98 $20.74 $22.78
Number exercisable 961 513 759
Weighted-average
exercise price $17.74 $20.77 $22.64
The closing price of our common stock on December 31, 2004 was $23.99.
The following summarizes information concerning shares available to be granted as future stock options under existing plans:
AVAILABLE(in thousands of shares)
December 31, 2002 2,975
December 31, 2003 2,544
December 31, 2004 1,892
8) Retirement Plans
The Company provides benefits under defined contri-bution plans including a savings plan and an employee stock ownership plan (“ESOP”). The savings plan covers substantially all domestic salaried and certain non-union hourly employees and provides for match-ing contributions up to 4% of each employee’s salary. The ESOP covers substantially all domestic employees not covered by a defined benefit plan and provides for contributions based on a percentage of each employee’s compensation as determined by the Board of Directors. Total expense for the Company’s defined contribution plans was $2.7 million, $2.7 million and $6.7 million in 2004, 2003 and 2002, respectively.
Although the Company intends the defined contribu-tion plans mentioned above to be the primary retire-ment benefit for most employees, the Company also has several defined benefit plans. The funded status of the defined benefit plans was as follows at December 31:
(in thousands) 2004 2003
Benefit obligation at beginning
of year $ 27,678 $ 24,289
Service cost 923 937
Interest cost 1,685 1,633
Benefits paid (1,948) (1,479)
Actuarial loss 2,190 2,298
Benefit obligation at end of year 30,528 27,678
Plan assets at beginning of year 4,020 3,300
Company contributions 2,081 1,935
Benefits paid (1,948) (1,479)
Actual gain on plan assets 289 264
Plan assets at end of year 4,442 4,020
Funded status (26,086) (23,658)
Unrecognized prior service cost 14,354 15,636
Unrecognized net actuarial loss 4,292 2,189
Additional minimum liability (16,560) (15,825)
Accrued benefit liability $(24,000) $(21,658)
Accumulated benefit obligation $(28,442) $(25,678)
The additional minimum liability of the Company’s defined benefit plans has been recorded primarily as an increase to Other Assets.
Years ended December 31, 2004, 2003 and 2002

39
Components of annual benefit cost:
(in thousands) 2004 2003 2002
Service cost $ 922 $ 937 $ 861
Interest cost 1,685 1,633 1,248
Expected return on
plan assets (333) (254) (293)
Amortization of prior
service cost 1,281 1,192 1,227
Recognized actuarial
loss/(gain) 77 — (3)
Settlement expense 56 — —
Defined benefit expense $3,688 $3,508 $3,040
Weighted-average liability assumptions as of December 31: 2004 2003
Discount rate 6.00% 6.25%
Expected return on plan assets 8.00% 8.00%
Rate of compensation increase 5.00% 5.00%
Weighted-average cost assumptions for the year ended December 31: 2004 2003
Discount rate 6.25% 6.75%
Expected return on plan assets 8.00% 8.00%
Rate of compensation increase 5.00% 5.00%
The aggregate amounts of benefits expected to be paid from defined benefit plans in each of the next five years subsequent to December 31, 2004, which include employees’ expected future service are as follows: 2005, $1.5 million; 2006, $1.6 million; 2007, $5.3 mil-lion; 2008, $2.8 million; 2009, $2.9 million and $14.0 million in total for the years 2010 through 2014.
The Company expects to contribute $1.6 million to defined benefit plans in 2005.
9) Other Postretirement Benefits
During the fourth quarter of 2003, the Company elimi-nated its subsidy for certain post-retirement programs. As a result of this change in benefits, the Company recognized a one-time, non-cash credit of $13.6 million, which was partially offset by a $0.3 million accrual for claims incurred but not reported, resulting in a net post-retirement credit for 2003 of $13.3 million ($8.2 million after-tax, $0.17 per share), which has been included in the Selling and Administrative Expenses line of the 2003 Statement of Earnings. The $13.3 million postre-tirement credit was recorded in the following segments: $9.3 million in Corporate & Other, $2.9 million in Flavors & Fragrances and $1.1 million in Color.
The funded status of the postretirement benefit plan was as follows at December 31, 2003:
(in thousands) 2003
Benefit obligation at beginning of year $ 9,900
Interest cost 627
Benefits paid (890)
Actuarial loss 811
Benefit obligation at end of year 10,448
Plan assets —
Funded status (10,448)
Unrecognized prior service credit (5,855)
Unrecognized net actuarial loss 2,674
Termination of benefits 13,629
Net amount recognized $ —
Components of net annual benefit cost (credit) were:
(in thousands) 2003 2002
Interest cost $ 627 $ 565
Amortization of prior
service credit (651) (651)
Recognized actuarial
loss (gain) 163 (205)
Termination of benefits (13,629) —
Postretirement income $(13,490) $(291)
10) Income Taxes
The provision for income taxes was as follows:
(in thousands) 2004 2003 2002
Currently payable
(refundable):
Federal $ 8,747 $ (1,538) $16,330
State 1,355 1,246 4,089
Foreign 14,171 19,028 18,316
Deferred (benefit):
Federal (2,939) 10,399 (772)
State (1,229) (565) (1,029)
Foreign 3,868 (1,658) (652)
$23,973 $26,912 $36,282

40 Sensient Technologies Corporat ion 2 0 0 4 A n n u a l R e p o r t
N O T E S to consolidated financial statements
The tax effects of temporary differences that give rise to significant portions of deferred tax assets and liabilities consisted of the following:
(in thousands) 2004 2003
Deferred tax assets:
Benefit plans $ 7,989 $ 6,658
Liabilities and reserves 6,899 12,069
Foreign operating loss carryovers 31,744 28,186
Other 13,371 7,970
Gross deferred tax assets 60,003 54,883
Valuation allowance (18,790) (15,830)
Net deferred tax assets 41,213 39,053
Deferred tax liabilities:
Property, plant and equipment (25,163) (22,911)
Other assets (5,586) (13,712)
Other (12,922) (7,026)
Total deferred tax liabilities (43,671) (43,649)
Net deferred tax (liabilities) assets $ (2,458) $ (4,596)
At December 31, 2004, foreign operating loss carryovers were $98.4 million. Included in the total net operating loss carryovers are losses of $7.3 million that expire through 2014 and $91.1 million that do not have an expiration date.
The effective tax rate differed from the statutory federal income tax rate of 35% as described below:
2004 2003 2002
Taxes at statutory rate 35.0% 35.0% 35.0%
State income taxes,
net of federal income
tax benefit 0.8 1.0 1.4
Tax credits (4.6) (4.0) (6.3)
Foreign tax rate (2.0) 3.7 3.4
Foreign sales corporation/
extraterritorial income
tax benefit (1.6) (2.3) (0.9)
Actual and expected
settlements of prior
years’ issues (0.9) (3.1) (0.8)
Valuation allowance
adjustments (0.3) (3.1) —
Other, net (1.9) (2.4) (0.8)
Effective tax rate 24.5% 24.8% 31.0%
The effective tax rates for all years presented were reduced as a result of favorable settlements of prior year tax matters. The effective tax rate for 2004 and
2003 also included benefits for the planned utilization of foreign tax losses and other adjustments.
Earnings before income taxes were as follows:
(in thousands) 2004 2003 2002
United States $41,263 $ 59,997 $ 78,051
Foreign 56,628 48,347 38,921
$97,891 $108,344 $116,972
Domestic income taxes have not been provided on undistributed earnings of foreign subsidiaries which are considered to be permanently invested. If undistrib-uted foreign earnings were to be remitted, foreign tax credits would substantially offset any resulting domes-tic tax liability.
Tax benefits associated with the exercise of employee stock options were credited directly to additional paid-in capital and amounted to $0.3 million, $0.3 million and $0.9 million during the years ended December 31, 2004, 2003 and 2002, respectively.
11) Segment and Geographic Information
The accounting policies of the segments are the same as those described in the summary of significant accounting policies. The Company evaluates perfor-mance based on operating income of the respective business units before special charges, goodwill amor-tization, interest expense and income taxes. Total rev-enue and operating income by business segment and geographic region include both sales to customers, as reported in the Company’s consolidated statements of earnings, and intersegment sales, which are accounted for at prices which approximate market prices and are eliminated in consolidation. Corporate and other rev-enue consist primarily of flavor, fragrances and color products sold by the Asia Pacific Group.
Assets by business segment and geographic region are those assets used in the Company’s operations in each segment and geographic region. Segment assets reflect the allocation of goodwill to each segment. Corporate and other assets consist primarily of property and investments. Capital expenditures are reported exclu-sive of acquisitions.
Years ended December 31, 2004, 2003 and 2002

41
Segment Information The Company’s operations, except for the Asia Pacific Group, are managed on a products and services basis. The Company’s reportable seg-ments consist of Flavors & Fragrances and Color. The Company’s Flavors & Fragrances segment produces flavor and fragrance products that impart a desired
taste, texture, aroma or other characteristic to a broad range of consumer and other products. The Color seg-ment produces technical colors for industrial applica-tions and digital imaging; colors and formulations for cosmetics; and natural and synthetic color systems for pharmaceuticals, foods and beverages.
FLAVORS & CORPORATE
(in thousands) FRAGRANCES COLOR & OTHER CONSOLIDATED
2002
Revenue from external customers $548,889 $331,533 $ 59,464 $ 939,886
Intersegment revenue 23,298 14,919 — 38,217
Total revenue 572,187 346,452 59,464 978,103
Operating income (loss) 85,523 80,741 (19,769) 146,495
Interest expense — — 29,523 29,523
Earnings (loss) before income taxes 85,523 80,741 (49,292) 116,972
Assets 586,131 547,247 152,307 1,285,685
Capital expenditures 32,188 11,758 3,371 47,317
Depreciation and amortization 24,666 11,000 5,624 41,290
2003
Revenue from external customers $570,692 $350,239 $ 66,278 $ 987,209
Intersegment revenue 23,982 10,438 — 34,420
Total revenue 594,674 360,677 66,278 1,021,629
Operating income (loss) 83,756 71,607 (17,879) 137,484
Interest expense — — 29,140 29,140
Earnings (loss) before income taxes 83,756 71,607 (47,019) 108,344
Assets 690,765 622,258 140,505 1,453,528
Capital expenditures 43,330 22,993 7,885 74,208
Depreciation and amortization 24,662 11,900 6,536 43,098
Special charges — — 6,476 6,476
2004
Revenue from external customers $603,510 $372,178 $ 71,445 $1,047,133
Intersegment revenue 25,281 11,620 — 36,901
Total revenue 628,791 383,798 71,445 1,084,034
Operating income (loss) 81,323 67,991 (20,158) 129,156
Interest expense — — 31,265 31,265
Earnings (loss) before income taxes 81,323 67,991 (51,423) 97,891
Assets 723,210 641,344 124,024 1,488,578
Capital expenditures 24,202 19,649 5,994 49,845
Depreciation and amortization 26,763 12,892 6,588 46,243

42 Sensient Technologies Corporat ion 2 0 0 4 A n n u a l R e p o r t
N O T E S to consolidated financial statements
Geographic Information The Company has manufactur-ing facilities or sales offices in North America, South America, Europe, Asia, Australia and Africa. (in thousands) 2004 2003 2002
Revenue from
external customers:
North America $ 566,915 $558,953 $601,995
Europe 318,007 286,857 235,376
Asia Pacific 110,735 86,492 75,103
Other 51,476 54,907 27,412
Consolidated $1,047,133 $987,209 $939,886
Long-lived assets:
North America $420,095 $431,722 $426,080
Europe 510,850 465,748 373,201
Asia Pacific 21,100 18,841 10,610
Other 289 487 216
Consolidated $ 952,334 $916,798 $810,107
Sales in the United States, based on the final coun-try of destination of the Company’s products, were $426.3 million, $436.9 million and $488.4 million in 2004, 2003 and 2002, respectively. No other country of destination exceeded 10% of consolidated sales. Total long-lived assets in the United States amounted to $352.2 million, $366.0 million and $364.6 million at December 31, 2004, 2003 and 2002, respectively.
12) Special Charges
The Company recorded special charges of $6.5 million ($4.7 million after-tax, $0.10 per share) in December 2003, related primarily to improving cost efficiency worldwide with emphasis on the Color Group. The $6.5 million in charges includes $4.0 million of cash expenditures for severance and other employee sepa-ration costs associated with a workforce reduction of approximately 165 employees and $2.5 million of non-cash costs related to asset impairment charges. The employees were terminated as of December 31, 2003.
The major components of the special charges were as follows:
EMPLOYEE ASSET (in thousands) SEPARATIONS IMPAIRMENTS TOTAL
December 2003 cost
reduction plan
Charges $ 3,952 $ 2,524 $6,476
Cash spent (1,184) — (1,184)
Reductions of assets — (2,524) (2,524)
Balances at
December 31, 2003 $ 2,768 $ — $2,768
Cash spent (2,411) — (2,411)
Balances at
December 31, 2004 $ 357 $ — $ 357
13) Commitments and Contingencies
LeasesThe Company leases certain facilities and equipment under operating lease arrangements. Aggregate mini-mum rental commitments at December 31, 2004, for all noncancelable operating leases with an initial lease term greater than one year were as follows for the years ending December 31,
(in thousands)
2005 $ 8,443
2006 6,284
2007 4,558
2008 2,461
2009 1,799
Thereafter 7,251
$30,796
Rent expense totaled $10.6 million, $9.2 million and $7.9 million during the years ended December 31, 2004, 2003 and 2002, respectively.
GuaranteesIn connection with the sale of substantially all of the Company’s Yeast business on February 23, 2001, the Company has provided the buyer of these operations with indemnification against certain potential liabili-ties as is customary in transactions of this nature. The period provided for indemnification against most types of claims has now expired, but for specific types of claims, including but not limited to tax and envi-ronmental liabilities, the amount of time provided
Years ended December 31, 2004, 2003 and 2002

43
for indemnification is either five years or the appli-cable statute of limitations. The maximum amount of the Company’s liability related to certain of these provisions is capped at approximately 35% of the consideration received in the transaction. Liability related to certain matters, including claims relating to pre-closing environmental liabilities, is not capped. In cases where the Company believed it is probable that payments would be required under these provisions, the Company has recognized a liability. The Company believes that the probability of incurring payments under these provisions in excess of the amount of the liability recorded is remote.
Environmental MattersThe Company is involved in two significant envi-ronmental cases, which are described below. The Company is also involved in other site closure and related environmental remediation and compliance activities at manufacturing sites primarily related to a 2001 acquisition for which reserves for environmental matters were established as of the date of purchase. Actions that are legally required or necessary to pre-pare the sites for sale are currently being performed.
Clean Air Act NOVOn June 24, 2004, the United States Environmental Protection Agency (the “EPA”) issued a Notice of Violation/Finding of Violation (“NOV”) to Lesaffre Yeast Corporation (“Lesaffre”) for alleged violations of the Wisconsin air emission requirements. The NOV generally alleges that Lesaffre’s Milwaukee, Wisconsin facility violated air emissions limits for volatile organic compounds during certain periods from 1999 through 2003. Some of these violations allegedly occurred before Lesaffre purchased Red Star Yeast & Products (“Red Star Yeast”) from the Company.
In connection with the sale of Red Star Yeast on February 23, 2001, the Company provided Lesaffre and certain of its affiliates with indemnification against environmental claims attributable to the operation, activities or ownership of Red Star Yeast prior to February 23, 2001, the closing date of the sale. The Company has not received a claim for indemnity from Lesaffre with respect to this matter. The Company met with the EPA and Lesaffre to discuss the NOV (and appropriate means to help resolve the matter) in September 2004 and expects to resolve any obligation it may have directly with the EPA during 2005.
Superfund ClaimOn July 6, 2004, the EPA notified the Company’sSensient Colors Inc. subsidiary that it may be apotentially responsible party (“PRP”) under theComprehensive Environmental Response, Compensation and Liability Act (“CERCLA”) for activi-ties at the General Color Company Superfund Site in Camden, New Jersey. The EPA requested reimburse-ment of $10.9 million in clean-up costs, plus interest. Sensient Colors Inc. advised the EPA that this site had been expressly excluded from the Company’s 1988 stock purchase of H. Kohnstamm & Company, Inc. (now Sensient Colors Inc.). The selling shareholders had retained ownership of and liability for the site, and some became owners of General Color Company, which continued to operate there until the mid-1990s. The Company’s legal defense costs are being paid by an insurer with a reservation of coverage rights. The Company continues to assess the existence and sol-vency of other PRPs, additional insurance coverage, the nature of the alleged contamination, and the extent to which the EPA’s activities satisfy the requirements for reimbursement under CERCLA, as well as the legal sufficiency of excluding this site from the 1988 trans-action. In a letter to the EPA dated January 31, 2005, the Company outlined legal challenges to the recover-ability of certain costs and urged the EPA to pursue General Color Company and related parties. The Company records liabilities related to envi-ronmental remediation obligations when estimated future expenditures are probable and reasonably estimable. Such accruals are adjusted as further information becomes available or as circumstances change. Generally, estimated future expenditures are discounted to their present value. Recoveries of reme-diation costs from other parties, if any, are recognized as assets when their receipt is assured. The Company has not recorded any potential recoveries related to these matters, as receipts are not yet assured. As of December 31, 2004, the liabilities related to environ-mental remediation obligations could range from $4.0 million to $18.0 million. As of December 31, 2004, the Company has accrued $5.0 million for environmental matters, of which $4.6 million is related to the envi-ronmental reserves established in connection with the 2001 acquisition discussed above. This accrual repre-sents management’s best estimate of these liabilities. Although costs could be significantly higher, it is the opinion of Company management that the possibility that costs in excess of those accrued and disclosed

44 Sensient Technologies Corporat ion 2 0 0 4 A n n u a l R e p o r t
N O T E S to consolidated financial statements
will have a material adverse impact on the Company’s consolidated financial statements is remote. Further, there can be no assurance that additional environmen-tal matters will not arise in the future.
LitigationThere are two significant commercial cases pending against the Company, which are disclosed below.
Kraft Foods North America, Inc. v. Sensient Colors Inc.On April 11, 2003, Kraft Foods North America, Inc. (“Kraft”) filed notice of its intention to arbitrate before the American Arbitration Association in Chicago, Illinois certain claims against Sensient Colors Inc. (“Sensient Colors”), a subsidiary of Sensient Technologies Corporation, in the amount of $6.5 mil-lion. Kraft asserted a claim against Sensient Colors for breach of contract and breach of warranty arising out of the sale of colorants to Kraft for use in food prod-ucts for young children because they caused stains on the clothes, furniture and skin of the consumers. Kraft also asserted a claim against Sensient Colors based on its alleged breach of a settlement agreement. The evidentiary portion of the arbitration was conducted in August 2004 and January 2005. The parties have
submitted final briefs and are awaiting the decision of the arbitrators.
Remmes v. Sensient Flavors, Inc. et alIn June 2004, the Company and certain other flavor manufacturers were sued in Iowa state court by Kevin Remmes, who alleged that while working at American Popcorn Company of Sioux City, Iowa, he was exposed to butter flavoring vapors that caused injury to his lungs and respiratory system. The Company, among others, has in the past and continues to sell butter fla-voring used in the manufacture of microwave popcorn to American Popcorn Company. The suit has been removed to Federal District Court for the Northern District of Iowa, Western Division. The Company believes that plaintiff’s claims are without merit and has begun a vigorous defense. The Company expects this matter to be set for trial in 2006.
The Company is involved in various other claims and litigation arising in the normal course of business. In the opinion of management and Company counsel, the ultimate resolution of these actions will not materi-ally affect the consolidated financial statements of the Company except as described above.
Years ended December 31, 2004, 2003 and 2002

45
M A N A G E M E N T ’ S R E P O R T on internal control over f inancial reporting
To the Board of Directors and Shareholders ofSensient Technologies CorporationMilwaukee, Wisconsin
We have audited the accompanying consolidated balance sheets of Sensient Technologies Corporation and subsidiar-ies (the “Company”) as of December 31, 2004 and 2003, and the related consolidated statements of earnings, stockhold-ers’ equity, and cash flows for each of the three years in the period ended December 31, 2004. These financial state-ments are the responsibility of the Company’s manage-ment. Our responsibility is to express an opinion on these financial statements based on our audits.
We conducted our audits in accordance with the stan-dards of the Public Company Accounting Oversight Board (United States). Those standards require that we plan and perform the audit to obtain reasonable assurance about whether the financial statements are free of material mis-statement. An audit includes examining, on a test basis, evidence supporting the amounts and disclosures in the financial statements. An audit also includes assessing the accounting principles used and significant estimates made by management, as well as evaluating the overall financial statement presentation. We believe that our audits provide a reasonable basis for our opinion.
In our opinion, such consolidated financial statements present fairly, in all material respects, the financial posi-tion of the Company as of December 31, 2004 and 2003, and the results of their operations and their cash flows for each of the three years in the period ended December 31, 2004, in conformity with accounting principles generally accepted in the United States of America.
We have also audited, in accordance with the standards of the Public Company Accounting Oversight Board (United States), the effectiveness of the Company’s internal control over financial reporting as of December 31, 2004, based on the criteria established in Internal Control – Integrated Framework issued by the Committee of Sponsoring Organizations of the Treadway Commission and our report dated February 25, 2005 expressed an unqualified opinion on management’s assessment of the effectiveness of the Company’s internal control over financial reporting and an adverse opinion on the effectiveness of the Company’s internal control over financial reporting.
Milwaukee, WisconsinFebruary 25, 2005
R E P O R T of independent registered public accounting firm
The management of Sensient Technologies Corporation is responsible for establishing and maintaining adequate internal control over financial reporting. It is manage-ment’s policy to maintain a control-conscious environment through an effective system of internal accounting con-trols. These controls are supported by the careful selec-tion of competent and knowledgeable personnel and by the communication of standard accounting and reporting policies and procedures throughout the Company. These controls are designed to provide reasonable assurance regarding the reliability of financial reporting and the preparation of financial statements for external purposes in accordance with generally accepted accounting prin-ciples. Internal control over financial reporting includes policies and procedures that:
1) provide reasonable assurance regarding prevention or timely detection of unauthorized acquisition, use or disposition of the Company’s assets that could have a material effect on the financial statements;
2) provide reasonable assurance that receipts and expen-ditures of the Company are being made only in accor-dance with authorizations of management and directors of the Company; and
3) pertain to the maintenance of records that, in reason-able detail, accurately and fairly reflect the transactions of the Company, to provide reasonable assurance that transactions are recorded as necessary to permit prepa-ration of financial statements in accordance with gener-ally accepted accounting principles.
An internal control material weakness is a significant defi-ciency, or aggregation of significant deficiencies, that does not reduce to a remote possibility, the risk that a material misstatement of the Company’s annual or interim financial statements will be prevented or detected on a timely basis by employees in the normal course of their work.
Management has assessed the effectiveness of the Company’s internal control over financial reporting as of December 31, 2004. In making management’s assess-ment of internal control over financial reporting, we used the criteria set forth by the Committee of Sponsoring Organizations of the Treadway Commission in Internal Control – Integrated Framework.
During the preparation of its financial statements as of and for the year ended December 31, 2004, and in conjunction with management’s assessment of the effectiveness of the Company’s internal control over financial reporting as of that date, a material weak-ness was identified. The material weakness relates to inadequate support for management’s estimates regard-ing the impairment of a receivable and the recording of an income tax benefit. Deloitte & Touche LLP did not agree with management’s documentation support-ing the accounting for these two matters, because they believed the documentation in each instance was not sufficient to support the proposed accounting treatment. The Company agreed with this conclusion and recorded adjustments, which had the effect of lowering the net earnings for the fourth quarter and the year ended December 31, 2004.
Management has concluded that these facts demon-strate that there was a material weakness in the Company’s internal controls over financial reporting as of December 31, 2004, and that the Company’s internal control over financial reporting was not effective at that date. Deloitte & Touche’s report on internal controls can be found on page 46. Management is preparing a com-prehensive process to strengthen its internal controls to address the material weakness, as more fully disclosed in the Company’s 2004 Form 10-K in Item 9A.
46 Sensient Technologies Corporat ion 2 0 0 4 A n n u a l R e p o r t
R E P O R T of independent registered public accounting firm on internal control over f inancial reporting
To the Board of Directors and Shareholders ofSensient Technologies CorporationMilwaukee, Wisconsin
We have audited management’s assessment, included in the accompanying Management’s Report on Internal Control Over Financial Reporting, that Sensient Technologies Corporation and subsidiaries (the “Company”) did not maintain effective internal con-trol over financial reporting as of December 31, 2004, because of the effect of the material weakness identified in management’s assessment based on criteria estab-lished in Internal Control – Integrated Framework issued by the Committee of Sponsoring Organizations of the Treadway Commission. The Company’s management is responsible for maintaining effective internal control over financial reporting and for its assessment of the effectiveness of internal control over financial reporting. Our responsibility is to express an opinion on manage-ment’s assessment and an opinion on the effectiveness of the Company’s internal control over financial reporting based on our audit.
We conducted our audit in accordance with the stan-dards of the Public Company Accounting Oversight Board (United States). Those standards require that we plan and perform the audit to obtain reasonable assurance about whether effective internal control over financial reporting was maintained in all material respects. Our audit included obtaining an understand-ing of internal control over financial reporting, evaluat-ing management’s assessment, testing and evaluating the design and operating effectiveness of internal con-trol, and performing such other procedures as we con-sidered necessary in the circumstances. We believe that our audit provides a reasonable basis for our opinions. A company’s internal control over financial reporting is a process designed by, or under the supervision of, the company’s principal executive and principal financial officers, or persons performing similar functions, and effected by the company’s board of directors, manage-ment, and other personnel to provide reasonable assur-ance regarding the reliability of financial reporting and the preparation of financial statements for external pur-poses in accordance with generally accepted accounting principles. A company’s internal control over financial reporting includes those policies and procedures that (1) pertain to the maintenance of records that, in reason-able detail, accurately and fairly reflect the transactions and dispositions of the assets of the company; (2) pro-vide reasonable assurance that transactions are recorded as necessary to permit preparation of financial state-ments in accordance with generally accepted accounting principles, and that receipts and expenditures of the company are being made only in accordance with autho-rizations of management and directors of the company; and (3) provide reasonable assurance regarding preven-tion or timely detection of unauthorized acquisition, use, or disposition of the company’s assets that could have a material effect on the financial statements.
Because of the inherent limitations of internal control over financial reporting, including the possibility of collusion or improper management override of controls, material misstatements due to error or fraud may not be prevented or detected on a timely basis. Also, projec-tions of any evaluation of the effectiveness of the inter-nal control over financial reporting to future periods are subject to the risk that the controls may become inadequate because of changes in conditions, or that the degree of compliance with the policies or procedures may deteriorate.
A material weakness is a significant deficiency, or a combination of significant deficiencies, that results in more than a remote likelihood that a material misstate-ment of the annual or interim financial statements will not be prevented or detected. The following material weakness has been identified and included in man-agement’s assessment related to inadequate support for management’s estimates with respect to 1) evaluating an impairment of a receivable and 2) recording an income tax benefit. The documentation in each instance was not sufficient to support the amounts recorded by the Company. These items, if they had not been adjusted, would have materially overstated net earnings for the fourth quarter and the year ended December 31, 2004. This material weakness was considered in determin-ing the nature, timing and extent of audit tests applied in our audit of the consolidated financial statements as of and for the year ended December 31, 2004 of the Company and this report does not affect our report on such consolidated financial statements.
In our opinion, management’s assessment that the Company did not maintain effective internal control over financial reporting as of December 31, 2004, is fairly stated, in all material respects, based on the criteria established in Internal Control – Integrated Framework issued by the Committee of Sponsoring Organizations of the Treadway Commission. Also in our opinion, because of the effect of the material weakness described above on the achievement of the objectives of the control criteria, the Company has not maintained effective internal control over financial reporting as of December 31, 2004, based on the criteria established in Internal Control – Integrated Framework issued by the Committee of Sponsoring Organizations of the Treadway Commission. We do not express an opinion or any other form of assurance on management’s statement regarding the process taken by management to address the material weakness.
We have also audited, in accordance with the standards of the Public Company Accounting Oversight Board (United States), the consolidated financial statements as of and for the year ended December 31, 2004 of the Company and our report dated February 25, 2005 expressed an unqualified opinion on those financial statements.
Milwaukee, WisconsinFebruary 25, 2005

47
in thousands except earnings earningsper share amounts gross net per share per share(unaudited) revenue profit earnings basic diluted
2004
First Quarter $254,140 $74,365 $14,960 $.32 $.32
Second Quarter 263,830 80,397 18,249 .39 .39Third Quarter 256,849 77,562 21,592 .46 .46Fourth Quarter 272,314 80,213 19,117 .41 .41
2003
First Quarter $235,051 $76,847 $20,462 $.43 $.43
Second Quarter 261,846 84,347 21,669 .46 .46
Third Quarter 247,251 78,224 20,667 .44 .44
Fourth Quarter 243,061 70,377 18,634 .40 .40
The fourth quarter of 2003 includes special charges of $6.5 million pre-tax, $4.7 million after-tax or $0.10 per share (see Note 12) and a one-time benefit of $13.3 million pre-tax, $8.2 million after-tax or $0.17 per share for eliminating certain post-retirement programs subsidies (see Note 9).
market price dividends high low per share
2004
First Quarter $21.12 $17.91 $.15Second Quarter 21.84 18.28 .15Third Quarter 22.43 18.95 .15Fourth Quarter 24.25 20.53 .15
2003
First Quarter $24.26 $19.30 $.14
Second Quarter 23.35 19.80 .15
Third Quarter 23.85 20.13 .15
Fourth Quarter 21.96 17.86 .15
Q U A R T E R L Y data
C O M M O N S T O C K prices and dividends
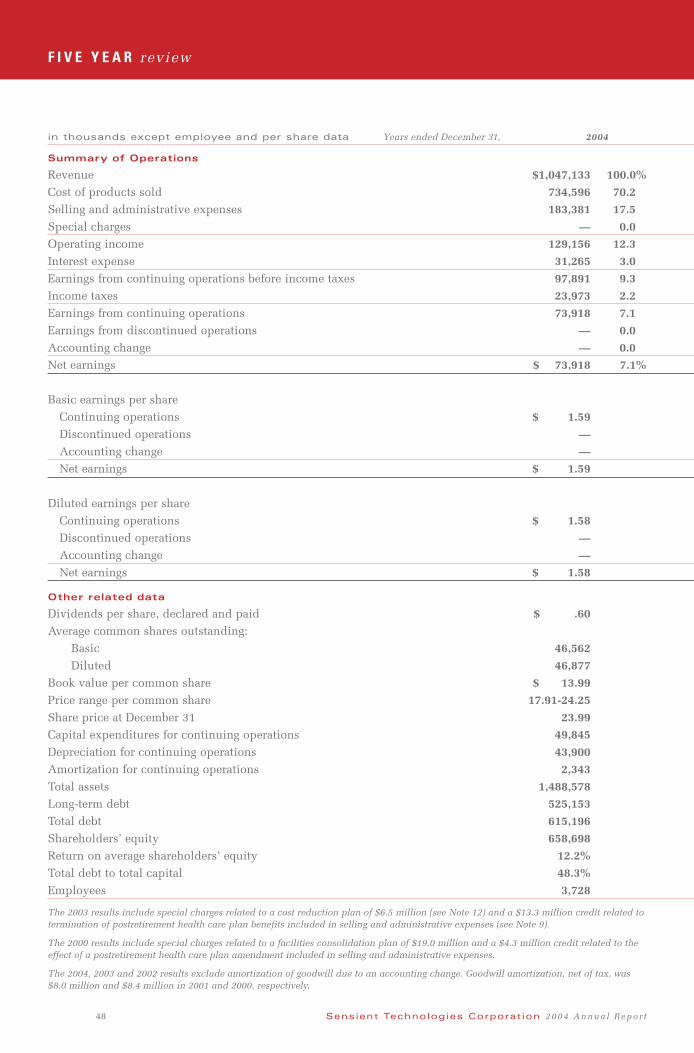
Sensient Technologies Corporat ion 2 0 0 4 A n n u a l R e p o r t48
F I V E Y E A R review
in thousands except employee and per share data Years ended December 31, 2004
Summary of Operations
Revenue $1,047,133 100.0%
Cost of products sold 734,596 70.2
Selling and administrative expenses 183,381 17.5
Special charges — 0.0
Operating income 129,156 12.3
Interest expense 31,265 3.0
Earnings from continuing operations before income taxes 97,891 9.3
Income taxes 23,973 2.2
Earnings from continuing operations 73,918 7.1
Earnings from discontinued operations — 0.0
Accounting change — 0.0
Net earnings $ 73,918 7.1%
Basic earnings per share
Continuing operations $ 1.59
Discontinued operations —
Accounting change —
Net earnings $ 1.59
Diluted earnings per share
Continuing operations $ 1.58
Discontinued operations —
Accounting change —
Net earnings $ 1.58
Other related data
Dividends per share, declared and paid $ .60
Average common shares outstanding:
Basic 46,562
Diluted 46,877
Book value per common share $ 13.99
Price range per common share 17.91-24.25
Share price at December 31 23.99
Capital expenditures for continuing operations 49,845
Depreciation for continuing operations 43,900
Amortization for continuing operations 2,343
Total assets 1,488,578
Long-term debt 525,153
Total debt 615,196
Shareholders’ equity 658,698
Return on average shareholders’ equity 12.2%
Total debt to total capital 48.3%
Employees 3,728
The 2003 results include special charges related to a cost reduction plan of $6.5 million (see Note 12) and a $13.3 million credit related to termination of postretirement health care plan benefits included in selling and administrative expenses (see Note 9).
The 2000 results include special charges related to a facilities consolidation plan of $19.0 million and a $4.3 million credit related to the effect of a postretirement health care plan amendment included in selling and administrative expenses.
The 2004, 2003 and 2002 results exclude amortization of goodwill due to an accounting change. Goodwill amortization, net of tax, was $8.0 million and $8.4 million in 2001 and 2000, respectively.
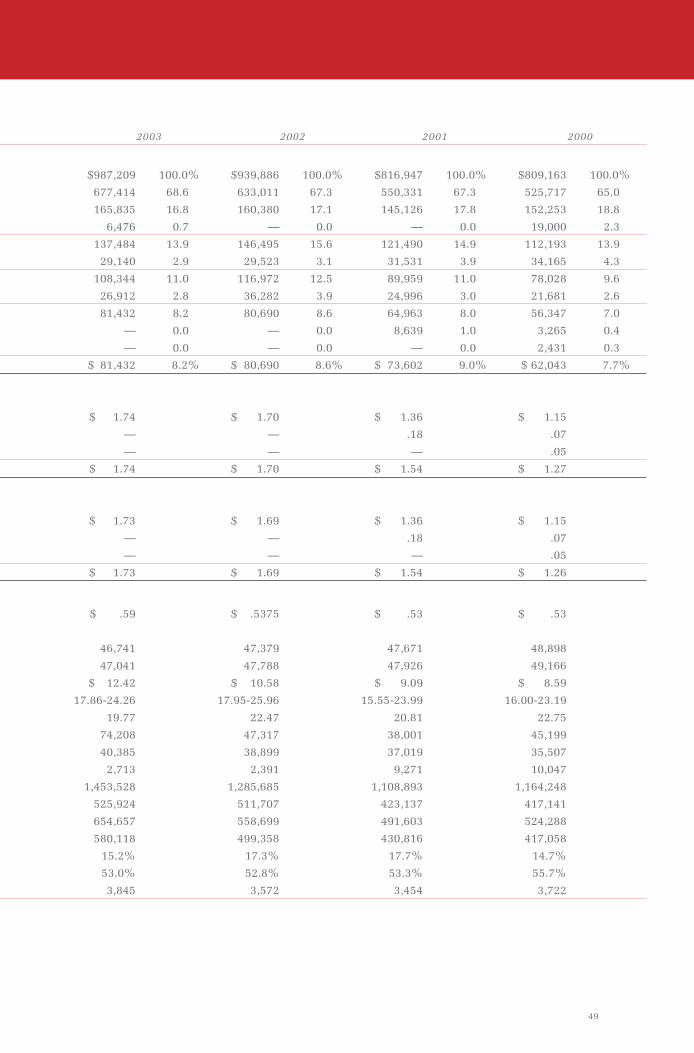
49
2003 2002 2001 2000
$987,209 100.0% $939,886 100.0% $816,947 100.0% $809,163 100.0%
677,414 68.6 633,011 67.3 550,331 67.3 525,717 65.0
165,835 16.8 160,380 17.1 145,126 17.8 152,253 18.8
6,476 0.7 — 0.0 — 0.0 19,000 2.3
137,484 13.9 146,495 15.6 121,490 14.9 112,193 13.9
29,140 2.9 29,523 3.1 31,531 3.9 34,165 4.3
108,344 11.0 116,972 12.5 89,959 11.0 78,028 9.6
26,912 2.8 36,282 3.9 24,996 3.0 21,681 2.6
81,432 8.2 80,690 8.6 64,963 8.0 56,347 7.0
— 0.0 — 0.0 8,639 1.0 3,265 0.4
— 0.0 — 0.0 — 0.0 2,431 0.3
$ 81,432 8.2% $ 80,690 8.6% $ 73,602 9.0% $ 62,043 7.7%
$ 1.74 $ 1.70 $ 1.36 $ 1.15
— — .18 .07
— — — .05
$ 1.74 $ 1.70 $ 1.54 $ 1.27
$ 1.73 $ 1.69 $ 1.36 $ 1.15
— — .18 .07
— — — .05
$ 1.73 $ 1.69 $ 1.54 $ 1.26
$ .59 $ .5375 $ .53 $ .53
46,741 47,379 47,671 48,898
47,041 47,788 47,926 49,166
$ 12.42 $ 10.58 $ 9.09 $ 8.59
17.86-24.26 17.95-25.96 15.55-23.99 16.00-23.19
19.77 22.47 20.81 22.75
74,208 47,317 38,001 45,199
40,385 38,899 37,019 35,507
2,713 2,391 9,271 10,047
1,453,528 1,285,685 1,108,893 1,164,248
525,924 511,707 423,137 417,141
654,657 558,699 491,603 524,288
580,118 499,358 430,816 417,058
15.2% 17.3% 17.7% 14.7%
53.0% 52.8% 53.3% 55.7%
3,845 3,572 3,454 3,722

Sensient Technologies Corporat ion 2 0 0 4 A n n u a l R e p o r t50
committees
1 Audit Committee
2 Executive Committee
3 Compensation and Development Committee
4 Nominating and Corporate Governance Committee
5 Finance Committee
6 Scientifi c Advisory Committee
board of directors
Kenneth P. Manning, 63Chairman, President and Chief Executive OfficerSensient Technologies CorporationElected Director in 1989 (2, 6)
Michael E. Batten, 64Chairman and Chief Executive OfficerTwin Disc, Inc.Elected Director in 1980 (1, 5)
John F. Bergstrom, 58Chairman and Chief Executive OfficerBergstrom CorporationElected Director in 1994 (2, 3, 5)
Hank Brown, 65President and Chief Executive OfficerThe Daniels FundElected Director in 2004 (4, 5)
Fergus M. Clydesdale, Ph.D., 68Distinguished Professor and Head of the Department of Food ScienceUniversity of Massachusetts–AmherstElected Director in 1998 (3, 4, 6)
James A.D. Croft, 67ChairmanBartlodge LimitedElected Director in 1997 (1, 2, 3)
Alberto Fernandez, 58ChairmanPyosa, S.A. de C.V.Elected Director in 1999 (1, 2)
William V. Hickey, 60President and Chief Executive OfficerSealed Air CorporationElected Director in 1997 (1, 2, 4, 5)
Essie Whitelaw, 57Senior Vice President of Private Sector Claims AdministrationWisconsin Physician ServicesElected Director in 1993 (3, 4)
elected officers
Kenneth P. Manning, 63Chairman, President and Chief Executive OfficerWith the Company 17 years
Richard Carney, 54Vice President – AdministrationWith the Company 23 years
John L. Hammond, 58Vice President, Secretary and General CounselWith the Company 7 years
Richard F. Hobbs, 57Vice President, Chief Financial Officer and TreasurerWith the Company 31 years
Richard J. Malin, 38Assistant TreasurerWith the Company 13 years
Charles A. Nicolais, 44 President – Color GroupWith the Company 1 year
Ralph G. Pickles, 58President – Flavors & Fragrances GroupWith the Company 9 years
Stephen J. Rolfs, 40Vice President, Controller and Chief Accounting OfficerWith the Company 7 years
Ho-Seung Yang, Ph.D., 57Vice President – Marketing & TechnologyWith the Company 9 years
appointed officers
Peter Bradley, 45President, Asia Pacific GroupWith the Company 2 years
Neil G. Cracknell, 43President, Dehydrated FlavorsWith the Company 10 years
Christopher L. Lawlor, 54Vice President, Human ResourcesWith the Company 4 years
Harry Meggos, 62Vice President, Technical Service, ColorWith the Company 34 years
Robert L. Menzl, 48Vice President, Information TechnologyWith the Company 9 years
D I R E C T O R S and Officers

world headquarters
777 East Wisconsin AvenueMilwaukee, Wisconsin 53202-5304(414) 271-6755(800) 558-9892Fax: (414) 347-4795E-mail: [email protected] site: www.sensient-tech.com
transfer agent and registrar
Wells Fargo Bank Minnesota, N.A.Shareowner Services P. O. Box 64854St. Paul, Minnesota 55164-0854(800) 468-9716Web site: www.wellsfargo.com/com/shareowner_services/
common stock
Sensient Technologies Corporation Common Stock is traded on the New York Stock Exchange. Ticker symbol: SXT.
There were 3,915 shareholders of record of Common Stock as of January 31, 2005.
annual meeting of shareholders
The Annual Meeting of Shareholders will be held at 2:00 p.m. (EDT) on Thursday, April 21, 2005, at The Four Seasons Hotel, 200 Boylston Street, Boston, Massachusetts.
form 10-k
The Company’s annual report filed with the Securities and Exchange Commission on Form 10-K is available without charge from the Company’s Investor Relations Department and on its Web site at www.sensient-tech.com.
dividends
Quarterly dividends are typically paid on the first business day of March, June, September and December.
automatic dividend reinvestment plan
The Sensient Technologies Corporation Dividend Reinvestment Plan provides shareholders with a con-venient, economical way to increase their ownership of Sensient Technologies Corporation Common Stock. Through the plan, shareholders can automatically reinvest their dividends to acquire additional shares and make supplemental stock purchases without paying fees or commissions. An enrollment form and brochure describing the plan can be obtained by contacting the plan administrator, Wells Fargo Bank Minnesota at (800) 468-9716 or the Company’s Investor Relations Department at (414) 347-3779.
investor relations
Communications concerning the transfer of shares, lost certificates, duplicate mailings or change of address should be directed to the transfer agent.
Other shareholder information, such as news releases and information regarding corporate governance, is available on the Company’s Web site: www.sensient-tech.com. Shareholders can also register to receive notification via e-mail when new information is added to the site. The Company’s Web address is provided as an inactive textual reference only, and the contents of the Web site are not incorporated in or otherwise to be regarded as part of this annual report.
Other requests for information should be directed to the Company’s Investor Relations Department at (414) 347-3779.
The Company maintains a direct mailing list for news releases and quarterly reports. If you would like your name added to this list, please contact the Company’s Investor Relations Department.
I N V E S T O R information
Letter to Shareholders 2
Business Profile 4
Building Value 6
Financial Review 16
Board of Directors 50
Officers 50
Investor Information Inside Back Cover
Table of Contents

Sensient Technologies Corporation
777 East Wisconsin AvenueMilwaukee, Wisconsin 53202-5304www.sensient-tech.com
20
04
AN
NU
AL
RE
PO
RT


