Seoul Development Institute
Building a TDM Impact Analysis System for the Introduction of a Short-Term
Congestion Management Program in Seoul
Jin-Ki Eom, Kee-Yeon Hwang, Ikki KimResearcher of Seoul Development Institute (SDI)
San4-5, Yejang-dong, Jung-ku, Seoul 100-250, KoreaE-mail : [email protected]
Seoul Development Institute
SCMP(Sort-term Congestion Management Program)
SECOMM(Seoul Congestion Management Model)
SECOMM Case Study
Conclusion
Outline
Seoul Development Institute
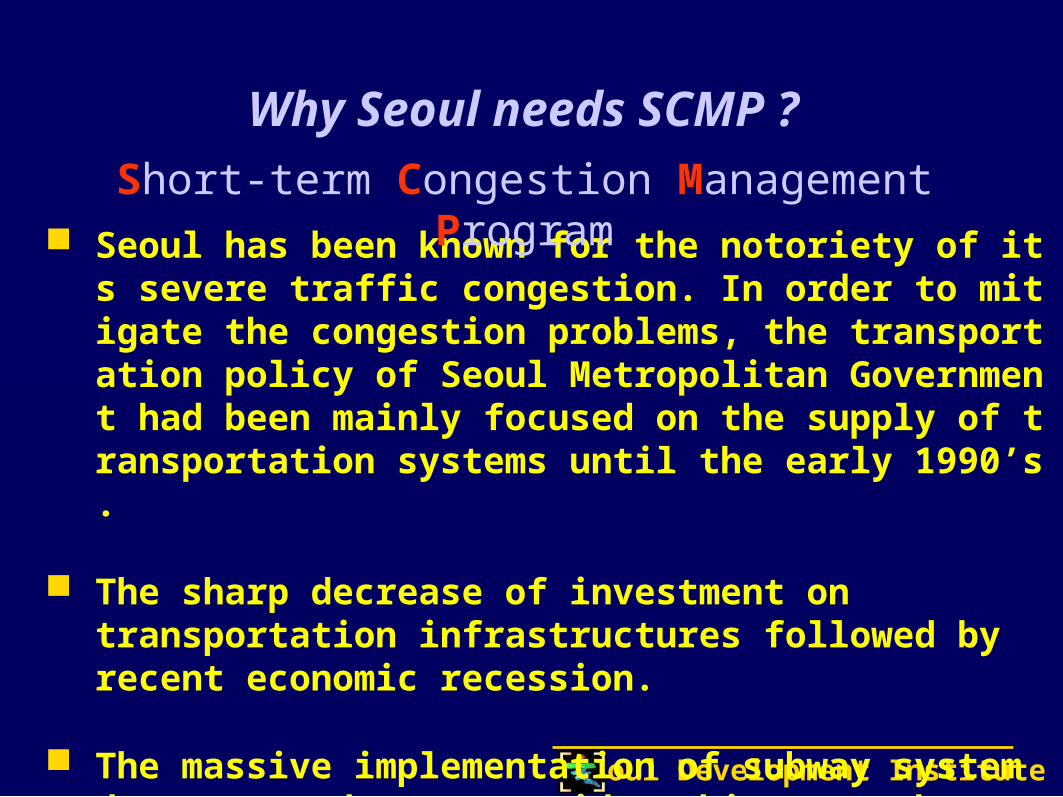
Seoul has been known for the notoriety of its severe traffic congestion. In order to mitigate the congestion problems, the transportation policy of Seoul Metropolitan Government had been mainly focused on the supply of transportation systems until the early 1990’s.
The sharp decrease of investment on transportation infrastructures followed by recent economic recession.
The massive implementation of subway system does not reduce auto rider-ship as much as we expected.
Why Seoul needs SCMP ?
Short-term Congestion Management Program

Seoul Development Institute
1. Setting up Short-term Target of Traffic Management
2. Selecting TDM Programs to Reduce the Excessive Auto Demand
3. Building a Methodology for Forecasting the Expected Impacts of Programs(ex. SECOMM)
4. Monitoring Traffic Conditions Regularly
2. SCMP (Short-term Congestion Management Program)

Seoul Development Institute
Assumption
Structure of the SECOMM
Mode Split Model
Assignment Model
Link Travel Speed Adjustment Function
3. SECOMM(SEoul COngestion Management Model)
Seoul Development Institute
Assumption
The assumptions of SECOMM are as follows
Mode split and route choice are variable while trip generation and trip distribution are not in short-run
Investment is fixed in the short-run

Seoul Development Institute
Structure of the SECOMM
EMME/2
Macro
Short-term TrafficManagement Target
Household TravelSurvey
Data Clearance
END
If Satisfy the goalof Strategy
Yes
No
Modal Split Model(A-Logit)
Travel SpeedSurvey Data
in Seoul
Setting TDMAlternatives
ForecastingProspective
ImplementAlternatives
Monitoring/Analysis

Seoul Development Institute
Data Requirements
IndexData
FormatDate Source
’96 Seoul Metropolitan O/D by Modes- Peak Hour and Non-Peak Hour Day/hour
1997.10 –1998.3
SeoulDevelopment
InstituteTrip/TravelPattern ’96 Household Travel Diary Survey
- Travel Preference and Individual 1 weekTrip Data (Wednesday)
Day1997.10 –
1998.3
SeoulDevelopment
Institute
NetworkSeoul Metropolitan Road Network Data
Transit Route and Network DataHour
1996.11 –1998.4
SeoulDevelopment
Institute
A Day Traffic Volume at Namsan #1.3Tunnel
Hour1996.11 –
1998.4
SeoulMetropolitanGovernmentTraffic
VolumeBus & Subway Ridership Data &
Traffic Volume Survey Data in SeoulHour
1996,1997
SeoulMetropolitan
Police
Speed Traffic Speed Survey Data in Seoul Hour1996,1997
SeoulMetropolitanGovernment

Seoul Development Institute
Process of Building Mode Split Model
Variable Selection
Data Clearing
Mode Split of Cleared Data Set
Generating Unknown TravelTime & Cost
of Alternative Travel Modes
Building Data File(Convert Data into A-Logit Format)
Building Control File1: MNL Method / 2 : Nested Method
A-Logit Run
Satisfy Stopping Criteria
Yes
Utility Functions and Parameters are Set
VariablesAdjustment
No

Seoul Development Institute
U i : utility function of mode i Var i : constant(except bus) of mode i Ttime i : total travel time(min) of mode i TCost i : total travel cost(won) of mode i 21 : Coefficient of independent variable
Nested Tree for Each Alternative
Logit Model (1)
Car TaxiSubwayBus Car SubwayBusTaxi
Car TaxiSubwayBus Car TaxiSubwayBus
iii TCostTTimeVarUi 21

Seoul Development Institute
The Parameter Values and T-Values of Nested-Logit Models
VariableValue
Cost TimeAuto
DummySubwayDummy
TaxiDummy
1 2 2_2
ParameterValue
-0.000175 -0.03417 -0.6845 -0.8317 -2.211 0.9065 -
T-Value -5.6 -21.9 -5.9 -14.3 -8.7 21.6 -0.2434 0.1078
ParameterValue
-0.00023 -0.03988 -0.9568 -0.9200 -1.979 0.5084 0.3897
T-Value -5.0 -20.9 -4.1 -14.1 -6.4 7.9 5.10.2489 0.1143
ParameterValue
0.000083 -0.03753 0.0717 -0.8515 -1.7600 0.0445 11.61
T-Value 2.8 -21.8 0.3 -14.2 -8.4 2.8 9.90.2469 0.1119
ParameterValue
-0.000124 -0.03472 -0.6525 -0.8361 -2.173 0.8391 -
T-Value -3.3 -21.8 -5.5 -14.3 -9.1 16.8 -0.2440 0.1085
Logit Model (2)

Seoul Development Institute
Assignment Process
Trip IndexTrip Index Pre-Network
Build
Pre-NetworkBuild
HighwayNetwork
HighwayNetwork
Transit Network- Bus, Subway
Transit Network- Bus, Subway
Management Region- Link, Zone
Management Region- Link, Zone
Link Group- Speed, Volume
Link Group- Speed, Volume
TrafficManagement
Index Confirm
TrafficManagement
Index Confirm
`96 Traffic Census - Peak hour O/D - 1 Day O/D
`96 Traffic Census - Peak hour O/D - 1 Day O/D
Vehicle Occupancyfor Each Mode
(PCU )
Vehicle Occupancyfor Each Mode
(PCU )
Highway ODHighway OD
HighwayAssignment
HighwayAssignment
Assignment Result forEach Link
(Volume, Speed, Time)
Assignment Result forEach Link
(Volume, Speed, Time)
To Compare PresentTo Compare Present
NoNo
All Mode OD(Peak Hour / 1 Day)
All Mode OD(Peak Hour / 1 Day)
Auto ODAuto OD
Taxi ODTaxi OD
Bus ODBus OD
Subway ODSubway OD
HighwayNetwork
HighwayNetwork
LinkPerformance
Function
LinkPerformance
Function
Yes
S T O PS T O P
TransitNetwork
TransitNetwork
Transit ODTransit OD
TransitAssignment
TransitAssignment
To ApplyWeightFactor
(Wait timeAccess time,Boarding/Alighting
time)
To ApplyWeightFactor
(Wait timeAccess time,Boarding/Alighting
time)Assignment Result
for Each Route(Travel Time,Cost)
Assignment Result for Each Route
(Travel Time,Cost)
Traffic IndexAdjustment
Model Calibration

Seoul Development Institute
Using the adjustment factor, We can predict link travel speed
Process of Predicting Link Travel Speed
fS
SestL
obsL fSS est
lprel
Where, obsLS:Observed Average Speed of Link Group L estLS : Estimated Average Speed of Link Group L to Use
Estimated Link Volume from Assignment Result prelS :Predicted Average Speed of Link l f:Adjustment Factor

Seoul Development Institute
Study Process
Structure of Emme/2 Macro
Study Results
4. SECOMM Case Study
Study Title : Impact Analysis of Gasoline Tax Increase

Seoul Development Institute
Study Process
Building Mode SplitModel
Variable ParameterInput
1. Gasoline Tax Increase
2. New Mode Split Ratio Calculation UsingParameters of Mode Split Model
Network CalibrationBefore Tax Increse
Network CalibrationResults Saving
3. Rebuilding Trip O/D ofEach Mode
Auto-Assignment Transit-Assignment
Saving AutomobileTravel Time
Saving TransitTravel Time
5. New Mode Split Ratio Calculation UsingParameters of Mode Split Model
Adjust factor
6.Saving Difference of ModeSplit Ratio
7.If Satisfy StopingConditions
S T O P
No
Yes
4. Run Assignment
0. Initiation

Seoul Development Institute
Structure of Emme/2 Macro
Emme/2 Macro TREEEmme/2 Macro TREE
1) InitializedMacro
SubmacroSubmacro
SubmacroSub-submacro
1)2)
3)4)...
0) Main Macro
2) AssigmentMacro
4) Mode SplitCalibration
Macro
3) Time/CostCalclation
Macro
5) Rebuild TripMacro
Seoul Development Institute
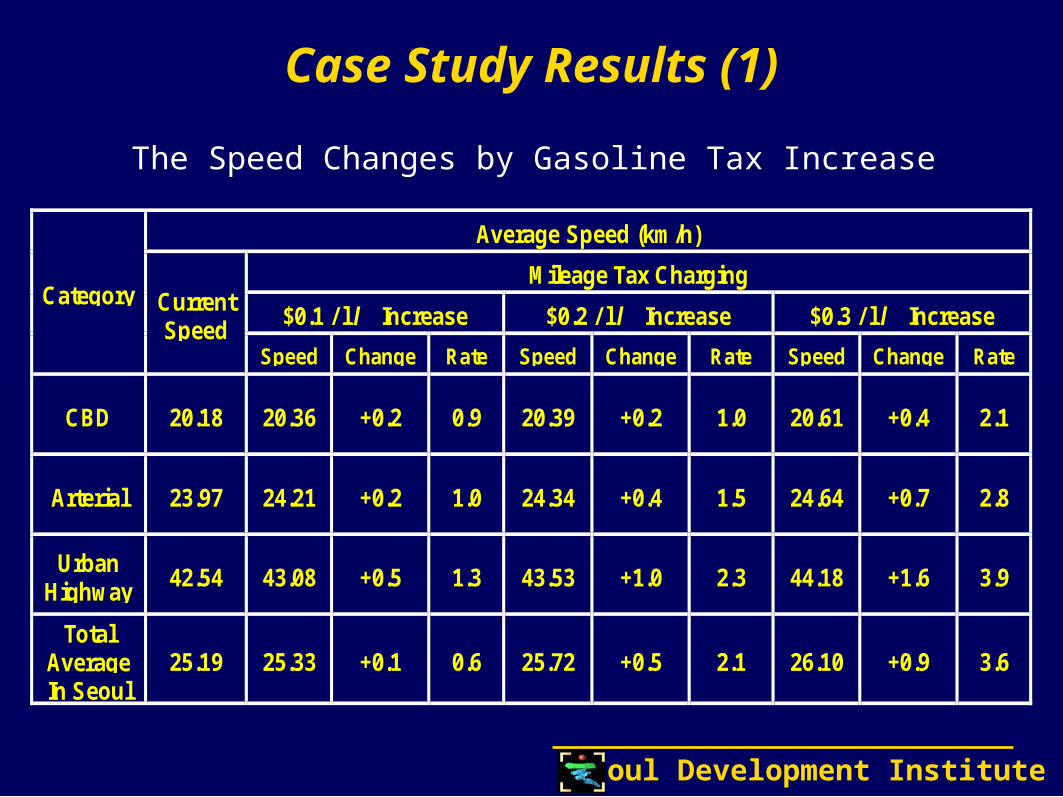
The Speed Changes by Gasoline Tax Increase
Average Speed (km/h)
Mileage Tax Charging
$0.1 / l l Increase $0.2 / l l Increase $0.3 / l l IncreaseCategory Current
SpeedSpeed Change Rate Speed Change Rate Speed Change Rate
CBD 20.18 20.36 +0.2 0.9 20.39 +0.2 1.0 20.61 +0.4 2.1
Arterial 23.97 24.21 +0.2 1.0 24.34 +0.4 1.5 24.64 +0.7 2.8
UrbanHighway
42.54 43.08 +0.5 1.3 43.53 +1.0 2.3 44.18 +1.6 3.9
TotalAverageIn Seoul
25.19 25.33 +0.1 0.6 25.72 +0.5 2.1 26.10 +0.9 3.6
Case Study Results (1)
Seoul Development Institute
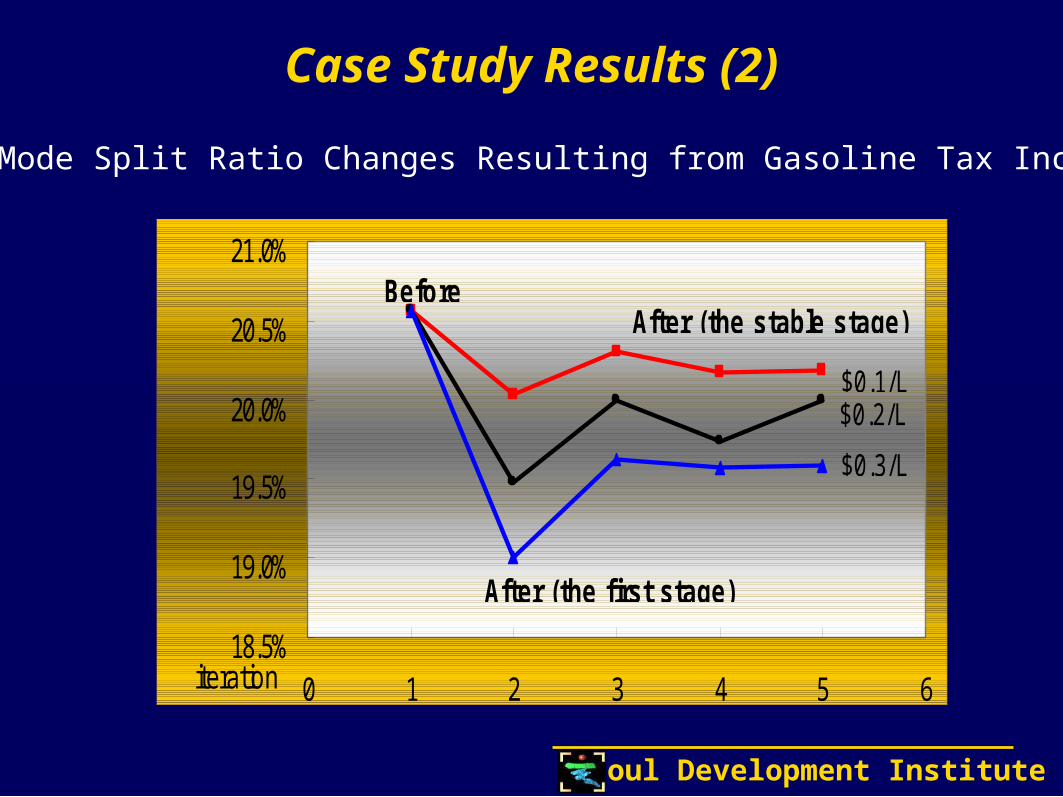
$0.2/L
18.5%
19.0%
19.5%
20.0%
20.5%
21.0%
0 1 2 3 4 5 6iteration
Before
After (the first stage)
After (the stable stage)
$0.1/L
$0.3/L
Auto-Mode Split Ratio Changes Resulting from Gasoline Tax Increase
Case Study Results (2)

Seoul Development Institute
<Response of SPEED to OIL_P>
Monitoring Data
- 300
- 200
- 100
0
100
200
0 5 10 15 20 25 30 35 40 45 50 55 60- 0.4
- 0.2
0
0.2
0.4
0.6
0 5 10 15 20 25 30 35 40 45 50 55 60
<Response of Car to OIL_P>
Response to Oil Price Increased
Seoul Development Institute
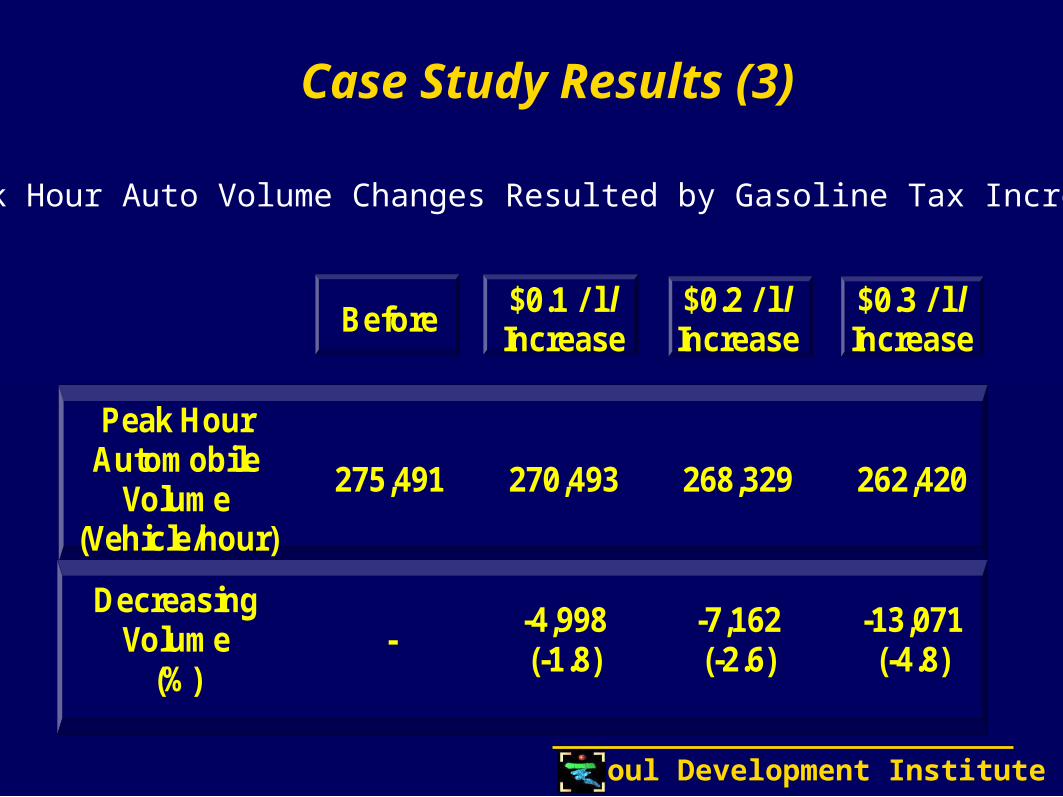
Peak Hour Auto Volume Changes Resulted by Gasoline Tax Increase
Before$0.1 / l lIncrease
$0.2 / l lIncrease
$0.3 / l lIncrease
Peak HourAutomobile
Volume(Vehicle/hour)
275,491 270,493 268,329 262,420
DecreasingVolume
(%)-
-4,998(-1.8)
-7,162(-2.6)
-13,071(-4.8)
Case Study Results (3)

Seoul Development Institute
SECOMM is a TDM impacts analysis system integrating mode choice model and trip assignment model in a module and iterating the interactions between them until the stop conditions are accomplished.
Using SECOMM, we can quickly forecast the impacts of TDM therefore, we can implement SCMP in Seoul.
To enhance the usefulness of SECOMM, there are several things to be done:
checking the estimated results of SECOMM through continuous monitoring on traffic situation in Seoul
updating the O-D data at least every 5 years
updating the network and travel behavior data
5. Conclusions


