
CORPORATE PRESENTATIONERF: TSX & NYSE
N O V E M B E R 2 0 1 9

This presentation contains certain forward-looking information and forward-looking statements within the meaning of applicable securities laws ("forward-looking information"). The use of any of the words "expect", "anticipate", "continue", “estimate”, “guidance”, "may", "will", "should", "believe", "plans“ and similar expressions are intended to identify forward-looking information. In particular, but without limiting the foregoing, this presentation contains forward-looking information pertaining to the following, on the entire company basis and on an asset-level basis, as applicable: expected 2019 average production volumes, timing thereof as well as the anticipated production mix; targeted 2019 and future production growth and Enerplus’ expected source of funding thereof; the proportion of our anticipated oil and gas production that is hedged and the effectiveness of such hedges in protecting our adjusted funds flow or expected free cash flow in 2019; our drilling program, including future development locations and plans, the results from our drilling program and the timing of related production; oil and natural gas prices and differentials and our commodity risk management programs, in 2019 and in the future; expectations regarding our realized oil and natural gas prices; future royalty rates on our production and future production taxes; future efficiencies and reserves and production growth; anticipated cash G&A, share-based compensation and financing expenses; expected operating costs; capital spending levels in 2019 and in the future, along with its components and impact on our production levels and land holdings; the amount of our future abandonment and reclamation costs and asset retirement obligations; future environmental expenses; our future royalty and production and U.S. cash taxes; deferred income taxes, and our tax pools and the time at which we may pay Canadian cash taxes; net operating income and future adjusted funds flow levels, including on a per share and debt adjusted basis; future debt and working capital levels and net debt-to-adjusted funds flow ratios and adjusted payout ratios, financial capacity, liquidity and capital resources to fund capital spending and working capital requirements; our current NCIB and share repurchases thereunder; the amount and timing of future cash dividends that we may pay to our shareholders; and future acquisitions and dispositions, expecting timing thereof and use of proceeds therefrom.
The forward-looking information included in this presentation is not a guarantee of future performance and should not be unduly relied upon. Such information involves known and unknown risks, uncertainties and other factors that may cause actual results or events to differ materially from those anticipated in such forward-looking information including, without limitation: continued low commodity price environment or further volatility; changes in realized prices of Enerplus’ products; changes in the demand for or supply of our products; unanticipated operating results, results from our capital spending activities or production declines; curtailment of our production to retain value, or due to low realized prices or lack of adequate infrastructure; changes in tax or environmental laws, royalty rates, incentive programs or other regulatory matters; changes in our capital plans or by third party operators of our properties; increased debt levels or debt service requirements; inability to comply with debt covenants under our bank credit facility and outstanding senior notes; inaccurate estimation of our oil and gas reserves and contingent resources volumes; limited, unfavourable or a lack of access to capital markets; increased costs; a lack of adequate insurance coverage; the impact of competitors; reliance on industry partners; constraints on, or unavailability of, adequate pipeline and transportation capacity; and certain other risks detailed from time to time in our public disclosure documents (including, without limitation, those risks identified in our Annual Information Form, Form 40-F, and as described under “Risk Factors and Risk Management” in our MD&A for the year ended December 31, 2018).
The forward-looking information contained in this presentation reflects several material factors, expectations and assumptions made by Enerplus including, without limitation: that we will conduct our operations and achieve results of operations as anticipated; that our development plans will achieve the expected results; that lack of adequate infrastructure will not result in curtailment of production and/or reduced realized prices beyond our current expectations; the general continuance of current or, where applicable, assumed industry conditions; the continuation of assumed tax, royalty and regulatory regimes; the accuracy of the estimates of our reserves and resources volumes; commodity price and cost assumptions; the continued availability of adequate debt and/or equity financing and adjusted funds flow to fund our capital, operating and working capital requirements, and dividend payments as needed; the continued availability and sufficiency of our adjusted funds flow and availability under our bank credit facility to fund our working capital deficiency; our ability to negotiate debt covenant relief under our bank credit facility and outstanding senior notes if required; the availability of third party services; and the extent of our liabilities. Our updated 2019 guidance is based on the rest of year prices of: a WTI price of US$54/bbl, a NYMEX gas price of US$2.40/Mcf, and USD/CDN exchange rate of 1.32. We believe the material factors, expectations and assumptions reflected in the forward-looking information are reasonable but no assurance can be given that these factors, expectations and assumptions will prove to be correct.
The purpose of our adjusted funds flow disclosure, as well as the net operating income disclosure from both the Corporation’s Marcellus and Canadian Waterflood assets is to assist readers in understanding Enerplus’ expected and targeted financial results, and this information may not be appropriate for other purposes.
Certain measures used in this presentation do not have a standardized meaning under United States GAAP (“U.S. GAAP”). Please refer to “Non-GAAP measures” in the Advisories and to our Third Quarter 2019 MD&A for reconciliation of these measures to the most directly comparable measure calculated in accordance with U.S. GAAP.
The forward-looking information contained in this presentation speaks only as of the date of this presentation, and none of Enerplus or its subsidiaries assume any obligation to publicly update or revise such forward-looking information to reflect new events or circumstances, except as may be required pursuant to applicable laws.
Forward looking information and statements
2

Concentrated position in the Bakken core− >10 years drilling inventory at current pace
High-return oil production growth− 9-10% annual liquids growth in 2019 (15% on a per share basis)
Consistent free cash flow generation− Plan funded within cash flow at $50 WTI(2)
Low financial leverage− 0.7x net debt to adjusted funds flow ratio (Q3 2019)(1)
Company overview
3
CDN WATERFLOODS9,200 Boe/d (92% oil)
BAKKEN54,800 Boe/d (83% oil)
MARCELLUS228 MMcf/d (100% gas)
Dual listed: TSX and NYSE
Market capitalization: C$2.0 billion
Net debt(1): C$0.6 billion
Enterprise value: C$2.6 billion
Q3 2019 production: 107,181 Boe/d (56% liquids)
Company Information
1) Non-GAAP measure. See supplemental materials and “Advisories”.2) Adjusted funds flow is expected to be approximately balanced with capex at US$50/bbl WTI and US$3/Mcf NYMEX.3) Production volumes on map are Q3 2019. Map does not include 5.0 mboe/d from other assets.

4
Return on capital employed(1) Cash flow from operationsC$ Millions
Free cash flow(1)
C$ MillionsReturn of capitalC$ Millions
10%
18%
23%
2016 2017 2018
$312
$476
$739
2016 2017 2018
$96
$66
$160
2016 2017 2018
$35$29 $29
$79
2016 2017 2018
Dividends Share buybacks
17% 3-year average ROCE
17% 3-year cash flow CAGR (2015-2018)
>$300MMCumulative free cash flow
since 2016
>$100MMReturned to shareholders in 2018
1) Non-GAAP measure. See supplemental materials and “Advisories”.
Disciplined capital allocation and strong returnsT R A C K R E C O R D

Q3 2019 Update
1) Non-GAAP measure. See supplemental materials and “Advisories”.2) Share repurchases and dividends YTD through November 6, 2019.
5
Profitable growth YoY liquids production growth of 9-10%
Liquids growth enhanced to 15% on a per share basis
Capital discipline Capital spending on budget; guidance tightened to $625MM (from $610-630MM)
Prioritizing free cash flow over incremental growth
Financial flexibility Low financial leverage; net debt/adjusted funds flow ratio was 0.7x(1)
Strong free cash flow outlook in Q4 2019
Return of capital Returned ~$200MM through dividends and share repurchases YTD(2)
Repurchased ~10% of shares outstanding since initiating buyback program(2)
2019 OUTLOOK ON TRACK

Returns-focused oil growth and positioned for free cash flow2 0 1 9 C A P I T A L A L L O C A T I O N
1) Includes allocation for maintenance and optimization spending and capitalized G&A expenses.6
High-Margin, Profitable Oil Growth2019e liquids production growth rate
2019e Capital Allocation(1)
C$ millions
+9-10%(vs. 2018)
+15%(vs. 2018)
Liquids productiongrowth
Liquids production pershare growth
Operated Non-operated
North Dakota ~46 drills, ~34 wells online ~4 drills, ~4 wells online
Marcellus - ~2 drills, ~6 wells online
Waterfloods 1 drill, 1 well online, polymer -
DJ Basin ~4 drills, ~4 wells online -
E&D CAPITAL
$625MILLION
MARCELLUS
10%
NORTH DAKOTA
75%
WATERFLOODS
5%
DJ BASIN
10%
2019e Capital Activity (Net)

$10.97
$12.11
$13.24
$14.38
$15.52
$16.66
$9.12
$9.65
$10.17
$10.70
$11.22
$11.75
$4 $6 $8 $10 $12 $14 $16 $18
$7
$8
$9
$10
$11
$12
ERF Reserves Trading Value (C$/BOE)
ER
F S
har
e P
rice
(C$
)
(Enterprise Value + FDC)/2P Enterprise Value/PDP
Compelling value underpinning share repurchasesR E T U R N O F C A P I T A L - S H A R E R E P U R C H A S E S
7
2018 2P F&D cost: $13.74/BOE
2018 PDP F&D cost: $13.08/BOE
1) 2P Finding and development (“F&D”) cost includes Future Development Costs (“FDC”). 2P FDC are C$1.7bn at year-end 2018. F&D cost and FDC are based on independent reserves evaluators’ estimates at year-end 2018. 2) Includes share repurchases through November 6, 2019.
Acquiring an increased interest in low-risk, high-quality reserves at a discount to finding & development cost
Share Repurchases Enhancing Per Share GrowthShares repurchased since Q3 2018
Acquiring Increased Interest in High-Quality ReservesEnerplus’ implied reserves trading value at different share prices(1)
5.9
1.76.6
9.9
200
210
220
230
240
250
Jun-30-18 H2 2018 Q1 2019 Q2 2019 Q3 2019
Sh
ares
(mill
ion
s)
Share repurchases
Sh
ares
out
stan
din
g
~10%OF SHARES
REPURCHASED
(2)

Balance sheet strength a competitive advantageB A L A N C E S H E E T & L I Q U I D I T Y P O S I T I O N
1) Cash position of US$73MM translated from reported C$97MM using FX rate of 1.32. Senior notes are rated NAIC 2 (investment grade) by the National Association of Insurance Commissioners; rank equally with the bank credit facility. 2) Subsequent to the quarter, Enerplus completed a two year extension of its senior, unsecured bank credit facility to October 31, 2023 and amended the credit facility to US$600MM from C$800MM.3) Non-GAAP measure. See supplemental materials and “Advisories”.
8
Strong balance sheet provides meaningful financial flexibility
Only debt outstanding is senior notes(1)
US$600MM credit facility is undrawn(2)
$73
$600
$82 $82$101
$81 $81
$21 $21$0
$100
$200
$300
$400
$500
$600
$700
$800
Liquidity 2020 2021 2022 2023 2024 2025 2026U
S$
mill
ion
s
Cash Bank Credit Facility Senior Notes
Significant LiquidityUS$ millions - Cash, credit facility and senior notes (Sept 30, 2019)
Undrawn credit facility
Cash
1.2x
0.6x 0.4x0.7x
0.0x
1.0x
2.0x
3.0x
2016 2017 2018 Q32019
Operating with Low Financial Leverage Net debt / trailing adjusted funds flow ratio(3)

Growth outlook underpinned by North Dakota development
2019e liquids production per share growth of 15%
2020 to 2021 targeting 10% to 13% annual liquids production growth
High-margin growth positions Enerplus for accelerated free cash flow at prices above US$50/bbl WTI
Focused on returns, profitable oil growth and free cash flowO U T L O O K T H R O U G H 2 0 2 1
1) 2020-2021 outlook released on January 25, 20192) Adjusted funds flow expected to be approximately balanced with capex at US$50/bbl WTI and US$3/Mcf NYMEX. Adjusted funds flow and free cash flow are Non-GAAP measures. See “Advisories”
9
0
10
20
30
40
50
60
70
80
2017 2018 2019E 2020E 2021E
Light Oil Production Growth(1)
Liquids production (Mbbl/d)
OUTLOOK FUNDED AT $50/BBL WTI(2)
15% Liquids production/share growth
9-10% Liquids production growth2019

Track record of outsized returns vs. S&P 500R E T U R N O N C A P I T A L E M P L O Y E D
1) Return on capital employed is a Non-GAAP measure. See supplemental materials and “Advisories”.2) S&P 500 and S&P 500 Energy return on capital employed sourced from Bloomberg.
10
10%
18%
23%
7% 7%9%
-1%
5%
8%
-5%
0%
5%
10%
15%
20%
25%
2016 2017 2018
Enerplus
S&P 500
S&P 500 Energy
Return On Capital Employed(1)

Committed to strong ESG performanceE N V I R O N M E N T A L , S O C I A L & G O V E R N A N C E ( E S G )
11
ENVIRONMENT
SOCIAL
GOVERNANCE
Proactively reducing the environmental impacts of our operations keeps us ahead of increasing regulation and improves operating efficiency
Our business is our people and our relationships. We focus on corporate culture, strong relationships with stakeholders and a safe working environment
We believe effective corporate governance under the stewardship of a high-quality Board is fundamental to creating long-term value for shareholders
5 YEARS OF SUSTAINABILITY REPORTING

North Dakota and Montana – Bakken / Three ForksW I L L I S T O N B A S I N O V E R V I E W
12
WILLISTON BASIN OVERVIEW
Mountrail
Dunn
Billings
Mckenzie
Williams
DivideBurke
Richland
Roosevelt
Sheridan
Dawson
MO
NTA
NA
NO
RTH
DA
KO
TA
FORT BERTHOLD, ND
Tier 1 acreage position
High-return oil production growth
Attracts ~75% of company’s capital
Q3 2019 production: 52 Mboe/d (84% oil)
SLEEPING GIANT, MT
Modest capital expenditures
Low decline, strong free cash flow generator
Q3 2019 production: 3 Mboe/d (73% oil)
SLEEPING GIANT FORT BERTHOLD

Acreage position concentrated in the core of the play
− 65,600 net acres
− Top quartile basin well performance
Singularly unique asset in Bakken core
− Low existing well density
− ~450 gross remaining locations(1)
Tier 1 acreage positionF O R T B E R T H O L D – B A K K E N / T H R E E F O R K S O V E R V I E W
1) Inventory as at December 31, 2018. Gross (net) locations includes 167 (143) proved plus probable undeveloped reserves locations (includes drilled uncompleted wells), 161 (136) best estimate contingent resources locations, and 125 (97) unbooked future locations. See “Advisories”.
2) Production in 2016 and prior has been adjusted for divestments.
13
ERF BAKKEN POSITION – FORT BERTHOLD, ND
Capital Efficient Production GrowthNorth Dakota production, Mboe/d(2)
39.7
0
10
20
30
40
2014 2015 2016 2017 2018
42% GROWTH(2018 vs 2017)
FOR
T B
ER
THO
LD IN
DIA
N R
ESE
RV
ATI
ON
Mckenzie
Dunn
McleanMountrail

Efficiencies, lower costs and optimizations are reducing well costs by ~10% compared to 2018 levels
Total well costs currently averaging US$7.5mm (drill, complete, tie-in & facilities)
Strong execution delivering capital efficiency gainsF O R T B E R T H O L D C A P I T A L E F F I C I E N C Y I M P R O V E M E N T S
14
0
3,000
6,000
9,000
12,000
15,000
18,000
21,000
0 2 4 6 8 10 12 14 16 18 20
Dep
th (f
t)
Days
2017 Average2018 Average2019 YTD Average2019 Pacesetter
Drilling Efficiency - Continuing to Drill FasterDrilling days vs. depth (spud to rig release)(1)
1.2MMlbs/day
1.7MMlbs/day
2.1MMlbs/day
0.5
1
1.5
2
2.5
2018Average
2019Average
2019Pacesetter Pad
Pro
pp
ant/
day
(mill
ion
lbs.
)
Completion Efficiency - Increased Proppant Per DayProppant loading per day
75% IMPROVEMENT
>5 days faster(2019 avg vs 2017 avg)
1) Based on two-mile lateral wells.

Low existing well density and large remaining opportunity
Significant running room to support high-return growthF O R T B E R T H O L D D R I L L I N G I N V E N T O R Y
1) Inventory as at December 31, 2018. Gross (net) locations includes 167 (143) proved plus probable undeveloped reserves locations (includes drilled uncompleted wells), 161 (136) best estimate contingent resources locations, and 125 (97) unbooked future locations. See “Advisories”.
2) DSU is a drilling spacing unit. Well locations per DSU is a simple average and may vary by specific DSU.15
High-Return Inventory(1)
Gross operated inventory locations
0
100
200
300
400
500
2019 Program Remaining Undrilled Inventory
Current Density: ~3 wells/DSU
Ultimate Density: ~10 wells/DSU
Low Existing Well Density(2)
M. BAKKEN
TF 1
TF 2
TF 3
Certain deeper bench locations included in inventory in acreage where these zones are productive
Development Plan per Spacing Unit
~40 operated wells online
~450 operated locations
2 Rigs1 Frac spread

Maintaining strong well performance at lower cost F O R T B E R T H O L D W E L L P E R F O R M A N C E
1) Well economics based on the average 2P reserves booking/location (2-mile lateral) and a total well cost of US$7.5MM.2) Well cost for a 2-mile lateral including drill, complete, tie-in and facilities costs.
16
Cumulative Oil Production per WellEnerplus two-mile lateral well performance
-
100
200
300
400
500
0 100 200 300 400 500 600
Cum
ulat
ive
oil p
rod
ucti
on (m
bb
ls)
Producing days
2017 wells 2018 wells 2019 wells 2017 Avg 2018 Avg 2019 Avg
$8.1
$7.5
2017 Current
Total Well Costs (US$MM)(2)
WELL COST REDUCTION
Well Economics(1)
WTI Oil Price $50/bbl $60/bbl
Payout: 2.4 yrs 1.4 yrs
IRR: 40% 75%
Breakeven (10% IRR): $39/bbl WTI

Improved oil price differentials and constructive outlookB A K K E N P R O D U C T I O N A N D T A K E A W A Y C A P A C I T Y
1) Historical Bakken production is per the NDIC, EIA and forecasts per Wood Mackenzie. Production is shown net of local refining.2) DAPL Expansion and Liberty pipelines are proposed projects. In-service dates have been estimated by Enerplus.
17
0.0
0.5
1.0
1.5
2.0
2.5
3.0
3.5
Jan
-10
Jan
-11
Jan
-12
Jan
-13
Jan
-14
Jan
-15
Jan
-16
Jan
-17
Jan
-18
Jan
-19
Jan
-20
Jan
-21
Jan
-22
Jan
-23
Jan
-24-$12.94
-$9.44-$7.46
-$3.72 -$3.78 -$3.60
2014 2015 2016 2017 2018 2019E
Rail loading Rail loading forecast
Pipelines
DAPL
DAPL Expansion
Liberty PipelineExcess rail loading capacity
Bakken Crude Oil Production and Takeaway Capacity(1)
MMbbl/d
Improved Oil Price DifferentialERF realized Bakken oil differential to WTI (US$/bbl)
Bakken differentials have meaningfully strengthened with improved basin egress
Differential outlook is constructive with potential pipeline projects and significant rail capacity
Enerplus continues to manage risk and volatility through marketing arrangements
− 24,800 bbls/d sold at US$2.69/bblbelow WTI for Q4 2019
Basin Production

Non-operated position in Marcellus dry gas core− 34,500 net acres
− Q3 2019 production: 228 MMcf/d
Low cost, highly productive inventory− >10 year drilling inventory(1)
Consistent free cash flow generation− Regional infrastructure buildout has improved natural gas price differential
− Expecting ~20% differential improvement in 2019 compared to 2018
Core acreage position in the Marcellus dry gas windowM A R C E L L U S O V E R V I E W
1) 82.7 net future drilling locations as at December 31, 2018. Includes 29.4 proved plus probable undeveloped reserves locations and 53.3 best estimate contingent resources locations. See “Advisories”.2) Net operating income (“NOI”) is a Non-GAAP measure. 2019 forecast based on strip prices. See supplemental materials and “Advisories”.
18
MARCELLUS POSITION – NE PENNSYLVANIA
SusquehannaBradford
Sullivan
Lycoming
Wyoming
Enerplus Marcellus ProductionMMcf/d
195198
208
225
2016 2017 2018 YTD Sept 30
Accelerating Free Cash FlowCapex vs Net Operating Income (US$MM)(2)
$0
$25
$50
$75
$100
2016 2017 2018 2019E
Capex NOI

Improved differentials and low transport cost supporting margin despite reduction in NYMEX prices in 2019
Expansion of basin pipeline takeaway to continue to support pricing in 2019+
Low cost structure, improved realized pricing and strong capital efficiencies expected to drive continued free cash flow
Cash margin expansion driven by improved regional pricingM A R C E L L U S M A R G I N I M P R O V M E N T
19
Differential Improvement Increasing Cash FlowMarcellus cash margin (US$/Mcf)
$0.29$0.51
$1.06$1.31
$1.05$1.00$1.02
$1.29
$1.34
$1.20
$1.37 $0.93
$0.76$0.43
$0.35
$2.66$2.46
$3.11 $3.08
$2.61
$0.00
$0.50
$1.00
$1.50
$2.00
$2.50
$3.00
$3.50
2015 2016 2017 2018 2019E
Cash Margin Opex, Gathering, Trans, Royalty
Basis Differential NYMEX Benchmark Price

-
1
2
3
4
5
6
7
8
1 2 3 4 5 6 7 8 9 10 11 12 13 14 15 16 17 18 19 20 21 22 23 24
Bcf
per
wel
l
Months on Production
Lateral Length < 5,000 ft
Lateral Length 5,000 ft - 7,500 ft
Lateral Length > 7,500 ft
Capital efficient and highly productive drilling inventoryM A R C E L L U S W E L L R E S U L T S
1) Based on >145 wells on production since January 2017.2) Well economics based on the average 2P reserves booking/location and 6,300 ft lateral length for a total well cost of US$6.8MM.
20
Marcellus well performance 2017-2019 Average cumulative production per well(1)
Well Economics(2)
NYMEX Gas Price: $2.75/Mcf $3.00/Mcf
Payout: 3.1 yrs 2.4 yrs
IRR: 26% 37%
Breakeven (10% IRR): $2.30/Mcf
40 wells
65 wells
42 wells

-
5
10
15
20
25
30
35
40
45
Q1 18 Q3 18 Q1 19 Q3 19 Q1 20 Q3 20 Q1 21 Q3 21 Q1 22 Q3 22
Additional pipeline projects to further support pricing M A R C E L L U S T A K E A W A Y E X P A N S I O N
21
Marcellus / Utica Natural Gas Production vs. Takeaway(1)
Bcf/d
Local demand
Existing pipelines
Southwest Marcellus pipelines
Northeast Marcellus pipelines
Marcellus / Utica production forecast
>10 Bcf/d of pipeline expansion has been added since the start of 2018
~7 Bcf/d of incremental pipeline projects expected to be in-service by 2022
2018 pipe expansions debottlenecked basin:
Leach Xpress: 1.5 Bcf/d
Rover: 2.3 Bcf/d
NEXUS: 1.5 Bcf/d
Atlantic Sunrise: 1.7 Bcf/d
1) Source: Enerplus, Wood Mackenzie, Goldman Sachs estimates.

Enerplus’ 2019 Marcellus Pricing ExposureM A R C E L L U S N A T U R A L G A S P R I C I N G
22
58%
24%
14%
4%
Full-year 2019 differential guidance of US$0.35/mcf below NYMEX
− ~20% improvement YoY
Expecting seasonally stronger pricing in Q4
MARKETLeidyTZ6 Non-NY
Gulf CoastOther
-$1.20
-$1.00
-$0.80
-$0.60
-$0.40
-$0.20
$0.00
$0.20
Q117
Q217
Q317
Q417
Q118
Q218
Q318
Q418
Q119
Q219
Q319
Q419
2019 Pricing Exposure% of expected Marcellus sales(1)
Enerplus Realized Marcellus Differential(2)
US$/Mcf, average portfolio differential to NYMEX
Avg. -$0.76
Avg. -$0.43
Guidance 2019 Avg. -$0.35
Expect FY realized differential to average
-$0.35 as seasonal demand increases in Q4
1) Pricing exposure is approximate.2) Differential is shown excluding transportation cost. Enerplus’ Marcellus firm transportation cost is approximately US$0.15-$0.20/Mcf.
Fixed physical basis sales & strong seasonal
demand helped drive robust Q1 pricing

Assets under water or polymer flooding− Significant resource: 0.8 bn bbls OOIP(1)
− Low decline oil production
Portfolio optimized to focus on highest return, strong cash flow generating assets− Improved cost structures have driven margins higher
Highly economic opportunity set with modest capital to maintain production levels
Large oil in place, low decline productionC A N A D I A N O I L W A T E R F L O O D P O R T F O L I O
1) OOIP is discovered original oil in place and is estimated by internal qualified reserves evaluators. 2) Production and net operating income (“NOI”) is from retained assets (excludes assets divested). NOI is a Non-GAAP measure. See supplemental materials and “Advisories”.
23
CANADIAN WATERFLOODS
Strong Cash Flow GenerationNet Operating Income minus Capex(2) (C$MM)
$0
$100
$200
$300
$400
$500
2012 2013 2014 2015 2016 2017 2018 YTDSep30
11 11 1110 10 10
98
12 12 1211 11 12
10 9
2012 2013 2014 2015 2016 2017 2018 YTDSep30
Low Decline Oil ProductionMboe/d(2)
OIL
GAS/NGL
>$400 MILLIONIN FREE CASH FLOW
SINCE 2012
ANTE CREEK
GILTEDGE
CADOGAN
MEDICINE HAT
FREDA LAKEAlbertaBritish Columbia
Saskatchewan

~39,000 net acres in NW Weld County
− Low entry price achieved through leasing and farm-in activity during downturn in 2015/16
− Significant oil in place through all Niobrara benches and Codell
Initial five well results compare favorably to core DJ oil rates
~400 gross drilling locations(1) identified in southern portion of acreage at 6-Codell and 6-Niobrara density
− Additional benches with significant oil saturations offer upside
Five additional wells (four net) on production in Q3 2019
− Early results tracking expectations
− Continuing to test completion designs (higher/lower proppant and fluid intensities)
Northern extension of Wattenberg fieldE M E R G I N G O P P O R T U N I T Y – D J B A S I N
1) Internally identified future drilling locations. Average working interest expected between 40% - 70%. 24
DJ BASIN
2017/2018 - 5 wells online(4 Codell, 1 Niobrara)
2019 - 5 wells online(Q3 flowback)
DENVER
WELD
MORGAN
ADAMS
WYOMING
COLORADO

Track record of disciplined capital allocation and strong returns
− 17% cash flow CAGR (3-year)
− >C$300 million in cumulative free cash flow(1) (3-year)
− 17% return on capital employed(1) (3-year avg.)
Concentrated position in the Bakken core
− >10 years of high-quality drilling inventory at current pace
High-return oil production growth
− 9-10% annual liquids growth 2019
Consistent free cash flow generation
− Plan funded within cash flow at $50 WTI(2)
Low financial leverage
− 0.7x net debt to adjusted funds flow ratio (Q3 2019)(1)
Returns and value focused
25
CDN WATERFLOODS9,200 Boe/d (92% oil)
I N V E S T M E N T H I G H L I G H T S
1) Non-GAAP measure. See supplemental materials and “Advisories”.2) Adjusted funds flow is expected to be approximately balanced with capex at US$50/bbl WTI and US$3/Mcf NYMEX.3) Production volumes on map are Q3 2019. Map does not include 5.0 mboe/d from other assets.
BAKKEN54,800 Boe/d (83% oil)
MARCELLUS228 MMcf/d (100% gas)

SUPPLEMENTAL INFORMATION
26
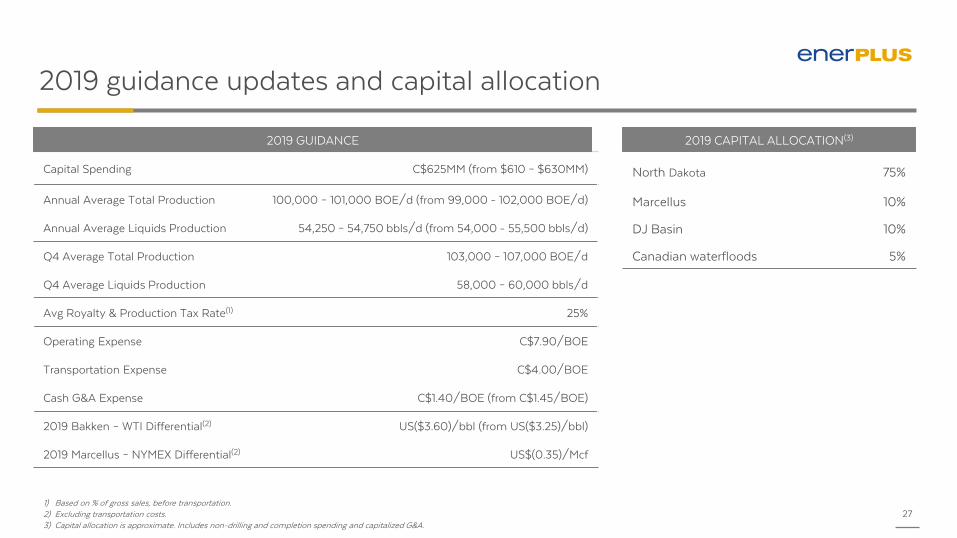
2019 guidance updates and capital allocation
1) Based on % of gross sales, before transportation.2) Excluding transportation costs.3) Capital allocation is approximate. Includes non-drilling and completion spending and capitalized G&A.
27
Capital Spending C$625MM (from $610 – $630MM)
Annual Average Total Production 100,000 – 101,000 BOE/d (from 99,000 - 102,000 BOE/d)
Annual Average Liquids Production 54,250 – 54,750 bbls/d (from 54,000 - 55,500 bbls/d)
Q4 Average Total Production 103,000 – 107,000 BOE/d
Q4 Average Liquids Production 58,000 – 60,000 bbls/d
Avg Royalty & Production Tax Rate(1) 25%
Operating Expense C$7.90/BOE
Transportation Expense C$4.00/BOE
Cash G&A Expense C$1.40/BOE (from C$1.45/BOE)
2019 Bakken – WTI Differential(2) US($3.60)/bbl (from US($3.25)/bbl)
2019 Marcellus – NYMEX Differential(2) US$(0.35)/Mcf
2019 GUIDANCE 2019 CAPITAL ALLOCATION(3)
North Dakota 75%
Marcellus 10%
DJ Basin 10%
Canadian waterfloods 5%

Protecting capital program economicsC O M M O D I T Y H E D G I N G S U M M A R Y
1) As of November 6 2019. The total average deferred premium on outstanding hedges is US$2.14/bbl from Oct 1, 2019 to Dec 31, 2020.2) Offsetting swaps effectively lock-in gains of US$0.51/Mcf on the Company’s NYMEX hedges.
28
Collars Structures
Period Volume(mbbl/d)
Sold Put(US$/bbl)
Purchased Put(US$/bbl)
Sold Call(US$/bbl)
Q4 2019 24.5 $44.64 $54.81 $65.99
Jan 1 – Dec 31, 2020 16.0 $46.88 $57.50 -
CRUDE OIL HEDGES (WTI)(1)
NATURAL GAS HEDGES (NYMEX)(2)
Offsetting Swaps
Period Volume(MMcf/d)
Sold Swap(US$/Mcf)
Purchased Swap(US$/Mcf)
Oct 1 – Oct 31, 2019 90.0 $2.85 $2.34

Board of Directors
29
Elliott Pew, Chairman of the BoardPreviously Co-Founder and Chief Operating Officer for Common Resources, prior thereto held various senior executive positions with Newfield Exploration.
Karen E. Clarke-WhistlerPreviously Chief Environment Officer of TD Bank Group, prior thereto spent 20 years as an environmental consultant to clients in the Americas, Europe and Africa.
Michael R. CulbertPreviously President & Chief Executive Officer of Progress Energy with over 35 years of diverse experience in the energy industry.
Ian C. Dundas, President and CEOJoined Enerplus in 2002 as VP of Business Development and held roles with increasing responsibility, including EVP & Chief Operating Officer, before being appointed President and Chief Executive officer in 2013. Prior to joining Enerplus, he held several executive positions in the merchant banking business.
Hillary A. FoulkesOver 30 years of oil and gas industry experience. In 2019, she retired from her position as Chair of Tudor, Pickering, Holt & Co. Securities Canada, a private energy advisory firm. Prior thereto, she was EVP & Chief Operating Officer at Penn West Petroleum.
Robert B. HodginsPreviously Chief Financial Officer of Pengrowth Energy Trust, prior thereto he was VP and Treasurer for Canadian Pacific Limited and Chief Financial Officer for TransCanada Pipelines Limited.
Susan M. MackenzieOver 25 years of energy sector experience, most recently as Chief Operating Officer for Oilsands Quest Inc. Prior thereto she held senior roles at Petro-Canada and a variety of engineering and leadership roles at Amoco Canada.
Jeffrey W. SheetsPreviously EVP & Chief Financial Officer of ConocoPhillips where he spent over 35 years serving in roles of increasing responsibility and leadership.
Sheldon B. SteevesPreviously Chairman and Chief Executive Officer of Echoex Ltd., a junior private oil and gas company. Prior thereto he was the Chief Operating Officer at Renaissance Energy Ltd.

Summary of operational and financial metrics
30
Q1 2017 Q2 2017 Q3 2017 Q4 2017 2017 Q1 2018 Q2 2018 Q3 2018 Q4 2018 2018 Q1 2019 Q2 2019 Q3 2019
9 Mos Ended
Sep 30, 2019
Average Benchmark Prices
WTI Crude Oil (US$/bbl) 51.92$ 48.29$ 48.20$ 55.40$ 50.95$ 62.87$ 67.88$ 69.50$ 58.81$ 64.77$ 54.90$ 59.81$ 56.45$ 57.06$
NYMEX Natural Gas (US$/Mcf) 3.32$ 3.18$ 3.00$ 2.93$ 3.11$ 3.00$ 2.80$ 2.90$ 3.64$ 3.09$ 3.10$ 2.64$ 2.23$ 2.67$
Production(1)
Oil (mbbl/d) 33,178 36,861 35,245 42,374 36,935 37,443 45,242 48,867 49,968 45,424 41,105 48,141 55,023 48,141
Natural gas liquids (mbbl/d) 3,158 4,133 3,681 4,448 3,858 4,085 4,808 4,563 4,483 4,486 4,383 4,720 5,098 4,736
Natural Gas (MMcf/d) 291,607 271,292 241,212 250,607 263,506 261,310 256,995 260,591 260,453 259,837 258,568 287,000 282,360 276,063
Total (MBOE/d) 84,937 86,209 79,128 88,590 84,711 85,080 92,883 96,861 97,860 93,216 88,583 100,694 107,181 98,888
% Crude oil and natural gas liquids 43% 48% 49% 53% 48% 49% 54% 55% 56% 54% 51% 52% 56% 53%
Selected Financial Results (C$/BOE)
Oil and natural gas sales(2)36.33$ 35.96$ 33.23$ 41.72$ 36.93$ 42.91$ 48.13$ 52.32$ 45.43$ 47.53$ 44.70$ 44.00$ 40.75$ 43.02$
Royalties and production taxes (7.89)$ (8.95)$ (7.98)$ (10.65)$ (8.91)$ (10.41)$ (12.08)$ (13.39)$ (11.58)$ (11.92)$ (10.48)$ (11.26)$ (10.80)$ (10.86)$
Commodity hedging 0.86$ 0.28$ 0.40$ (0.39)$ 0.28$ 1.33$ (2.28)$ (2.68)$ (0.31)$ (1.05)$ 1.32$ (0.13)$ 0.53$ 0.54$
Cash operating expenses (6.57)$ (5.88)$ (6.73)$ (6.42)$ (6.39)$ (7.02)$ (7.21)$ (6.80)$ (6.99)$ (7.00)$ (8.75)$ (7.84)$ (7.06)$ (7.83)$
Transportation costs (3.88)$ (3.72)$ (3.61)$ (3.20)$ (3.60)$ (3.52)$ (3.56)$ (3.70)$ (3.71)$ (3.63)$ (3.92)$ (4.02)$ (3.96)$ (3.97)$
Netback(3)18.85$ 17.69$ 15.31$ 21.06$ 18.31$ 23.29$ 23.00$ 25.75$ 22.84$ 23.93$ 22.87$ 20.75$ 19.46$ 20.90$
Cash general and administrative expenses (1.87)$ (1.53)$ (1.61)$ (1.55)$ (1.63)$ (1.72)$ (1.44)$ (1.35)$ (1.40)$ (1.47)$ (1.55)$ (1.26)$ (1.19)$ (1.32)$
Cash share-based compensation (0.02)$ - (0.10)$ (0.01)$ (0.03)$ (0.25)$ (0.05)$ 0.02$ 0.23$ (0.01)$ (0.17)$ 0.07$ - (0.02)$
Interest, FX and other (1.26)$ (1.34)$ (1.17)$ (1.17)$ (1.24)$ (1.05)$ (0.95)$ (0.81)$ (0.90)$ (0.92)$ (0.68)$ (0.79)$ (0.49)$ (0.65)$
Current inome tax recovery / (expense) (0.01)$ (0.26)$ (0.01)$ 6.15$ 1.55$ (0.01)$ (0.01)$ (0.01)$ 3.03$ 0.80$ 0.69$ 1.52$ - 0.72$
Adjusted Funds Flow(3)15.69$ 14.56$ 12.42$ 24.48$ 16.96$ 20.26$ 20.55$ 23.60$ 23.80$ 22.33$ 21.16$ 20.29$ 17.78$ 19.63$
Notes:
(1) Based on Company interest production volumes. See "Basis of Presentation" section in the MD&A.
(2) Before transportation costs, royalties and the effects of commodity price derivatives.
(3) Please see "Non-GAAP Measures" section in the MD&A.

Reconciliation of return on capital employed
31
(CDN$ millions) 2016 2017 2018
Net Income 397.4$ 237.0$ 378.3$
Add: Interest expense 45.4$ 38.7$ 36.8$
Add: Income tax expense (current and deferred) (237.2)$ 82.0$ 103.2$
Net income before interest and tax - (a) 205.7$ 357.7$ 518.3$
Shareholders' Equity 1,460.5$ 1,600.8$ 2,001.0$
Average Shareholders' Equity(1) - (b) 1,179.1$ 1,530.6$ 1,800.9$
Long-term debt 739.3$ 644.7$ 636.8$
Add: Working capital deficit excluding cash and current derivative assets and liabilities 94.4$ 107.6$ 143.1$
Less: Cash (393.3)$ (346.5)$ (363.3)$
Net Debt 440.4$ 405.8$ 416.6$
Average Net Debt(1) - (c) 880.3$ 423.1$ 411.2$
Return on Capital Employed - (a) / [(b)+(c)] 10% 18% 23%
Notes:
(1) Equals the average of the current and immediately preceding year

Assumptions
All amounts are stated in Canadian dollars unless otherwise specified.
Barrels of Oil Equivalent and Cubic Feet of Gas Equivalent
This presentation contains references to "BOE" (barrels of oil equivalent). Enerplus has adopted the standard of six thousand cubic feet of gas to one barrel of oil (6 Mcf: 1 bbl) when converting natural gas to BOEs. BOEs may be misleading, particularly if used in isolation. The
foregoing conversion ratios are based on an energy equivalency conversion method primarily applicable at the burner tip and do not represent a value equivalency at the wellhead. Given that the value ratio based on the current price of oil as compared to natural gas is significantly
different from the energy equivalent of 6:1, utilizing a conversion on a 6:1 basis may be misleading. "MBOE" and "MMBOE" mean "thousand barrels of oil equivalent" and "million barrels of oil equivalent", respectively.
Non-GAAP Measures
In this presentation, we use the terms “adjusted funds flow", “net debt to adjusted funds flow ratio”, “netback”, “net operating income”, and "free cash flow" as measures to analyze leverage, liquidity and operating performance. These measures do not have any standardized meaning
under United States GAAP (“U.S. GAAP”) and are therefore, considered Non-GAAP measures. “Adjusted funds flow” is calculated as cash flow from operating activities but before changes in non-cash operating working capital and asset retirement obligation expenditures. “Net debt
to adjusted funds flow ratio” is used by Enerplus and is useful to investors and securities analysts in analyzing leverage and liquidity. The net debt to adjusted funds flow ratio is calculated as total debt net of cash, divided by a trailing 12 months of funds flow. “Netback” and “net
operating income” are calculated as oil and gas revenues after deducting royalties, operating costs and transportation expenses. “Free cash flow” is calculated as “adjusted funds flow” less exploration and development capital spending (refer to “Non-GAAP Measures” in the Second
Quarter 2019 MD&A).
Enerplus believes that, in addition to cash flow, net earnings and other measures prescribed by U.S. GAAP, the terms “adjusted funds flow", “net debt to adjusted funds flow ratio”, “netback”, “net operating income”, and "free cash flow“ are useful supplemental measures as they
provide an indication of the results generated by Enerplus' principal business activities. However, these measures are not measures recognized by U.S. GAAP and do not have standardized meaning prescribed by U.S. GAAP. Therefore, these measures, as defined by Enerplus, may
not be comparable to similar measures presented by other issuers. For reconciliation of these measures to the most directly comparable measure calculated in accordance with U.S. GAAP, and further information about these measures, see additional disclosure and reconciliations to
certain of these “Non-GAAP Measures” in the MD&A.
Presentation of Production and Reserves Information
Under U.S. GAAP, oil and gas sales are generally presented net of royalties and U.S. industry protocol is to present production volumes net of royalties. Under IFRS and Canadian industry protocol, oil and gas sales and production volumes are presented on a gross basis before
deduction of royalties. To remain comparable with our Canadian peer companies, the summary results contained within this presentation presents our production and BOE measures on a before royalty “company interest “ basis. In addition, initial test results and production
performance referenced should be considered preliminary data and such data is not necessarily indicative of long-term performance, or of ultimate recovery.
Readers are cautioned that the average initial production rates contained in this presentation are not necessarily indicative of long-term performance or of ultimate recovery.
All production volumes and revenues presented herein are reported on a “company interest” basis, before deduction of Crown and other royalties, plus Enerplus’ royalty interest. Unless otherwise specified, all reserves volumes in this presentation (and all information derived
therefrom) are based on “gross reserves" using forecast prices and costs. “Gross reserves" (as defined in National Instrument 51-101 – Standards of Disclosure for Oil and Gas Activities ("NI 51-101")), being Enerplus’ working interest before deduction of any royalties. Our oil and gas
reserves statement for the year ended December 31, 2018 includes complete disclosure of our oil and gas reserves and other oil and gas information in accordance with NI 51-101, and is contained within our Annual Information Form for the year ended December 31, 2018 ("our AIF")
which is available on our website at www.enerplus.com and under our SEDAR profile at www.sedar.com. Additionally, our AIF forms part of our Form 40-F that is filed with the U.S. Securities and Exchange Commission and is available on EDGAR at www.sec.gov. Readers are also
urged to review the Management’s Discussion & Analysis and financial statements filed on SEDAR and as part of our Form 40-F on EDGAR for more complete disclosure on our operations.
Discovered Petroleum Initially-In-Place, Discovered Original Oil-In-Place and Discovered Original Gas In Place
Discovered Original Oil in Place (“OOIP” ) is not defined in NI 51-101 and does not have a standardized meaning under NI 51-101. Discovered OOIP as used in this presentation is the crude oil portion of discovered PIIP. Discovered OOIP pertaining to our Canadian waterflood assets
are estimates by internal qualified reserves evaluators, combined for all Canadian waterflood assets.
Advisories
32

Contingent Resources Estimates
This presentation contains estimates of "contingent resources". "Contingent resources" are not, and should not be confused with oil and gas reserves. The estimates of contingent resources included in this presentation pertaining to Canadian waterflood assets and Fort Berthold were
evaluated by Enerplus’ internal qualified reserves evaluators and audited by independent reserves evaluators, McDaniel & Associates Ltd. The estimates of “contingent resources” included in this presentation pertaining to the U.S. Shale Gas-Marcellus were evaluated by independent
reserves evaluators, Netherland, Sewell & Associates, Inc. "Contingent resources" are defined in the Canadian Oil and Gas Evaluation Handbook (the "COGE Handbook") as "those quantities of petroleum estimated, as of a given date, to be potentially recoverable from known
accumulations using established technology or technology under development, but which are not currently considered to be commercially recoverable due to one or more contingencies. Contingencies may include factors such as economics, legal, environmental, political and
regulatory matters or a lack of markets. It is also appropriate to classify as “contingent resources” the estimated discovered recoverable quantities associated with a project in the early evaluation stage. All of our “contingent resources” estimates are economic using established
technologies and based on January 1, 2018 forecast prices of McDaniel & Associates Ltd. Enerplus expects to develop these “contingent resources” in the coming years, however it is too early in their development for these resources to be classified as reserves at this time. There is no
certainty that it will be commercially viable for us to produce any portion of the volumes currently classified as “contingent resources”. “Development pending contingent resources” refer to a “contingent resources” project maturity sub-class for a project where resolution of the final
conditions are being actively pursued (there is a high chance of development) and the project is expected to be developed in a reasonable timeframe. The “contingent resources” estimates contained herein are presented as the "best estimate" of the quantity that will actually be
recovered. “Contingent resources” estimates are effective as of December 31, 2018. A "best estimate" of contingent resources means that it is equally likely that the actual remaining quantities recovered will be greater or less than the best estimate, and if probabilistic methods are
used, there should be at least a 50% probability that the quantities actually recovered will equal or exceed the best estimate.
For additional information regarding the primary contingencies which currently prevent the classification of our disclosed “contingent resources” associated with our Marcellus shale gas properties, our Fort Berthold properties, and a portion of our Canadian waterflood properties as
reserves, and the positive and negative factors relevant to the "contingent resource” estimates, see Appendix A to the most recent AIF, a copy of which is available under our SEDAR profile at www.sedar.com, and our Form 40-F, a copy of which is available at www.sec.gov.
Drilling Inventory
Drilling locations associated with proved plus probable undeveloped reserves have been evaluated or reviewed by Enerplus’ independent qualified reserves evaluators in accordance with the Canadian Oil and Gas Evaluation Handbook (the “COGE Handbook”). Drilling locations
associated with unrisked “best estimate” economic contingent resources in “development pending” project maturity sub-class pertaining to Canadian waterflood assets and Fort Berthold have been evaluated by internal qualified reserves evaluators and audited by Enerplus’
independent qualified reserves evaluators, McDaniel & Associates Ltd, in accordance with the COGE Handbook. Drilling locations associated with unrisked “best estimate” economic contingent resources in “development pending” project maturity sub-class pertaining to the U.S.
Shale Gas-Marcellus been evaluated by Enerplus’ independent qualified reserves evaluators, Netherland, Sewell & Associates, Inc, in accordance with the COGE Handbook. Unbooked future drilling locations are not associated with any reserves or contingent resources of Enerplus,
and have been identified by internal qualified reserves evaluators and have not been audited by Enerplus’ independent qualified reserves evaluators.
NOTICE TO U.S. READERS
The oil and natural gas reserves information contained in this presentation has generally been prepared in accordance with Canadian disclosure standards, which are not comparable in all respects to United States or other foreign disclosure standards. Reserves categories such as
"proved reserves" and "probable reserves" may be defined differently under Canadian requirements than the definitions contained in the United States Securities and Exchange Commission (the "SEC") rules. In addition, under Canadian disclosure requirements and industry practice,
reserves and production are reported using gross (or, as noted above with respect to production information, "company interest") volumes, which are volumes prior to deduction of royalty and similar payments. The practice in the United States is to report reserves and production
using net volumes, after deduction of applicable royalties and similar payments. Canadian disclosure requirements require that forecasted commodity prices be used for reserves evaluations, while the SEC mandates the use of an average of first day of the month price for the 12
months prior to the end of the reporting period. Additionally, the SEC prohibits disclosure of oil and gas resources in SEC filings, whereas Canadian issuers may disclose oil and gas resources. Resources are different than, and should not be construed as reserves. For a description of
the definition of, and the risks and uncertainties surrounding the disclosure of, contingent resources, see “Contingent Resources Estimates” above.
Advisories
33


