
Shareholder Value and Changes in American Industries, 1984-2000*
Neil Fligstein and Taek-Jin Shin Department of Sociology University of California
Berkeley, Ca. 94720 U.S.A.
February, 2005
* This paper was supported by a grant from the Russell Sage Foundation for a project entitled "The New Inequalities at Work." We benefited from comments at colloquia presented at the Sociology Departments at Cornell University, Columbia University, UCLA, the Harvard Business School, and the Sloan School of Management-MIT.

1
Abstract There is now a solid set of results from economic sociologists concerning the spread and implementation of "shareholder value" strategies across publicly held corporations in the United States during the 1980s. Corporations were financially reorganized and used the tactics of selling off unrelated product lines, engaging in mergers with firms in similar industries, various financial ploys such as stock buybacks, and downsizing their labor forces. This paper explores empirically the connections between mergers, layoffs, de-unionization, computer technology, and subsequent industry profitability. Mergers occurred in sectors where economic conditions were not good in line with shareholder value arguments. Mergers subsequently led to layoffs, consistent with the shareholder value perspective that emphasizes that firms needed to deploy their resources more efficiently as they reorganized. There is also evidence that managers who engaged in mergers invested in computer technology. This technology directly displaced workers through layoffs and was focused on reducing unionized work forces. There is no evidence that mergers or layoffs returned industries to profitability. Only industry growth and computer investment led to increased profits. This suggests that shareholder value ideology was not, by itself, successful in righting the problems of American business.

2
Introduction
Economic sociologists have spent a great deal of energy trying to make sense of
how corporations have changed in the past 20 years. These changes are mainly indexed
by the idea that corporations were increasingly being managed according to principles
of "maximizing shareholder value". This idea suggested that managers needed to pay
more attention to increasing the returns on the assets of the firm in order to increase the
value of those assets to shareholders and less attention to other constituencies, such as
employees and communities. In practical terms, since shareholders were primarily stock
owners, some managers began to view their firms the same way that stock analysts did
(for an account of how this worked at Enron, see McLean and Elkind, 2003). They
decided that the way to maximize shareholder value was to financially engineer their
balance sheets to please stock analysts and institutional investors. During the 1980s and
1990s, those managers that resisted financial analysis found that their stock price would
decrease, their firms were subject to hostile takeovers, and their jobs could be in
jeopardy (Davis and Stout, 1992; Useem, 1993; Zuckerman, 1999; 2000).
There is now a pretty solid set of empirical results from economic sociologists
concerning the spread and implementation of "shareholder value" strategies across
publicly held corporations in the U.S. (Davis, 1991; Davis and Stout, 1992; Davis, et. al.,
1994; Fligstein and Markowitz, 1993; Fligstein, 2001: ch. 7; Useem, 1993; Dobbin, et.
al., 2003; Zuckerman, 1999; 2000). These results show that U.S. corporations were
financially reorganized and used the tactics of selling off unrelated product lines (Davis,
et al., 1994; Zuckerman, 2000), engaging in mergers with firms in similar industries
(Davis and Stout, 1992; Fligstein, 2001), various financial ploys such as stock buybacks

3
(Westphal and Zajac, 2001), and downsizing their labor forces (Appelbaum and Berg,
1996). These actions were oriented towards raising share prices by convincing the
investment community that the firms were focused on their core businesses and on
making profits (Useem, 1993; Zuckerman, 1999; 2000).
Almost all of this research has been focused on publicly held corporations. This
has proved to be a fruitful tactic because it has focused attention on the links between
firms, managers, boards of directors, financial markets, and institutional investors. In
this paper, we extend this concern by considering how these changes spread across
whole industrial sectors. Here, we analyze how shareholder value strategies (like
mergers and layoffs) operated within industries to put pressure on all firms to conform
to those tactics. We think there are good theoretical reasons to believe that if the largest
publicly held firms in a particular industry underwent reorganization, this would
certainly put pressure on the rest of the industry to respond.
There are two main mechanisms by which this might have occurred: competition
and mimicry. Economic theory suggests that competitive pressures from publicly held
firms would have pushed smaller, nonpublic firms into changing their tactics (for a
similar argument, see Baumol, Blinder, and Wolff, 2003). Population ecology theory
would also view competition in a particular niche (i.e., industry) to push firms to evolve
towards the same tactics (Carroll and Hannan, 2001). Institutional theory would suggest
that even without competitive pressures, firms would be pressured to conform to what
others believed to be the most "efficient" tactics (Meyer and Rowan, 1977; DiMaggio
and Powell, 1983).1 Our goal is to evaluate several claims of the proponents of
1 Useem (1993), for example, argues that mimetic, competitive, and coercive pressures pushed firms in
the 1980s to conform to shareholder value as both an ideology and a set of strategies. Haunschild (1993)

4
shareholder value. First, we try to assess whether shareholder value tactics like mergers
and layoffs occurred more frequently in industries that were underperforming. Then, we
try and assess if the use of these tactics affected profits.
We are also interested in connecting the idea of shareholder value to some of the
other important changes going on in American business. There was a continued shift in
the underlying economy from a goods based to a service based economy (Bluestone and
Harrison, 1982; Harrison and Bluestone, 1988). There was also an explosion in the use
of information technology, particularly after 1985 (Baumol, et. al., 2003: 7-15; Kelley,
1994). Finally, there was a continued drop in the percentage of American workers who
were unionized (Goldfield, 1987; Kochan, Katz, and McKersie, 1994; Mishel, Bernstein,
and Boushey, 2003). These changes eliminated many blue collar and union held jobs
across the American economy and increased service and white collar employment
(Harrison and Bluestone, 1988; Osterman, 1999; Baumol, et. al., 2003; Gordon, 1996).
The empirical literature has shown that the shareholder value perspective on
firms brought managers to be increasingly concerned with ways to deploy their assets in
order to increase profits. The literature shows that they did so by strategically engaging
in mergers (Stearns and Allan, 1996; Fligstein, 2001), selling off diversified product
lines (Zuckerman, 2000), and laying off workers (Dial and Murphy, 1995; Cappelli,
2000). It seems plausible that managers who were trying to maximize shareholder value
would also have been more likely to invest in computer technology and lessen their
dependence on unionized work forces in order to maximize shareholder value. We do
not claim that the shift from manufacturing to services, changes in technology, or de- shows that interlocking directories are important vehicle through which managers imitate acquisition
activities of other firms. Westphal and Zajac (2001) find a similar diffusion process of stock repurchase
programs.
5
unionization started in the 1980s. Nor do we claim that managers interested in
increasing shareholder value were the only ones who engaged in these tactics. Instead,
we want to argue that the heightened concern with tactics that would maximize
shareholder value pushed managers to accelerate their use of tactics like reducing their
dependence on unionized labor forces and using computer technology. It is this
hypothesis that we wish to test.
There are plausible reasons to believe that shareholder value seeking managers
would focus on using technology and de-unionization as tactics to increase profitability.
Economists believe that technological change was one of the key variables driving the
reorganization of American business in the past 20 years (Rosenberg 1982; Krueger,
1993; Bresnahan, Brynjolfsson, and Hitt., 2002). Sociologists have generally been less
interested in connecting the changes in technology to the drive for increased
profitability (see Fernandez [2001] for an important exception). But, we argue that
managers who were trying to increase shareholder value (i.e., increase profits and
thereby elevate the stock price) had the incentive to implement new technology and use
that technology to reorganize and downsize their work forces.
One of the implications of the shareholder value perspective is that workers in
firms should not figure into firm decision making in any important way. Workers came
to be viewed more and more as costs of production and reducing their number, pay, and
benefits was certainly a strategy to increase profits (Appelbaum and Berg, 1996;
Osterman, 1999). We show that one way in which this worked, was the replacement of
both blue and white collar workers by the extensive deployment of computer technology.
In the case of managers and other white collar workers, downsizing and removing levels
of management could only work if higher level managers had more information about

6
their workers at lower levels of the organization. Computer technology provided one
tool by which their performance could be monitored. Computer technology could also
be used to reduce the power and numbers of blue collar or service workers.2 Finally, the
focus on shareholder value and the exclusion of employees from being considered in
strategic corporate decisions had a major impact on how firms might behave towards
their unionized workers. Managers could relocate plants either in nonunion states or
overseas. They could also continue to automate production processes in order to lessen
their need for blue collar skilled and unionized labor.
One of the most interesting questions is the degree to which these changes
achieved their ultimate end: increasing the return on assets (i.e., profits). Indeed, what
evidence we have seems to suggest that mergers did little to increase the profitability of
firms (Jensen and Ruback, 1983; Caves, 1989; Ravenscraft and Scherer, 1989; Scherer
and Ross, 1990; Andrade, Mitchell, and Stafford, 2001). In this paper, we show that the
search for increasing shareholder value by increasing profits through mergers and
layoffs appears to have failed.
We investigate these various hypotheses by empirically exploring the
connections between mergers, layoffs, de-unionization, computer technology, and
subsequent profitability. We do this by putting together a novel data set that contains
information on many key variables for 62 industries across 17 years. We provide
evidence that the shareholder value of mergers and layoffs were occurring more
2 Atwell (1987) and Form, Kaufman, and Wallace (1988) provides a critical review of early debates on
the role of computer technology in degrading and deskilling work. For a comprehensive review of more
recent literature on the effect of technology on the work organization, see Liker, Haddad, and Karlin
(1999). There are also case studies from clothing (Taplin, 1995) and banking (Autor, Levy, and Murnane,
2002) industries on how introduction of new technologies affected workers and work organizations.

7
frequently in industries where profits were low in line with the central claim of the
proponents of shareholder value ideas. Mergers subsequently led to more layoffs,
consistent with the shareholder value perspective that emphasizes that firms needed to
deploy their resources more efficiently as they reorganized. There is also evidence that
managers who engaged in mergers invested in computer technology. These investments
also caused and were heavily focused on reducing unionized work forces.
Finally, the evidence that the shareholder value tactics actually increased the
profitability of industrial sectors is mixed. Indeed, industries where mergers and layoffs
occurred tended to have lower profits subsequent to those events, which is consistent
with the literature.3 This suggests that shareholder value tactics to reorganize firms and
industries failed in their central goal: i.e. to increase profits. Higher profits were most
highly related to industry growth and computer investment. Computer investment
replaced workers and created new higher productivity production processes. This is in
line with the view that the use of computer technology to reorganize work did increase
productivity substantially (Kelley, 1994; Black and Lynch, 2001).
Our paper has the following structure. First, we consider the crisis of the 1970s.
Then we consider the "shareholder value" idea and how it was conceptualized both as a
critique of management practices and a set of prescriptions about what managers ought
to do. We briefly review the empirical literature that documents which actors pioneered
the ideology of shareholder value and spread these practices across U.S. firms. Next,
we generate some hypotheses about how shareholder value, investments in computer
3 For evidence on mergers, see Scherer (1988) and Andrade, et al. (2001) for the summary of findings.
Shleifer and Summers (1988) argue that shareholder gains from takeovers come largely from extracting
rents from stakeholders. For evidence on layoffs, see Blackwell, Marr, and Spivey (1990), Worrell,
Davidson, and Sharma (1991), and Hallock (1998).

8
technology, and industry growth affect important firm outcomes. We then turn to a
discussion of our data, methods, and results.
The Profitability Crisis of the 1970s and the Emergence of Shareholder Value
The purpose of this section is to consider the economic crisis of the 1970s and
the emergence of the "shareholder value conception of control" as the solution to that
crisis. The literature has documented quite clearly how this happened. Our intention is
to use the literature in order to frame hypotheses about how firms and industries used
shareholder value tactics to push forward the reorganization of their industries. One of
the interesting things about corporations is not that they make profits, but how they
choose to do so. In periods where there is a crisis of profitability, managers and owners
of firms often discover new and innovative methods of making money (Fligstein, 1990).
Scholars who have studied the 1980s argue that the economic crisis of the 1970s was a
crisis of profitability. The response to that crisis was the "shareholder value" conception
of control (see for example, Davis et. al.; 1993, Useem, 1993; Fligstein, 2001).
During the 1970s, American corporations were under siege from two forces: the
slow economic growth and high inflation of the 1970s, and increased foreign
competition (Friedman, 1985). Slow economic growth meant that the major markets of
many firms stopped expanding, causing their profits to stagnate. The inflation of the
1970s had a set of negative effects on corporations. Interest rates were quite high over
the period. These high rates pushed investors towards fixed income securities like
government bonds and away from stocks, causing stock prices to drift downward over
the decade. Inflation caused firms to have assets on their books that were increasing in
9
value, but from which they were not earning higher profits. Since many measures of
firm performance were based on returns to assets or investments, this meant that firms
looked even less profitable. Foreign competition, particularly with the Japanese, heated
up. American firms lost market shares and, in some cases, like consumer electronics,
entire markets. Taken together, profit margins were squeezed by inflation, competition,
and slow economic growth. By the late 1970s, with low stock prices, undervalued assets,
and slow growth in sales and profits, many large American firms had stock prices that
valued them as being worth less than the value of their assets and cash (Friedman, 1985).
The slow economic growth and high inflation of the 1970s stimulated a public
policy discussion over how the economy could be fixed. The Carter Administration
embraced the view that one way out of the economic crisis known as “stagflation” (high
inflation, low economic growth) was to deregulate product and labor markets. The
theory suggested that deregulation would stimulate competition, force down wages, and
end inflation. This, in turn, would produce lower prices which would stimulate
consumption and economic growth. The Carter Administration began to experiment by
deregulating the airlines and trucking industries. The presidential election of 1980
brought Ronald Reagan into power. Reagan embraced a pro-business, anti-government
agenda to combat economic hard times. One of his first acts when he came to power
was to decertify the air traffic controllers union. This sent a chill throughout organized
labor in the U.S. by encouraging firms to directly attack their existing unions. While
unions were already in decline, these actions accelerated the process.
Reagan’s Administration did several things that directly encouraged the merger
movement of the 1980s (Stearns and Allan, 1996; Roe, 1993). William Baxter, Reagan's
attorney general in charge of antitrust, had been an active opponent of the antitrust laws
10
while a lawyer and academician. In 1981, he announced new merger guidelines. These
guidelines committed the government to approving almost all mergers except those that
led to concentration ratios within particular markets of greater than 80%. This gave the
green light to all forms of mergers, large and small, vertical and horizontal. The Reagan
Administration also substantially reduced corporate income taxes at the same time.
Reagan encouraged firms to use this largesse to make new investments in the economy.
The kind of investment that most of them made was mergers.
There was clearly an economic crisis in the American economy and a federal
government friendly to business solutions to that crisis in the late 1970s and early 1980s.
But, the existing managerial elite who ran large corporations were an entrenched
economic interest that had much at stake in their control over the largest corporations.
Their firms were already relatively unprofitable. Their inclination was to blame the
troubles of the overall economy for their troubles. This made them unlikely candidates
to produce a sweeping new order.
Fligstein (1990) has argued that historically, when existing conceptions of
control fail to produce economic growth or earn profits, new economic actors often
emerge with a new view on how to make money. He documents how U.S. firms over
time tried to solve big crises caused by lack of profits or growth. He shows how the
depression of the 1890s produced a move towards monopolies, the merger movement of
the 1920s tried to solve problems of over competition by creating oligopolies in many
industries, the depression of the 1930s stimulated marketing strategies, and the
opportunities of the postwar economy produced the finance strategy which caused
managers to diversify their firms in order to make them larger. Once some firms
demonstrated the efficacy of these tactics in solving a particular crisis, the tactics

11
frequently spread across the population of the largest firms. The actors who pioneered
these tactics often came from outside the mainstream of business to challenge the
existing order. These pioneers had to have a critique of the existing order and a set of
strategies they would impose on firms to solve the problems.
The question of who came up with the shareholder value conception of the firm
and how they related to those who were already running the largest corporations has
been extensively studied (Davis and Stout, 1992; Fligstein and Markowitz, 1993;
Useem, 1993; Zorn, et. al., forthcoming). Not surprisingly, the groups that proposed this
analysis of the shortcomings of sitting management teams were the ones who had the
least to lose and the most to gain by this analysis. There appear to have been a number
of important actors including financial analysts in brokerage houses, institutional
investors like mutual fund companies and retirement funds, investment bankers,
insurance companies, and the newly formed executive position of chief financial officer
(Zorn, et. al., forthcoming; Dobbin, et. al. 2003; Zorn, 2004). The financial community
proposed that firms either had to voluntarily reorganize to raise profits and stock prices
or else face getting bought out (Davis and Thompson, 1994; Zuckerman, 2000).
It is useful to explicate the idea of “maximizing shareholder value”, both as an
ideology and as a set of strategies. Then, one can connect it more directly to the various
actors who promoted it. . The main idea in what Fligstein (2001) has called “the
shareholder value conception of the firm” is that the job of top managers is to insure that
the assets of the firm were returning the highest possible profits for their shareholders.
This implies that no other constituency (i.e. workers, communities, or customers) should
matter for the decisions that managers undertake. Hirsch (1986) and Whitley (1986)
argue that the theory has its roots in agency theory, a branch of financial economics that

12
evolved during the 1970s. Jensen (1989), one of the originators of agency theory, argues
that the changes that occurred during the 1980s in the market for corporate control were
efficiency enhancing. By forcing managers to pay more attention to shareholder
interests, firms re-focused their businesses in order to produce higher returns.
The theory underlying the shareholder value conception of control is that the
relationship between managers, boards of directors and equities markets involves
monitoring, rewarding, and sanctioning managers in order to get them to maximize the
returns on assets and in doing so raise the price of the stock (Jensen and Meckling,
1976; Jensen and Ruback, 1983). Boards of directors are supposed to monitor managers
by tying their pay to performance. If boards find that these incentives do not sufficiently
produce high enough profits, then boards would be forced to change management teams.
If boards of directors failed to monitor managers closely enough, the equity markets
would punish firms when owners begin to sell stock and the share price of the firm
drops. This would cause the overall value of the firm (i.e., the stock price multiplied by
the number of outstanding shares) to drop. If it dropped low enough, the assets and cash
the firm held would become worth more than the cost of taking the firm over. This
condition produced the final source of discipline for recalcitrant firms: the hostile
takeover. Theoretically, a new team of owners and managers will take over the assets
by buying them at the depressed price and use them more fruitfully in the pursuit of
maximizing shareholder value.
The shareholder value conception of control offered both a criticism of what
managers were doing circa 1980 and a set of prescriptions about what ought to be done
about it (for versions of what managers "should" do that appeared in the popular
business press, see Baker and Smith, 1998; Hammer and Champy, 1993; Walther, 1997;

13
Pralahad and Hamel, 1990). From the point of view of these critics, the main culprits
who were to blame for the problems of American business in the early 1980s were
managers who had failed in the 1970s to maximize shareholder value (Jensen, 1989).
Put simply, these managers were not deploying the assets of firms in such a way as to
earn the highest possible rates of return. Managers were sitting on undervalued assets
that were earning low profits and not surprisingly, their stock prices reflected the
judgment of the market as to how well they were doing. These sitting management
teams were also accused of controlling their boards of directors. The proof that they had
failed to maximize shareholder value was their low stock price relative to the value of
their assets and cash on hand. If the firm was worth liquidated rather than continue in
operation, then clearly managers were to blame. The rhetoric of shareholder value began
to seep into management practices. Useem (1993) describes how managers either
responded to demands to increase shareholder value by engaging in activities that the
financial markets valued or alternatively, they risked becoming takeover targets.
"Shareholder value" was not just an ideology used to justify any kind of actions.
It was a world view that narrowly conceptualized the firm in terms of its balance sheet
(Fligstein, 1990; Fligstein, 2001; Davis and Thompson, 1994). Maximizing shareholder
value implied a balance sheet where return on assets was high and growing over time.
This encouraged managers to try and financially engineer their balance sheets in order
to increase the attractiveness of the firm and raise its share price. The kind of tactics
managers pursued evolved over the 20 year period. It is useful to review some of what
we know about those tactics. At the beginning of the 1980s, firms with lots of cash,
little debt, and low stock prices found that they were likely to be merger targets. By
borrowing money to pay for new companies, they became both larger, more in debt, and

14
less valuable as takeover targets (Davis and Stout, 1992; Stearns and Allan, 1996).
Second, managers were being told to re-evaluate their product lines and sell off certain
assets. They needed to make sure that they were in businesses that were profitable and if
some lines of business were unprofitable, they were encouraged to divest themselves of
those businesses. This meant they were encouraged to re-focus their business on “core
competences” (Zorn, et. al, forthcoming; Pralahad and Hamel, 1990; Hammer and
Champy, 1993). Firms, as a result, sold off diversified businesses (Davis, et. al, 1994;
Zuckerman, 2000). Third, managers were under pressures to close facilities and layoff
workers in order to reduce costs. Mergers were frequently justified in cost savings terms.
Workers who were redundant were laid off, product lines that were not profitable would
be divested, and the newly re-organized more “focused” firm would presumably make
more money (Cappelli, 2000; Hallock, 1998). Eventually, managers figured out they
could give a momentary boost to their stock price by announcing layoffs. This was
because a firm's short term costs would decrease and this might spike the bottom line,
thereby increasing returns on assets.
Davis and Thompson (1994) argue that the financial community and managers
who embraced the “maximizing shareholder value” rhetoric formed a kind of social
movement. They used the frame of “maximize shareholder value” to push existing firms
towards financial reorganization and where managers resisted, members of the financial
community would aid others in doing hostile takeovers. Some managers did try and
resist the arguments put forward by proponents of maximizing shareholder value. Davis
(1991) shows how managers tried to resist hostile takeovers by creating financial
devices (including so-called “poison pills”) to prevent such takeovers. These devices
would flood the market with the stock of a firm in the event of a hostile takeover bid,

15
thereby diluting the stock of the firm and forcing the people who wanted to do the
takeover of making a higher offer.
But, the evidence shows that overall the pressure of the financial community to
push managers towards trying to maximize shareholder value did result in firms
engaging in precisely the forms of financial reorganization recommended by the
financial community (Useem, 1993). Fligstein (2001) provides evidence that firms who
were targets of takeovers did have undervalued assets relative to stock prices. He shows
that firms who did engage in mergers, divestitures, and stock buybacks were less likely
to be targets of takeover bids. He also demonstrates that having institutional investors
on the boards of directors pushes managers to engage in financial reorganization.
There is evidence that show how firms reduced the number of products they
produced by engaging in mergers of firms producing similar products and divestitures
of unrelated product lines (Davis, et al., 1994). Zorn et. al (forthcoming) demonstrate
that the number of mergers involving diversification drops precipitously during the
1980s. There was a steep rise in mergers in firms’ main product lines. There is also a
substantial rise in vertical mergers (i.e., the purchase of upstream suppliers or
downstream customers).
Studies show that the main beneficiary of these changes within corporations was
the chief financial officer (Dobbin, et al., 2003; Zorn, 2004). This job title was almost
nonexistent during the 1970s. But beginning in the early 1980s, managers with this title
began to proliferate. Their main job was to manage the relationships between the firm,
institutional investors, and stock analysts by paying attention to factors associated with
helping to increase the stock price. Zuckerman (2000) shows how financial analysts
convinced firms that their stocks would be easier to value if they concentrated on fewer

16
products. Chief financial officers obliged such analysts by selling off businesses that
were unrelated to a firm’s main business. As a result, by the 1990s, the “shareholder
value” conception of control came to dominate the rhetoric about firms and the strategic
behavior of managers. Financialization tactics that focused on convincing stock analysts
that the balance sheet was getting better became the focus of much attention in the
1990s.
Shareholder Value and the Re-Organization of Industries
The empirical literature focusing on publicly held corporations has provided
evidence that tells a compelling and coherent story about what has changed for publicly
held American corporations. There are three key features of the past 20 years that are
relevant to making sense of the changes in the way that firms are organized that have so
far not figured into this story: the shift from manufacturing to services, de-unionization,
and the increased use of computer technology to change the way firms work . Of course,
all three processes have been part and parcel of the dynamics of capitalism for the past
200 years. Marx (1990) noted long ago that the main way that firms made money was
by increasing the productivity of labor by substituting technology for human labor
power. He also argued that the struggle between owners, managers, and workers was at
the core of capitalist social relations. He would not have been surprised that in America,
owners and managers would work hard during the 1980s and 1990s to destroy unions.
We want to argue that there was an acceleration of these changes during the 1980s and
1990s as part of how American businesses tried to solve their problems of slow
economic growth and lack of profits by focusing on maximizing shareholder value.

17
Even though these secular trends have been part of the way that capitalists firms
functioned, we want to argue that during the 1980s and 1990s these trends were pushed
forward even more systematically by managers seeking to maximize shareholder value.
During the period when shareholder value conception of the firm was dominant in the
U.S., corporate deindustrialization through downsizing was also the most active.
Research shows that during the last two decades downsizing was concentrated in
manufacturing, while upsizing was a predominant pattern in the major retail and service
industries (Baumol, et al., 2003). This resulted in a phenomenal shift from
manufacturing to service sectors. During the upswing of shareholder value ideas from
1978-88, union participation rates fell from about 25% to 15% and they have continued
to drift downward ever since (Freeman, 1993; Mishel, et al., 2003). This is the period
when the employers’ resistance to trade unions became increasingly organized and
legislatively supported. During this period, employers’ assault on unions intensified and
union bargaining power has weakened (Bronfenbrenner and Juravich, 1998; Clawson
and Clawson, 1999). On the other hand, microcomputer usage begins to take off during
the early 1980s as well and accelerates dramatically in the late 1980s just as shareholder
value ideas take hold in large firms. In 1984, about 24.5% of the labor force used
computers and by 1994, this rose to almost 50% (Card and DiNardo, 2002: 742). We
think the timing of these dramatic changes is at least consistent with the emergence of
shareholder value tactics. It is an empirical question as to the degree to which these
changes were driven by the reorganization of industries undertaken by managers
interested in maximizing shareholder value.
While these changes have been the focus of sustained research in literature on
the reorganization of work (Osterman, 1999; Card, 1996; Card and DiNardo, 2002;

18
Gordon, 1996; Baumol, et. al, 2003), they have not been the focus of the empirical work
that has been interested in shareholder value. We want to argue that focusing on
shareholder value pushed managers to pay more attention to profits and less attention to
employees and communities. As a result, they made strategic decisions on facilities,
employment, and technology using financial criteria that emphasized making their
balance sheets more attractive to financial analysts. What are the plausible mechanisms
that link shareholder value tactics to the acceleration of these changes?
The main growth in the American economy in the past 40 years has been in the
service sector, and as we shall demonstrate, in the finance, real estate, and insurance
parts of the economy. It follows that the continued secular change from manufacturing
to services is one of the underlying stories that have driven managers and the financial
community to make particular kinds of investments. In general, scholars have viewed
these changes as “secular” and outside of the rubric of shareholder value. But, arguably,
this process is also part of maximizing shareholder value. If managers were in lines of
business with poor futures, then they would divest themselves of those businesses. They
would close down plants that were not profitable enough and layoff workers. That
managers have disinvested in manufacturing (at least in the U.S.) is consistent with their
managing to maximize shareholder value.
A second tactic that is also consistent with shareholder value maximization is the
attempt to get rid of jobs dominated by labor unions. Labor unions raise wage costs by
making firms pay more into wages and benefits. They also reduce the flexibility of
management to deploy labor across existing jobs (Edwards, 1978). Part of the
shareholder value critique of managers in the 1970s was that they paid too much
attention to the interests of employees and not enough to those of shareholders. It is

19
straightforward to argue that undertaking actions to remove unions by closing facilities
with union workers and moving to places with lower wages and benefits, is consistent
with maximizing shareholder value as well. During the 1980s, it is clear that the federal
government wanted to reduce so-called labor market rigidities. The main targets of
these actions were jobs that were unionized. Despite the evidence that the layoffs tend
to result in negative, not positive, reaction in the stock prices (Blackwell, et. al., 1990;
Worrell, et., al., 1991), unionized firms continued to lay off more workers than non-
unionized firms (Medoff, 1979; Montgomery, 1991). There is empirical evidence that
more unionized industries tended to downsize more than those that are less unionized
(Baumol, et al., 2003).
Another way to increase profits and reduce wage bills is to invest in new
technology. Technology presumably increases the productivity of labor. It is also a way
to reduce the power of labor (Braverman, 1974; Edwards, 1978). During the 1980s and
particularly in the 1990s, American corporations made huge investments in computer
technology. These investments allowed many tasks to be performed both quicker and
with fewer people. So, for example, bank tellers and phone operators decreased
dramatically in numbers as firms replaced them with automatic phone systems and
tellers (Autor, et al., 2001). They also made it easier for firms to track inventories and
sales and thereby allowed them to keep inventories lean and make adjustments to
production more quickly. The effect of technology on the overall labor employed in the
economy has generally been positive (Kelley, 1994; Brynjolfsson and Hitt, 2000).
While new technologies have destroyed old jobs, they also create new opportunities
(Baumol, et. al, 2003). At the firm level, however, this has played out in complex ways,
depending on what activities in which the firm is engaged. So, for example, firms may

20
fire large numbers of lower skilled workers and replace them with far fewer higher
skilled workers. It is an empirical question as to how this played out across sectors.
Hypotheses
It is useful to begin by describing the data set we use. In order to evaluate
whether or not firms came to use the tactics proscribed by the proponents of the
“shareholder value” conception of control and the effects of these tactics on firm
investment and performance, one would ideally like to have data on a large number of
firms over a long period of time across industrial sectors. One would like data not just
on publicly held corporations, but also small and medium size enterprises. This is
because firms that competed with large publicly held corporations would have to engage
in tactics to maximize shareholder value as well. There are a number of problems in
doing this. Such a data set would be difficult to create because it would be nearly
impossible to draw a sample. It is also difficult to get small and medium sized
enterprises to release data. This would be compounded by the fact that firms have been
come into existence and disappeared in the past 20 years and many smaller ones have
done so without a trace. Suffice it to say that a data set with these characteristics would
be prohibitively expensive to collect.
We have decided to pursue an alternative tactic. Instead of using firms, we use
industries. Industries as a unit of observation allow us to compare the relative
performance of economic sectors over time. Our data set spans the whole sectors of the
economy (62 industries) over a relatively long time period (1984-2000). We will

21
describe this data set more thoroughly in the next section of the paper. The hypotheses
we propose are thus stated at the level of the industry.
Using industry data is quite common in economics (see, for example, Wolff,
2002; Baumol, et al., 2003). Here, scholars assume that whatever competitive pressures
exist in a particular market, are felt equally by all firms. For example, Baumol, et. al.
(2003) study downsizing at the industry level suggesting that the average firm size in an
industry reflects the current competitive conditions in that industry and that changes in
average firm size reflect downsizing. In sociology, population ecology suggests that
isomorphism in industries is a result of selection pressures in particular niches (Carroll
and Hannan, 2001). Firms who adjust to these pressures by shifting their strategies
survive and prosper while those who do not, decline. Institutional theory also posits that
there could be mimetic and coercive pressures towards conformity in an industry net of
competition (DiMaggio and Powell, 1983).
As we have argued, shareholder value is not just an ideology, but a set of
concrete strategic behaviors. To index whether or not managers are being affected by
shareholder value principles, we directly measure variables that reflect whether or not
managers are responding to pressures to focus on increasing shareholder value. The
basic shareholder value hypothesis is that firms and by implication in our data set
industries where profits are low ought to engage in forms of financial reorganization; i.e.
mergers and layoffs. The basic shareholder value idea is that managers are not
producing enough profits relative to their assets. It follows that the sectors where we
expect there to be the most pressure for the reorganization of industry should be those
that are the least profitable. In such sectors, we ought to observe more mergers and
more layoffs in order to reduce costs. . In essence, we suggest that if there is an

22
empirical linkage between low profits and mergers and layoffs, then this is prima facie
evidence that industries have embraced the various tactics associated with the
shareholder value perspective. Managers in highly unionized industries that are less
profitable will attack their labor forces more systematically by closing down facilities
with unionized workers and moving their operations to places where unions are not
important. Finally, managers in low profit industries will have incentives to invest in
labor saving computer technology.
Hypothesis 1: Industries with low profits relative to assets ought to be more
likely to engage in mergers, layoffs, deunionization, and investment of computer
technology.
Hypothesis 2: Mergers should produce layoffs as firms cut workers to increase
their returns on assets. Mergers will also push firms to reorganize and increase their
expenditures on computer investment.
There are two reasons for managers to engage in mergers. Firms were trying to
increase their size by buying market share in order to be one of the largest in their
industry. This would give them some stability either by being able to control prices or
by being the most reliable producers. Second, firms were trying to attain larger size and
rationalize production. One of the main arguments put forward by managers for doing
mergers were cost savings to be attained by reducing redundant departments. This
process of rationalization ought to be associated with increased layoffs. But in order for
these gains to be attained, firms needed to be able to coordinate more disparate activities.
The main way they did this was by investing in computer technology. This allowed
them to eliminate layers of management and coordinate far flung activities.
Hypothesis 3: Investment in computer technology ought to result in layoffs.

23
Hypothesis 4: Mergers, layoffs, and computer investment ought to be aimed at
unionized workforces.
Investments in computer technology do not just make firms able to integrate
their activities, but they also allow them to replace workers with machines. We expect
that investments in computer technology will lead to layoffs. The largest and most
protected group of less skilled workers in the economy circa 1980 was unionized. One
of the purposes of pushing managers to maximize shareholder value was to get them to
pay less attention to employees and more to the bottom line. It follows that the tactics
managers used to maximize shareholder value, mergers, layoffs, and investments in
computer technology should have been aimed at reducing the cost and presence of
unionized workers.
Hypothesis 5: Mergers, layoffs, and computer investments should increase the
return on assets of industrial sectors, net of the growth prospects of any particular
sector.
The entire purpose of pushing managers to maximize shareholder value was to
get them to increase the profits of firms relative to their assets. Thus, the main tactics
that managers used to reorganize their firms ought to raise the profits of firms over time.
Hence, mergers, layoffs, and computer investments ought to be positively associated
with changes in profits over time.
Data and Methods
The data was collected from multiple sources. Several of the variables had to be
constructed from original documents. These variables have potential problems that we

24
describe below. Other variables were available from government sources. Merger data
came from the yearly almanac of Mergers and Acquisitions from 1984 to 2000. From
this source, the number of merger and acquisition deals in each 2-digit SIC industry was
acquired. We counted the number of the deals where a U.S. firm merged with or
acquired another U.S. firm, or a U.S. firm merged with or acquired a foreign firm. The
industry of the target firm was coded using a modified version of the two-digit SIC (see
the Appendix for the list of industry titles used in the analysis).
A potential weakness of the data is that the collection of the merger and
acquisition deals in the Mergers and Acquisition has lower-bound values, which had
been $1 million before 1991 and were changed to $5 million in 1991. The change might
have caused the reported numbers of mergers before 1991 to be higher than the number
of mergers after 1991. In order to see if this made a difference in the prediction of the
change in mergers in a given year, we included a dummy variable for the observations
made after the change in the cutoff value. The dummy variable was not significant at the
5% level and we concluded that the coding change did not make much of a difference.
This is probably because of the fact that inflation between 1983 and 1991 raised the
threshold level for mergers.
Layoffs were counted from the Wall Street Journal articles in ProQuest’s
Newspapers archive (ProQuest, various years). Initially, we identified the articles from
1983 to 2000 that included either the word “layoff” in the abstract or “layoff” or
“restructuring” in the title. This procedure yielded anywhere from 100 to 400 articles
each year. Since we suspected that a single event of layoff could be covered by more
than one article and that the list could include some highly speculative forecasts based
on rumors, we carefully examined each article’s contents for redundancy and certainty.

25
We also suspected that the newspaper report is a selected source of the real occurrence
of layoffs. Smaller scale layoffs do not always attract the media’s attention. In other
words, we suspect that the records on the small scale layoffs are selected based on the
media’s discretion. Therefore we only counted the layoffs of more than 50 employees,
assuming that the layoffs of more than 50 employees are more frequently reported.
When the corporation has overseas locations, only the layoffs that directly affected the
U.S. workers are counted. The timing of the layoffs refers to the execution of the layoffs,
rather than the announcement of them. We assigned 2-digit SIC to each layoff incidence,
and counted the number of layoffs in each industry for each year.
To check the quality of the data, we compared our count with Baumol, Blinder,
and Wolff’s (2003), who conducted a search for the word “downsizing” in the archives
of the New York Times and the Wall Street Journal for the years 1993 through 1997.
Since Baumol et. al. (2003) reported their count in an aggregated industry classification,
we reorganized our counts to make our data comparable to theirs. Our counts are
compared to Baumol et. al. (2003: 31) in Table 1. The comparison shows a substantive
correspondence between the two data sets. The exact correspondence is not possible due
to the differences in search methods and industry classification. The order of industries
in terms of the frequency of layoffs (or downsizing as it is termed in Baumol et al
[2003]) roughly matches between the two counts. Manufacturing accounts for the
greatest part of the layoffs, followed by insurance and finance and retail and
miscellaneous services.
(Table 1 about here)
We also compared our data with Farber and Hallock’s (1999) count. They
counted the number of articles in the Wall Street Journal that included the words

26
“layoff,” “laid off,” “downsize,” “plant closing,” or “downsizing,” without any
reference to a specific firm. In a separate count, they limited the sample to the Fortune
500 firms that existed for the entire period of 1970 to 1997, and matched the firm names
to the announcements published in the newspaper. The pattern in our data corresponds
roughly to Farber and Hallock’s (1999, Figure 1) calculation.
There are several potential problems with all of the measures of layoffs. Since
they are based on newspaper accounts, we do not know if firms ever followed through
on their announcements. We also do not know the exact timing of the layoffs. So, if an
announcement was made in November of a particular year, the layoffs might not have
taken place until April of the next year. Finally, while firms frequently announced their
intention to lay off workers, they never announce their intention to hire new ones. So, it
is quite possible for firms to announce a layoff of 1,000 workers in one division and
then quietly hire 1,500 in another. So while the measure we use appears to correlate
highly with other scholars' attempts to do this, all of the measures may have significant
measurement error in them. Nevertheless, we measure and analyze the public
announcement of layoffs, rather than the actual occurrence, because we posit that
layoffs reflect the prevalence of shareholder value ideology. Coverage in business
media has an essential role in diffusion of specific management practices and culture
throughout the field.
Unionization rates were calculated from the weighted samples of the March
Current Population Surveys from 1984 to 2000. From each year’s sample, we selected
the civilian wage earners who were aged 18 to 64 employed in the private sector, and
excluded non-incorporated self-employed respondents. In each year, a question on the

27
respondents’ union membership was asked. The proportion of union members in each
industry was multiplied by 100 to obtain percentages.
Data on computer investment and corporate profits came from the Bureau of
Economic Analysis (BEA) data archive. Detailed estimates for private nonresidential
fixed assets by detailed industry and by detailed asset type are available on its website.4
Among various asset types, computers and the related assets were selected to calculate
the dollar amount of computer investment. Data on corporate profits and GDP were
also available from a BEA series “Gross Domestic Product by Industry and the
Components of Gross Domestic Income.”5
We use the ratio of industry profits to industry assets as a measure of the relative
profitability of industrial sectors. This measure captures the overall profitability of the
sector relative to its use of assets. We think this is a defensible measure as it gets at the
core financial criteria by which shareholder value is judged. It measures how well the
total assets of a sector are being deployed. We expect that sectors that have high or
rising ratios will be less likely to engage in financial reorganization, while we expect
sectors with low or declining ratios to be the target of mergers and layoffs.
Another potential measure of shareholder value is to calculate an aggregate
value of a sector based on stock prices. There are a few practical reasons why we chose
to use this measure rather than stock prices. Stock prices are limited to publicly held
companies. Since this study looks at industrial sectors, stock prices do not capture the
performance of all of the firms in any particular sector. There is also the fact that sectors
will be heterogeneous with respect to how many of the firms in the sector are publicly
4 http://www.bea.gov/bea/dn/faweb/Details/Index.html, accessed on January 20, 2004. 5 http://www.bea.gov/bea/dn2/gpo.htm, accessed on January 20, 2004.

28
listed. Thus, an aggregate measure of stock price will not accurately capture the value of
the sector. This will also be affected by the fact that those firms who are not publicly
listed will not pay attention to stock prices compared to firms that are. The sector wide
measure of profits divided by assets, on the other hand, is a clearer measure of the
relative performance of all of the firms in the sector.
Since the unit of analysis for this study is industry, one needs to control for the
different sizes of industries. We included a measure on Gross Domestic Product (GDP)
by industry as a control variable, which was available from the same source as corporate
profits. The GDP measure and the computer investment variable are in million dollars,
adjusted for inflation using the Consumer Price Index and transformed into logarithms.
Table 2 summarizes descriptive statistic for the variables used in the analysis.
(Table 2 about here)
The data set that we constructed has 1,054 observations which reflect the 62
industries for the 17 years (1984-2000). This constitutes a cross sectional time series
design. Depending on how one specifies the individual- and time-specific error terms in
the model, there are two main methods for panel data analysis, fixed-effects and
random-effects models. We used fixed-effects models, which allow us to control for all
time-constant, unobserved differences between industries without making the random-
effects assumption that these differences are independent of the observed regressors
(Allison, 1994; Greene, 1996).
6 The original data on corporate profits had values below zero (14.8% of the sample). To avoid taking
logs of negative values, we transformed the values linearly by adding the minimum (35672) and one
standard deviation (15525.92) of the distribution before taking the logarithms. Accordingly, interpreting
the results require caution.

29
An important advantage of cross sectional time series analysis is that it allows
the researchers to investigate the causal relationships in nonexperimental studies. With
repeated observations for each industry, we are able to discern the sequence of the
various events in time, which is impossible with cross-sectional data. We suppose that
changes in one element of economy rarely result in immediate consequences that are
simultaneously measured in the changes in the other. To resolve the problem of
reciprocal causation, we incorporated time lags into the model specification. The
independent variables are lagged one year. We also included in the model a lagged
dependent variable. This specification allows us to check the changes in the dependent
variable’s values from year t-1 to t, rather than the absolute values for each year. We
begin by estimating the basic model in the following form:
,1,21,10 itititiit xyy ενβββ ++++= −− (1)
where i indexes the 62 industries and t denotes the 16 years from 1985 to 2000. Due to
the inclusion of the lagged variables, the observations from 1984 contribute only
through the lagged values. iν is the industry-specific time-constant error, while itε is the
industry-specific and time-varying error. We extend the basic model to estimate the
effects of change scores:
,31,21,10 itiittitiit zxyy ενββββ +++++= −− (2)

30
where 1−−= ttit xxz . The estimates of the coefficient 3β show how much the dependent
variable changes when industries change from one value to the other in an independent
variable.
In the analysis that follows, we estimated separate equations to test each of the
different hypotheses. Five dependent variables were used in the separate equations:
merger and acquisition, layoff announcement, computer investment, unionization rate,
and corporate profits.
Results
It is useful to look at some disaggregated figures in order to understand the
general patterns of change for the variables used in the analysis. We have broken our
major variables down by major industry groups. The groups aggregate data across
industries and the four groups are manufacturing, trade and services, finance insurance,
and real estate (hereafter FIRE), and transportation, communication and utilities. These
are the conventional categories used by industrial organization economists when they
look at aggregate statistics. Figure 1 presents the change in GDP from 1984-2000. The
industries in the trade and service sectors and the FIRE sector were already larger on
average than manufacturing and transportation, communication, and utilities by 1984.
This figure shows the continued transformation of the American economy from a
manufacturing to a service and financial basis. Industries in trade and services and FIRE
grow continuously in average size over the entire period. Particularly impressive was
the large growth in FIRE.
(Figure 1 about here)
31
Figure 2 presents the average number of mergers within industry groups over
time. The general pattern is that mergers peaked in 1986, declined to a low in 1991, and
increased until 2000. This pattern corresponds to the two merger waves of the past 20
years (Sterns and Allan, 1996; Andrade, et al., 2001). There is interesting variation
across industries. During the merger wave of the 1980s, the FIRE sector led all sectors
in the average number of mergers. But, in the 1990s merger wave, trade and services
surpassed the FIRE sector. We note the computer software industry is included in the
trade and service sector and it experienced a huge consolidation during the late 1990s.
The FIRE services industries witnessed far more mergers than manufacturing and
transportation, communications, and utilities did, on average. The trade and service
sectors surpassed the other two sectors during the 1990s.
(Figure 2 about here)
Figure 3 presents data on layoff announcements over time. Here, we have the
greatest divergence in trends across industries. Manufacturing layoffs show three peaks:
circa 1985 during the deindustrialization phase, circa 1991 during the recession, and in
1998 during the last merger movement. FIRE layoffs peaked during the recession from
1988-1991 following the crash of the stock market in 1987. Generally, manufacturing
led the way in layoffs over the whole period. There were fewer discernible patterns of
layoffs in the other two industrial sectors. One of the most interesting features of the
figure is that during the great economic expansion from 1995-2000, there were
relatively high levels of layoffs in three of the industrial sectors (the exception being the
transportation, communications, and utilities sectors). This implies that a labor market
regime, one based on more churning of workers even good economic times was in place
(see Osterman, 1999).

32
(Figure 3 about here)
Figure 4 shows the decline in rates of unionization from 1984-2000. The greatest
declines in unionization occurred in the manufacturing sector where unions as a
percentage of the labor force fell from about 28% in 1984 to 14% in 2000. The rate of
unionization dropped steadily throughout the period. There was also a large drop in
unionization rates in the transportation, communication, and utilities sector. We think
this probably reflects the replacement of communication workers by computers over the
period. Here, rates of unionization fell from about 35% to 28% over the period. As one
might expected, there were very low rates of unionization in trade and services and
FIRE and these remained low throughout the period.
(Figure 4 about here)
Figure 5 shows investment in computer technology from 1984 until 2000. Rates
of investment were highest in the FIRE sector and rose over time. Rates rose in all three
other sectors, albeit from lower levels. The largest percentage increase in rates occurred
in the transportation, communications, and utilities sector. Here, the effects of
computers on the telecommunications industry can be observed directly.
(Figure 5 about here)
Figure 6 presents data on corporate profits over the period. The measure is the
ratio of profits in the sector over the assets in the sector. The FIRE sector has the most
volatile profits. The crash of the stock market in 1987 dramatically decreased profits in
the sector. But the merger movement and the booming real estate markets of the late
1990s propelled profit rates to the highest level of all of the industries. The other
industries had less volatile changes in their profits over time. Manufacturing had

33
relatively high and steady rates of profits over the entire period. The transportation,
communication, and utilities sector had the lowest rate of profits.
(Figure 6 about here)
Taken together, these figures tell a coherent story about what happened in the
American economy during the 1980s and 1990s. The FIRE and trade and service sectors
grew steadily over the period. FIRE was the most spectacularly successful sector at
increasing profits. Not surprisingly, the largest and fastest growing sectors also made
the largest investment in computer technology. There is also evidence of the spread of
shareholder value tactics across industries. The merger movements of the 1980s and
1990s affected all American industries. Thus, the rationalization of production occurred
in both fast growing and slow growing sectors. Patterns of layoffs differs the most
across industries reflecting the relative performance of the sectors. Manufacturing
layoffs followed deindustrialization and the turn down in the economy in the early
1990s. FIRE layoffs corresponded to the white collar downsizings of the late 1980s and
early 1990s which were related to the crash of the stock market in 1987 (Farber, 1997
documents this using Current Population Survey data). The most convergence in layoffs
occurred during the late 1990s when in a prosperous economy, layoffs rose
dramatically.7 This could have been because of the growing insecuritization of the work
force due to shareholder value strategies. It also could have reflected the high level of
mergers which could have produced layoffs. We will investigate these phenomena in
the regression analysis. Finally, unionized workers fared badly over the entire period.
7 Cappelli (2000) shows that since the 1980s the companies engaged in downsizing were not necessarily
in financial distress. He argued that this is evidence of downsizing driven by the desire to improve
operating efficiencies as opposed to more traditional downsizing driven by business cycles. Farber and
Hallock (1999) show similar findings.
34
They decreased in number in the manufacturing and transportation, communications,
and utilities sectors.
Table 2 presents descriptive statistics for the data set over the entire period. It
shows that mergers averaged 63 across industries over time. There were on average one
layoff announcement per industry, although this variable had a low of zero in as given
year and a high of 19 announcements. Union membership averaged about 16% over the
period. Returns on assets averaged 7.9%. This measure showed lots of variability and
ranged from a low of -40.12% to 60.9%.
Table 3 tests the various hypotheses put forward earlier. It is useful to go
through these results in some detail. The first panel of table 3 provides evidence on the
determinants of changes in mergers at the industry level. There is no support for
hypothesis 1 that low profits relative to assets in industrial sectors predict mergers as
suggested by the shareholder value perspective. This implies that mergers were
occurring in not just industries that were being consolidated because of their low
profitability, but also in industries where returns were normal. There is some evidence
in the model for the idea that mergers are occurring in industries going through hard
times. The only statistically significant effect in the model predicting changes in
mergers is the previous level and change in level of layoffs. Here, layoffs, which are
generally caused by poor economic conditions, are precursors to subsequent mergers.
8 Note that the effect of profits variable is significant only through the change variable (∆Profit) but not
through the level variable (profit(lag)). This means that regardless of the absolute level of profits, the drop
in profits was what drove mergers. We found that this is a recent trend. When we disaggregated the data
by the earlier (1984-1992) and the later (1993-2000) periods, mergers used to be dependent upon the level
of profitability, not the drop in profits, in the earlier period. Clearly, mergers were prevalent only among
big (high GDP) but less profitable industries. In the 1990s, however, this pattern reversed. Now the drop,
not the level, of profits determines mergers. See Table A in the Appendix for the regression results.
35
The second part of table 3 produces results predicting changes in layoffs. We see
evidence that industries with mergers and changes in mergers produce layoffs
confirming hypothesis 2. This is quite consistent with ideas about shareholder value.
Mergers were supposed to be carried out to rationalize production and remove layers of
workers. That in the year following mergers, such announcements appeared suggests
that shareholder value strategies were being practiced across industries. There is also
evidence that investments in computers also caused layoffs, consistent with hypothesis 3.
At the mean level of investment in computer technology, there are about 1.2 additional
layoff announcements in the following year. Given that the average number of layoffs in
a given year was only about 1 and that one layoff could involve hundreds, or sometimes
thousands, workers losing jobs, this is a huge effect. This means that capital investments
were being used by managers to reduce their work forces, consistent with hypothesis 3.
We earlier argued that layoffs were part of efforts to increase profitability. There
is a statistically significant effect of changes in the profit/asset ratio on the likelihood of
changes in layoffs. Here more profitable firms were less likely to lay people off,
confirming hypothesis 1. There is also a statistically significant effect of changes in
GDP on layoffs. Industries that were growing in size were less likely to announce
changes in layoffs. Taken together, these results imply that industries with firms who
were not performing well felt compelled to lay off workers either to raise their stock
price or to adjust to their business conditions, consistent with hypothesis 1.
The third column of Table 3 provides evidence for the causes of changes in
computer investment. Industries where mergers were high were more likely to invest in
computers. This provides a link between shareholder value, mergers, layoffs, and
computer investment as suggested in hypothesis 2. Managers in industries that were

36
doing less well laid off workers and they then often engaged in mergers. This caused
them to subsequently lay off more workers. Finally, investments in computer
technology were endogenous to this process. Firms that engaged in mergers were more
likely to invest in computers to further rationalize production. There is one other
interesting effect in the model that predicts changes in computer investment that appears
to index shareholder value tactics. Industries where there were high rates of
unionization also saw growth in computer investment. Managers in these industries
were trying to reorganize work to lower their dependence on unionized work forces
consistent with hypothesis 4.
While one of the causes of computer investment was certainly the spread of
shareholder value strategies to revive declining sectors, there is evidence that computer
investment was also favored by growing and profitable sectors. Firms that had high and
growing profit/asset ratios were more likely to invest in computer technology. This
presumably reflected their belief that they could grow their profits even more by
investing them in computer technology.
The fourth column of Table 3 explores the causes of de-unionization. There are
three variables that predict changes in the unionization rate. High profit sectors and
sectors with changes in profits see decline in their unionized work forces in the
subsequent year. This suggests that managers who are making money are also realizing
that one way to continue to do that is to decrease the size of their unionized labor. A
second important cause of de-unionization is the implementation of computer
technology. In industries with high computer investment, unionized workers decreased
substantially. The results imply that computer investment and de-unionization were
related to shareholder value strategies, consistent with hypothesis 4. Large sectors as

37
measured by GDP are actually more likely to see increases in their unionization rates in
the subsequent year.
The last column of Table 3 considers whether any of these changes produced
growth in profits. Here, the support for the success of shareholder value tactics is more
mixed. First, the strongest predictors of profit growth were the size of the industry and
the growth in the industry. Big and growing industries produced more profits. Given the
increase in the size of FIRE and trade and service sectors, it is not surprising, that their
profits grew the most. We see that levels and changes in mergers and layoffs negatively
affect profits. Thus, in industries where financial reorganization was occurring, the
reorganizations did not produce more profits subsequently. This suggests that in spite of
the rhetoric of maximizing shareholder value, these tactics failed to produce returns to
the bottom line. The result is consistent with findings of other studies using stock prices,
where mergers (Caves, 1989; Andrade, et al., 2001) and layoff announcements
(Blackwell, et. al., 1990; Worrell, et. al., 1991) had a negative impact on market values.
Firms who engage in mergers and layoffs clearly do not see subsequent success. There
is one variable that does appear related to shareholder value: computer investment.
Industries that invested in computers did show profit increases net of the other variables.
It is useful to return to our hypotheses. Hypothesis 1 tested the basic shareholder
value assertion that industries with profits should have reorganized. Low profits were
related to layoffs but not mergers. However, layoffs in a previous year (which were
presumably caused by low profits) were a harbinger of changes in merger activity. Low
profits did not cause de-unionization or investments in computer technology. However,
industries where there were mergers did make larger computer investments, suggesting

38
that when managers were trying to put together firms through mergers, they rationalized
work processes by investing in computer technology.
Hypothesis 2 implied that industries where mergers would occur would engage
in layoffs. Maximizing shareholder value implied buying up other firms and
rationalizing costs to increase profits by laying off workers. It also argued that mergers
should produce investment in computer technology in order to reorganize production.
This appears to be what was done. Hypotheses 3 and 4 suggested that such efforts
should be particularly aimed at unions. We do not have any direct evidence that mergers
or layoffs were directed at unionized work forces. However, we did find that investment
in computer technology did decrease unionization rates in line with the view that
managers were trying to rid themselves of high priced labor by investing in computer
technology. Finally, contrary to Hypothesis 5, we were not able to demonstrate that
mergers or layoffs increased profits. Indeed, they were related to fewer profits, not more.
We did find evidence that computer investment did increase profits at the industry level.
Conclusions
The American economy was transformed by the logic of shareholder value
during the 1980s and 1990s. Managers had pressure placed on them to increase profits
relative to assets. In order to do this, they engaged in mergers, downsized their labor
forces, and made computer investments which subsequently increased layoffs and
decreased unionized workforces. Mergers and layoffs per se did not help profitability.
The major causes of increased profits were the good fortune to be located in growing as
opposed to declining industries such as FIRE, trade and services and the increased use

39
of computer investments which created layoffs¸ decreased unionized labor forces, and
increased profits.
The most novel implication of our results is that the use of computer technology
was not an entirely exogenous change in American business but was part and parcel of
"maximizing shareholder value". While de-unionization and computerization were
going on in the American economy before 1980, the implementation of shareholder
value tactics like mergers pushed these processes forward. Computer technology was
being used strategically by managers who engaged in mergers to reorganize their work
forces. They deployed it to decrease their dependence on all workers as computer
technology caused both decreases in unionized workers and increases in layoff
announcements.
Another important result is that mergers and layoffs did not work to return ailing
industries to profit, a result that is consistent with the literature (Caves, 1989;
Ravenscraft and Scherer, 1987; Scherer and Ross, 1990; Andrade, et al., 2001). One
interesting question is why do firms pursue mergers and layoffs if they do not
subsequently help profits? There is a literature in financial economics (for a review, see
Jensen and Ruback, 1983) that shows that the buyers of firms rarely make money while
the sellers do so. Literature that compares the pre and post merger performance of firms
comes to the conclusion that the merged entities are not more profitable than the entities
that existed before the merger (Scherer and Ross, 1990). Our results are consistent with
the literature. This suggests that mergers and layoffs may be ritualistic and imitative and
do not produce efficient outcomes (for theoretical arguments, see Meyer and Rowan,
1977, DiMaggio and Powell, 1983). This is an issue worth exploring further.

40
Another useful avenue to explore is to try and explicitly link the changes in
industries that reflect reorganization to changes in how workers were treated. We think
that one can take a neomarxist view (e.g., Edwards, 1978) of what occurred in the U.S.
economy over the period. Firms were under pressure to make more profits. Maximizing
shareholder value and minimizing the importance of employees is a not so veiled way to
try and increase profits by reducing the power of workers. Our results show that the
efforts to make more profits were focused on using mergers, layoffs, and computer
technology to reorganize and remove unionized labor forces. The data suggest that
workers were certainly being treated less like stakeholders and more like factors of
production.
There is quite a bit of speculation about how shareholder value tactics translate
into the reorganization of work more generally and making workers more insecure
(Osterman, 1999; Gordon, 1996; for a review see Fligstein and Shin, 2004). We think
that our data can link mergers and layoffs to changes in various other aspects of
working conditions at the sector level such as aggregate fear of layoffs, and decreases in
health insurance and pension coverage. We may also be able to directly observe higher
rates of labor turnover and perhaps changes in hours of work at the industry level as
well as sectors were being reorganized. We think this kind of linkage would provide a
"smoking gun" for why labor markets became more insecure and less lucrative for
workers.
We think it would be useful to consider how these processes played out in
different societies. The shift from manufacturing to services, changes in rates of
unionization, and increases in the use of technology certainly effected corporations in
other societies. It is well known that in the advanced industrial societies that the

41
relationships between owners, managers, financial markets, and workers are quite
different and the push to "maximize shareholder value" generally did not occur (for
example, see the papers in Hall and Soskice, 2001; for a review see La Porta, et. al.,
1998). Many of the most negative effects of industrial reorganization are mediated
through laws that protect workers and force firms to absorb much of the cost of
reorganization. An interesting question is to ask how European and Asian firms
undertook these same kinds of reorganizations without undermining their distinctive
capitalist structures.
Finally, an agency theorist might look at our results and generally conclude that
the tactics to "maximize shareholder value" worked. They pushed managers to
rationalize their production, lay off redundant workers, make technology investments,
and thereby take advantage of whatever opportunities their industry had. A more critical
view (perhaps, a more Marxist one) would look at this and decide that shareholder value
is a form of renewed class struggle. The owners and managers of capital decided to
systematically break unions and invest in computer technology in order to increase
profits. Both might be right.

42
References
Allison, P. 1994. “Using panel data to estimate the effects of events.” Sociological Methods and Research. 23(2):174-199. Andrade, G., M. Mitchell., and E. Stafford. 2001. "New evidence and perspectives on mergers." Journal of Economic Perspectives 15(2): 103-120. Appelbaum, E. and P. Berg. 1996. "Financial market constraints and business strategy in the U.S." In J. Michael and J. Smith (Ed). Creating Industrial Capacity: Towards Full Employment. New York: Oxford University Press, 193-221. Attewell, P. 1987. "The de-skilling controversy.” Work and Occupations 14:323-46. Autor, D., R. Murnane and F. Levy. 2002. "Upstairs downstairs: Computers and skills on two floors of a large bank." Industrial and Labor Relations Review 55 (3):432-447. Baker, G., and G. Smith. 1998. The New Financial Capitalists: Kohlberg Kravis Roberts and the Creation of Corporate Value. Cambridge, UK ; New York: Cambridge University Press. Baumol, W., A. Blinder, and E. Wolff. 2003. Downsizing in America: Reality, Causes, and Consequences. New York: Russell Sage. Black. S.E., and L.M. Lynch. 2001. "Have to compete: The Impact of workplace practices and information technology on productivity." The Review of Economics and Statistics 83(3): 434-445. Blackwell, David, M. Wayne Marr, and Michael F. Spivey. 1990. “Plant-Closing Decisions and the Market Value of the Firm.” Journal of Financial Economics 26: 277-288. Bluestone, B. and B. Harrison. 1982. The Deindustrialization of America. New York: Basic Books.

43
Braverman, H. 1974. Labor and Monopoly Capital: The Degradation of Work in the Twentieth Century. New York: Monthly Review Press. Bresnahan, T., E. Brynjolfsson, and L. Hitt. 2002. "Information technology, workplace organization and the demand for skilled labor: Firm-level evidence." Quarterly Journal of Economics 117(1): 339-376. Bronfenbrenner, K., and T. Juravich. 1998. "It takes more than house calls: organizing to win with a comprehensive union-building strategy." in Organizing to Win: New Research on Union Strategies. Edited by K. Bronfenbrenner, S. Friedman, R.W. Hurd, R.A. Oswald, and R.L. Seeber. Ithaca, NY: ILR/Cornell University Press. Brynjolfsson, E., and L.M. Hitt. 2000. "Beyond competition: Information technology, organizational transformation and business performance." Journal of Economic Perspectives 14(4): 23-48. Cappelli, P. 2000. “Examining the incidence of downsizing and its effect on establishment performance.” in On the Job: Is Long-Term Employment a Thing of the Past? Edited by David Neumark. New York: Russell Sage Foundation. Card, D. 1996. "The effects of unions on the structure of wages: a longitudinal analysis." Econometrica 64(4): 957-979. Card, D. and J. DiNardo. 2002. "Skill based technological change and rising wage inequality: some problems and puzzles." Journal of Labor Economics 20(4):733-783. Carroll, G. and M. Hannan. 2001. The Demography of Corporations and Industry. Princeton, N.J.: Princeton University Press. Caves, R. 1989. "Mergers, takeovers, and economic efficiency: foresight vs. hindsight." International Journal of Industrial Organization 7:151-74. Clawson, D., and M.A. Clawson. 1999. "What has happened to the US labor movement? Union decline and renewal." Annual Review of Sociology 25:95-119.

44
Davis, G. 1991. "Agents without Principles: The Spread of the Poison Pill Through the Intercorporate Network." Administrative Science Quarterly 36: 583-613. -----------, K. A. Diekmann, and C. Tinsley. 1994. "The Decline and Fall of the Conglomerate Firm in the 1980s: The Deinstitutionalization of an Organizational Form." American Sociological Review 59:547-570. ------------ and S. Stout. 1992. "Organization theory and the market for corporate control, 1980-1990." Administrative Science Quarterly 37:605-33. ------------ and T. Thompson. 1994. "A social movement perspective on corporate control." Administrative Science Quarterly 39:171-93. Dial, J., and K. Murphy. 1994. "Incentives, downsizing, and value creation at General Dynamics." Journal of Financial Economics 37:261-314. DiMaggio, P. and W. Powell. 1983. "The iron case revisited: Institutional isomorphism and collective rationality in organizational fields" American Sociological Review 48: 147-60. Dobbin, F., J. Dierkes, and D. Zorn. 2003. "The Rise of the COO: From Luxury Sidekick to a Significant Player in Corporate Management." in American Sociological Association Annual Meeting. Atlanta. Edwards, R. 1978. Contested Terrain. New York: Basic Books. Farber, H. 1997. "The changing face of job loss in the U.S., 1981-95." Brookings Paper on Economic Activity: Microeconomics, pp. 55-142. -----------, and K. Hallock. 1999. “Have employment reductions become good news for shareholders?: The effect of job loss announcements on stock prices, 1970-1997.” Working Paper 7295. Cambridge, MA: National Bureau of Economic Research. Fernandez, R. 2001. "Skill-biased technological change and wage inequality: Evidence from a plant retooling." American Journal of Sociology 107(2):273-320.
45
Form, W., R.L. Kaufman, T.L. Parcel, and M. Wallace. 1988. "The impact of technology on work organization and work outcomes: A conceptual framework and research agenda." in Industries, Firms, and Jobs: Sociological and Economic Approaches. Edited by G. Farkas and P. England. New York: Plenum Press. Freeman, R. 1993. "How much has de-unionization contributed to the rise in male earnings inequality". In S. Danziger and P. Gottschalk (ed.) Uneven Tides. New York: Russell Sage. Fligstein, N. 1990. The Transformation of Corporate Control. Cambridge, MA: Harvard University Press. --------------. 2001. The Architecture of Markets : An Economic Sociology of Twenty-First- Century Capitalist Societies. Princeton, N.J.: Princeton University Press. -------------- and L. Markowitz. 1993. "Financial Reorganization of American Corporations in the 1980s." Pp. 185-206 in Sociology and the Public Agenda, edited by William J. Wilson. Newbury Park: Sage. -------------- and T. Shin. 2004. "The shareholder value society: a review in changes in working conditions in the U.S., 1976-2000." In K. Neckerman (ed.) Social Inequality. New York: Russell Sage. Friedman, B., ed. 1985. Corporate Capital Structures in the United States. Chicago: University of Chicago Press. Goldfield, M. 1987. The Decline of Organized Labor in the United States. Chicago: University of Chicago Press. Gordon, D. 1996. Fat and Mean: The Corporate Squeeze of Working Americans and the Myth of Downsizing. New York: Free Press. Greene, W. 1996. Econometric Analysis. Upper Saddle River, N.J.: Prentice Hall. Hall, P. and D. Soskice. 2001. Varieties of Capitalism. Oxford, Eng.: Oxford University Press.

46
Hallock, K. 1998. “Layoffs, Top Executive Pay, and Firm Performance.” American Economic Review 88(4): 711-723. Hirsch, P. 1986. "From ambushes to parachutes: Corporate takeovers as an instance of cultural framing and institutional integration." American Journal of Sociology 91: 800-37. Hammer, M. and J. Champy. 1993. Reengineering the Corporation: A Manifesto for Business. New York, NY: Harper Business. Harrison, B. and B. Bluestone. 1988. The Great U-Turn: Corporate Restructuring and the Polarizing of America. New York: Basic Books. Haunschild, P. 1993. "Interorganizational Imitation: The Impact of Interlocks on Corporate Acquisition Activity." Administrative Science Quarterly 38:564-592. Jensen, M. 1989. "The eclipse of the public corporation." Harvard Business Review 67:61-73. ----------- and W. Meckling. 1976.”Theory of the Firm: Managerial Behavior, Agency Cost, and Ownership Structure.” Journal of Financial Economics 3: 305-360. ----------- and R. Ruback. 1983. "The market for corporate control: the scientific evidence." Journal of Financial Economics 11:5-50. Kelley, M. 1994. "Productivity and information technology: The elusive connection." Management Science 40(11):1406-1425. Kochan, T., H. Katz, and R. McKersie. 1994. The Transformation of American Industrial Relations. Ithaca, NY: Cornell University Press. Krueger, A. 1993. "How Computers Have Changed the Wage Structure: Evidence from Microdata, 1984-1989." Quarterly Journal of Economics 108:33-60.

47
La Porta, R., F. Lopez-de-Silanes, and A. Shleifer. 1999. "Corporate ownership around the world." Journal of Finance 54:471-517. Liker, J., C. Haddad, and J. Karlin. 1999. "Perspectives on technology and work organization." Annual Review of Sociology 25:575-596. Marx, K. 1990. Capital, Vol. 1. New York: Penguin. McLean, B. and P. Elkind. 2003. The Smartest Guys in the Room. New York: Penguin.- Medoff, J. 1979. "Layoffs and Alternatives under Trade Unions in U.S. Manufacturing." American Economic Review 69(3): 380-98. Meyer, J. and B. Rowan. 1977. "Institutionalized organizations: formal structure as myth and ceremony." American Journal of Sociology 83: 340-63. Mishel, L., J. Bernstein, and H. Boushey. 2003. The State of Working America: 2002/2003. Ithaca, NY: Cornell University Press. Montgomery, M. 1991. “New Evidence on Unions and Layoff Rates.” Industrial and Labor Relations Review 44:708-721. Osterman, P. 1999. Securing Prosperity. Princeton, N.J.: Princeton University Press. Pralahad, C.K., and G. Hamel. 1990. “The Core Competencies of the Corporation.” Harvard Business Review 68(3): 79-91. ProQuest. 1984-2000. Proquest Newspapers: Electronic Database. Ann Arbor, MI: Proquest Company. Ravenscraft, D. and F. Scherer. 1987. Mergers, Selloffs, and Economic Efficiency. Washington, D.C.: Brookings Institution. Rosenberg, N. 1982. Inside the Black Box: Technology and Economics. Cambridge: Cambridge University Press.

48
Scherer, F. 1988. "Corporate takeovers: The efficiency arguments." Journal of Economic Perspectives 2(1):69-82. Scherer, F. and D. Ross. 1990. Industrial Market Structure and Economic Performance. Boston: Houghton Mifflin. Shleifer, A., and L. Summers. 1988. "Breach of trust in hostile takeovers." in Corporate Takeovers: Causes and Consequences. Edited by A. Auerbach. Chicago: University of Chicago Press. Stearns, L., and K. Allan. 1996. “Economic Behavior in Institutional Environments: The Corporate Merger Wave of the 1980s.” American Sociological Review 61:699-718. Taplin, I. 1995. "Flexible Production, Rigid Jobs: Lessons from the Clothing Industry." Work and Occupations 22(4): 412-38. Useem, M. 1993. Executive Defense: Shareholder Power and Corporate Reorganization. Cambridge, Mass.: Harvard University Press. Walther, T. 1997. Reinventing the CFO: Moving from Financial Management to Strategic Management. New York: McGraw-Hill. Westphal, J., and E. Zajac. 2001. "Decoupling policy from practice: The case of stock repurchase programs." Administrative Science Quarterly 46(2):202-228. Whitley, R. 1986. "The Transformation of Business Finance into Financial Economics: The Roles of Academic Expansion and Changes in U.S. Capital Markets." Accounting, Organizations and Society 11:171-192. Wolff, E. 2002. "Computerization and structural change." Review of Income and Wealth 48(1):59-75. Worrell, Dan L., Wallace N. Davidson III, and Varinder M. Sharma. 1991. “Layoff Announcements and Stockholder Wealth.” Academy of Management Journal 34:662-678.
49
Zorn, D. 2004. "Here a chief, there a chief: The rise of the CFO in the American firm." American Sociological Review 69(3):345-364. Zorn, D., F. Dobbin, J. Dierkes, and M. Kwok. forthcoming. "Managing investors: how financial markets shaped the American firm" In K. Knorr Cetina and A. Preda (ed.) The Sociology of Financial Markets. London: Oxford University Press. Zuckerman, E. 1999. "The Categorical Imperative: Securities Analysts and the Illegitimacy Discount." American Journal of Sociology 104:1398-1438. -----------------. 2000. "Focusing the Corporate Product: Securities Analysts and De-Diversification." Administrative Science Quarterly 45:591-619.

50
Appendix Industry Titles used in the Analysis 1987 SIC Industry Titles 10 Metal Mining 11, 12 Coal Mining 13 Oil and Gas Extraction 14 Nonmetallic Minerals Mining 15, 16, 17 Construction 20 Food and Allied Products 21 Tobacco Products 22 Textile Mill Products 23 Apparel and Finished Fabrics 24 Lumber and Wood Products 25 Furniture and Fixtures 26 Paper and Allied Products 27 Printing and Publishing 28 Chemicals and Allied Products 29 Petroleum Refining 30 Rubber and Plastic Products 31 Leather and Leather Products 32 Stone, Clay, Glass& Concrete 33 Primary Metals Industries 34 Fabricated Metal Products 35 Machinery, Except Electrical 36 Electrical and Electronic Machinery 37 Transportation Equipment 38 Photo, Medical and Optical Instruments 39 Miscellaneous Manufacturing 40 Railroad Transportation 41 Local and Intercity Transit 42 Motor Freight Transportation 44 Water Transportation 45 Air Transportation

51
46 Pipelines, Except Natural Gas 47 Transportation Services 48 Communication 49 Electric, Gas and Water Services 50, 51 Distribution and wholesale trade 52 Building Materials 53 General Merchandise Stores 54 Food Stores 55 Auto Dealers and Service Stations 56 Apparel and Accessory Stores 57 Furniture and Home Furnishing Stores 58 Eating and Drinking Places 59 Miscellaneous Retail 60 Banking 61 Credit Agencies 62 Security and Commodity Brokers 63, 64 Insurance 65 Real Estate 67 Holding and Investment Companies 70 Hotels and Lodging Places 72 Personal Services 73 Business Services 75 Automotive Services 76 Miscellaneous Repair Services 78 Motion Pictures and Video 79 Amusement and Recreation Services 80 Health Services 81 Legal Services 82 Educational Services 83 Social Services 86 Membership Organizations 87, 89 Engineering and Management Services, Miscellaneous Services

52
Table 1. A Comparison of the Layoff Counts with Baumol, Blinder, and Wolff (2003).
Wall Street
Journal Baumol et al
(2003) Industry Count Percent Count PercentInsurance and finance 39 11.9 48 16.4Telecom 20 6.1 15 5.1Airlines 9 2.7 9 3.1Oil and gas 8 2.4 10 3.4Utilities 13 4.0 5 1.7Manufacturing 184 56.1 179 61.3
Metals manufacturing & mining 8 2.4 7 2.4Aerospace & auto 36 11.0 41 14.0Foods, beverages, tobacco 15 4.8 26 8.9Computers, electronics 23 7.0 28 9.6Pharmaceuticals 12 3.7 13 4.5Misc manufacturing 90 27.4 64 21.9
Railroads 2 .6 5 1.7Retail and misc services 44 13.4 21 7.2Others 9 2.7 0 0.0Total 328 100.0 292 100.0 Source: Authors' compilation and Baumol et al (2003: 31).

53
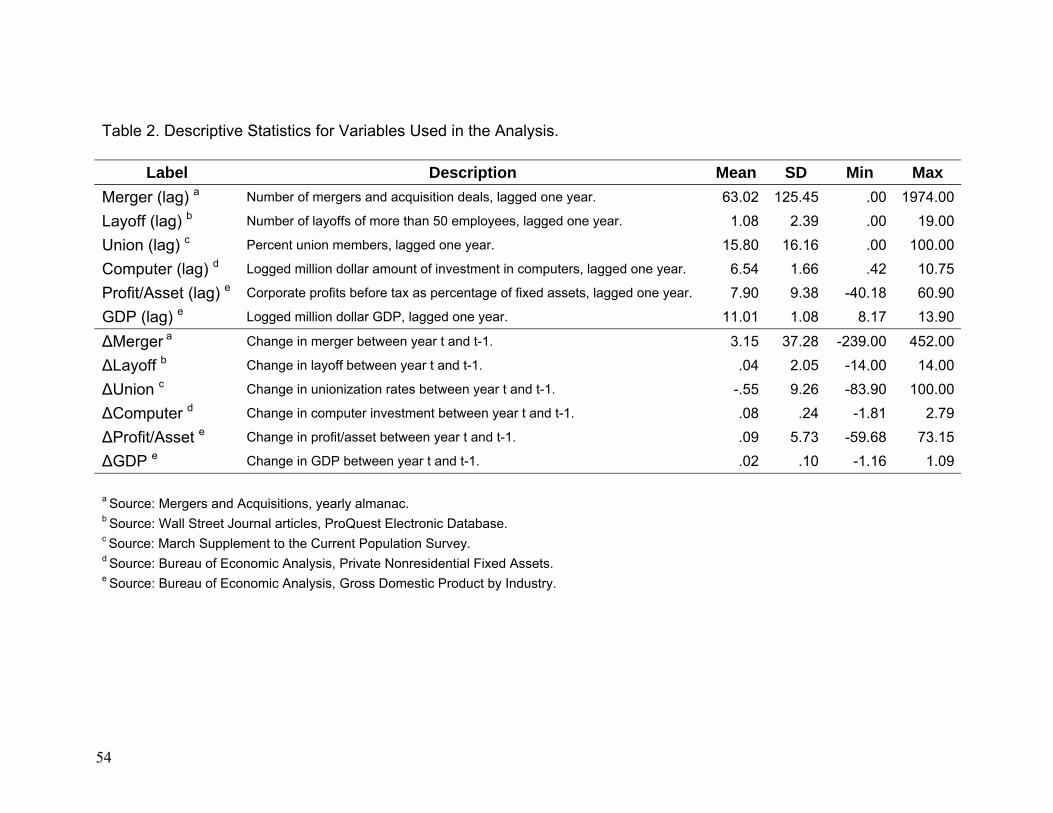
54
Table 2. Descriptive Statistics for Variables Used in the Analysis.
Label Description Mean SD Min Max Merger (lag) a Number of mergers and acquisition deals, lagged one year. 63.02 125.45 .00 1974.00
Layoff (lag) b Number of layoffs of more than 50 employees, lagged one year. 1.08 2.39 .00 19.00
Union (lag) c Percent union members, lagged one year. 15.80 16.16 .00 100.00
Computer (lag) d Logged million dollar amount of investment in computers, lagged one year. 6.54 1.66 .42 10.75
Profit/Asset (lag) e Corporate profits before tax as percentage of fixed assets, lagged one year. 7.90 9.38 -40.18 60.90
GDP (lag) e Logged million dollar GDP, lagged one year. 11.01 1.08 8.17 13.90
∆Merger a Change in merger between year t and t-1. 3.15 37.28 -239.00 452.00
∆Layoff b Change in layoff between year t and t-1. .04 2.05 -14.00 14.00
∆Union c Change in unionization rates between year t and t-1. -.55 9.26 -83.90 100.00
∆Computer d Change in computer investment between year t and t-1. .08 .24 -1.81 2.79
∆Profit/Asset e Change in profit/asset between year t and t-1. .09 5.73 -59.68 73.15
∆GDP e Change in GDP between year t and t-1. .02 .10 -1.16 1.09 a Source: Mergers and Acquisitions, yearly almanac. b Source: Wall Street Journal articles, ProQuest Electronic Database. c Source: March Supplement to the Current Population Survey. d Source: Bureau of Economic Analysis, Private Nonresidential Fixed Assets. e Source: Bureau of Economic Analysis, Gross Domestic Product by Industry.

55
Table 3. Regression of Merger, Layoff, Computer Investment, Unionization Rate, and Profits, 1984-2000: Fixed Effects Models. Dependent Variable Merger Layoff Computer Unionization Profits Merger (lag) 1.123 (.014) ** .003 (.001) ** .0002 (.000) * -.001 (.003) -.006 (.002) ** Layoff (lag) 1.789 (.843) * .084 (.033) * -.006 (.006) -.117 (.210) -.239 (.112) * Computer (lag) -2.501 (1.902) .177 (.081) * .880 (.012) ** -2.546 (.416) ** .044 (.268) Union (lag) .025 (.190) -.005 (.009) .004 (.001) ** .168 (.032) ** -.043 (.027) Profit/Asset (lag) .147 (.255) -.013 (.012) .004 (.002) ** -.131 (.057) * .404 (.030) ** GDP (lag) -8.487 (7.300) .079 (.348) .138 (.048) ** 3.209 (1.624) * 4.674 (1.015) ** ∆Merger ─ ─ .003 (.002) * -.0001 (.000) -.002 (.007) -.005 (.005) ∆Layoff 1.174 (.591) * ─ ─ .003 (.005) -.026 (.154) -.203 (.097) * ∆Computer -2.739 (4.948) .160 (.236) ─ ─ .949 (1.102) 1.702 (.693) * ∆Union -.032 (.148) -.001 (.007) .001 (.001) ─ ─ -.043 (.021) * ∆Profit/Asset -.263 (.235) -.023 (.011) * .004 (.002) * -.107 (.052) * ─ ─ ∆GDP 13.317 (12.371) -1.231 (.589) * .138 (.082) # 4.308 (2.753) 22.231 (1.577) ** Constant 101.636 (77.324) -1.023 (3.689) -.766 (.515) -4.996 (17.238) -46.205 (10.769) ** Sigma_u 14.016 1.571 .136 10.822 6.766 Sigma_e 32.646 1.556 .218 7.271 4.587 N 992 992 992 992 992 Standard errors in parentheses. ** p<.01, * p<.05 (two-tailed tests), # p<.05 (one-tailed tests)

56
ManufacturingTrans. Comm. Util.
Trade. Service
FIRE
9.5
10
10.5
11
11.5
12
12.5
1984
1985
1986
1987
1988
1989
1990
1991
1992
1993
1994
1995
1996
1997
1998
1999
2000
Year
Logg
ed M
illio
n D
olla
rs (M
ean)
Figure 1. Mean Dollar Amount of Gross Domestic Product by Industry Groups. Source: Bureau of Economic Analysis, Gross Domestic Product by Industry Data.

57
Manufacturing
Trans. Comm. Util.
Trade. Service
FIRE
0
20
40
60
80
100
120
140
160
180
1984
1985
1986
1987
1988
1989
1990
1991
1992
1993
1994
1995
1996
1997
1998
1999
2000
Year
Num
ber o
f Mer
ger D
eals
(Mea
n)
Figure 2. Mean Number of Merger Deals by Industry Groups. Source: Mergers and Acquisitions, 1984-2000.

58
Manufacturing
Trans. Comm. Util.
Trade. Service
FIRE
0
1
2
3
4
1984
1985
1986
1987
1988
1989
1990
1991
1992
1993
1994
1995
1996
1997
1998
1999
2000
Year
Num
ber o
f Lay
offs
(Mea
n)
Manufacturing
Trans. Comm. Util.
Trade. Service
FIRE
Figure 3. Mean Number of Layoffs by Industry Groups. Source: Author’s compilation from the Wall Street Journal articles, ProQuest electronic database.

59
Manufacturing
Trans. Comm. Util.
Trade. Service
FIRE0
10
20
30
40
1984
1985
1986
1987
1988
1989
1990
1991
1992
1993
1994
1995
1996
1997
1998
1999
2000
Year
Perc
ent U
nion
Mem
bers
(Mea
n)
Figure 4. Mean Percent Union Members by Industry Groups. Source: March Current Population Survey, 1984-2000.

60
Manufacturing
Trans. Comm. Util.
Trade. Service
FIRE
0
2
4
6
8
10
1984
1985
1986
1987
1988
1989
1990
1991
1992
1993
1994
1995
1996
1997
1998
1999
2000
Year
Logg
ed M
illio
n D
olla
rs (M
ean)
Figure 5. Mean Dollar Amount of Computer Investment divided by GDP, by Industry Groups. Source: Bureau of Economic Analysis, Private Nonresidential Fixed Assets by Detailed Industry by Detailed Asset Type.

61
Manufacturing
Trans. Comm. Util.
Trade. Service
FIRE
0
5
10
15
20
25
1984
1985
1986
1987
1988
1989
1990
1991
1992
1993
1994
1995
1996
1997
1998
1999
2000
Year
Cor
pora
te P
rofit
s as
Per
cent
age
of F
ixed
Ass
ets
(%)
Figure 6. Corporate Profits Before Tax as Percentage of Fixed Assets, by Industry Groups. Source: Bureau of Economic Analysis, Gross Domestic Product by Industry Data and Private Nonresidential Fixed Assets by Detailed Industry by Detailed Asset Type.


