
NASA/TP-2002-
211943
Simulation Study of Impact of Aeroelastic Characteristics on Flying Qualities of a High Speed Civil Transport
David L. Raney, E. Bruce Jackson, and Carey S. Buttrill
Langley Research Center, Hampton, Virginia
October 2002

The NASA STI Program Office . . . in Profile
Since its founding, NASA has been dedicated to the advancement of aeronautics and space science. The NASA Scientific and Technical Information (STI) Program Office plays a key part in helping NASA maintain this important role.
The NASA STI Program Office is operated by Langley Research Center, the lead center for NASA
’
s scientific and technical information. The NASA STI Program Office provides access to the NASA STI Database, the largest collection of aeronautical and space science STI in the world. The Program Office is also NASA
’
s institutional mechanism for disseminating the results of its research and development activities. These results are published by NASA in the NASA STI Report Series, which includes the following report types:
•
TECHNICAL PUBLICATION. Reports of completed research or a major significant phase of research that present the results of NASA programs and include extensive data or theoretical analysis. Includes compilations of significant scientific and technical data and information deemed to be of continuing reference value. NASA counterpart of peer-reviewed formal professional papers, but having less stringent limitations on manuscript length and extent of graphic presentations.
•
TECHNICAL MEMORANDUM. Scientific and technical findings that are preliminary or of specialized interest, e.g., quick release reports, working papers, and bibliographies that contain minimal annotation. Does not contain extensive analysis.
•
CONTRACTOR REPORT. Scientific and technical findings by NASA-sponsored contractors and grantees.
•
CONFERENCE PUBLICATION. Collected papers from scientific and technical conferences, symposia, seminars, or other meetings sponsored or co-sponsored by NASA.
•
SPECIAL PUBLICATION. Scientific, technical, or historical information from NASA programs, projects, and missions, often concerned with subjects having substantial public interest.
TECHNICAL TRANSLATION. English-language translations of foreign scientific and technical material pertinent to NASA
’
s mission.
Specialized services that complement the STI Program Office
’
s diverse offerings include creating custom thesauri, building customized databases, organizing and publishing research results . . . even providing videos.
For more information about the NASA STI Program Office, see the following:
•
Access the NASA STI Program Home Page at
http://www.sti.nasa.gov
•
Email your question via the Internet to [email protected]
•
Fax your question to the NASA STI Help Desk at (301) 621-0134
•
Telephone the NASA STI Help Desk at (301) 621-0390
•
Write to:NASA STI Help DeskNASA Center for AeroSpace Information7121 Standard DriveHanover, MD 21076-1320
National Aeronautics andSpace Administration
Langley Research CenterHampton, Virginia 23681-2199
NASA/TP-2002-
211943
Simulation Study of Impact of Aeroelastic Characteristics on Flying Qualities of a High Speed Civil Transport
David L. Raney, E. Bruce Jackson, and Carey S. Buttrill
Langley Research Center, Hampton, Virginia
October 2002

Available from:
NASA Center for AeroSpace Information (CASI) National Technical Information Service (NTIS)7121 Standard Drive 5285 Port Royal RoadHanover, MD 21076-1320 Springfield, VA 22161-2171(301) 621-0390 (703) 605-6000
The use of trademarks or names of manufacturers in this report is for accurate reporting and does not constitute anofficial endorsement, either expressed or implied, of such products or manufacturers by the National Aeronautics andSpace Administration.
iii
Contents
Nomenclature.....................................................................................................................................................viiSummary .............................................................................................................................................................. 1Introduction.......................................................................................................................................................... 1Test Objectives and Approach ............................................................................................................................ 2Experimental Design and Apparatus .................................................................................................................. 3
Aeroelastic HSCT Simulation Model............................................................................................................. 3General Configuration Description, Propulsion, and Gear Models.......................................................... 3Dynamic Aeroservoelastic Model.............................................................................................................. 4Control Laws .............................................................................................................................................. 4
Variation of Dynamic Aeroelastic Characteristics ........................................................................................ 5Variation of Structural Stiffness ................................................................................................................ 5Variation of Modal Damping..................................................................................................................... 6Elimination of Control Excitation of Selected Modes .............................................................................. 7Elimination of DASE Visual Cues ............................................................................................................ 8Variation of Turbulence Level ................................................................................................................... 8Test Matrix and Evaluation Procedure ...................................................................................................... 8
Evaluation Maneuvers .................................................................................................................................... 9Nominal Approach and Landing................................................................................................................ 9IAG Lateral Offset Landing ....................................................................................................................... 9Composite Flight Director Tracking........................................................................................................ 10
Data Collected............................................................................................................................................... 10Transcribed Cooper-Harper Ratings and Comments .............................................................................. 10ASE Ride Quality and Control Influence Ratings................................................................................... 10Digital Time Histories .............................................................................................................................. 11Videotape Recordings .............................................................................................................................. 11
Langley Visual Motion Simulator ................................................................................................................ 12Cab Arrangement and Control Inceptor................................................................................................... 12Visual Projection and Display Formats ................................................................................................... 12Motion Characteristics and Responses .................................................................................................... 12
Results and Discussion...................................................................................................................................... 14Configuration Rankings by Pilot Preference Based on DASE Ratings ...................................................... 14
DASE Ride Quality Ratings Versus Pilot Preference............................................................................. 14Control Influence Ratings Versus Pilot Preference................................................................................. 15
Biodynamic Coupling ................................................................................................................................... 15Configuration Ranking Based on Cooper-Harper Ratings .......................................................................... 17Impact of Structural Stiffening ..................................................................................................................... 18Impact of Display Compensation ................................................................................................................. 18Impact of Damping Level ............................................................................................................................. 19Impact of Cancellation.................................................................................................................................. 19Impact of Increasing Turbulence Level........................................................................................................ 20Correlation of Ride Quality Ratings With Cockpit Vibration Spectra........................................................ 20
Concluding Remarks ......................................................................................................................................... 21Appendix A—Test Pilot Biographies ............................................................................................................... 60Appendix B—Flight Cards................................................................................................................................ 61Appendix C—HUD Symbology ....................................................................................................................... 68Appendix D—Flight Director Implementation for Task 3115 ........................................................................ 74References.......................................................................................................................................................... 78

iv
v
List of Tables
Table 1. Modal Frequencies for Stiffened Configuration............................................................................. 23Table 2. Damping Levels and Targeted Modes for Damped Configurations .............................................. 23Table 3. Description of Modal-Cancellation Portion of Test Matrix ........................................................... 23Table 4. Parametric Configurations Used in LaRC.3 Simulation Experiment ............................................ 24Table 5. Randomized Order of Configuration Evaluations .......................................................................... 25Table 6. CHRs Assigned by Test Pilots to Task Segment 1 for Each Configuration and
Maneuver Task............................................................................................................................................. 26Table 7. CHRs Assigned by Test Pilots to Task Segment 2 for Each Configuration and
Maneuver Task............................................................................................................................................. 28Table 8. CIRs and RQRs Provided by Test Pilots for Each Configuration and Maneuver Task................ 29Table 9. Pilot Preference Ranking for Configuration Based on Average DASE CIR and
RQR Scores .................................................................................................................................................. 31Table 10. Pilot Preference Ranking for Configuration Based on Average CHR Scores and
Ranking Based on Average DASE Scores.................................................................................................. 32Table 11. Results for Configurations With and Without Display Compensation.......................................... 33Table 12. Effect of Turbulence Variation on Average CHR, CIR, and RQR Values.................................... 33Table D1. Flight-Path Angle and Heading Angle Command Sequences for Go-Around Plus
Spiral Descent Task...................................................................................................................................... 74Table D2. Flight-Path Angle and Heading Angle Command Sequences for Glide-Slope
Intercept Task............................................................................................................................................... 75Table D3. Flight-Path Angle and Heading Angle Command Sequences for Localizer
Intercept Task............................................................................................................................................... 75Table D4. Values of Time Constants................................................................................................................ 76
List of Figures
Figure 1. Potential dynamic aeroelastic solutions that were examined. ..................................................... 34Figure 2. Reference-H configuration arrangement. ..................................................................................... 34Figure 3. Mode shapes and in vacuo frequencies for baseline dynamic aeroelastic model. ...................... 35Figure 4. Migration of elastic mode poles with structural stiffness variation. ........................................... 35Figure 5. Migration of the dynamic elastic poles with varying damping level. ......................................... 36Figure 6. Frequency response of normal acceleration at pilot station to elevator inputs
for various damping modes.......................................................................................................................... 36Figure 7. Migration of transfer function zeros of dynamic elastic modes with elimination
of control excitation. .................................................................................................................................... 37Figure 8. Effect of eliminating control excitation of first symmetric and first antisymmetric
modes on frequency response to elevator inputs. ....................................................................................... 37Figure 9. Task definition and performance tolerances for nominal approach and landing........................ 38Figure 10. Cooper-Harper flying qualities rating scale and definition of associated terminology. ............. 39Figure 11. Supplemental pilot rating scales developed to target pilot opinion of DASE effects................. 40Figure 12. Composite video image recorded during all piloted evaluations. ............................................... 40Figure 13. External view of Langley Visual Motion Simulator.................................................................... 41Figure 14. Frequency response of Langley Visual Motion Simulator as documented
in reference 8. ............................................................................................................................................... 42Figure 15. Time history of commanded and actual vertical accelerations recorded during
aeroelastic maneuver task. ........................................................................................................................... 43Figure 16. Time history of commanded and actual lateral accelerations recorded during
aeroelastic maneuver task. ........................................................................................................................... 44
vi
Figure 17. Pilot preference ranking of parametric aeroelastic configurations based onDASE ratings................................................................................................................................................ 45
Figure 18. Average ride quality rating versus overall pilot preference ranking of parametricconfigurations............................................................................................................................................... 46
Figure 19. Average control influence rating versus overall pilot preference ranking ofparametric configurations. ........................................................................................................................... 46
Figure 20. Power-spectral analysis of biodynamic coupling incident for pilot B. ....................................... 47Figure 21. Examples of biodynamic coupling incidents for pilots B, E, and C. .......................................... 48Figure 22. Variation of average RQR with increasing structural stiffness. .................................................. 49Figure 23. Variation of average CIR with increasing structural stiffness..................................................... 49Figure 24. Variation of average CHR with increasing structural stiffness. .................................................. 50Figure 25. Variation of average RQR with increasing modal damping........................................................ 50Figure 26. Variation of average CIR with increasing modal damping. ........................................................ 51Figure 27. Impact of mode-canceling control on RQR. ................................................................................ 51Figure 28. Impact of mode-canceling control on average CIR. .................................................................... 52Figure 29. Variation of average CHR with increasing damping and modal cancellation............................ 52Figure 30. Measured lateral accelerations from last 15 s of one example run performed
with STIF2 configuration. .......................................................................................................................... 53Figure 31. Lateral vibration spectrum plot for example time history. .......................................................... 54Figure 32. Lateral vibration spectra plots for all lateral-offset time histories given RQR of 5. .................. 55Figure 33. Lateral vibration spectral envelope based on maximum and minimum rms
spectrum values for all runs given RQR of 5. ............................................................................................. 56Figure 34. Lateral vibration spectral envelopes for various RQR levels. ..................................................... 57Figure 35. Vertical vibration spectral envelopes for various RQR levels. ................................................... 58Figure 36. Vertical vibration spectral envelopes based on ride quality rating plotted
with ISO vertical vibration standard............................................................................................................ 59Figure B1. Composite flight director tracking task. ....................................................................................... 64Figure B2. Nominal approach and landing..................................................................................................... 65Figure B3. IAG lateral offset landing. ............................................................................................................ 66Figure B4. Task rating card............................................................................................................................. 67Figure C1. HUD display.................................................................................................................................. 68Figure C2. Bank angle scale with roll pointer and sideslip indicator. ........................................................... 69Figure C3. Heading scale-horizon line. .......................................................................................................... 69Figure C4. Airspeed tape display. ................................................................................................................... 69Figure C5. Altitude display tape. .................................................................................................................... 70Figure C6. Velocity vector cluster. ................................................................................................................. 71Figure C7. Pitch grid, reference waterline, and heading scale....................................................................... 71Figure C8. ILS glide-slope and localizer displays.......................................................................................... 72Figure C9. Analog-digital angle of attack display.......................................................................................... 72Figure C10. Analog-digital acceleration tape display. ..................................................................................... 72Figure C11. Takeoff climb guidance system.................................................................................................... 73Figure C12. Depressed glide-slope reference line............................................................................................ 73Figure C13. Tail-scrape bar............................................................................................................................... 73Figure C14. Reference waterline....................................................................................................................... 73Figure C15. Digital information selective display............................................................................................ 73Figure D1. Flight-path angle and heading angle time histories. .................................................................... 74Figure D2. Flight-path angle time history for glide-slope intercept task....................................................... 75Figure D3. Heading angle command time history for localizer intercept task. ............................................. 76Figure D4. Flight director symbol................................................................................................................... 77
vii
Nomenclature
AGL above ground level, ft
ALT altitude
AN antisymmetric
AOA angle of attack, deg
ARI aileron-rudder interconnect
A/T autothrottle
Amp amplitude
Avg average
BDC biodynamic coupling
CDU cockpit display unit
C.G. center of gravity, percentage of mean aerodynamic chord
CGI computer generated imagery
CHR Cooper-Harper rating
CIR control influence rating
CRT cathode-ray tube
Config aircraft configuration
DASE dynamic aeroservoelastic
DH decision height
DIA Denver International Airport
DME distance measuring equipment (distance to runway threshold)
Dir directional
EAS equivalent airspeed
EPR exhaust pressure ratio (shorthand for throttle position)
FAA Federal Aviation Administration
viii
F/D flight director
fpm feet per minute
ft/sec, ft/s feet per second
G, g acceleration due to gravity, 32.2 ft/s2
GEAR landing gear position
GS glide slope (part of instrument landing system)
GW gross weight
HSCT High Speed Civil Transport
HSD horizontal situation display
HSR high speed research
HUD head-up display
IAG Niagra Falls International Airport
IC initial condition
ILS instrument landing system
KEAS/m equivalent airspeed, knots
kn, kts knots
LaRC Langley Research Center
Lat lateral
LEF leading-edge flaps, deg
LOC localizer (part of instrument landing system)
M Mach number
MAC mean aerodynamic chord
MFC final cruise mass condition
MIC initial cruise mass condition
MTE mission task element

ix
MTOGW maximum takeoff gross weight
MZFW maximum zero-fuel weight
Max maximum
Min minimum
ms millisecond
M13 Mass case 13—maximum taxi weight at forward C.G.
N/A not applicable
NASA National Aeronautics and Space Administration
Ny lateral acceleration, g units
Nz normal acceleration, g units
nmi nautical miles
OM outer marker
PF pilot flying (evaluation pilot)
PFD primary flight display
PIO pilot-induced oscillation
PNF pilot not flying (test engineer)
PSCAS Pitch Stability and Control Augmentation System
ps pilot station
p/β lateral-directional control law
QSAE quasi-static aeroelastic
R/C rate of climb
RCB ride comfort boundary
RQR ride quality rating
Ref-H Boeing Reference-H supersonic transport design
Rwy runway

x
rms root mean square
R1,R2 constant value during a run, either +1 or −1
SCAS stability and control augmentation system
SPD surface position display
SVS synthetic vision system
SY symmetric
ss stall speed
TCA Technology Concept Aircraft
TEF trailing-edge flaps, deg
TIFS total in-flight simulator
TOGA takeoff go-around
Trim indicates this parameter should be set to value required to achieve trimmed (unaccelerated)initial conditions
VFR visual flight rules
VMS Langley Visual Motion Simulator
Vapp approach speed
Vapp1 approach speed, first approach segment
Vapp2 approach speed, second approach segment
Vg/a go-around speed
Vmin minimum operating speed
Vmo, Mmo maximum operating speeds
Vr takeoff rotation speed, knots
Vref reference speed
V1 takeoff decision speed
V2 takeoff safety speed

xi
XTD number of feet from threshold
XVS external vision system
x longitudinal displacement of simulator cockpit
YTD number of feet from centerline
y lateral displacement of simulator cockpit
z vertical displacement of simulator cockpit
α angle of attack
˙ γ /V longitudinal control law
σ standard deviation
φ bank angle, deg
ψ yaw angle, deg
Summary
A piloted simulation study was conducted in the Langley Visual Motion Simulator to address the im-pact of dynamic aeroservoelastic effects on flying qualities of a High Speed Civil Transport. The intentof the investigation was to determine the effectiveness of measures that can be taken to reduce the impactof aircraft flexibility on piloting tasks. Potential solutions examined consisted of increasing the frequencyof elastic modes through structural stiffening, increasing the damping of elastic modes through activecontrol, eliminating control effector excitation of the lowest frequency elastic modes, and eliminatingvisual cues associated with the elastic modes. The various configurations were evaluated by six test pilotswho performed three types of maneuvers: a nominal approach and landing task, a landing that requiredcorrection for a lateral offset from the runway centerline, and a subsonic maneuvering task. During theinvestigation, several incidents were encountered in which cockpit vibrations due to elastic modes fedback into the control stick through involuntary motions of the pilot’s upper body and arm. Structuralstiffening and compensation of the visual display were of little benefit in alleviating the impact of elasticdynamics on piloting tasks, whereas increased damping and elimination of control effector excitation ofthe lowest frequency modes both offered great improvements when applied in sufficient degree.
Introduction
As commercial transport aircraft designs become larger and more flexible, the impact of aeroelasticvibration on a vehicle’s flight dynamics, flight control, and flying qualities increases in prominence. Theconsideration of such effects is likely to assume unprecedented significance in the design of a High SpeedCivil Transport (HSCT). Constraints imposed by flight at supersonic speeds and the need for economicalcommercial operation will result in a very large but relatively light and slender HSCT design that willexhibit unusually low-frequency elastic modes. Great potential exists for such low-frequency structuraldynamics to impact a pilot’s ability to maneuver an aircraft, not only because of the degradation of ridequality but also because of adverse coupling between human pilot control dynamics and elastic modes ofthe aircraft structure.
A piloted simulation experiment was conducted in the Langley Visual Motion Simulator (VMS) facil-ity to address the impact of dynamic aeroservoelastic (DASE) effects on flying qualities of the HSCT. Anearlier piloted simulation assessment of a preliminary dynamic elastic HSCT model, which was alsoperformed in the VMS, revealed that the flexible modes of the configuration caused great difficulty inperforming several approach and landing tasks (ref. 1). The intent of the present investigation was todetermine the effectiveness of measures that can be taken to reduce the impact of aircraft flexibility onsuch tasks.
Potential solutions examined were (1) increasing the frequency of the elastic modes by stiffening theaircraft structure, (2) active structural mode control to increase damping levels of various combinations ofelastic modes, (3) active structural mode control to reduce pilot excitation of structural vibration, and(4) active synthetic vision system (SVS) compensation that would remove vibratory effects from the out-the-window scene as presented to the pilot. An HSCT simulation model containing six dynamic elasticmodes was parameterized so that structural stiffness, modal damping, and other characteristics could bedirectly varied to represent the effect of each potential solution.
Twenty parametric configurations were evaluated by six test pilots representing the Federal AviationAdministration (FAA), The Boeing Company, National Aeronautics and Space Administration (NASA),and Veridian Corporation (formerly Calspan Corporation). The pilots evaluated each configuration withthree types of maneuvers consisting of a nominal approach and landing task, a landing that required

2
correction for a lateral offset from the runway centerline, and a subsonic maneuvering task. Pilot ratingsand cockpit vibration measurements were analyzed to provide insight regarding the effectiveness of eachpotential solution considered.
Test Objectives and Approach
The primary objective of this investigation was to determine the effectiveness of measures that can betaken to reduce the impact of aircraft flexibility on piloting tasks for an HSCT. The secondary objectivewas to establish preliminary guidelines for designing a structural mode control system for an HSCTconcept. An earlier simulation study that used a preliminary dynamic aeroelastic HSCT model wasperformed in the VMS. That study, referred to as the “LaRC.1 Piloted Simulation Assessment” in theHigh Speed Research Program, revealed an increase in the difficulty of approach and landing tasks whendynamic elastic modes were included in the simulation (ref. 1). The approach of the present investiga-tion, referred to as the “LaRC.3 Aeroelastic Simulation Experiment” in the High Speed ResearchProgram, was to parametrically vary certain aspects of the aeroelastic model to provide a simplifiedrepresentation of several potential means of reducing the impact of dynamic aeroelasticity on pilotingtasks. These potential solutions are depicted in figure 1 and described subsequently.
The first potential solution considered was to stiffen the vehicle structure. Structural stiffening tendsto increase the modal frequencies and was approximated in the experiment by simply applying a stiffen-ing factor to the frequencies associated with each DASE mode in the existing model. In vacuo frequen-cies of the dynamic elastic modes were multiplied by a given frequency ratio to represent a stiffer aircraftstructure without altering the aerodynamic characteristics, mass characteristics, or in vacuo mode shapesof the configuration. This experimental approach therefore represents an idealization in which structuralstiffness is added without the associated weight penalty. In this way we sought to gain insight into howstiff the structure must be to avoid difficulties in flying qualities caused by aeroelasticity.
The second potential solution was to increase modal damping, as could be achieved by employing anactive mode suppression control system. The effect of such a system was approximated by increasing thedamping of the existing elastic modes. By simply varying the damping ratios associated with selectedelastic modes, the experiment examined the level of damping augmentation that an active mode suppres-sion system must provide to restore acceptable flying qualities.
An idealized mode-canceling control system may also be envisioned that could use multiple controleffectors at the tail, wing, and/or nose of the aircraft to pitch, roll, or yaw the vehicle while avoiding anyexcitation of the lowest frequency elastic modes. This mode-canceling system would represent a higherrisk structural mode control concept, and it is the third potential solution considered in the investigation.The term “mode-canceling control” is used here to refer to input shaping for distributed control effectorsthat would avoid excitation of selected modes. The modal dynamics would remain, however, and wouldbe subject to excitation by turbulence. Such a solution was approximately represented in the experimentby eliminating the ability of control effector inputs to excite the first symmetric and first antisymmetricmodes. This approach provided information regarding the effectiveness of such a control concept and therelative importance of modal cancellation versus modal damping.
Compensation of the pilot’s visual display to eliminate perturbations due to structural vibration wasthe fourth potential solution considered in the investigation. This factor had been considered by Waszak,Davidson, and Schmidt in an earlier investigation where compensation of visual cues was used to elimi-nate bouncing of the horizon relative to the head-up display (HUD) due to dynamic elasticity (ref. 2).
3
Such compensation was found to have a positive effect on the pilots’ opinion of a flexible B-1 aircraftsimulation. A similar approach was represented in the existing aeroelastic HSCT simulation by simplyeliminating the display perturbations due to aeroelasticity that were nominally included in the simulation.
By exploring the parametric variations just described, information was gained regarding the effective-ness of each approach and the degree to which it must be exercised in order to achieve the desired flyingqualities. The means of approximating the various approaches by directly manipulating characteristics ofthe dynamic aeroelastic model permitted timely execution of an experiment that captured the fundamentaleffects of interest without having to design and implement candidate solutions.
Experimental Design and Apparatus
The following sections of this report describe the mathematical aircraft simulation model, the testmatrix of aeroelastic configurations, the piloted evaluation maneuvers and data collected, and the testprocedures used in this experiment, as well as the motion-based simulation facility in which the evalua-tions were conducted.
Aeroelastic HSCT Simulation Model
This experiment used a mathematical simulation of the so-called Cycle 3 version of the BoeingReference-H (Ref-H) supersonic transport design (ref. 3). The model was published by Boeing Commer-cial Airplane Group in the summer of 1996 as the fourth major release in a series of increasingly detailedmath models of the Ref-H configuration. The simulation model is based upon a combination of windtunnel and computational fluid dynamics studies of the Ref-H design, ranging from low subsonic toMach 2.4 supersonic wind tunnel studies.
The Cycle 3 release has improved fidelity over previous releases for aerodynamics, inertia, engines,landing gear, and actuation systems. The geometry of the Ref-H configuration was modeled in the simu-lation so that an accurate assessment of tail, nacelle, and wingtip strike incidents (inadvertent contact withground) could be made during landing evaluations. In addition, finite-element structural models wereused to predict the effect of steady flight loads upon aerodynamic stability derivatives, referred to asquasi-static aeroelastic (QSAE) effects. A key feature of the math model is the inclusion of DASEeffects, which requires additional states to represent the dynamic flexing of the aircraft structure.
General Configuration Description, Propulsion, and Gear Models
The Ref-H vehicle design has a cranked-arrow planform, a conventional aft tail, and four underslungengines as shown in figure 2. The control devices include an independently actuated horizontal stabilizerand elevator, a three-segment rudder on a fixed vertical fin, eight trailing-edge flaperons (four per wing),four leading-edge flaps (two per wing), and a vortex fence device and two spoiler-slot deflectors on eachwing. The elevator and horizontal tail are geared 2:1 by software in the current pitch control law.The fuselage has a maximum diameter on the order of 12 ft and is expected to carry approximately300 passengers in three seating classes. The configuration is approximately 310 ft long with a wingspanof 130 ft.
The aircraft has an operating empty weight of 280 000 lb and a maximum taxi weight of 650 000 lb.Final cruise weight is expected to be approximately 385 000 lb. Maximum takeoff gross weight(MTOGW) is 650 000 lb and maximum zero-fuel weight (MZFW) is 350 000 lb. The center of gravity(C.G.) can vary from as far forward as 48.1 percent mean aerodynamic chord (MAC) to as far aft as
4
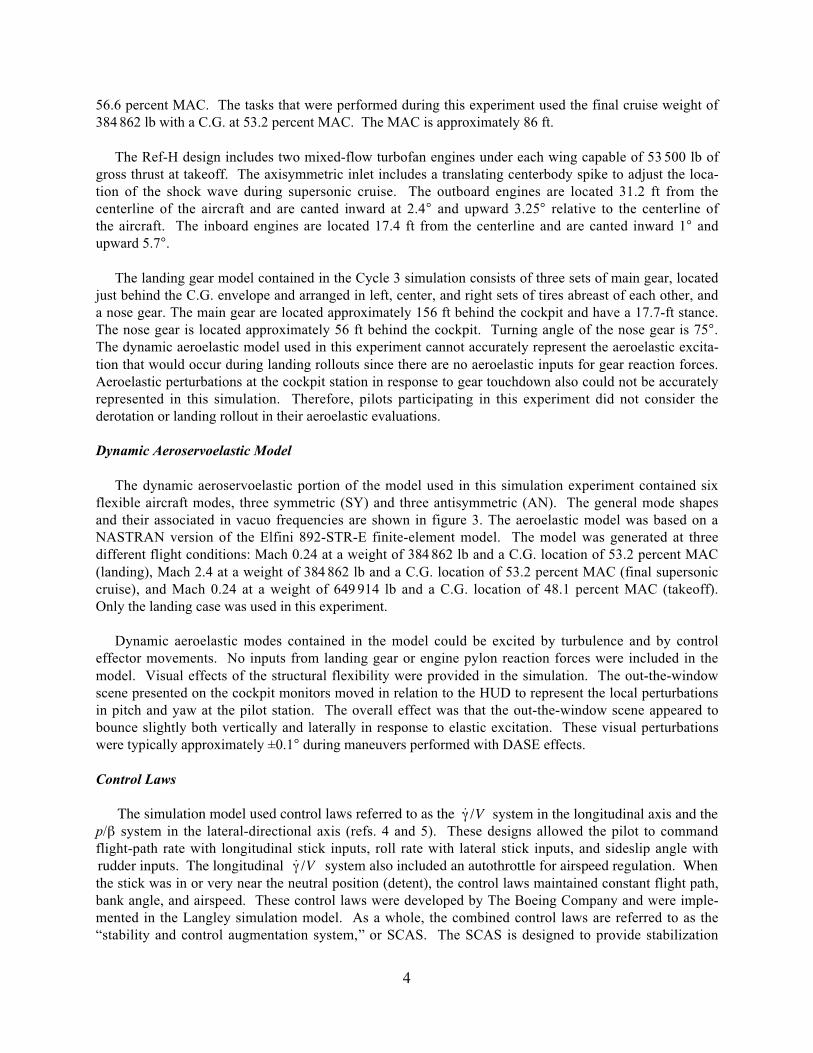
56.6 percent MAC. The tasks that were performed during this experiment used the final cruise weight of384 862 lb with a C.G. at 53.2 percent MAC. The MAC is approximately 86 ft.
The Ref-H design includes two mixed-flow turbofan engines under each wing capable of 53 500 lb ofgross thrust at takeoff. The axisymmetric inlet includes a translating centerbody spike to adjust the loca-tion of the shock wave during supersonic cruise. The outboard engines are located 31.2 ft from thecenterline of the aircraft and are canted inward at 2.4° and upward 3.25° relative to the centerline ofthe aircraft. The inboard engines are located 17.4 ft from the centerline and are canted inward 1° andupward 5.7°.
The landing gear model contained in the Cycle 3 simulation consists of three sets of main gear, locatedjust behind the C.G. envelope and arranged in left, center, and right sets of tires abreast of each other, anda nose gear. The main gear are located approximately 156 ft behind the cockpit and have a 17.7-ft stance.The nose gear is located approximately 56 ft behind the cockpit. Turning angle of the nose gear is 75°.The dynamic aeroelastic model used in this experiment cannot accurately represent the aeroelastic excita-tion that would occur during landing rollouts since there are no aeroelastic inputs for gear reaction forces.Aeroelastic perturbations at the cockpit station in response to gear touchdown also could not be accuratelyrepresented in this simulation. Therefore, pilots participating in this experiment did not consider thederotation or landing rollout in their aeroelastic evaluations.
Dynamic Aeroservoelastic Model
The dynamic aeroservoelastic portion of the model used in this simulation experiment contained sixflexible aircraft modes, three symmetric (SY) and three antisymmetric (AN). The general mode shapesand their associated in vacuo frequencies are shown in figure 3. The aeroelastic model was based on aNASTRAN version of the Elfini 892-STR-E finite-element model. The model was generated at threedifferent flight conditions: Mach 0.24 at a weight of 384 862 lb and a C.G. location of 53.2 percent MAC(landing), Mach 2.4 at a weight of 384 862 lb and a C.G. location of 53.2 percent MAC (final supersoniccruise), and Mach 0.24 at a weight of 649 914 lb and a C.G. location of 48.1 percent MAC (takeoff).Only the landing case was used in this experiment.
Dynamic aeroelastic modes contained in the model could be excited by turbulence and by controleffector movements. No inputs from landing gear or engine pylon reaction forces were included in themodel. Visual effects of the structural flexibility were provided in the simulation. The out-the-windowscene presented on the cockpit monitors moved in relation to the HUD to represent the local perturbationsin pitch and yaw at the pilot station. The overall effect was that the out-the-window scene appeared tobounce slightly both vertically and laterally in response to elastic excitation. These visual perturbationswere typically approximately ±0.1° during maneuvers performed with DASE effects.
Control Laws
The simulation model used control laws referred to as the ˙ γ /V system in the longitudinal axis and thep/β system in the lateral-directional axis (refs. 4 and 5). These designs allowed the pilot to commandflight-path rate with longitudinal stick inputs, roll rate with lateral stick inputs, and sideslip angle withrudder inputs. The longitudinal ˙ γ /V system also included an autothrottle for airspeed regulation. Whenthe stick was in or very near the neutral position (detent), the control laws maintained constant flight path,bank angle, and airspeed. These control laws were developed by The Boeing Company and were imple-mented in the Langley simulation model. As a whole, the combined control laws are referred to as the“stability and control augmentation system,” or SCAS. The SCAS is designed to provide stabilization

5
and control authority sufficient to perform the various maneuver tasks included in the LaRC.3 experi-ment. The design of the SCAS is somewhat optimistic in that it uses ideal feedback signals that reflectthe motions of the mean body axis, a coordinate system that tracks the centroid of the vibrating aircraftstructure. The aeroelastic dynamics therefore influenced stability of the closed-loop system only to theextent that the mean axis motions were influenced. In reality, local aeroelastic perturbations wouldinfluence sensor feedbacks, creating the potential for adverse interactions between elastic modes and thestability augmentation system. The potential for such interactions will present a major challenge todesigners of the vehicle flight control systems. Further explanation of the control law strategy, architec-ture, and implementation is provided in references 4 and 5.
The need to operate within the existing airspace system mandates that the HSCT mix with subsonictraffic in the terminal environment and operate at subsonic speeds. This operation requires the design tofly most approaches on the “backside” of the drag curve; that is, an increase in power is required to trimfor a reduction in airspeed. This unconventional throttle operation would probably necessitate extensiveretraining of flight crews. However, the backside characteristic can be masked by using an autothrottlesystem. An autothrottle is an integral part of the Boeing ˙ γ /V control law, and landings were always per -formed with the autothrottle active during this investigation.
The method of using available control surfaces for various flight control functions (control allocation)is based on the information provided in reference 3, along with actuator rate limits that were applied tothe control surfaces. In the LaRC.1 simulation assessment, several incidents of pilot-induced oscillation(PIO) were encountered during tasks executed without DASE effects present. The data indicated thatflaperon rate limiting was probably the cause of these incidents. Flaperon actuator rate limits of 50 deg/swere used during the LaRC.1 assessment, and the HSR Guidance and Flight Control Integrated Technol-ogy Team concluded that a rate limit of 90 deg/s might eliminate the PIO difficulty. Therefore, the(LaRC.3) simulation experiment described in this paper used the faster (90 deg/s) flaperon actuator rates.
Variation of Dynamic Aeroelastic Characteristics
The baseline model was modified to allow parametric variation of several characteristics associatedwith the DASE effects. These modifications allowed the impact of structural stiffening, modal damping,modal cancellation, and visual cues to be evaluated from a piloted control standpoint.
Variation of Structural Stiffness
The effect of structural stiffening was represented in the simulation by increasing the frequencies of allsix dynamic elastic modes included in the model. The in vacuo frequencies of the modes were multipliedby a given frequency ratio to represent a stiffer aircraft structure without altering the aerodynamiccharacteristics, mass characteristics, or in vacuo mode shapes of the configuration. This experimentalapproach therefore represents an idealization in which structural stiffness is added without the associatedweight penalty. The representation of structural stiffening by directly manipulating the model in thisfashion was clearly approximate, but was sufficient to capture the basic effect. Frequency ratios of 1.0(BASE0 configuration), 1.16 (STIF1 configuration), 1.36 (STIF2), and 1.60 (STIF3) were chosen. Thisselection produced frequencies for the first symmetric bending mode of 1.25, 1.45, 1.70, and 2.0 Hz. Thecorresponding stiffness increases for the STIF1, STIF2, and STIF3 configurations are 35, 85, and156 percent, respectively. The method of increasing modal frequency without modifying mode shapeassumes that the stiffness increase is applied uniformly throughout the entire aircraft structure. Theresulting frequencies of all six modes for each configuration are shown in table 1.
6
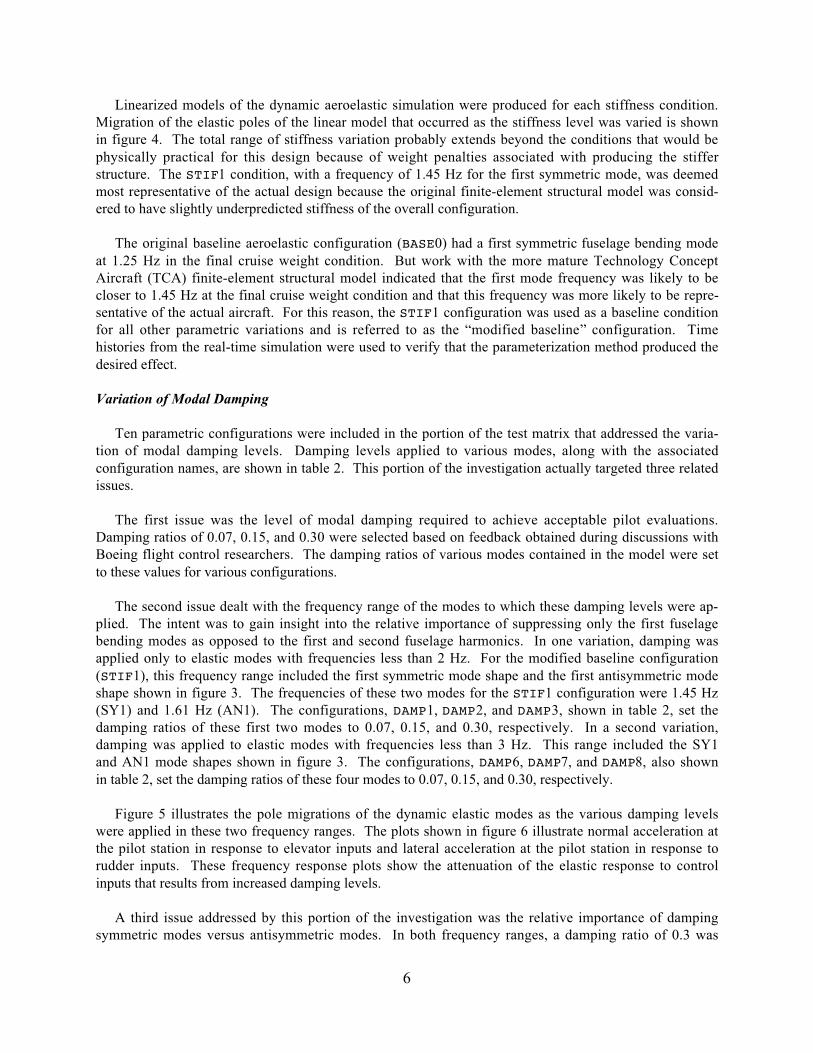
Linearized models of the dynamic aeroelastic simulation were produced for each stiffness condition.Migration of the elastic poles of the linear model that occurred as the stiffness level was varied is shownin figure 4. The total range of stiffness variation probably extends beyond the conditions that would bephysically practical for this design because of weight penalties associated with producing the stifferstructure. The STIF1 condition, with a frequency of 1.45 Hz for the first symmetric mode, was deemedmost representative of the actual design because the original finite-element structural model was consid-ered to have slightly underpredicted stiffness of the overall configuration.
The original baseline aeroelastic configuration (BASE0) had a first symmetric fuselage bending modeat 1.25 Hz in the final cruise weight condition. But work with the more mature Technology ConceptAircraft (TCA) finite-element structural model indicated that the first mode frequency was likely to becloser to 1.45 Hz at the final cruise weight condition and that this frequency was more likely to be repre-sentative of the actual aircraft. For this reason, the STIF1 configuration was used as a baseline conditionfor all other parametric variations and is referred to as the “modified baseline” configuration. Timehistories from the real-time simulation were used to verify that the parameterization method produced thedesired effect.
Variation of Modal Damping
Ten parametric configurations were included in the portion of the test matrix that addressed the varia-tion of modal damping levels. Damping levels applied to various modes, along with the associatedconfiguration names, are shown in table 2. This portion of the investigation actually targeted three relatedissues.
The first issue was the level of modal damping required to achieve acceptable pilot evaluations.Damping ratios of 0.07, 0.15, and 0.30 were selected based on feedback obtained during discussions withBoeing flight control researchers. The damping ratios of various modes contained in the model were setto these values for various configurations.
The second issue dealt with the frequency range of the modes to which these damping levels were ap-plied. The intent was to gain insight into the relative importance of suppressing only the first fuselagebending modes as opposed to the first and second fuselage harmonics. In one variation, damping wasapplied only to elastic modes with frequencies less than 2 Hz. For the modified baseline configuration(STIF1), this frequency range included the first symmetric mode shape and the first antisymmetric modeshape shown in figure 3. The frequencies of these two modes for the STIF1 configuration were 1.45 Hz(SY1) and 1.61 Hz (AN1). The configurations, DAMP1, DAMP2, and DAMP3, shown in table 2, set thedamping ratios of these first two modes to 0.07, 0.15, and 0.30, respectively. In a second variation,damping was applied to elastic modes with frequencies less than 3 Hz. This range included the SY1and AN1 mode shapes shown in figure 3. The configurations, DAMP6, DAMP7, and DAMP8, also shownin table 2, set the damping ratios of these four modes to 0.07, 0.15, and 0.30, respectively.
Figure 5 illustrates the pole migrations of the dynamic elastic modes as the various damping levelswere applied in these two frequency ranges. The plots shown in figure 6 illustrate normal acceleration atthe pilot station in response to elevator inputs and lateral acceleration at the pilot station in response torudder inputs. These frequency response plots show the attenuation of the elastic response to controlinputs that results from increased damping levels.
A third issue addressed by this portion of the investigation was the relative importance of dampingsymmetric modes versus antisymmetric modes. In both frequency ranges, a damping ratio of 0.3 was
7
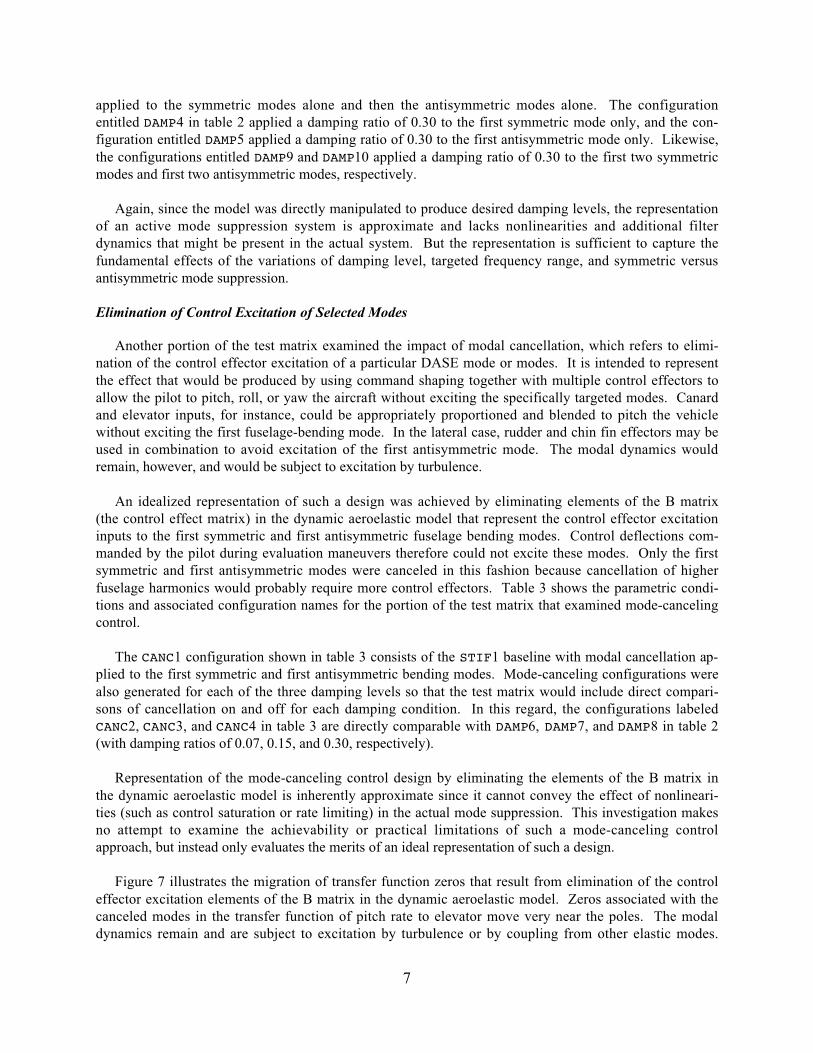
applied to the symmetric modes alone and then the antisymmetric modes alone. The configurationentitled DAMP4 in table 2 applied a damping ratio of 0.30 to the first symmetric mode only, and the con-figuration entitled DAMP5 applied a damping ratio of 0.30 to the first antisymmetric mode only. Likewise,the configurations entitled DAMP9 and DAMP10 applied a damping ratio of 0.30 to the first two symmetricmodes and first two antisymmetric modes, respectively.
Again, since the model was directly manipulated to produce desired damping levels, the representationof an active mode suppression system is approximate and lacks nonlinearities and additional filterdynamics that might be present in the actual system. But the representation is sufficient to capture thefundamental effects of the variations of damping level, targeted frequency range, and symmetric versusantisymmetric mode suppression.
Elimination of Control Excitation of Selected Modes
Another portion of the test matrix examined the impact of modal cancellation, which refers to elimi-nation of the control effector excitation of a particular DASE mode or modes. It is intended to representthe effect that would be produced by using command shaping together with multiple control effectors toallow the pilot to pitch, roll, or yaw the aircraft without exciting the specifically targeted modes. Canardand elevator inputs, for instance, could be appropriately proportioned and blended to pitch the vehiclewithout exciting the first fuselage-bending mode. In the lateral case, rudder and chin fin effectors may beused in combination to avoid excitation of the first antisymmetric mode. The modal dynamics wouldremain, however, and would be subject to excitation by turbulence.
An idealized representation of such a design was achieved by eliminating elements of the B matrix(the control effect matrix) in the dynamic aeroelastic model that represent the control effector excitationinputs to the first symmetric and first antisymmetric fuselage bending modes. Control deflections com-manded by the pilot during evaluation maneuvers therefore could not excite these modes. Only the firstsymmetric and first antisymmetric modes were canceled in this fashion because cancellation of higherfuselage harmonics would probably require more control effectors. Table 3 shows the parametric condi-tions and associated configuration names for the portion of the test matrix that examined mode-cancelingcontrol.
The CANC1 configuration shown in table 3 consists of the STIF1 baseline with modal cancellation ap-plied to the first symmetric and first antisymmetric bending modes. Mode-canceling configurations werealso generated for each of the three damping levels so that the test matrix would include direct compari-sons of cancellation on and off for each damping condition. In this regard, the configurations labeledCANC2, CANC3, and CANC4 in table 3 are directly comparable with DAMP6, DAMP7, and DAMP8 in table 2(with damping ratios of 0.07, 0.15, and 0.30, respectively).
Representation of the mode-canceling control design by eliminating the elements of the B matrix inthe dynamic aeroelastic model is inherently approximate since it cannot convey the effect of nonlineari-ties (such as control saturation or rate limiting) in the actual mode suppression. This investigation makesno attempt to examine the achievability or practical limitations of such a mode-canceling controlapproach, but instead only evaluates the merits of an ideal representation of such a design.
Figure 7 illustrates the migration of transfer function zeros that result from elimination of the controleffector excitation elements of the B matrix in the dynamic aeroelastic model. Zeros associated with thecanceled modes in the transfer function of pitch rate to elevator move very near the poles. The modaldynamics remain and are subject to excitation by turbulence or by coupling from other elastic modes.
8
The frequency response plots shown in figure 8 illustrate that the first symmetric and first antisymmetricmodes can no longer be directly excited by control effector inputs for the canceled configurations. Theslight response of symmetric mode 1 that remains is due to coupling with symmetric mode 2.
Elimination of DASE Visual Cues
In order to represent an ideally compensated display, the aeroelastic perturbations in the out-the-window scene produced by structural flexing were turned off. The conformality of the horizons on theHUD and the outside visual scene was thereby restored for the display-compensated configuration. Thiscondition was used to represent idealized compensation of an external vision system (XVS) for dynamicelastic effects. The variation was performed for only one aeroelastic condition, the DAMP1 configuration.The configuration called DISP0 represents the visual perturbations off case of the DAMP1 aeroelasticconfiguration. Visual perturbations due to aeroelastic effects were included in all other configurationsevaluated.
Variation of Turbulence Level
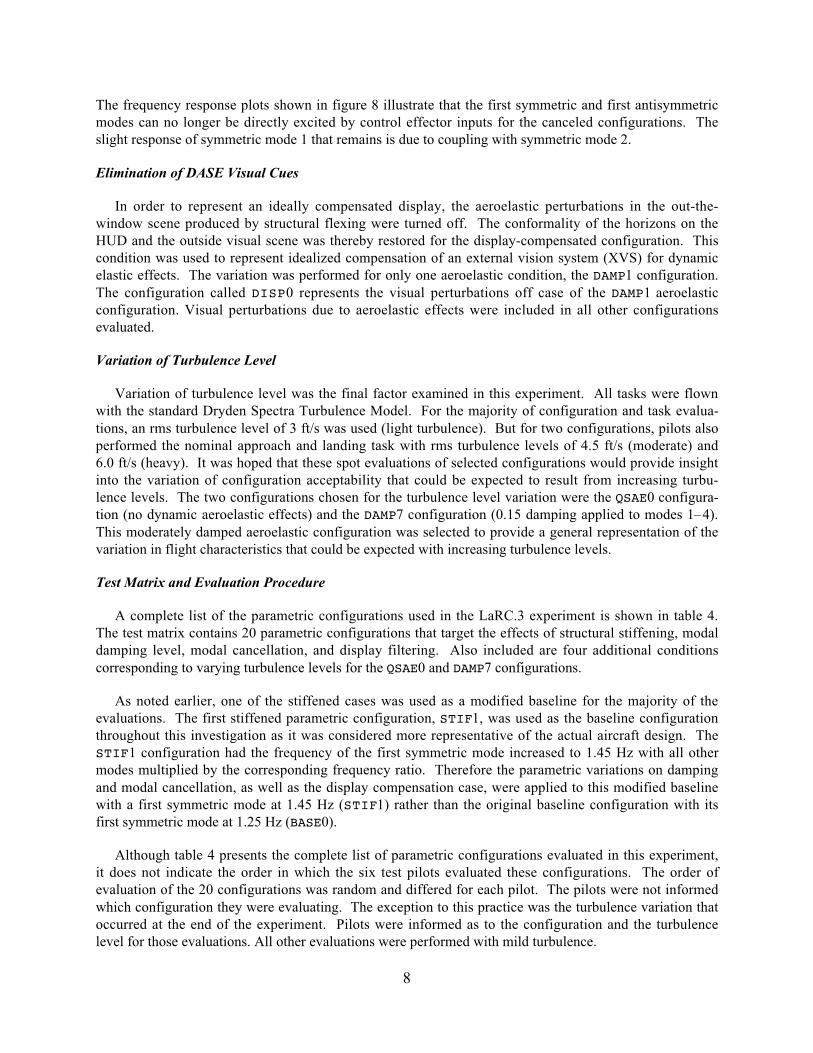
Variation of turbulence level was the final factor examined in this experiment. All tasks were flownwith the standard Dryden Spectra Turbulence Model. For the majority of configuration and task evalua-tions, an rms turbulence level of 3 ft/s was used (light turbulence). But for two configurations, pilots alsoperformed the nominal approach and landing task with rms turbulence levels of 4.5 ft/s (moderate) and6.0 ft/s (heavy). It was hoped that these spot evaluations of selected configurations would provide insightinto the variation of configuration acceptability that could be expected to result from increasing turbu-lence levels. The two configurations chosen for the turbulence level variation were the QSAE0 configura-tion (no dynamic aeroelastic effects) and the DAMP7 configuration (0.15 damping applied to modes 1–4).This moderately damped aeroelastic configuration was selected to provide a general representation of thevariation in flight characteristics that could be expected with increasing turbulence levels.
Test Matrix and Evaluation Procedure
A complete list of the parametric configurations used in the LaRC.3 experiment is shown in table 4.The test matrix contains 20 parametric configurations that target the effects of structural stiffening, modaldamping level, modal cancellation, and display filtering. Also included are four additional conditionscorresponding to varying turbulence levels for the QSAE0 and DAMP7 configurations.
As noted earlier, one of the stiffened cases was used as a modified baseline for the majority of theevaluations. The first stiffened parametric configuration, STIF1, was used as the baseline configurationthroughout this investigation as it was considered more representative of the actual aircraft design. TheSTIF1 configuration had the frequency of the first symmetric mode increased to 1.45 Hz with all othermodes multiplied by the corresponding frequency ratio. Therefore the parametric variations on dampingand modal cancellation, as well as the display compensation case, were applied to this modified baselinewith a first symmetric mode at 1.45 Hz (STIF1) rather than the original baseline configuration with itsfirst symmetric mode at 1.25 Hz (BASE0).
Although table 4 presents the complete list of parametric configurations evaluated in this experiment,it does not indicate the order in which the six test pilots evaluated these configurations. The order ofevaluation of the 20 configurations was random and differed for each pilot. The pilots were not informedwhich configuration they were evaluating. The exception to this practice was the turbulence variation thatoccurred at the end of the experiment. Pilots were informed as to the configuration and the turbulencelevel for those evaluations. All other evaluations were performed with mild turbulence.
9
The randomized order of configuration evaluations for each of the six test pilots is shown in table 5.Each pilot flew and rated all three maneuver tasks (described in the following section) for a given con-figuration before proceeding to the next random configuration. Simulation sessions were arranged so thatpilots spent no more than 2 consecutive hours in the cockpit at a time, twice a day, with a minimum of2 hours between sessions. Pilots were briefed prior to their first simulation sessions regarding overall testobjectives and evaluation procedures, and each pilot had been provided with a written test plan at least1 week before participation in the experiment. The test plan described the objectives, procedures, maneu-ver tasks, and evaluation tools of this experiment. Brief summaries of the prior flight experiences of eachevaluation pilot are provided in appendix A.
Evaluation Maneuvers
Three maneuver tasks were evaluated by each pilot for the parametric configurations that are presentedin table 4. The maneuvers included a nominal approach and landing, a lateral offset landing, and a sub-sonic flight director tracking task. The turbulence-variation portion of the test matrix shown in table 4was evaluated only with the nominal approach and landing task after the pilot completed the randomportion of the test matrix in which the 20 parametric configurations were evaluated.
Nominal Approach and Landing
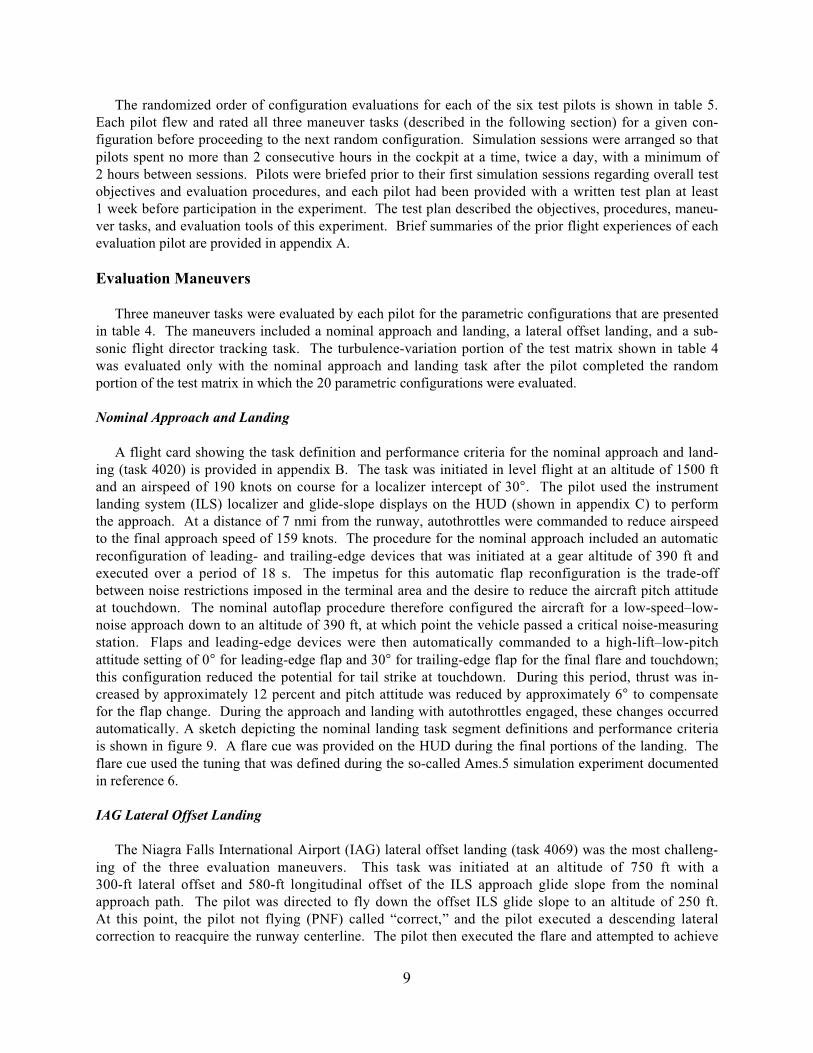
A flight card showing the task definition and performance criteria for the nominal approach and land-ing (task 4020) is provided in appendix B. The task was initiated in level flight at an altitude of 1500 ftand an airspeed of 190 knots on course for a localizer intercept of 30°. The pilot used the instrumentlanding system (ILS) localizer and glide-slope displays on the HUD (shown in appendix C) to performthe approach. At a distance of 7 nmi from the runway, autothrottles were commanded to reduce airspeedto the final approach speed of 159 knots. The procedure for the nominal approach included an automaticreconfiguration of leading- and trailing-edge devices that was initiated at a gear altitude of 390 ft andexecuted over a period of 18 s. The impetus for this automatic flap reconfiguration is the trade-offbetween noise restrictions imposed in the terminal area and the desire to reduce the aircraft pitch attitudeat touchdown. The nominal autoflap procedure therefore configured the aircraft for a low-speed–low-noise approach down to an altitude of 390 ft, at which point the vehicle passed a critical noise-measuringstation. Flaps and leading-edge devices were then automatically commanded to a high-lift–low-pitchattitude setting of 0° for leading-edge flap and 30° for trailing-edge flap for the final flare and touchdown;this configuration reduced the potential for tail strike at touchdown. During this period, thrust was in-creased by approximately 12 percent and pitch attitude was reduced by approximately 6° to compensatefor the flap change. During the approach and landing with autothrottles engaged, these changes occurredautomatically. A sketch depicting the nominal landing task segment definitions and performance criteriais shown in figure 9. A flare cue was provided on the HUD during the final portions of the landing. Theflare cue used the tuning that was defined during the so-called Ames.5 simulation experiment documentedin reference 6.
IAG Lateral Offset Landing
The Niagra Falls International Airport (IAG) lateral offset landing (task 4069) was the most challeng-ing of the three evaluation maneuvers. This task was initiated at an altitude of 750 ft with a300-ft lateral offset and 580-ft longitudinal offset of the ILS approach glide slope from the nominalapproach path. The pilot was directed to fly down the offset ILS glide slope to an altitude of 250 ft.At this point, the pilot not flying (PNF) called “correct,” and the pilot executed a descending lateralcorrection to reacquire the runway centerline. The pilot then executed the flare and attempted to achieve
10
touchdown within the tolerances required for desired performance. The first segment of this task coveredthe approach from an altitude of 750 ft to 50 ft and included the lateral correction maneuver. The secondsegment began at an altitude of 50 ft and included the flare and touchdown portions of the task. The taskrequired an aggressive lateral maneuver due to the low altitude at which the correction was initiated. Aflight card showing the task definition and performance criteria for the offset landing (task 4069) isprovided in appendix B.
Composite Flight Director Tracking
The composite flight director tracking (task 3115) allowed the pilot to evaluate the ability to accuratelymaneuver the aircraft by following flight director commands. The flight director was path oriented ratherthan attitude oriented. Originally, it was envisioned that either a sum-of-sines algorithm or a filteredrandom signal would be used to drive the flight director motions, as was used in the flexible B-1 studydescribed in reference 2. However, references 7 and 8 suggest that greater consistency among pilotratings was obtained when the flight director behaved in a fashion that is more representative of actualflight maneuver segments. For this reason, the decision was to drive the flight director with a compositesignal containing elements from various maneuver segments examined in previous HSCT simulations.These maneuver segments included the localizer capture from the nominal approach, glide-slope capture,a descending turn, and a rapid pull-up as found in the landing go-around tasks from reference 1. Flightpath and track angle command segments from these tasks were combined with varying order and sign toproduce a flight director behavior that was not easily anticipated but still representative of actual flightmaneuver tasks. The task was performed with mild turbulence. A flight card showing the task definitionand performance criteria for the composite flight director tracking (task 3115) is provided in appendix B.Details regarding the operation of the flight director and the computation of task performance metrics arepresented in appendix D.
Data Collected
Transcribed Cooper-Harper Ratings and Comments
Pilots used the familiar Cooper-Harper rating (CHR) scale shown in figure 10 to assign a flying quali-ties rating to each parametric configuration (ref. 9). The pilot’s task performance, in terms of touchdownparameters, flight-director tracking accuracy, and other information concerning maximum deviation fromtarget values, was presented on the pilot’s head-down “scorecard” display in the cockpit immediatelyfollowing each task. This information provided a basis for assessing whether desired or adequateperformance tolerances were achieved, which helped the pilot to navigate through the Cooper-Harperdecision tree.
Pilots rated the configurations immediately following execution of a particular maneuver task usingthe task rating card presented in appendix B. After completing a sufficient number of runs to rate aparticular configuration for a given task, the test pilot’s verbal responses to the task rating card were tapedusing a hand-held microcassette recorder in the cockpit. The recorded pilot comments were later tran-scribed and organized according to configuration. A complete listing of all transcribed pilot commentscollected during this experiment is provided in reference 10.
ASE Ride Quality and Control Influence Ratings
In addition to CHRs, test pilots were asked to provide a numerical assessment of the extent to whichdynamic elastic effects adversely impact their control inputs and comfort (ride quality). Two supple-mental rating scales were designed for this experiment to target these issues independent of deficienciesthat the pilot may have perceived in the SCAS. The aeroelastic ride quality rating (RQR) scale and

11
control influence rating (CIR) scale are shown in figure 11. It was important to obtain an independentrating of aeroelastic deficiencies separate from evaluation of the SCAS. For instance, if a pilot awardedthe nominal landing task a CHR of 4 for a particular configuration, but provided a CIR of 1 and an RQRof 1, then we could conclude that the deficient CHR was due to pilot dissatisfaction with the SCAS andnot with the aeroelastic characteristics of that particular configuration. Pilot feedback regarding thedesign of these scales was incorporated based on preliminary assessments performed prior to the start ofthe experiment.
The CIR scale bears further discussion. The scale was developed based on pilot comments from theearlier (LaRC.1) preliminary piloted assessment of dynamic aeroelastic effects. During that assessment,pilots sometimes indicated that they were “reducing the gain” or “backing off” on their control inputs toavoid excitation of the dynamic elastic modes. Several time histories from the LaRC.1 test suggested thatthe aeroelastic cockpit vibrations had sometimes corrupted the precision of pilot control inputs or evencaused occasional involuntary stick inputs. For this reason, the control influence rating scale was devel-oped to specifically address this issue in addition to the pilot comfort or ride quality issue. The ratingscales shown in figure 11 were included on the task rating card used by the pilots during their verbalconfiguration evaluations performed in the cockpit immediately following the maneuvers.
The dynamic aeroelastic evaluation scales shown in figure 11 included ratings that could be awardedwhen the dynamic aeroelastic effects resulted in a loss of control or when the cockpit vibration environ-ment motivated the pilot to abandon the evaluation. The test pilot could depress a trigger on the sidestickcontrol inceptor to halt the simulation if the ride quality was severe enough to warrant task abandonment.In such instances, activation of the trigger switch immediately terminated the run and the test pilotawarded the configuration a DASE RQR of 6 as described on the scale shown in figure 11. Poor taskperformance or an imminent landing outside the desired touchdown box was not a valid reason for use ofthe task abandonment trigger switch.
Digital Time Histories
A digital record of selected simulation parameters was made for each run. These parameters includedflight conditions, pilot control inputs, aircraft control effector responses, and parameters describing theresponses of the dynamic aeroelastic model. Time histories of the simulation parameters were recorded ata sample rate of 20 Hz. Some of the recorded parameters were analyzed immediately following the run togenerate the information concerning maximum deviation from target values that was presented on thepilot’s head-down scorecard display.
Videotape Recordings
Four separate video channels were tiled together and recorded on VHS-C tape for all piloted evalua-tions. Figure 12 shows a single frame of the composite video image recorded during the experiment. Thefirst channel (lower right of fig. 12) showed an exterior view of the simulator cab as it rotated and trans-lated on its hexapod motion platform. The second channel (upper center of fig. 12) captured the view thatwas presented on the pilot’s forward cockpit monitor within the cab, which consisted of the HUD sym-bology superimposed upon the computer-generated out-the-window scene. The third channel (back-ground image of fig. 12) contained a wide-angle video image of the interior of the cab as viewed fromover the pilot’s right shoulder and behind the pilot and copilot’s seats. This angle captured the bodymotions of both the pilot and pilot not flying as they were jostled in their seats. The fourth video channel(lower left of fig. 12) provided a downward-looking view of the pilot’s hand on the sidestick controlinceptor. Cockpit audio was also included on the videotapes. These video recordings proved extremelyuseful during postrun analysis of many simulated aeroelastic maneuver tasks.
12
Langley Visual Motion Simulator
Cab Arrangement and Control Inceptor
The VMS, shown in figure 13, uses a synergistic hexapod motion system. The cockpit configuration atthe time of this experiment included a left seat pilot flying (PF) station and a right seat PNF station. Athrottle quadrant with four throttles was located between the pilot stations and included a cockpit displayunit (CDU) that was used in this experiment to monitor and adjust various functions of the simulation. Afold-down jump seat was located behind and slightly to the left of the PNF station for an observer. Four-point harnesses were provided at all seats for motion operation.
The inceptor (control stick) used for all maneuvers performed during the LaRC.3 experiment was aMcFadden left-handed side stick. The PF seat included a left-side armrest that was adjustable to provideappropriate forearm support for the left arm of the evaluation pilot.
Visual Projection and Display Formats
An Evans & Sutherland ESIG-3000 visual image generator was used to provide out-the-window scen-ery onto four mirror-beam-splitter monitors: a left- and a right-side view, and two forward views (one foreach pilot). The terminal environment used for takeoff and landing work was a representation of theDenver International Airport (DIA). To assist the landing tasks, “desired” and “adequate” landing boxeswere drawn on the image of the primary runway (DIA 35L), along with a target landing reference stripeto either side of the target touchdown aim point.
A simulated HUD was provided through an electronic video mix with the forward view. Appendix Ccontains a schematic of this HUD format used for the LaRC.3 experiment. Six other CRT displays wereprovided in the cockpit, arranged to the front and side of either pilot, in addition to the CDU. Thesedisplays provided a head-down primary flight display (PFD) and a horizontal situation display (HSD).
It is anticipated that an operational HSCT will include some enhanced XVS to eliminate the need tolower the nose for landing. Although the visual scene presented to the pilot during this experiment wasnot fully representative of an enhanced vision system, the display included symbology superimposed onthe forward view that was similar to proposed XVS symbology. However, the forward field of view wasshown at lower resolution and in a smaller field of view than that proposed for an operational XVS.
In addition, two specialized displays used in the LaRC.3 study were a surface position display (SPD)and a trim display. These displays were used to monitor the wing flap positions and the engine thrustlevels, as well as to ensure proper configuration of the autothrottle and landing gear positions prior toeach simulation run. A scorecard display was also provided at the completion of each run to indicate thenumeric value of certain performance metrics achieved during the run to assist the evaluation pilot inassessing the configuration. The performance parameters described on the flight cards in appendix Bwere reported on the pilot’s scorecard display.
Motion Characteristics and Responses
The motion platform provides acceleration cues up to ±0.6g vertically within a 5.75-ft travel envelope;lateral and longitudinal acceleration limits are similar. The angular limits of the VMS are +30°/−20°pitch, ±32° yaw, and ±22° roll (positive pitch with the nose up).

13
Refinements were made to the motion drive algorithms to improve suitability of the simulator for rep-resenting the aeroelastic motion cues. Motion commands produced by the dynamic elastic portion of theaircraft model generally bypassed the motion washout filters to avoid any attenuation or delay of elasticvibration cues. Certain measures were also taken to allow implementation of the dynamic elastic modelin the real-time simulation environment.
Figure 14 was taken from a 1973 report that documented the frequency response capabilities of theVMS (ref. 11). The input-output amplitude ratios for vertical and lateral sinusoidal inputs of 1.8 in. areshown, along with the resulting phase lag, for input frequencies from 0.1 to 12 rad/s. The 1.8-in. sinusoi-dal displacement amplitude seems particularly appropriate as data from the LaRC.1 experiment showedthat pilot station displacements from the mean body axis on the order of ±2 in. at the frequencies includedin the aeroelastic model are sufficient to produce the 0.2g ringing observed during the piloted assessment.The frequency range of the dynamic elastic modes included in the LaRC.3 experiment is also shown inthese plots (1.25 to 2.82 Hz).
The dynamic elastic portions of the model clearly caused the motion base to operate at the thresholdof its capabilities. But at the lowest frequency bending modes for the BASE0 configuration (1.25 and1.39 Hz), the motion base appears to give reasonable performance (amplitude ratio of 0.8 vertically andamplitude ratio of 1.0 laterally, with about 15° of phase loss). The next two dynamic elastic modes (at2.01 and 2.13 Hz) still appear to be within the capabilities of the motion platform with about 25° of phaseloss.
Figure 15 presents the normal accelerations at the pilot station that were commanded by the real-timesimulation (dashed line) and those that were actually produced by the motion platform as measured byaccelerometers (solid line). The time history was taken from a lateral offset landing task performedduring the LaRC.3 experiment. The 60-s recording at the top of the figure shows that the magnitude ofthe two signals compared favorably, with the motion platform sometimes delivering incremental verticalacceleration cues as high as 0.4g and 0.6g. The two segments at the bottom of the figure provide a closerlook at the frequency content and time delay between the two signals. The gross frequency content of thesignals appears quite similar, although a time delay of approximately 150 ms is apparent between thecommand and the actual measured acceleration. The accelerometer measurements shown in the small-amplitude excerpt at the bottom left of the figure appear to contain an uncommanded high-frequencycomponent at many of the reversal points in the time history. The cause of this small-amplitude aberra-tion is uncertain, but it is most likely due to mechanical “slop” in structural components of the motionplatform or mounting of the accelerometer package itself. This vibration is present throughout the timehistory, but its magnitude is small in comparison with the actual commanded accelerations.
Figure 16 gives lateral accelerations at the pilot station that were commanded by the real-time simula-tion (dashed line) and those that were actually produced by the motion platform as measured by acceler-ometers (solid line). The time history was taken from a lateral offset landing task performed during theLaRC.3 experiment. The lateral accelerations here appear similar to those of the vertical acceleration.The two segments at the bottom of the figure provide a closer look at the frequency content and timedelay between the two signals. A time delay of approximately 160 to 170 ms is apparent between thecommand and the actual measured acceleration. This delay appears to be slightly longer than thatobserved in the vertical axis. The accelerometer measurements shown in the small-amplitude excerpt atthe bottom left of the figure again contain an uncommanded high-frequency component at many of theinflection points in the time history. The amplitude ratio between the actual and commanded lateralaccelerations is approximately 0.8. The extent to which these motion fidelity limitations impacted theassessment of dynamic aeroelastic effects is thought to be minimal, but their presence should be kept in
14
mind when interpreting the results of the experiment. Based on the initial dynamic aeroelastic imple-mentation in the earlier LaRC.1 investigation (ref. 1) and the measured responses of the VMS platform,the facility appears to provide a reasonable representation of the lowest frequency modes included in thedynamic aeroelastic model.
Results and Discussion
Time history data, subjective pilot comments, and pilot configuration ratings were examined in vari-ous combinations to provide some basic insights into the effectiveness of the differing approaches indealing with the DASE effects studied in this experiment. The CHRs, CIRs, and RQRs of the pilots werecompiled and plotted for each variation included in the test matrix. In general, CHRs did not seemto discriminate among configurations as clearly as the CIRs and RQRs, which specifically targetedDASE effects. A summary of all CHRs provided by the pilots for each configuration and task is shown intables 6 and 7. A summary of all DASE CIR and RQR scores provided by the pilots for each configura-tion and task is shown in table 8. The following sections interpret the data shown in these tables.
Configuration Rankings by Pilot Preference Based on DASE Ratings
The first approach to compiling the data was to formulate a pilot-preference ranking of the 20 para-metric configurations based on the average DASE CIR and RQR scores assigned by pilots for all threemaneuver tasks with a given configuration. This ranking is based only on the DASE CIR and RQR scoresby using the scales shown in figure 11. (CHRs will be discussed later.) The ranking was developedsimply by averaging all DASE ratings from all pilots for each configuration and then by arranging themin ascending order (larger average score meaning lower pilot preference). Pilot-preference ranking of the20 configurations is shown in table 9 and is plotted in figure 17.
This simple approach to ranking the configurations passes a number of intuitive checks. First, theRef-H baseline aeroelastic configuration (BASE0), with no structural stiffening or active mode suppres-sion, was ranked the worst configuration—as one might expect. Also reassuringly, the rigid configurationwithout any dynamic aeroelastic effects (QSAE0, quasi-static elastic effects only) was ranked the best.Differentiation among configurations is greatest at the start of the ranking, in the most desirable region,and tapers off to near ties at the undesirable end of the spectrum. The stiffened cases without active modesuppression were all ranked poorly, suggesting that this approach was not effective at reducing the impactof dynamic elastic effects on piloting tasks. The configuration with the highest level of damping (0.3)applied to the greatest number of modes (four) and with modal cancellation (CANC4) was ranked the bestof the aeroelastic configurations but was still very different from the rigid aircraft in terms of pilot ratings.The next best configuration was identical to this one with the exception of damping level, which wasreduced to 0.15 (CANC3). The fourth ranked configuration had 0.3 damping on four modes, but had nocancellation (DAMP8). The order of ranking may provide some interesting insights regarding potentialtrades between mode-canceling control and additional damping. Another insight is gained when wecompare the rankings of the configuration that had only symmetric modes damped (DAMP9, ranked 18th)with the configuration that had only antisymmetric modes damped (DAMP10, ranked 9th). It is clear thatthe pilots found the undamped antisymmetric motions to be more problematic than undamped symmetricmotions. Many other interesting comparisons can be drawn from this configuration-ranking chart, whichrepresents the most fundamental summation of the LaRC.3 experiment results.
DASE Ride Quality Ratings Versus Pilot Preference
The overall ranking shown in figure 17 provides insight regarding the order of pilot preference forthe 20 parametric configurations but does not indicate the point in ranking at which dynamic elastic
15
characteristics make the configuration unacceptable. Figure 18 attempts to address this issue by showingthe average ride quality rating assigned by pilots for each configuration plotted against the overall pilotpreference ranking from the previous figure. The subjective description of the ride quality rating assignedby pilots is shown adjacent to the ride quality axis along with shading to indicate the transition fromacceptable to marginal to unacceptable configuration characteristics. On the basis of the average ridequality ratings, the first four configurations (QSAE0, CANC4, CANC3, and DAMP8) appear to be in or on theborder of the acceptable ride quality region. Also shown in the plot are the maximum and minimum ridequality ratings assigned to the configurations. On the basis of the maximum rating, even the most highlymode-suppressed configuration (CANC4) provides only marginally acceptable ride quality at the pilotstation. It should be noted that these ratings were provided during tasks performed with mild turbulence,and that the ride quality acceptability will probably degrade with increasing turbulence level. Figure 18provides a subjective basis for the judgment of an acceptable level of mode suppression from a pilot’sride quality perspective. In this experiment, the damping level of 0.3 was based on the average ridequality rating.
Control Influence Ratings Versus Pilot Preference
Figure 19 provides an analogous ranking to figure 18 in terms of the CIR instead of RQR. The sub-jective description of the control influence rating assigned by the pilots is shown adjacent to the controlinfluence axis, along with graduations to indicate the transition from acceptable to marginal to unaccept-able configuration characteristics. The unacceptable threshold was placed at the point where cockpitvibrations impact the precision of voluntary control inputs. On the basis of the average control influenceratings, the first four configurations (QSAE0, CANC4, CANC3, and DAMP8) again lie within the acceptableregion. On the basis of the maximum rating, the most highly mode-suppressed configuration (CANC4)again lies in the marginally acceptable region from a control influence perspective.
The border between acceptable and marginal control influence in this plot is somewhat arbitrary as itmight be perfectly acceptable for the pilots to intentionally modify their control inputs to avoid excitationof the dynamic elastic modes as long as their ability to precisely control the aircraft is in no way hinderedby this practice. However, recorded time histories of pilot stick deflections indicate that pilots weresometimes unaware that cockpit vibrations were in fact impacting their control inputs.
The potential for involuntary biodynamic feed-through of cockpit vibrations through the pilot’s armand back into the control inceptor due to aeroelastic effects of a supersonic transport was hypothesized inreference 12. The occurrence is involuntary and therefore may indeed be unnoticed by the pilot in minorinstances. Use of the CIR scale shown in figure 19 requires the pilot to be aware of the occurrence, andtherefore the CIRs may sometimes be optimistic. However, pilots did note a number of profound in-stances of frequent or sustained biodynamic feed-through of cockpit vibrations back into the controlinceptor as indicated by the maximum CIRs shown in the figure. Frequent or sustained biodynamic feed-through of cockpit vibrations through the pilot’s arm and back into the inceptor will be referred to as“biodynamic coupling” (BDC) in this report.
Biodynamic Coupling
Figure 20 presents a power spectral analysis of a lateral offset landing run in which the pilot experi-enced BDC while flying the STIF1 (modified baseline) configuration with no additional damping orcancellation. The time history at the top of the figure shows lateral cockpit accelerations in g units(dashed line) and lateral stick deflections (solid line). Although the units on the two quantities differ, thescaling of ±1 is convenient as it represents the maximum throw for lateral stick deflection and since
16
lateral acceleration commanded by the simulation remained in the range of ±1g. The plot in the lower leftof the figure shows the power spectral density of lateral accelerations (dashed) and lateral stick deflec-tions (solid) applied to a 6-s segment of the time history (from 39 to 45 s). The frequency spectrum of thepilot’s voluntary control input time history during this period lies primarily below 1 Hz. The frequencyspectrum of the lateral accelerations at the pilot station shows some content at the first antisymmetricmode frequency of 1.6 Hz and the second antisymmetric mode frequency of 2.5 Hz due to minor turbu-lence excitation of these structural modes. A clear separation exists between the frequency of the pilot’sinput spectrum and the frequency of cockpit accelerations due to the lateral elastic modes.
The power spectrum of a later 6-s segment of the time history (from 44 to 50 s) indicates the bulk ofthe pilot’s input spectrum remains below 1 Hz, but it also shows some frequency content of the pilot’sinputs in the range of the lateral elastic modes. Once the pilot begins to move the stick at the resonantfrequency of the first antisymmetric structural mode, there is tremendous potential for the lateral mode tobe excited by the control inputs and produce larger lateral accelerations at the pilot station. These lateralaccelerations can move the pilot’s frame in a fashion that produces involuntary control inputs that furtherexcite the structural mode.
The third power spectrum plot is applied to a 6-s segment of the time history from 47 to 53 s. Here,the spectrum of the pilot’s stick input exhibits a pronounced resonant peak at the frequency of the firstantisymmetric structural mode. It is highly unlikely that the pilot inputs in this frequency range arevoluntary (although they are within the pilot’s voluntary bandwidth). Video footage of the cockpit inte-rior and of the pilot’s hand on the sidestick depicts a strong correlation between the involuntary motionsof the pilot’s upper body with the motions of his hand on the stick. A clear change in the character of thepilot’s stick inputs is apparent in the time history shown in figure 20 and indicates a well-developed BDCincident as lateral accelerations feed through the pilot’s frame and back into the control inceptor. Thepilot would break the involuntary coupling loop if he released the stick, but he is in the midst of the flareand therefore unable to do so.
This type of adverse interaction between pilot and aircraft dynamics is not entirely unprecedented. Arecent investigation performed at the Dryden Flight Research Center identified a similar phenomenoninvolving the use of a sidestick control inceptor (ref. 13) in the F-16XL that resulted in roll ratchetingduring abrupt high-rate rolling maneuvers. Reference 14 documents these findings. Researchers pro-duced an analytical model of the coupled system including dynamics of the pilot’s frame and the controlinceptor. The dynamic responses appeared quite similar to those encountered during the incidents oflateral BDC in the LaRC.3 experiment. The Dryden researchers in reference 14 identified a lateral reso-nant frequency of approximately 2.1 Hz for their combined pilot and control inceptor dynamical system(ref. 13).
Three of the six test pilots encountered BDC during various portions of the experiment. The phe-nomenon was usually encountered when test pilots flew the HSCT with no active suppression of thelateral structural modes. Encounters with BDC severely degraded the pilot’s ability to control the aircraft,and sometimes resulted in termination of a run due to loss of control or uncomfortably high levels ofcockpit vibration. Examples of BDC incidents for pilots B, E, and C are shown in figure 21. Powerspectra of the pilot stick inputs for each case indicate a resonant peak at the frequency of the first anti-symmetric elastic mode. Pilots B and E experienced BDC on many occasions and with many differentconfigurations. Pilot C tended to experience less pronounced intermittent instances of biodynamic feed-through. Note that pilot C experienced coupling with the STIF3 configuration, which has its first anti-symmetric mode at a higher frequency than the STIF1 baseline (2.2 Hz instead of 1.6 Hz).
17
The time histories shown for pilots B and E in figure 21 are for the DAMP9 configuration, which actu-ally applies 0.3 damping to the symmetric modes but leaves the antisymmetric modes undamped. Thepresence of significant damping for symmetric modes did little to prevent the coupling because the lateralaxis is far more prone to BDC for a number of reasons.
First, the pilot’s seat tends to support the body longitudinally and vertically but not laterally; thus side-to-side accelerations are more difficult to resist. Symmetric modes produce vertical accelerations,whereas the stick input is fore and aft; therefore there is less tendency for the pilot’s body motions to feeddirectly into the stick. However, antisymmetric modes produce lateral accelerations that feed directly intolateral stick deflections. A sidestick control inceptor was used in this experiment. The susceptibility ofvarious inceptor types to biodynamic feed-through is a potential topic for future investigations. Certainmeasures to prevent BDC may be devised and incorporated during design of the control inceptor for theHSCT.
Another element of the control system implicated in the occurrence of BDC is the aileron-rudder inter-connect (ARI). This is the control path whereby lateral stick displacements produce rudder deflections inproportion to aileron deflections to achieve turn coordination. But it is also the path whereby lateralcockpit vibrations may feed directly through the pilot-inceptor dynamics and back into rudder deflections;lateral elastic modes are further excited. Some provision may possibly be included in the design of theARI to interrupt or prevent BDC.
To summarize, BDC is indicated when cockpit vibrations due to elastic modes feed directly throughthe pilot’s arm and back into the control stick. The phenomenon is evidenced by a resonant peak in thepower spectrum of the pilot’s stick inputs at the frequency of one of the dynamic elastic modes. Thetendency to couple with structural modes appears to increase when pilots tighten their grip on the stick,often in preparation for the flare as the aircraft nears the runway. The phenomenon is influenced bydesign of the control inceptor and control laws, piloting style, and probably even certain aspects of thepilot’s physical stature.
The potential hazard posed by BDC would seem to suggest that certain elements of the HSCT activemode suppression control system, or at least some provision in the basic SCAS to prevent BDC, will needto be designated as flight critical. However, a final judgment regarding this issue should be made on thebasis of evaluations performed with a high-fidelity dynamic aeroelastic model of the final aircraft con-figuration. The severity of the coupling sometimes observed indicates that some provision must be madeto ensure that BDC is never encountered during either normal or reversionary operation of the HSCTflight control system.
Configuration Ranking Based on Cooper-Harper Ratings
A configuration ranking similar to that shown in table 9 was produced with CHRs of the pilots insteadof DASE ratings. The resulting configuration ranking is shown in table 10 along with the configurationranking that was produced with the DASE scores. The overall ranking is similar, but the scores weremuch closer and there were a few ties. The outlined sections of the table indicate groupings of configura-tions that were ranked similarly. The CHR scale was not specifically designed to target DASE effects,but rather address overall control of the augmented flight dynamics provided by the SCAS. The DASEeffects impacted CHRs from the perspective of increased pilot workload due to vibration environment,but the impact of DASE on pilot inputs and ride quality is not explicitly called out. Nevertheless, theresults shown in table 10 indicate that good agreement exists between the two ranking methods in termsof general pilot preference for the various configurations. The summaries of all DASE ratings and the
18
summary of all CHRs shown in tables 6, 7, and 8 provide additional information regarding the pilots’ratings, such as whether a configuration was ranked poorly in the lateral-directional axis, or in the longi-tudinal axis, or in both.
Impact of Structural Stiffening
Variation of average RQR and CIR with increasing structural stiffness is shown in figures 22 and 23.Maximum and minimum ratings for these configurations are also indicated on the plots. Structural stiff-ening did not appear to provide an effective solution to ride quality or control influence concerns posedby dynamic aeroelastic effects. The average and maximum CIR and RQR metrics fell in the unacceptableregion for all structural stiffenings included in the experiment.
These findings are somewhat corroborated by results of the aforementioned investigation performed atDryden Flight Research Center addressing biomechanically induced oscillations experienced on theF-16XL aircraft during rolling maneuvers (ref. 13). The Dryden researchers identified a lateral resonantfrequency of approximately 2.1 Hz for their combined pilot and control inceptor dynamical system. Wemust assume that the LaRC.3 pilot and inceptor dynamical system possessed a resonant frequency in thissame vicinity as figure 21 indicated lateral resonances at approximately 1.6 and 2.2 Hz for the LaRC.3pilots. No stiffness variation examined in the LaRC.3 experiment was sufficiently high to remove allstructural dynamics from this resonant frequency range. It is likely that no stiffnesses received favorableratings because none were sufficient to raise the elastic dynamic frequencies beyond the region in whichthey tend to interfere with piloted flight. The ineffectiveness of increasing the frequencies of dynamicelastic modes through structural stiffening suggests that some form of active mode suppression controlwill be necessary.
The variation of CHRs with structural stiffening is shown in figure 24. Again, no significantimprovement is apparent as a result of increasing modal frequencies through added stiffness. Eachconfiguration received maximum CHRs that were in the Level 3 region.
Impact of Display Compensation
No significant improvement due to aeroelastic display compensation was observed in this experimentin any pilot rating. To represent an ideally compensated display, the aeroelastic perturbations in the out-the-window scene produced by structural flexing were turned off. The conformality of the horizons onthe HUD and the outside visual scene was thereby restored for the display-compensated configuration(DISP0). Table 11 shows the results for the configuration with display perturbations turned off and theanalogous configuration with display perturbations turned on. In no instance did the pilot consistentlyreport that the display compensation case improved the precision or ease with which maneuver tasks wereperformed. In most cases, the pilots did not indicate awareness that the configuration being evaluated wasthe display-compensated case. (Recall that the configurations were evaluated in random order and thatpilots were not informed which condition was being evaluated.)
Although the display-compensated configuration was ranked slightly better than its counterpart with-out display compensation in terms of pilot preference, the difference in the DASE rating upon which thisranking was based is only 1 point (129 versus 130). This difference was clearly within the margin oferror for the experiment, and pilot preference for the two configurations was a tie for all intensive pur-poses. The DAMP1 data set used only 0.07 damping for only the first two symmetric modes so that theaeroelastic vibrations experienced by the pilot were still rather vigorous. The increased workload result-ing from aeroelastic vibrations likely meant that there was simply too much going on for pilots to notice
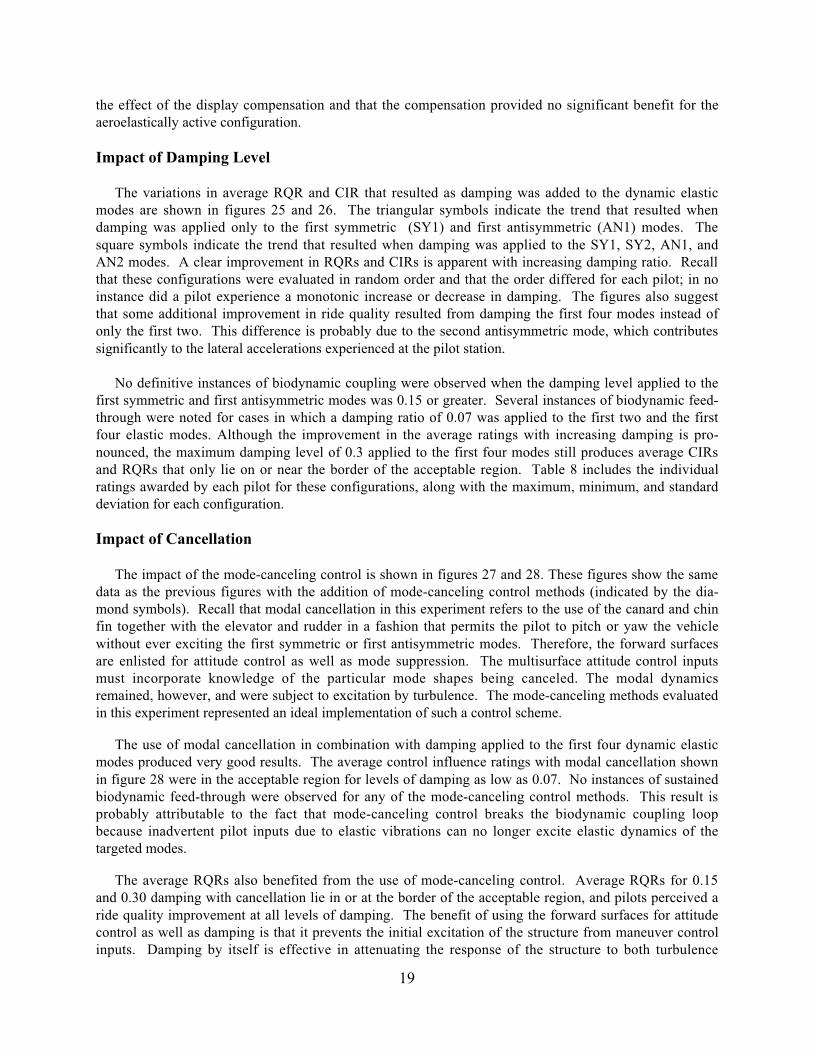
19
the effect of the display compensation and that the compensation provided no significant benefit for theaeroelastically active configuration.
Impact of Damping Level
The variations in average RQR and CIR that resulted as damping was added to the dynamic elasticmodes are shown in figures 25 and 26. The triangular symbols indicate the trend that resulted whendamping was applied only to the first symmetric (SY1) and first antisymmetric (AN1) modes. Thesquare symbols indicate the trend that resulted when damping was applied to the SY1, SY2, AN1, andAN2 modes. A clear improvement in RQRs and CIRs is apparent with increasing damping ratio. Recallthat these configurations were evaluated in random order and that the order differed for each pilot; in noinstance did a pilot experience a monotonic increase or decrease in damping. The figures also suggestthat some additional improvement in ride quality resulted from damping the first four modes instead ofonly the first two. This difference is probably due to the second antisymmetric mode, which contributessignificantly to the lateral accelerations experienced at the pilot station.
No definitive instances of biodynamic coupling were observed when the damping level applied to thefirst symmetric and first antisymmetric modes was 0.15 or greater. Several instances of biodynamic feed-through were noted for cases in which a damping ratio of 0.07 was applied to the first two and the firstfour elastic modes. Although the improvement in the average ratings with increasing damping is pro-nounced, the maximum damping level of 0.3 applied to the first four modes still produces average CIRsand RQRs that only lie on or near the border of the acceptable region. Table 8 includes the individualratings awarded by each pilot for these configurations, along with the maximum, minimum, and standarddeviation for each configuration.
Impact of Cancellation
The impact of the mode-canceling control is shown in figures 27 and 28. These figures show the samedata as the previous figures with the addition of mode-canceling control methods (indicated by the dia-mond symbols). Recall that modal cancellation in this experiment refers to the use of the canard and chinfin together with the elevator and rudder in a fashion that permits the pilot to pitch or yaw the vehiclewithout ever exciting the first symmetric or first antisymmetric modes. Therefore, the forward surfacesare enlisted for attitude control as well as mode suppression. The multisurface attitude control inputsmust incorporate knowledge of the particular mode shapes being canceled. The modal dynamicsremained, however, and were subject to excitation by turbulence. The mode-canceling methods evaluatedin this experiment represented an ideal implementation of such a control scheme.
The use of modal cancellation in combination with damping applied to the first four dynamic elasticmodes produced very good results. The average control influence ratings with modal cancellation shownin figure 28 were in the acceptable region for levels of damping as low as 0.07. No instances of sustainedbiodynamic feed-through were observed for any of the mode-canceling control methods. This result isprobably attributable to the fact that mode-canceling control breaks the biodynamic coupling loopbecause inadvertent pilot inputs due to elastic vibrations can no longer excite elastic dynamics of thetargeted modes.
The average RQRs also benefited from the use of mode-canceling control. Average RQRs for 0.15and 0.30 damping with cancellation lie in or at the border of the acceptable region, and pilots perceived aride quality improvement at all levels of damping. The benefit of using the forward surfaces for attitudecontrol as well as damping is that it prevents the initial excitation of the structure from maneuver controlinputs. Damping by itself is effective in attenuating the response of the structure to both turbulence

20
excitation and maneuver control excitation, but without cancellation the pilot still feels a large initialbump during any abrupt maneuver because the aircraft structure initially bends and snaps back while thevehicle pitches or yaws. In terms of the aircraft design, the use of modal cancellation suggests a need fortrue multifunction canards for attitude control and mode suppression rather than diminutive ride controlvanes, which would only provide modal damping as in the B-1. The CHRs shown in figure 29 depictmuch less variation with increased damping and modal cancellation than did the RQRs or CIRs.
Impact of Increasing Turbulence Level
Variation of turbulence level was the final factor examined in this experiment. For the majority ofconfiguration and task evaluations, an rms Dryden spectral turbulence level of 3 ft/s was used (lightturbulence). But for two configurations, the pilots also performed the nominal approach and landing taskwith rms turbulence levels of 4.5 ft/s (moderate) and 6.0 ft/s (heavy). These spot evaluations of selectedconfigurations were intended to provide insight into the variation of configuration acceptability that couldbe expected to result from increasing turbulence levels. The two configurations chosen for the turbulencelevel variation were the QSAE0 configuration (no dynamic aeroelastic effects) and the DAMP7 configura-tion (0.15 damping applied to modes SY1, AN1, SY2, and AN2).
The results shown in table 12 were inconclusive regarding the impact of turbulence level on the vari-ous pilot rating metrics. The reason for this result is uncertain, for it seems likely that increasing theturbulence excitation amplitudes of the aircraft structure would almost certainly degrade the cockpitacceleration environment. The cockpit environment degradation due to increasing turbulence levels mayhave been perceived as insignificant in comparison with the degradation that was experienced as a resultof the other parametric variations concurrently evaluated in this experiment.
Correlation of Ride Quality Ratings With Cockpit Vibration Spectra
Figure 18 provides a subjective basis for the judgment of an acceptable level of mode suppressionfrom a pilot’s ride quality perspective. An attempt was made to correlate these subjective ratings of ridequality with a quantitative characterization of the vibration environment the pilots were experiencing atthe time they provided the ratings. In this way we hoped to provide insight regarding allowable vibrationlevels at the pilot station in response to maneuver excitation of the aeroelastic modes to achieve accept-able ride quality. This analysis was performed only for the lateral offset landing task since that taskproduced the greatest range of RQRs.
Measured lateral accelerations from the last 15 s of one particular run performed with the STIF2 con-figuration are shown in figure 30. The pilot assigned this configuration an RQR of 5. This measuredcockpit acceleration time history was analyzed to produce the rms lateral vibration spectrum plot shownin figure 31. The first and second antisymmetric mode frequencies for the STIF2 configuration are1.89 and 2.90 Hz, as indicated in table 1. These frequencies correspond to peaks in the spectrum plot ofmeasured accelerations shown in figure 31.
Similar vibration spectrum plots were generated for each run of the lateral offset landing taskperformed by each evaluation pilot for each configuration. These vibration spectra were then groupedaccording to the RQR that a particular run was given by the pilot, regardless of the configuration. Such agrouping is shown in figure 32. Each run shown in this figure was assigned an RQR of 5, but the runswere produced by different pilots flying different configurations. The plot contains runs for the BASE0configuration as well as the STIF1, STIF2, DAMP1, DAMP2, and CANC1 configurations, and any others thatwere assigned an RQR of 5 by any pilot as indicated in table 8. The maximum and minimum rms accel-erations at each frequency from the complete set of runs were then used to produce a vibration spectral
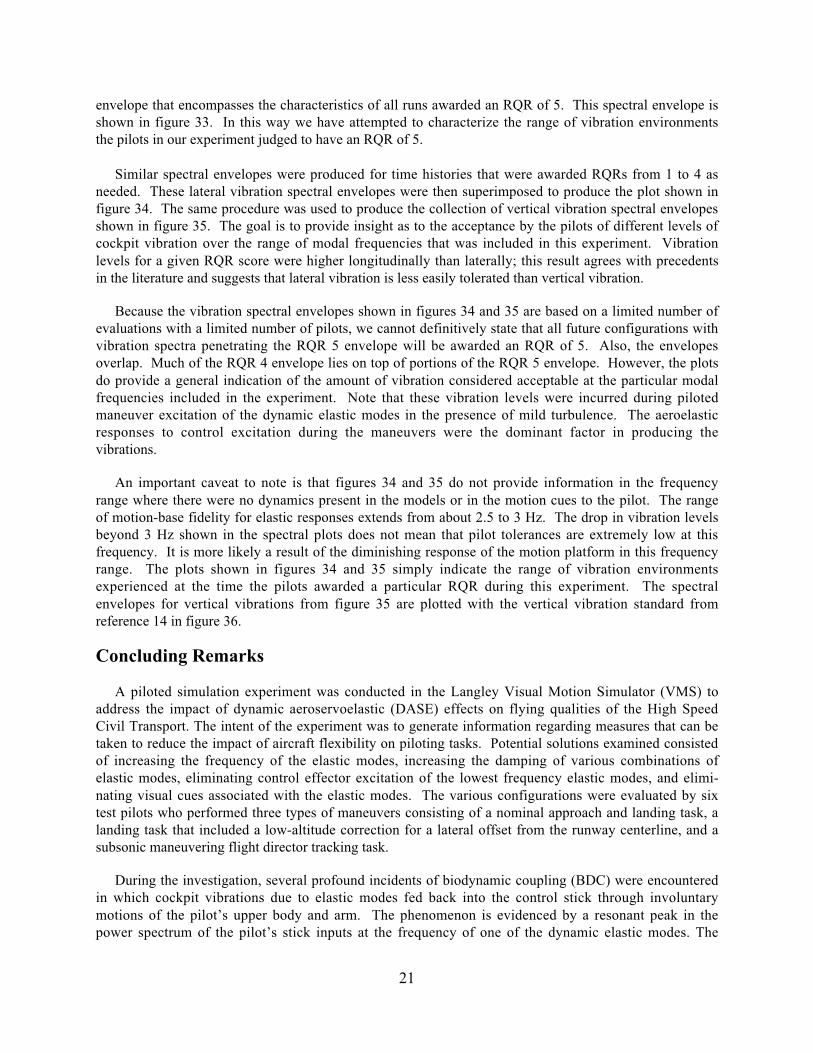
21
envelope that encompasses the characteristics of all runs awarded an RQR of 5. This spectral envelope isshown in figure 33. In this way we have attempted to characterize the range of vibration environmentsthe pilots in our experiment judged to have an RQR of 5.
Similar spectral envelopes were produced for time histories that were awarded RQRs from 1 to 4 asneeded. These lateral vibration spectral envelopes were then superimposed to produce the plot shown infigure 34. The same procedure was used to produce the collection of vertical vibration spectral envelopesshown in figure 35. The goal is to provide insight as to the acceptance by the pilots of different levels ofcockpit vibration over the range of modal frequencies that was included in this experiment. Vibrationlevels for a given RQR score were higher longitudinally than laterally; this result agrees with precedentsin the literature and suggests that lateral vibration is less easily tolerated than vertical vibration.
Because the vibration spectral envelopes shown in figures 34 and 35 are based on a limited number ofevaluations with a limited number of pilots, we cannot definitively state that all future configurations withvibration spectra penetrating the RQR 5 envelope will be awarded an RQR of 5. Also, the envelopesoverlap. Much of the RQR 4 envelope lies on top of portions of the RQR 5 envelope. However, the plotsdo provide a general indication of the amount of vibration considered acceptable at the particular modalfrequencies included in the experiment. Note that these vibration levels were incurred during pilotedmaneuver excitation of the dynamic elastic modes in the presence of mild turbulence. The aeroelasticresponses to control excitation during the maneuvers were the dominant factor in producing thevibrations.
An important caveat to note is that figures 34 and 35 do not provide information in the frequencyrange where there were no dynamics present in the models or in the motion cues to the pilot. The rangeof motion-base fidelity for elastic responses extends from about 2.5 to 3 Hz. The drop in vibration levelsbeyond 3 Hz shown in the spectral plots does not mean that pilot tolerances are extremely low at thisfrequency. It is more likely a result of the diminishing response of the motion platform in this frequencyrange. The plots shown in figures 34 and 35 simply indicate the range of vibration environmentsexperienced at the time the pilots awarded a particular RQR during this experiment. The spectralenvelopes for vertical vibrations from figure 35 are plotted with the vertical vibration standard fromreference 14 in figure 36.
Concluding Remarks
A piloted simulation experiment was conducted in the Langley Visual Motion Simulator (VMS) toaddress the impact of dynamic aeroservoelastic (DASE) effects on flying qualities of the High SpeedCivil Transport. The intent of the experiment was to generate information regarding measures that can betaken to reduce the impact of aircraft flexibility on piloting tasks. Potential solutions examined consistedof increasing the frequency of the elastic modes, increasing the damping of various combinations ofelastic modes, eliminating control effector excitation of the lowest frequency elastic modes, and elimi-nating visual cues associated with the elastic modes. The various configurations were evaluated by sixtest pilots who performed three types of maneuvers consisting of a nominal approach and landing task, alanding task that included a low-altitude correction for a lateral offset from the runway centerline, and asubsonic maneuvering flight director tracking task.
During the investigation, several profound incidents of biodynamic coupling (BDC) were encounteredin which cockpit vibrations due to elastic modes fed back into the control stick through involuntarymotions of the pilot’s upper body and arm. The phenomenon is evidenced by a resonant peak in thepower spectrum of the pilot’s stick inputs at the frequency of one of the dynamic elastic modes. The

22
tendency to couple with structural modes in this fashion appears to increase when pilots tighten their gripon the stick, often in preparation for the flare as the aircraft nears the runway.
Two of the six evaluation pilots encountered pronounced BDC for aeroelastic configurations that hadlittle or no additional damping of the elastic modes. A third pilot experienced occasional or frequentfeed-through of vibrations back into the control stick that impacted the precision of his inputs for certainstiffened configurations when no additional damping was present. All pilots indicated that vibrationsimpacted the precision of their inputs at some point in the experiment. Pilots were far more prone toexperience adverse coupling with antisymmetric modes rather than symmetric modes. Some of the mostextreme instances of BDC occurred with the configurations in which a damping ratio of 0.3 was appliedto the symmetric modes, whereas no additional damping was applied to the antisymmetric modes. Theseverity of the BDC phenomenon may have implications for control stick design and for the flight criti-cality of an active mode suppression control system.
The results of this investigation indicate that structural stiffening and compensation of the visualdisplay were of little benefit in alleviating the impact of elastic dynamics on piloting tasks, whereasincreased damping and elimination of control-effector excitation of the lowest frequency modes bothoffered great improvements when applied in sufficient degree. Structural stiffening did not provideeffective relief from BDC for the two pilots who appeared most prone to this type of interaction. Damp-ing levels of 0.15 applied to the first symmetric and first antisymmetric modes appeared sufficient toprevent BDC. When damping levels of 0.3 were applied to the first two symmetric and first two anti-symmetric modes, average pilot ratings indicated that a borderline-acceptable configuration was achieved.With the addition of mode-canceling control, in which control effector excitation of the first symmetricand first antisymmetric modes was eliminated, the average pilot ratings indicate that an acceptable con-figuration was achieved.
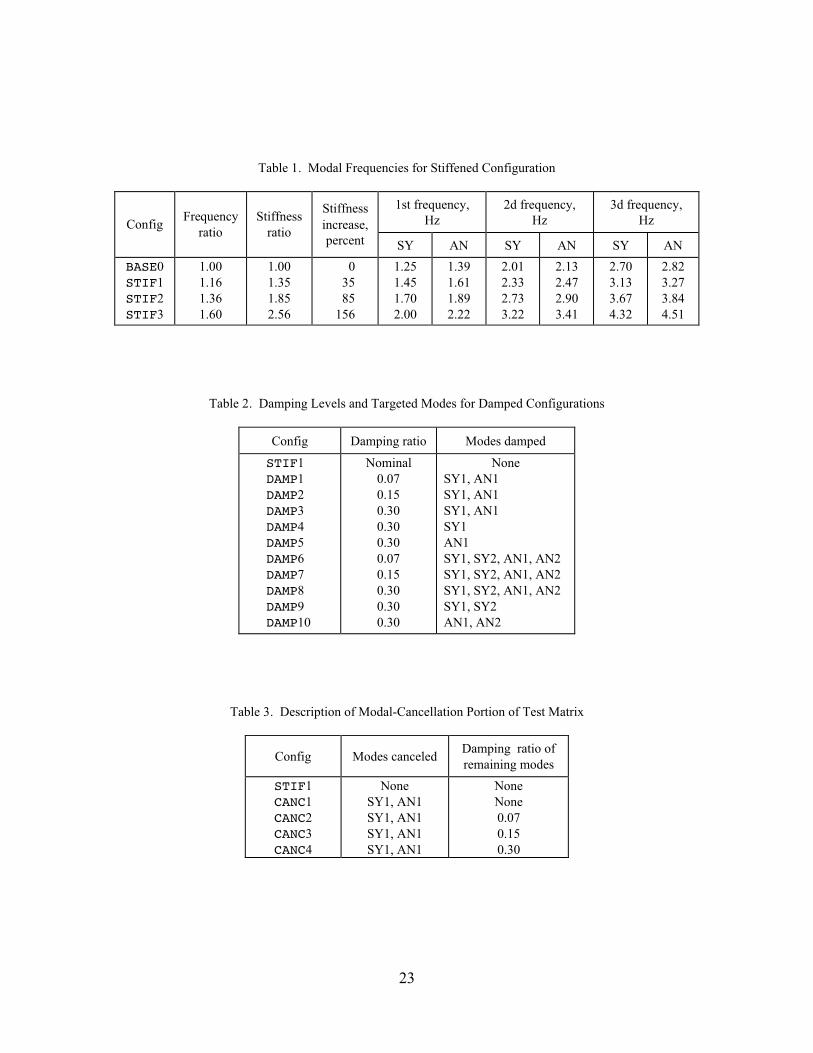
23
Table 1. Modal Frequencies for Stiffened Configuration
1st frequency,Hz
2d frequency,Hz
3d frequency,HzConfig
Frequencyratio
Stiffnessratio
Stiffnessincrease,percent SY AN SY AN SY AN
BASE0STIF1STIF2STIF3
1.001.161.361.60
1.001.351.852.56
0 35 85156
1.251.451.702.00
1.391.611.892.22
2.012.332.733.22
2.132.472.903.41
2.703.133.674.32
2.823.273.844.51
Table 2. Damping Levels and Targeted Modes for Damped Configurations
Config Damping ratio Modes damped
STIF1DAMP1DAMP2DAMP3DAMP4DAMP5DAMP6DAMP7DAMP8DAMP9DAMP10
Nominal0.070.150.300.300.300.070.150.300.300.30
NoneSY1, AN1SY1, AN1SY1, AN1SY1AN1SY1, SY2, AN1, AN2SY1, SY2, AN1, AN2SY1, SY2, AN1, AN2SY1, SY2AN1, AN2
Table 3. Description of Modal-Cancellation Portion of Test Matrix
Config Modes canceledDamping ratio ofremaining modes
STIF1CANC1CANC2CANC3CANC4
NoneSY1, AN1SY1, AN1SY1, AN1SY1, AN1
NoneNone0.070.150.30
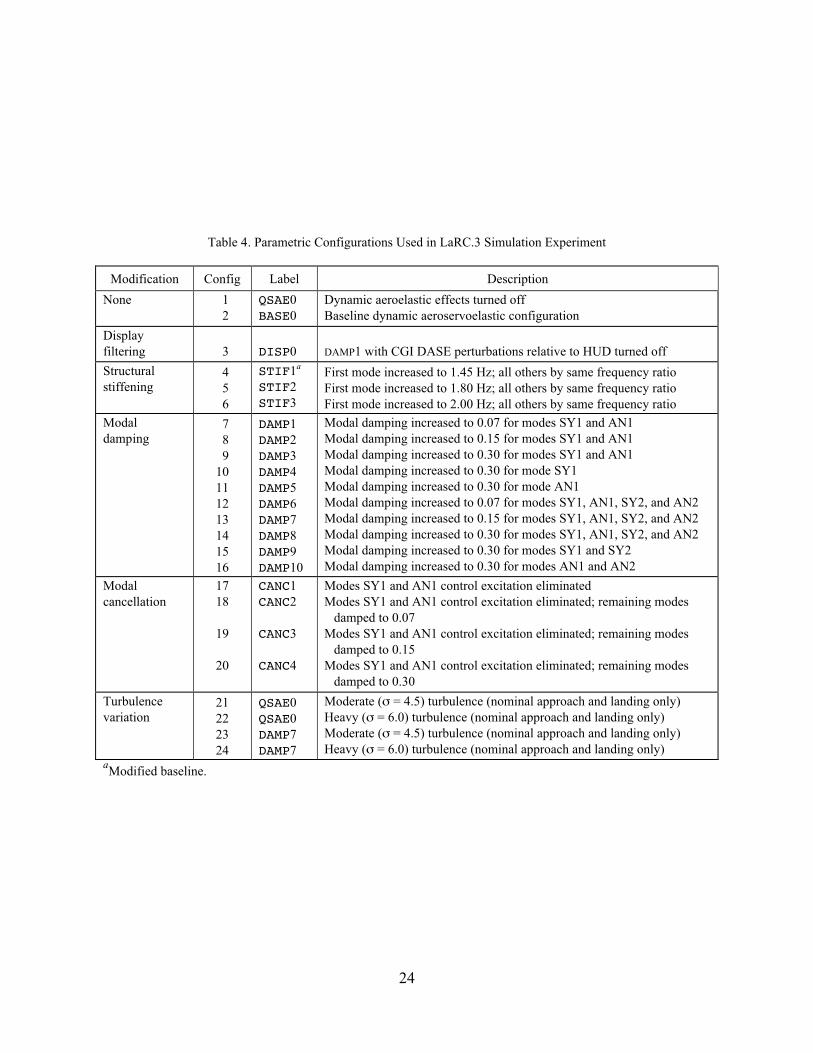
24
Table 4. Parametric Configurations Used in LaRC.3 Simulation Experiment
Modification Config Label Description
None 1 2
QSAE0BASE0
Dynamic aeroelastic effects turned offBaseline dynamic aeroservoelastic configuration
Displayfiltering 3 DISP0 DAMP1 with CGI DASE perturbations relative to HUD turned off
Structuralstiffening
4 5 6
STIF1a
STIF2STIF3
First mode increased to 1.45 Hz; all others by same frequency ratioFirst mode increased to 1.80 Hz; all others by same frequency ratioFirst mode increased to 2.00 Hz; all others by same frequency ratio
Modaldamping
7 8 910111213141516
DAMP1DAMP2DAMP3DAMP4DAMP5DAMP6DAMP7DAMP8DAMP9DAMP10
Modal damping increased to 0.07 for modes SY1 and AN1Modal damping increased to 0.15 for modes SY1 and AN1Modal damping increased to 0.30 for modes SY1 and AN1Modal damping increased to 0.30 for mode SY1Modal damping increased to 0.30 for mode AN1Modal damping increased to 0.07 for modes SY1, AN1, SY2, and AN2Modal damping increased to 0.15 for modes SY1, AN1, SY2, and AN2Modal damping increased to 0.30 for modes SY1, AN1, SY2, and AN2Modal damping increased to 0.30 for modes SY1 and SY2Modal damping increased to 0.30 for modes AN1 and AN2
Modalcancellation
1718
19
20
CANC1CANC2
CANC3
CANC4
Modes SY1 and AN1 control excitation eliminatedModes SY1 and AN1 control excitation eliminated; remaining modes
damped to 0.07Modes SY1 and AN1 control excitation eliminated; remaining modes
damped to 0.15Modes SY1 and AN1 control excitation eliminated; remaining modes
damped to 0.30
Turbulencevariation
21222324
QSAE0QSAE0DAMP7DAMP7
Moderate (σ = 4.5) turbulence (nominal approach and landing only)Heavy (σ = 6.0) turbulence (nominal approach and landing only)Moderate (σ = 4.5) turbulence (nominal approach and landing only)Heavy (σ = 6.0) turbulence (nominal approach and landing only)
aModified baseline.
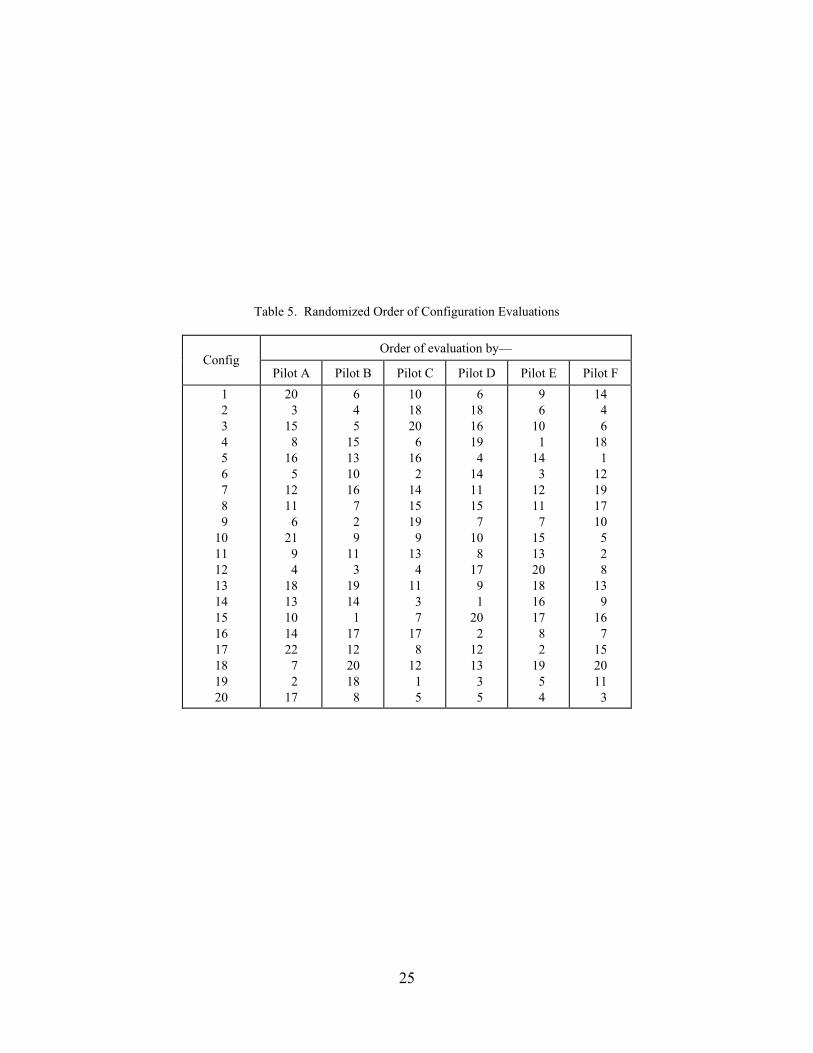
25
Table 5. Randomized Order of Configuration Evaluations
Order of evaluation by—Config
Pilot A Pilot B Pilot C Pilot D Pilot E Pilot F
1 2 3 4 5 6 7 8 91011121314151617181920
20 315 816 51211 621 9 41813101422 7 217
6 4 515131016 7 2 911 31914 117122018 8
101820 616 2141519 913 411 3 717 812 1 5
6181619 4141115 710 817 9 120 21213 3 5
9 610 114 31211 7151320181617 8 219 5 4
14 4 618 112191710 5 2 813 916 7152011 3
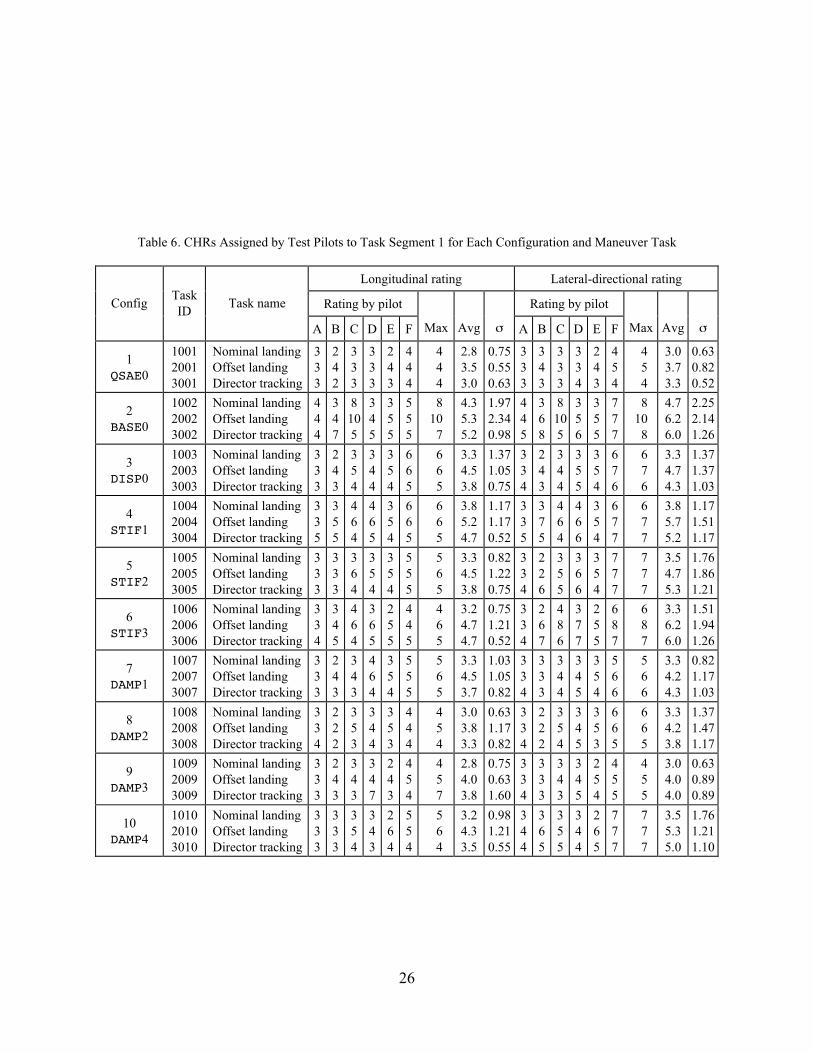
26
Table 6. CHRs Assigned by Test Pilots to Task Segment 1 for Each Configuration and Maneuver Task
Longitudinal rating Lateral-directional rating
Rating by pilot Rating by pilotConfigTaskID
Task name
A B C D E F Max Avg σ A B C D E F Max Avg σ
1QSAE0
100120013001
Nominal landingOffset landingDirector tracking
333
242
333
333
243
444
4 4 4
2.83.53.0
0.750.550.63
333
343
333
334
243
454
4 5 4
3.03.73.3
0.630.820.52
2BASE0
100220023002
Nominal landingOffset landingDirector tracking
444
347
8105
345
355
555
810 7
4.35.35.2
1.972.340.98
445
368
8105
356
355
777
810 8
4.76.26.0
2.252.141.26
3DISP0
100320033003
Nominal landingOffset landingDirector tracking
333
243
354
344
354
665
6 6 5
3.34.53.8
1.371.050.75
334
243
344
355
354
676
6 7 6
3.34.74.3
1.371.371.03
4STIF1
100420043004
Nominal landingOffset landingDirector tracking
335
355
464
465
354
665
6 6 5
3.85.24.7
1.171.170.52
335
375
464
466
354
677
6 7 7
3.85.75.2
1.171.511.17
5STIF2
100520053005
Nominal landingOffset landingDirector tracking
333
333
364
354
354
555
5 6 5
3.34.53.8
0.821.220.75
334
226
355
366
354
777
7 7 7
3.54.75.3
1.761.861.21
6STIF3
100620063006
Nominal landingOffset landingDirector tracking
334
345
464
365
255
445
4 6 5
3.24.74.7
0.751.210.52
334
267
486
377
255
687
6 8 7
3.36.26.0
1.511.941.26
7DAMP1
100720073007
Nominal landingOffset landingDirector tracking
333
243
343
464
354
555
5 6 5
3.34.53.7
1.031.050.82
334
333
344
345
354
566
5 6 6
3.34.24.3
0.821.171.03
8DAMP2
100820083008
Nominal landingOffset landingDirector tracking
334
222
353
344
353
444
4 5 4
3.03.83.3
0.631.170.82
334
222
354
345
353
665
6 6 5
3.34.23.8
1.371.471.17
9DAMP3
100920093009
Nominal landingOffset landingDirector tracking
333
243
343
347
243
454
4 5 7
2.84.03.8
0.750.631.60
334
333
343
345
254
455
4 5 5
3.04.04.0
0.630.890.89
10DAMP4
101020103010
Nominal landingOffset landingDirector tracking
333
333
354
343
264
554
5 6 4
3.24.33.5
0.981.210.55
344
365
355
344
265
777
7 7 7
3.55.35.0
1.761.211.10
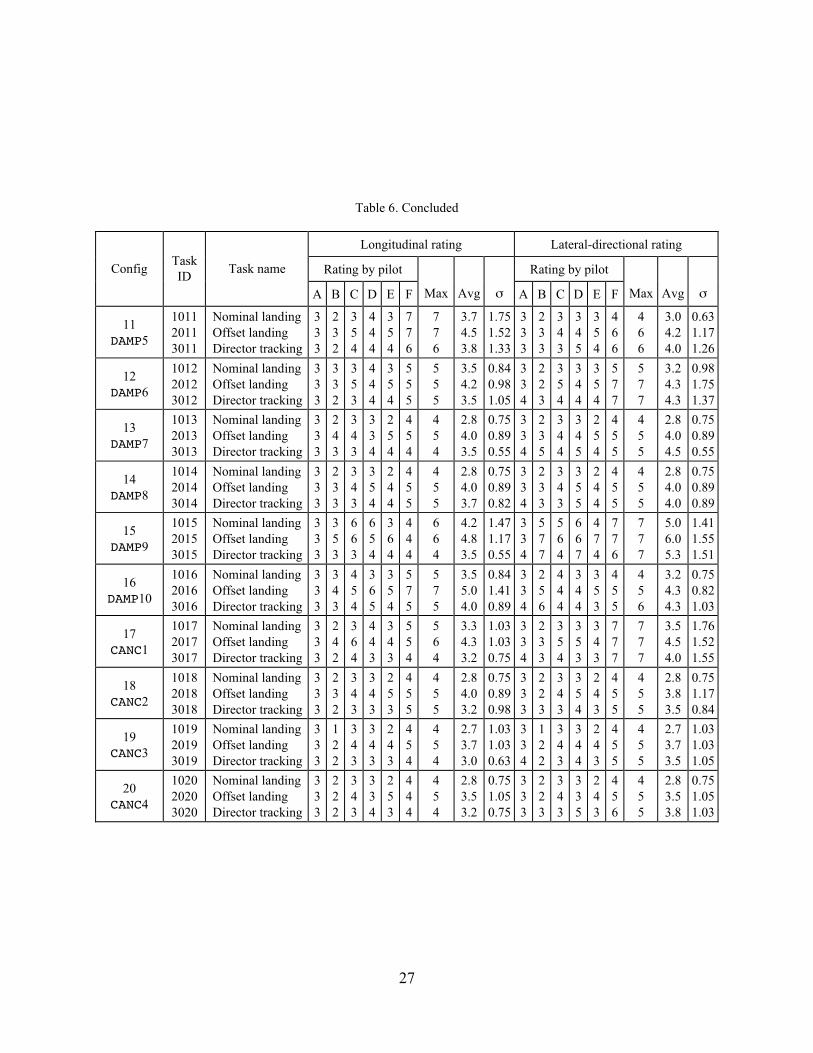
27
Table 6. Concluded
Longitudinal rating Lateral-directional rating
Rating by pilot Rating by pilotConfigTaskID
Task name
A B C D E F Max Avg σ A B C D E F Max Avg σ
11DAMP5
101120113011
Nominal landingOffset landingDirector tracking
333
232
354
444
354
776
776
3.74.53.8
1.751.521.33
333
233
343
345
354
466
466
3.04.24.0
0.631.171.26
12DAMP6
101220123012
Nominal landingOffset landingDirector tracking
333
332
353
444
354
555
555
3.54.23.5
0.840.981.05
334
223
354
344
354
577
577
3.24.34.3
0.981.751.37
13DAMP7
101320133013
Nominal landingOffset landingDirector tracking
333
243
343
334
254
454
454
2.84.03.5
0.750.890.55
334
235
344
345
254
455
455
2.84.04.5
0.750.890.55
14DAMP8
101420143014
Nominal landingOffset landingDirector tracking
333
233
343
354
244
455
455
2.84.03.7
0.750.890.82
334
233
343
355
244
455
455
2.84.04.0
0.750.890.89
15DAMP9
101520153015
Nominal landingOffset landingDirector tracking
333
353
663
654
364
444
664
4.24.83.5
1.471.170.55
334
577
564
667
474
776
777
5.06.05.3
1.411.551.51
16DAMP10
101620163016
Nominal landingOffset landingDirector tracking
333
343
454
365
354
575
575
3.55.04.0
0.841.410.89
334
256
444
344
353
455
456
3.24.34.3
0.750.821.03
17CANC1
101720173017
Nominal landingOffset landingDirector tracking
333
242
364
443
343
554
564
3.34.33.2
1.031.030.75
334
233
354
353
343
777
777
3.54.54.0
1.761.521.55
18CANC2
101820183018
Nominal landingOffset landingDirector tracking
333
232
343
343
253
455
455
2.84.03.2
0.750.890.98
333
223
343
354
243
455
455
2.83.83.5
0.751.170.84
19CANC3
101920193019
Nominal landingOffset landingDirector tracking
333
122
343
343
243
454
454
2.73.73.0
1.031.030.63
334
122
343
344
243
455
455
2.73.73.5
1.031.031.05
20CANC4
102020203020
Nominal landingOffset landingDirector tracking
333
222
343
334
253
444
454
2.83.53.2
0.751.050.75
333
223
343
335
243
456
455
2.83.53.8
0.751.051.03
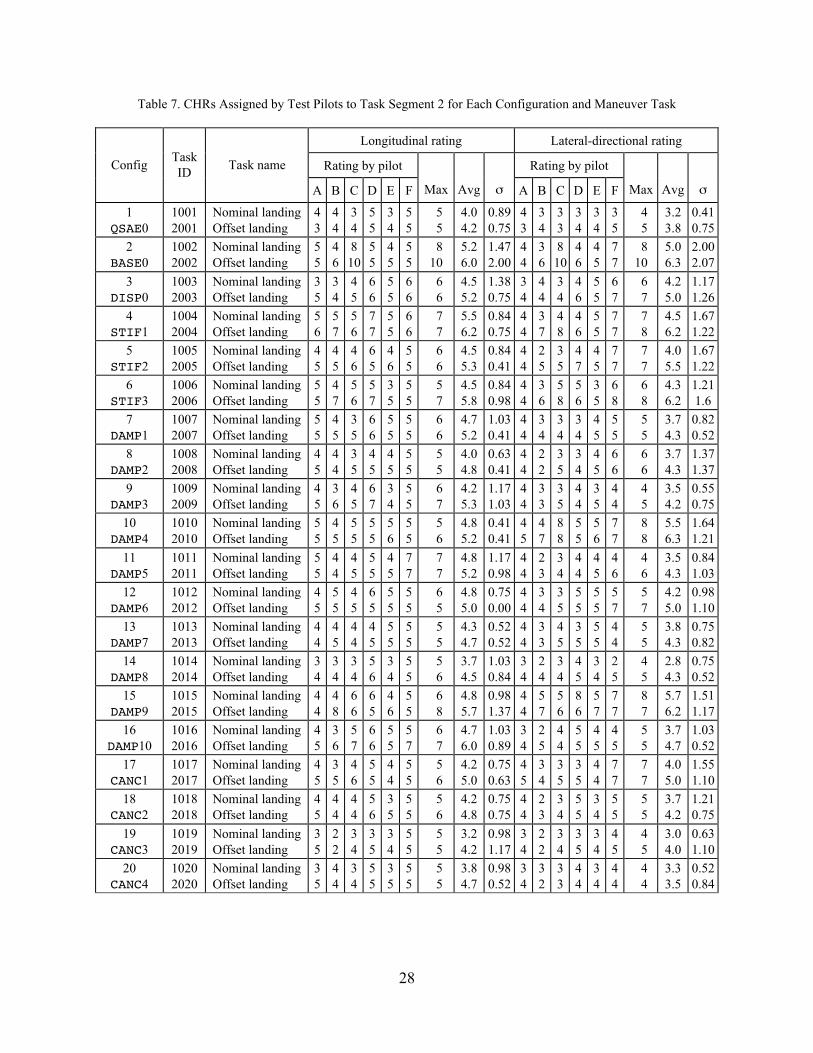
28
Table 7. CHRs Assigned by Test Pilots to Task Segment 2 for Each Configuration and Maneuver Task
Longitudinal rating Lateral-directional rating
Rating by pilot Rating by pilotConfigTaskID
Task name
A B C D E F Max Avg σ A B C D E F Max Avg σ
1QSAE0
10012001
Nominal landingOffset landing
43
44
34
55
34
55
5 5
4.04.2
0.890.75
43
34
33
34
34
35
4 5
3.23.8
0.410.75
2BASE0
10022002
Nominal landingOffset landing
55
46
810
55
45
55
810
5.26.0
1.472.00
44
36
810
46
45
77
810
5.06.3
2.002.07
3DISP0
10032003
Nominal landingOffset landing
35
34
45
66
55
66
6 6
4.55.2
1.380.75
34
44
34
46
55
67
6 7
4.25.0
1.171.26
4STIF1
10042004
Nominal landingOffset landing
56
57
56
77
55
66
7 7
5.56.2
0.840.75
44
37
48
46
55
77
7 8
4.56.2
1.671.22
5STIF2
10052005
Nominal landingOffset landing
45
45
46
65
46
55
6 6
4.55.3
0.840.41
44
25
35
47
45
77
7 7
4.05.5
1.671.22
6STIF3
10062006
Nominal landingOffset landing
55
47
56
57
35
55
5 7
4.55.8
0.840.98
44
36
58
56
35
68
6 8
4.36.2
1.211.6
7DAMP1
10072007
Nominal landingOffset landing
55
45
35
66
55
55
6 6
4.75.2
1.030.41
44
34
34
34
45
55
5 5
3.74.3
0.820.52
8DAMP2
10082008
Nominal landingOffset landing
45
44
35
45
45
55
5 5
4.04.8
0.630.41
44
22
35
34
45
66
6 6
3.74.3
1.371.37
9DAMP3
10092009
Nominal landingOffset landing
45
36
45
67
34
55
6 7
4.25.3
1.171.03
44
33
35
44
35
44
4 5
3.54.2
0.550.75
10DAMP4
10102010
Nominal landingOffset landing
55
45
55
55
56
55
5 6
4.85.2
0.410.41
45
47
88
55
56
77
8 8
5.56.3
1.641.21
11DAMP5
10112011
Nominal landingOffset landing
55
44
45
55
45
77
7 7
4.85.2
1.170.98
44
23
34
44
45
46
4 6
3.54.3
0.841.03
12DAMP6
10122012
Nominal landingOffset landing
45
55
45
65
55
55
6 5
4.85.0
0.750.00
44
34
35
55
55
57
5 7
4.25.0
0.981.10
13DAMP7
10132013
Nominal landingOffset landing
44
45
44
45
55
55
5 5
4.34.7
0.520.52
44
33
45
35
55
44
5 5
3.84.3
0.750.82
14DAMP8
10142014
Nominal landingOffset landing
34
34
34
56
34
55
5 6
3.74.5
1.030.84
34
24
34
45
34
25
4 5
2.84.3
0.750.52
15DAMP9
10152015
Nominal landingOffset landing
44
48
66
65
46
55
6 8
4.85.7
0.981.37
44
57
56
86
57
77
8 7
5.76.2
1.511.17
16DAMP10
10162016
Nominal landingOffset landing
45
36
57
66
55
57
6 7
4.76.0
1.030.89
34
25
44
55
45
45
5 5
3.74.7
1.030.52
17CANC1
10172017
Nominal landingOffset landing
45
35
46
55
44
55
5 6
4.25.0
0.750.63
45
34
35
35
44
77
7 7
4.05.0
1.551.10
18CANC2
10182018
Nominal landingOffset landing
45
44
44
56
35
55
5 6
4.24.8
0.750.75
44
23
34
55
34
55
5 5
3.74.2
1.210.75
19CANC3
10192019
Nominal landingOffset landing
35
22
34
35
34
55
5 5
3.24.2
0.981.17
34
22
34
35
34
45
4 5
3.04.0
0.631.10
20CANC4
10202020
Nominal landingOffset landing
35
44
34
55
35
55
5 5
3.84.7
0.980.52
34
32
33
44
34
44
4 4
3.33.5
0.520.84
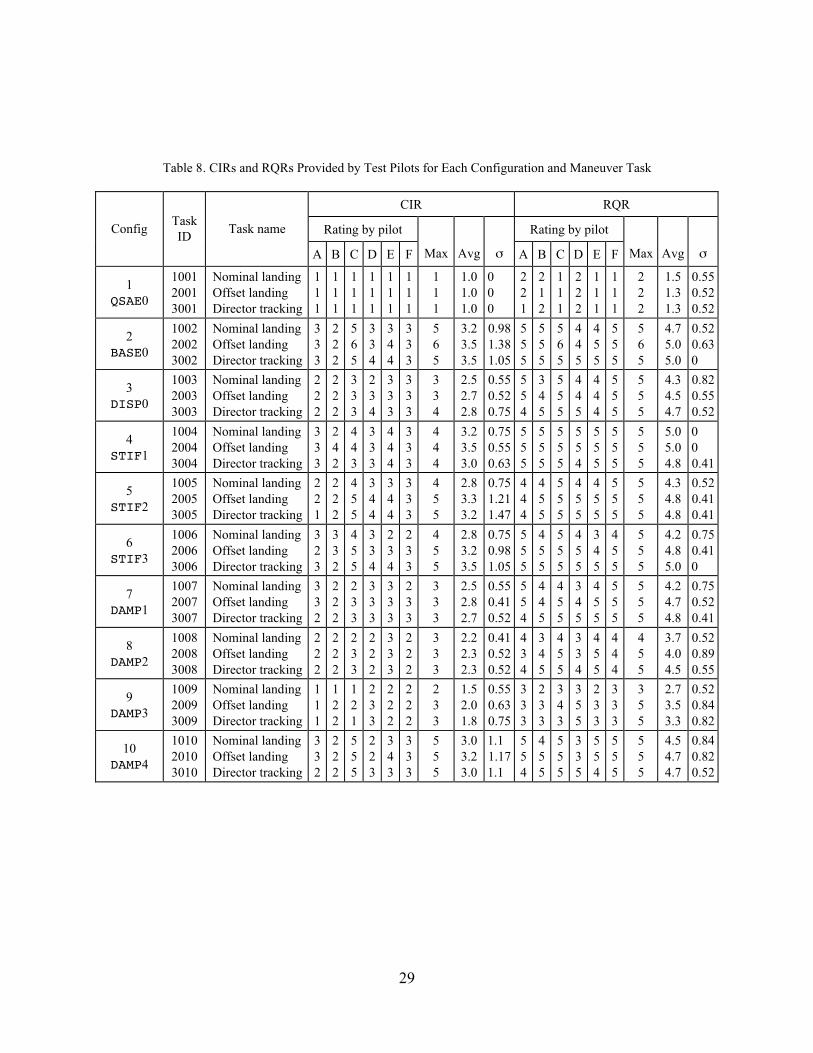
29
Table 8. CIRs and RQRs Provided by Test Pilots for Each Configuration and Maneuver Task
CIR RQR
Rating by pilot Rating by pilotConfigTaskID
Task name
A B C D E F Max Avg σ A B C D E F Max Avg σ
1QSAE0
100120013001
Nominal landingOffset landingDirector tracking
111
111
111
111
111
111
111
1.01.01.0
000
221
212
111
222
111
111
222
1.51.31.3
0.550.520.52
2BASE0
100220023002
Nominal landingOffset landingDirector tracking
333
222
565
334
344
333
565
3.23.53.5
0.981.381.05
555
555
565
445
455
555
565
4.75.05.0
0.520.630
3DISP0
100320033003
Nominal landingOffset landingDirector tracking
222
222
333
234
333
333
334
2.52.72.8
0.550.520.75
554
345
555
445
444
555
555
4.34.54.7
0.820.550.52
4STIF1
100420043004
Nominal landingOffset landingDirector tracking
333
242
443
333
444
333
444
3.23.53.0
0.750.550.63
555
555
555
554
555
555
555
5.05.04.8
000.41
5STIF2
100520053005
Nominal landingOffset landingDirector tracking
221
222
455
344
344
333
455
2.83.33.2
0.751.211.47
444
455
555
455
455
555
555
4.34.84.8
0.520.410.41
6STIF3
100620063006
Nominal landingOffset landingDirector tracking
323
332
455
334
234
233
455
2.83.23.5
0.750.981.05
555
455
555
455
345
455
555
4.24.85.0
0.750.410
7DAMP1
100720073007
Nominal landingOffset landingDirector tracking
332
222
233
333
333
233
333
2.52.82.7
0.550.410.52
554
445
455
345
455
555
555
4.24.74.8
0.750.520.41
8DAMP2
100820083008
Nominal landingOffset landingDirector tracking
222
222
233
222
333
222
333
2.22.32.3
0.410.520.52
434
345
455
334
455
444
455
3.74.04.5
0.520.890.55
9DAMP3
100920093009
Nominal landingOffset landingDirector tracking
111
122
121
233
222
222
233
1.52.01.8
0.550.630.75
333
233
343
355
233
333
355
2.73.53.3
0.520.840.82
10DAMP4
101020103010
Nominal landingOffset landingDirector tracking
332
222
555
223
343
333
555
3.03.23.0
1.11.171.1
554
455
555
335
554
555
555
4.54.74.7
0.840.820.52
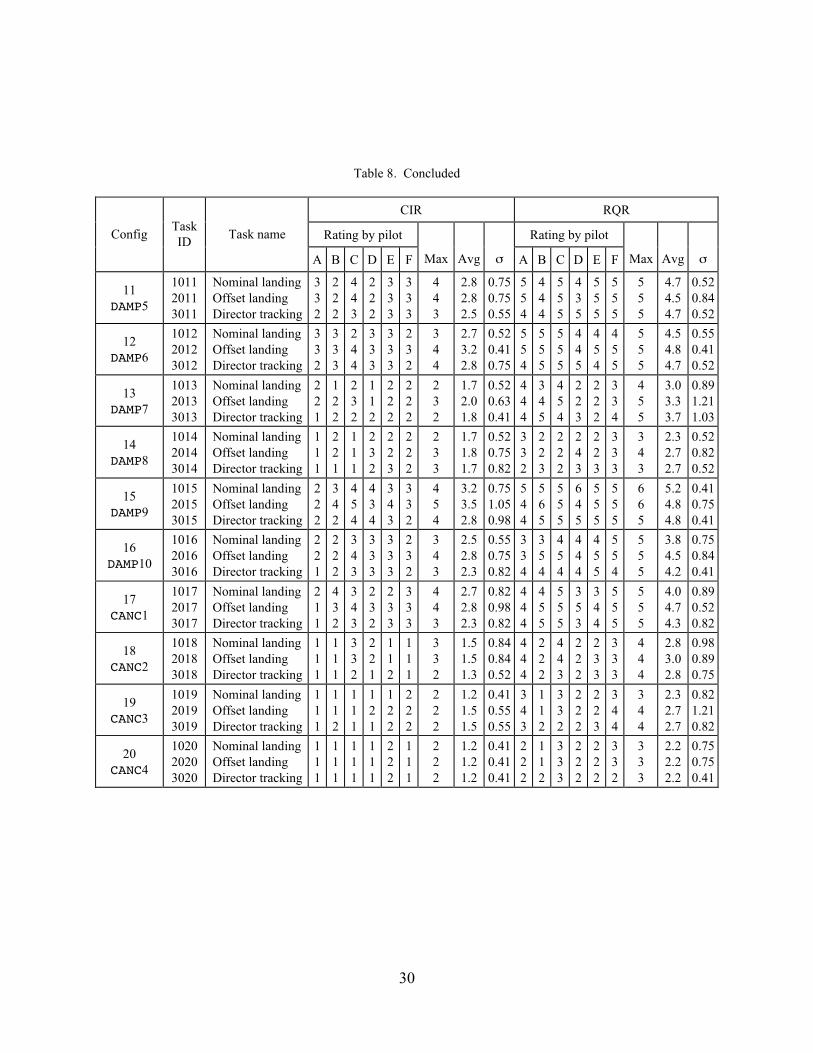
30
Table 8. Concluded
CIR RQR
Rating by pilot Rating by pilotConfigTaskID
Task name
A B C D E F Max Avg σ A B C D E F Max Avg σ
11DAMP5
101120113011
Nominal landingOffset landingDirector tracking
332
222
443
222
333
333
443
2.82.82.5
0.750.750.55
554
444
555
435
555
555
555
4.74.54.7
0.520.840.52
12DAMP6
101220123012
Nominal landingOffset landingDirector tracking
332
333
244
333
333
232
344
2.73.22.8
0.520.410.75
554
555
555
445
454
455
555
4.54.84.7
0.550.410.52
13DAMP7
101320133013
Nominal landingOffset landingDirector tracking
221
122
232
112
222
222
232
1.72.01.8
0.520.630.41
444
345
454
223
222
334
455
3.03.33.7
0.891.211.03
14DAMP8
101420143014
Nominal landingOffset landingDirector tracking
111
221
111
232
223
222
233
1.71.81.7
0.520.750.82
332
223
222
243
223
333
343
2.32.72.7
0.520.820.52
15DAMP9
101520153015
Nominal landingOffset landingDirector tracking
222
342
454
434
343
332
454
3.23.52.8
0.751.050.98
544
565
555
645
555
555
665
5.24.84.8
0.410.750.41
16DAMP10
101620163016
Nominal landingOffset landingDirector tracking
221
222
343
333
333
232
343
2.52.82.3
0.550.750.82
334
354
454
444
455
554
555
3.84.54.2
0.750.840.41
17CANC1
101720173017
Nominal landingOffset landingDirector tracking
211
432
343
232
233
333
443
2.72.82.3
0.820.980.82
444
455
555
353
344
555
555
4.04.74.3
0.890.520.82
18CANC2
101820183018
Nominal landingOffset landingDirector tracking
111
111
332
221
112
111
332
1.51.51.3
0.840.840.52
444
222
443
222
233
333
444
2.83.02.8
0.980.890.75
19CANC3
101920193019
Nominal landingOffset landingDirector tracking
111
112
111
121
122
222
222
1.21.51.5
0.410.550.55
343
112
332
222
223
344
344
2.32.72.7
0.821.210.82
20CANC4
102020203020
Nominal landingOffset landingDirector tracking
111
111
111
111
222
111
222
1.21.21.2
0.410.410.41
222
112
333
222
222
332
333
2.22.22.2
0.750.750.41

31
Table 9. Pilot Preference Ranking for Configuration Based on Average DASE CIR and RQR Scores
RankingAvgCIR
AvgRQR
Config Description
1 2
3
4 5
6 7 8 91011
121314151617181920
1.01.2
1.4
1.41.7
1.81.82.32.62.62.7
2.72.72.93.13.13.23.23.23.4
1.42.2
2.6
2.62.9
3.23.34.14.24.34.5
4.64.64.74.64.74.74.94.94.9
QSAE0CANC4
CANC3
DAMP8CANC2
DAMP3DAMP7DAMP2DAMP10CANC1DISP0
DAMP1DAMP5DAMP6DAMP4STIF2STIF3DAMP9STIF1BASE0
Dynamic aeroelastic effects turned offSY1 and AN1 control excitation eliminated; 0.3 damping of remaining
modesSY1 and AN1 control excitation eliminated; 0.15 damping of remaining
modesModal damping increased to 0.30 for modes SY1, AN1, SY2, and AN2SY1 and AN1 control excitation eliminated; 0.07 damping of remaining
modesModal damping increased to 0.30 for modes SY1 and AN1Modal damping increased to 0.15 for modes SY1, AN1, SY2, and AN2Modal damping increased to 0.15 for modes SY1 and AN1Modal damping increased to 0.30 for modes AN1 and AN2SY1 and AN1 control excitation eliminatedConfiguration DAMP1 with CGI DASE perturbations relative to HUD
turned offModal damping increased to 0.07 for modes SY1 and AN1Modal damping increased to 0.30 for mode AN1Modal damping increased to 0.07 for modes SY1, AN1, SY2, and AN2Modal damping increased to 0.30 for mode SY1First mode increased to 1.80 Hz; all others by same frequency ratioFirst mode increased to 2.00 Hz; all others by same frequency ratioModal damping increased to 0.30 for modes SY1 and SY2First mode increased to 1.45 Hz; all others by same frequency ratioBaseline dynamic aeroservoelastic configuration
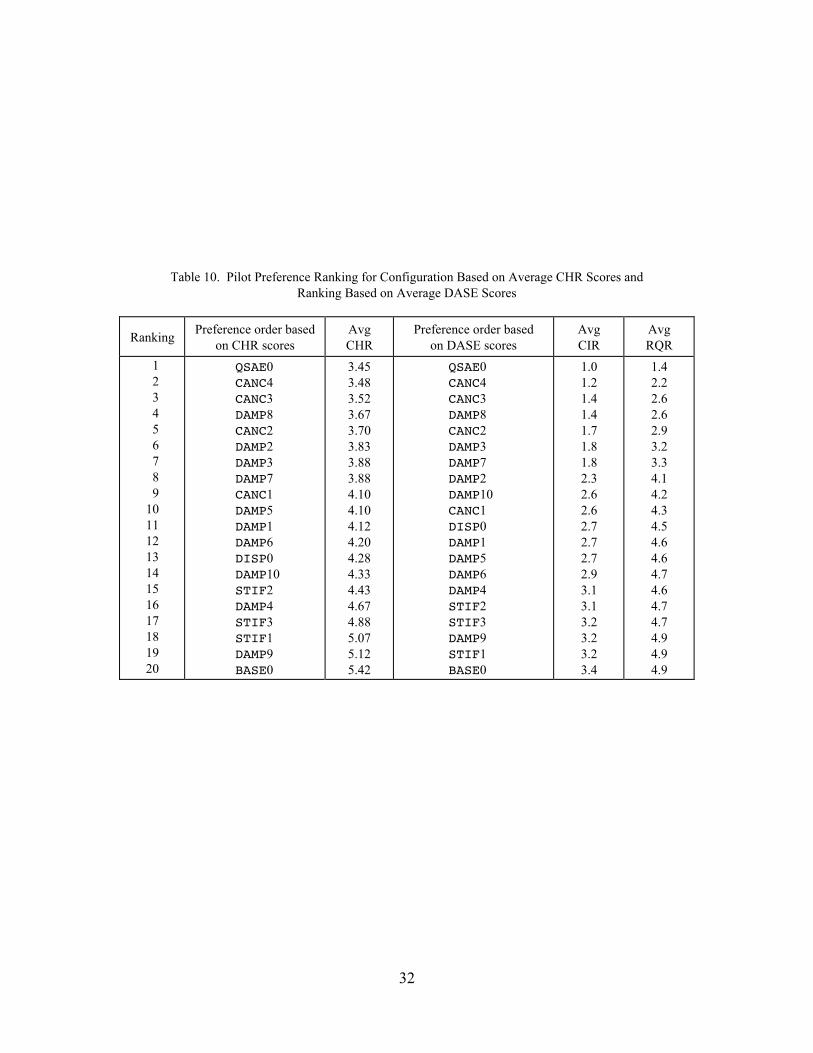
32
Table 10. Pilot Preference Ranking for Configuration Based on Average CHR Scores andRanking Based on Average DASE Scores
RankingPreference order based
on CHR scoresAvgCHR
Preference order basedon DASE scores
AvgCIR
AvgRQR
1 2 3 4 5 6 7 8 91011121314151617181920
QSAE0CANC4CANC3DAMP8CANC2DAMP2DAMP3DAMP7CANC1DAMP5DAMP1DAMP6DISP0DAMP10STIF2DAMP4STIF3STIF1DAMP9BASE0
3.453.483.523.673.703.833.883.884.104.104.124.204.284.334.434.674.885.075.125.42
QSAE0CANC4CANC3DAMP8CANC2DAMP3DAMP7DAMP2DAMP10CANC1DISP0DAMP1DAMP5DAMP6DAMP4STIF2STIF3DAMP9STIF1BASE0
1.01.21.41.41.71.81.82.32.62.62.72.72.72.93.13.13.23.23.23.4
1.42.22.62.62.93.23.34.14.24.34.54.64.64.74.64.74.74.94.94.9
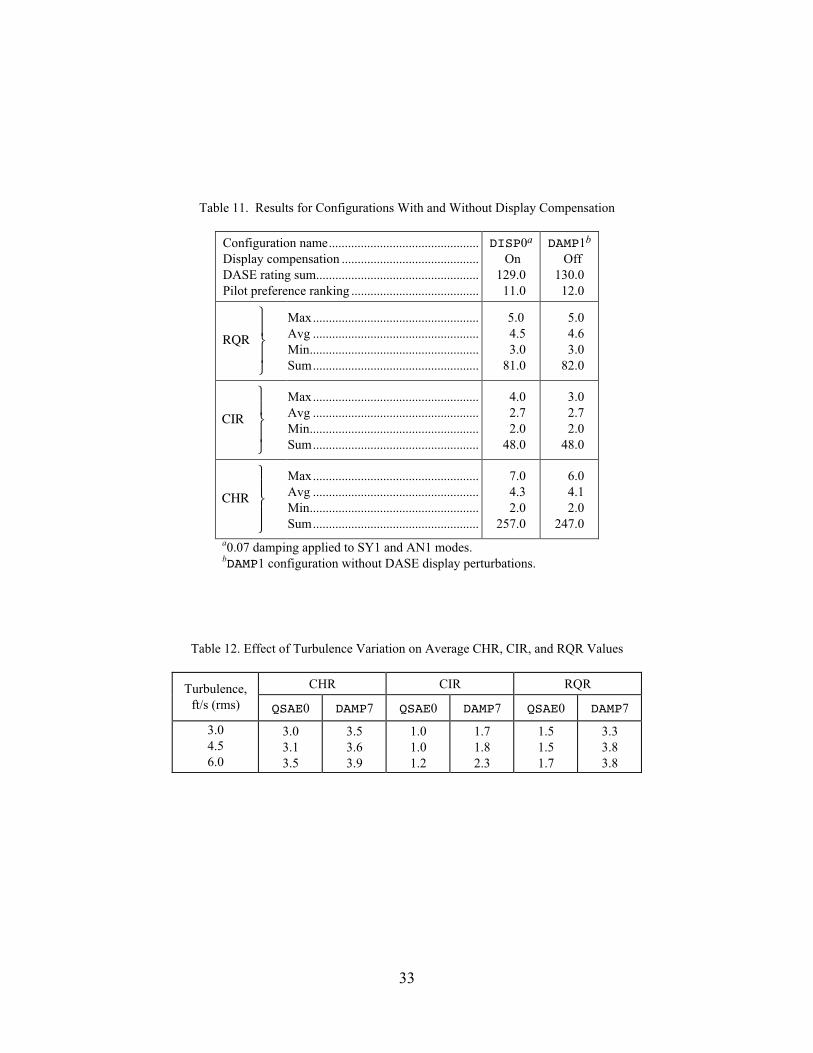
33
Table 11. Results for Configurations With and Without Display Compensation
Configuration name...............................................Display compensation ...........................................DASE rating sum...................................................Pilot preference ranking ........................................
DISP0a
On129.0 11.0
DAMP1b
Off130.0 12.0
RQR
Max....................................................Avg ....................................................Min.....................................................Sum....................................................
5.0 4.5 3.0 81.0
5.0 4.6 3.0 82.0
CIR
Max....................................................Avg ....................................................Min.....................................................Sum....................................................
4.0 2.7 2.0 48.0
3.0 2.7 2.0 48.0
CHR
Max....................................................Avg ....................................................Min.....................................................Sum....................................................
7.0 4.3 2.0257.0
6.0 4.1 2.0247.0
a0.07 damping applied to SY1 and AN1 modes. bDAMP1 configuration without DASE display perturbations.
Table 12. Effect of Turbulence Variation on Average CHR, CIR, and RQR Values
CHR CIR RQRTurbulence,ft/s (rms) QSAE0 DAMP7 QSAE0 DAMP7 QSAE0 DAMP7
3.04.56.0
3.03.13.5
3.53.63.9
1.01.01.2
1.71.82.3
1.51.51.7
3.33.83.8
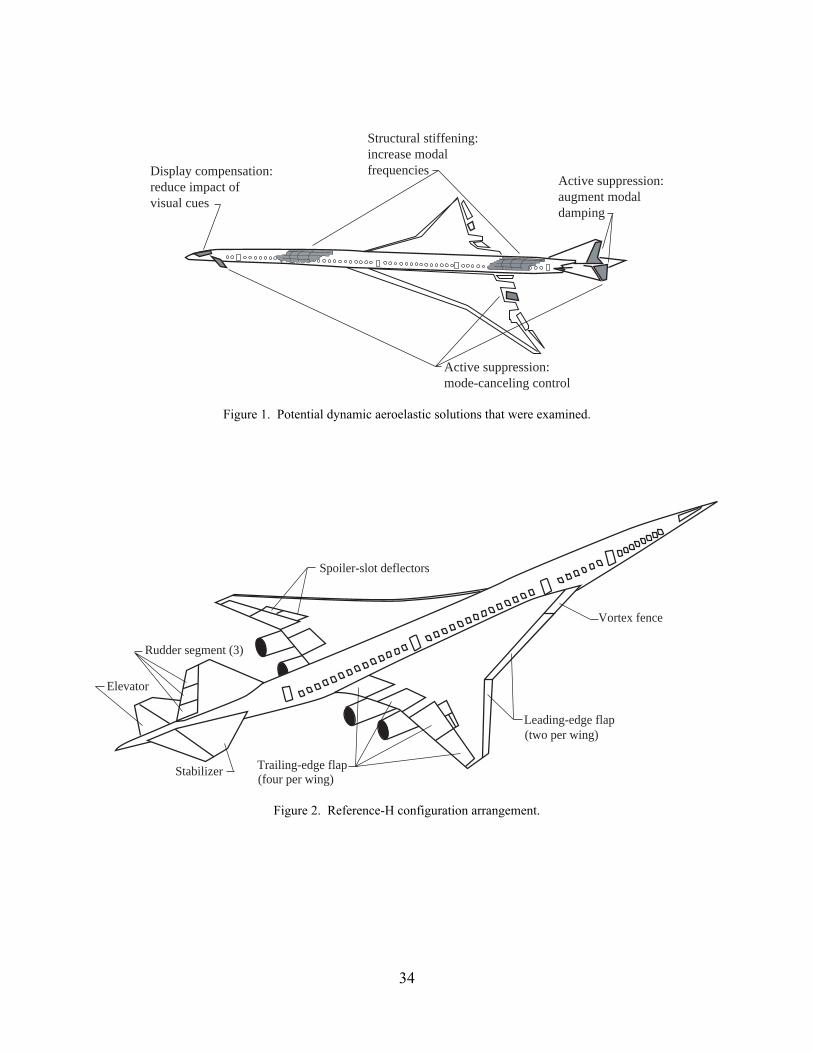
34
Display compensation:reduce impact of visual cues
Structural stiffening:increase modalfrequencies
Active suppression:augment modaldamping
Active suppression:mode-canceling control
Figure 1. Potential dynamic aeroelastic solutions that were examined.
Spoiler-slot deflectors
Rudder segment (3)
Elevator
Stabilizer Trailing-edge flap(four per wing)
Leading-edge flap(two per wing)
Vortex fence
Figure 2. Reference-H configuration arrangement.
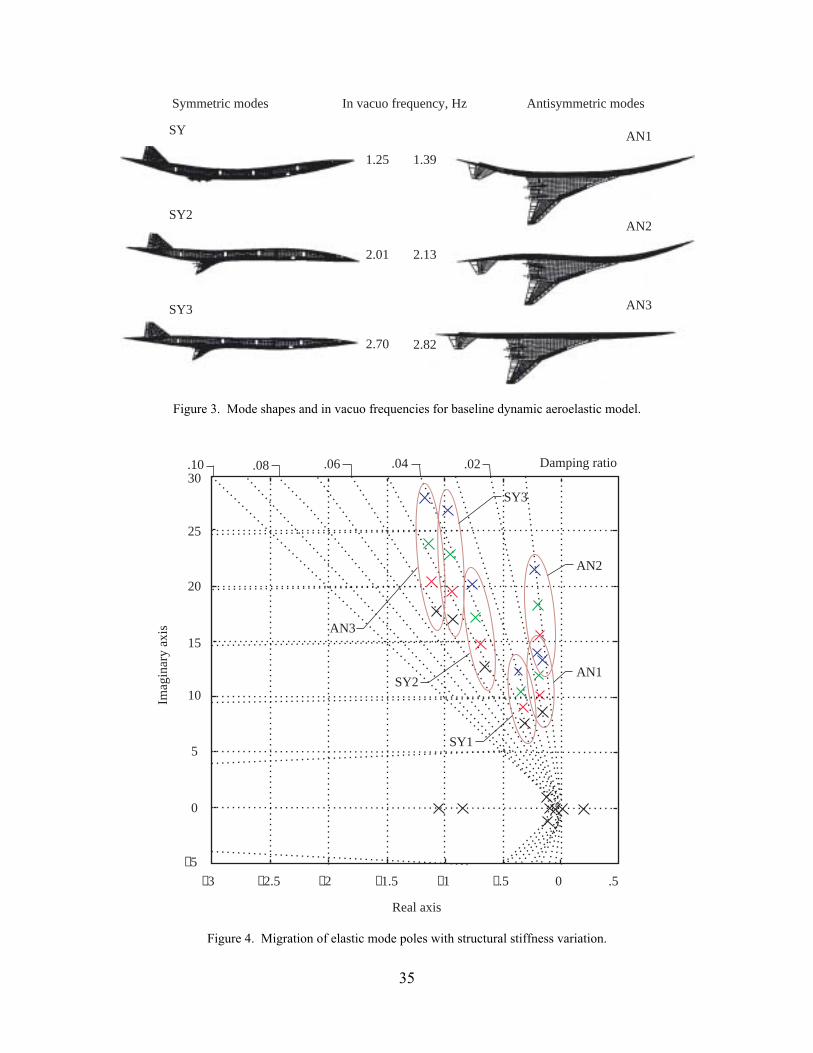
35
In vacuo frequency, HzSymmetric modes Antisymmetric modes
AN1
AN2
AN3
SY
SY2
SY3
2.82
2.13
1.39
2.70
2.01
1.25
Figure 3. Mode shapes and in vacuo frequencies for baseline dynamic aeroelastic model.
Imag
inar
y ax
is
Real axis
30
25
20
15
10
5
0
−5 −2.5−3 −2 −1.5 −1 −.5 0 .5
.10 .08 .06 .04 .02
Damping ratio
AN3
SY3
SY2
SY1
AN1
AN2
Figure 4. Migration of elastic mode poles with structural stiffness variation.
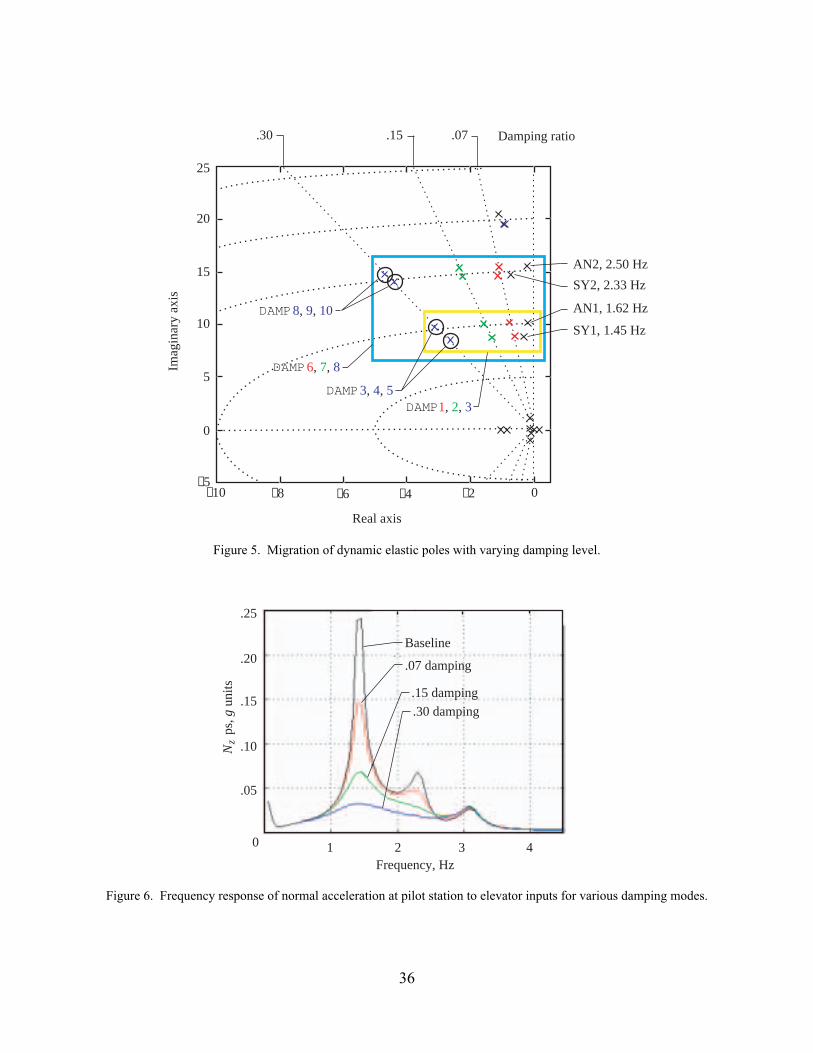
36
.07.15.30
DAMP
DAMP
DAMP
DAMP
8, 9, 10
3, 4, 5
6, 7, 8
1, 2, 3
AN2, 2.50 HzSY2, 2.33 Hz
AN1, 1.62 Hz
SY1, 1.45 Hz
Real axis
Imag
inar
y ax
is25
−10 −8 −6 −4 −2 0
0
−5
5
10
15
20
Damping ratio
Figure 5. Migration of dynamic elastic poles with varying damping level.
N
ps, g
uni
ts
Frequency, Hz
0
.25
.20
.15
.10
.05
1 2 3 4
.07 damping
.15 damping.30 damping
Baseline
z
Figure 6. Frequency response of normal acceleration at pilot station to elevator inputs for various damping modes.

37
0
5
10
15
20
−5
−10
−15
−20−20 0 20
0
5
10
15
20
−5
−10
−15
−20−20 0 20
STIF1 CANC1
Imag
inar
y ax
is
Real axis
Figure 7. Migration of transfer function zeros of dynamic elastic modes with elimination of control excitation.
N
ps, g
uni
ts
Frequency, Hz
0
.25
.20
.15
.10
.05
.07 damping.15 damping
.30 dampingBaseline, withcancellation
1 2 3 4
Baseline, withoutcancellation
z
Figure 8. Effect of eliminating control excitation of first symmetric and first antisymmetric modes on frequencyresponse to elevator inputs.
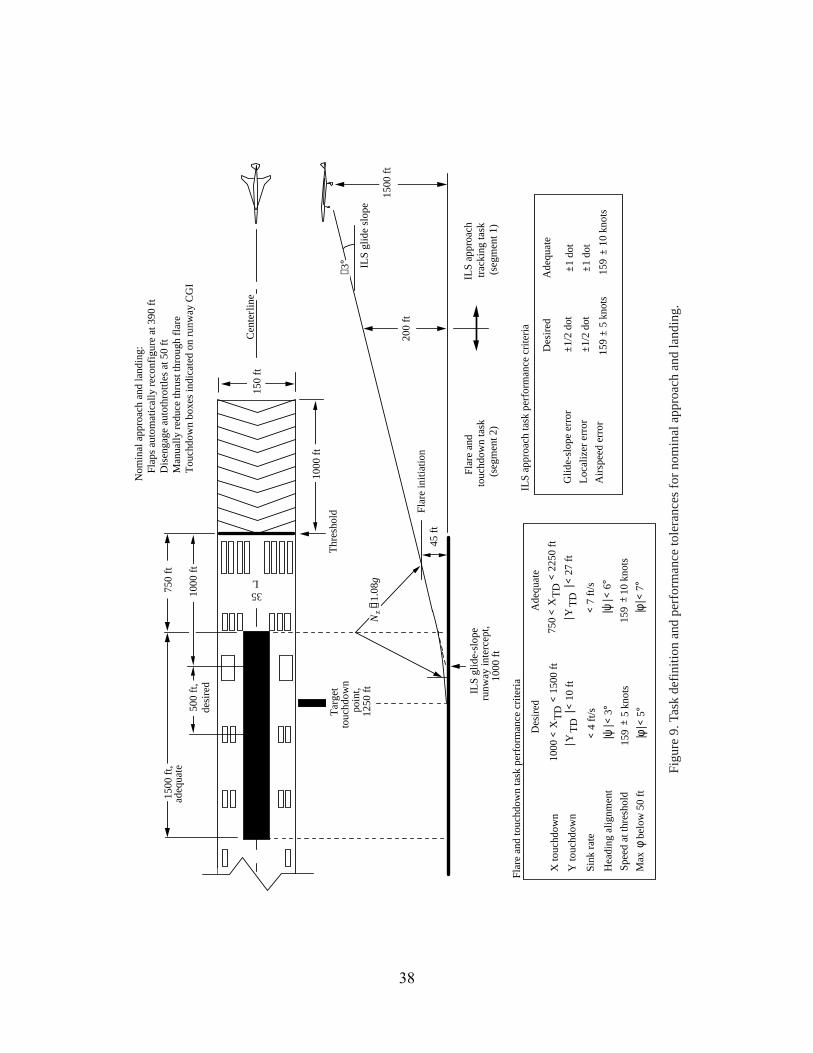
38
35L
Thre
shol
d
ILS
glid
e sl
ope
ILS
glid
e-sl
ope
ru
nway
inte
rcep
t, 10
00 ft
150
ft
1000
ft
Cen
terl
ine
1500
ft
200
ft
Nom
inal
app
roac
h an
d la
ndin
g:
Flap
s aut
omat
ical
ly re
conf
igur
e at
390
ft
Dis
enga
ge a
utot
hrot
tles a
t 50
ft
Man
ually
redu
ce th
rust
thro
ugh
flare
To
uchd
own
boxe
s ind
icat
ed o
n ru
nway
CG
I
Flar
e an
d to
uchd
own
task
per
form
ance
crit
eria
Des
ired
A
dequ
ate
X to
uchd
own
1000
< X
TD <
150
0 ft
| YTD
| < 1
0 ft
< 4
ft/s
| ψ| <
3°
750
< X
TD <
225
0 ft
| YTD
| < 2
7 ft
< 7
ft/s
| ψ| <
6°
Y to
uchd
own
Sink
rate
Hea
ding
alig
nmen
t
ILS
appr
oach
task
per
form
ance
crit
eria
Des
ired
Ade
quat
e
Glid
e-sl
ope
erro
rLo
caliz
er e
rror
Airs
peed
err
or15
9 ±
5 kn
ots
159
± 10
kno
ts
±1 d
ot±1
/2 d
ot
±1
dot
±1/2
dot
ILS
appr
oach
track
ing
task
(s
egm
ent 1
)
Flar
e an
d to
uchd
own
task
(s
egm
ent 2
)
Flar
e in
itiat
ion
45 ft
N
1.0
8g750
ft
−3°
Targ
et
touc
hdow
n po
int,
1250
ft
1500
ft,
adeq
uate
+ 10
ft
+ 27
ft
desi
red
500
ft,10
00 ft
159
5 k
nots
159
10
knot
sSp
eed
at th
resh
old
| φ| <
5°
| φ| <
7°
Max
φ b
elow
50
ft±
z
Figu
re 9
. Tas
k de
finiti
on a
nd p
erfo
rman
ce to
lera
nces
for n
omin
al a
ppro
ach
and
land
ing.
±∼ ∼
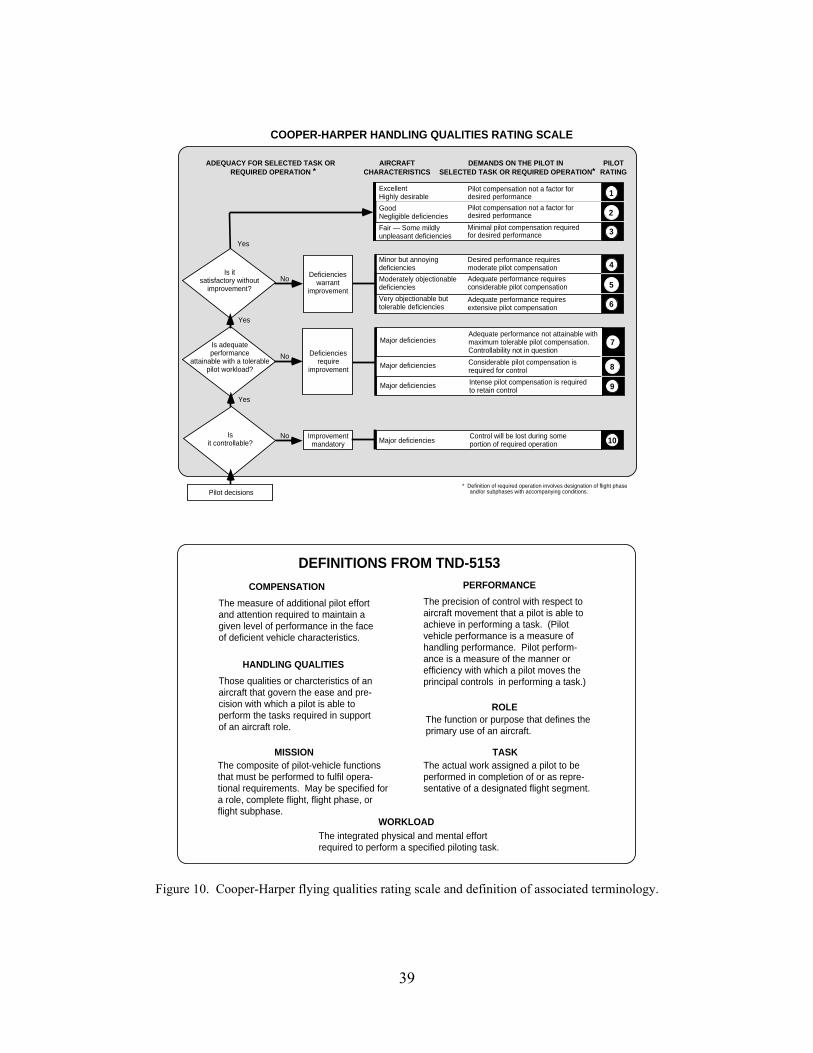
39
COOPER-HARPER HANDLING QUALITIES RATING SCALE
ADEQUACY FOR SELECTED TASK ORREQUIRED OPERATION *
AIRCRAFTCHARACTERISTICS
DEMANDS ON THE PILOT INSELECTED TASK OR REQUIRED OPERATION*
PILOTRATING
1Deficiencies
warrantimprovement
Is adequateperformance
attainable with a tolerablepilot workload?
Pilot compensation not a factor fordesired performance
Pilot compensation not a factor fordesired performance
Minimal pilot compensation requiredfor desired performance
ExcellentHighly desirable
Pilot decisions
Yes
Yes
Yes
No
No
No
Deficienciesrequire
improvement
GoodNegligible deficiencies
Fair — Some mildlyunpleasant deficiencies
Minor but annoyingdeficiencies
Moderately objectionabledeficiencies
Very objectionable buttolerable deficiencies
Desired performance requiresmoderate pilot compensation
Adequate performance requiresconsiderable pilot compensation
Adequate performance requiresextensive pilot compensation
Adequate performance not attainable withmaximum tolerable pilot compensation.Controllability not in question
Considerable pilot compensation isrequired for control
Intense pilot compensation is requiredto retain control
Major deficiencies
Major deficiencies
Major deficiencies
Control will be lost during someportion of required operationMajor deficiencies
* Definition of required operation involves designation of flight phase and/or subphases with accompanying conditions.
1
2
3
4
5
6
7
8
9
10
Is itsatisfactory without
improvement?
Isit controllable?
Improvementmandatory
COMPENSATION
The measure of additional pilot effortand attention required to maintain agiven level of performance in the faceof deficient vehicle characteristics.
Those qualities or charcteristics of anaircraft that govern the ease and pre-cision with which a pilot is able toperform the tasks required in supportof an aircraft role.
HANDLING QUALITIES
MISSIONThe composite of pilot-vehicle functionsthat must be performed to fulfil opera-tional requirements. May be specified fora role, complete flight, flight phase, orflight subphase.
PERFORMANCE
The precision of control with respect toaircraft movement that a pilot is able toachieve in performing a task. (Pilotvehicle performance is a measure ofhandling performance. Pilot perform-ance is a measure of the manner orefficiency with which a pilot moves theprincipal controls in performing a task.)
The function or purpose that defines theprimary use of an aircraft.
The actual work assigned a pilot to beperformed in completion of or as repre-sentative of a designated flight segment.
The integrated physical and mental effortrequired to perform a specified piloting task.
ROLE
TASK
WORKLOAD
DEFINITIONS FROM TND-5153
Figure 10. Cooper-Harper flying qualities rating scale and definition of associated terminology.

40
Pilot intentionally modifies control inputs to avoid excitation of flexible modes..
Cockpit vibrations impact precision of voluntary control inputs.Cockpit vibrations cause occasional involuntary control inputs.Cockpit vibrations cause frequent involuntary control inputs.
Pilot does not alter control inputs as a result of aircraft flexibility.
3
4
5
2
1
DASE influence on pilot’s control inputs
Cockpit vibrations cause sustained involun- tary control inputs or loss of control. 6
CIR
Cockpit vibrations do not impact ride quality.
Cockpit vibrations are mildly objectionable:improvement desired.Cockpit vibrations are moderately objectionable: improvement warranted.
DASE influence onride quality
4
2
3
1
Cockpit vibrations are highly objectionable:improvement required. 5
Cockpit vibrations cause abandonment of task: improvement required.
RQR
Cockpit vibrations are perceptible but not objectionable: no improvement necessary.
6
Figure 11. Supplemental pilot rating scales developed to target pilot opinion of DASE effects.
Figure 12. Composite video image recorded during all piloted evaluations.
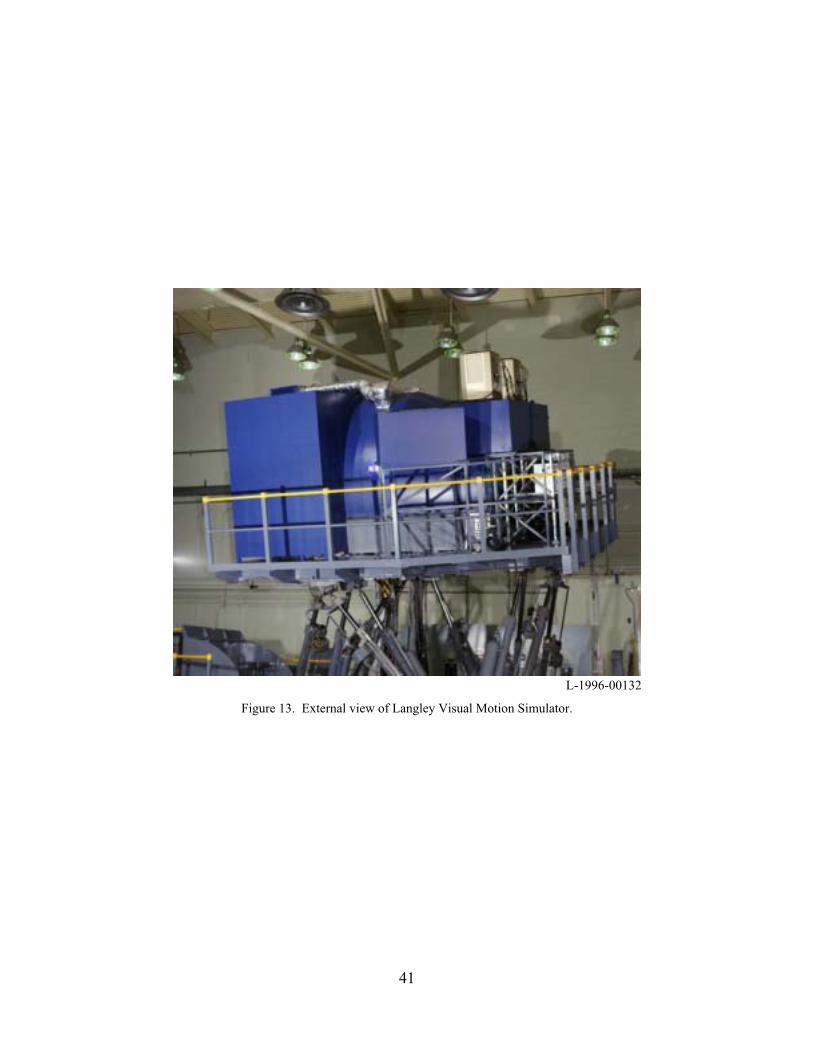
41
L-1996-00132
Figure 13. External view of Langley Visual Motion Simulator.
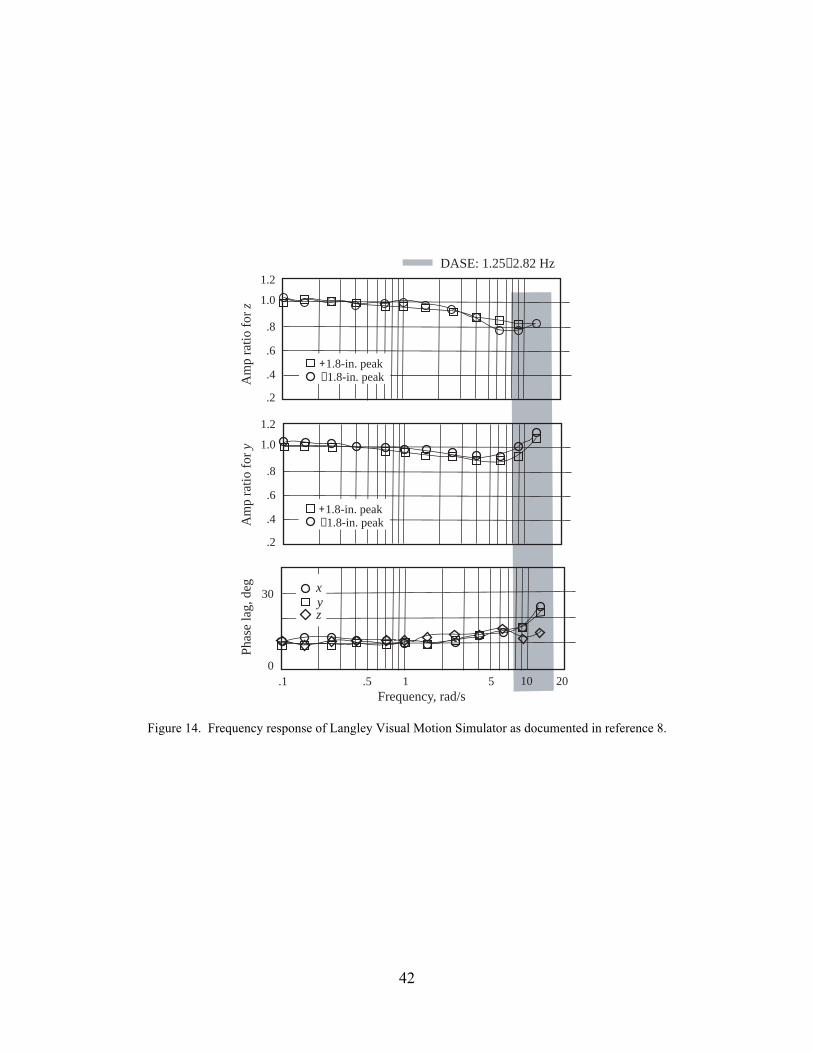
42
Frequency, rad/s
DASE: 1.25−2.82 HzPh
ase
lag,
deg
Am
p ra
tio fo
r yA
mp
ratio
for z
xyz
+1.8-in. peak−1.8-in. peak
+1.8-in. peak−1.8-in. peak
1.0
1.2
.8
.6
.4
.2
1.0
1.2
.8
.6
.4
.2
0
30
.1 .5 1 5 10 20
Figure 14. Frequency response of Langley Visual Motion Simulator as documented in reference 8.

43
1
Normal acceleration, commandedNormal acceleration, measured
50 10 15 20 25 30 35 40 45 50 55
.2
.4
.6
.81.01.21.41.61.82.0
Time, s
N ,
g un
itsz
Time delay: 150 ms
Amplitude ratio: .85 at 1.5 Hz
Mechanical "Slop"?
1.20
1.151.10
1.051.00
.95
.90
.85
.8015 16 17 18 19 20 50 51 52 53 54 55
2.01.81.61.41.21.0
.8
.6
.4
.20
N ,
g un
itsz
Time, sTime, s
∼∼
∼∼
Figure 15. Time history of commanded and actual vertical accelerations recorded during aeroelastic maneuver task.
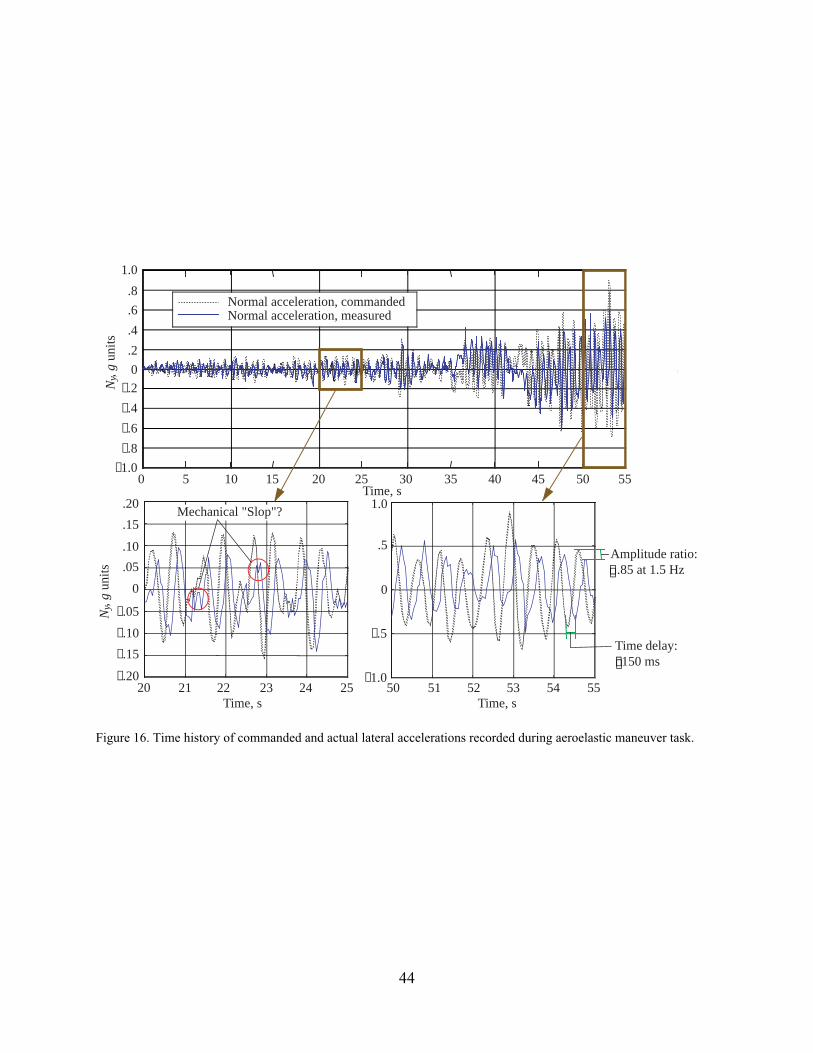
44
Normal acceleration, commandedNormal acceleration, measured
Time, s
N ,
g un
its
Time delay: 150 ms
Amplitude ratio: .85 at 1.5 Hz
Mechanical "Slop"?
50 10 15 20 25 30 35 40 45 50 55
y
50 51 52 53 54 5520 21 22 23 24 25
1.0
.5
0
−.5
−1.0
.20
.15
.10
.05
0
−.05
−.10−.15
−.20
1.0.8.6.4.20
−.2−.4−.6−.8
−1.0
N ,
g un
itsy
Time, s Time, s
∼∼
∼∼
Figure 16. Time history of commanded and actual lateral accelerations recorded during aeroelastic maneuver task.
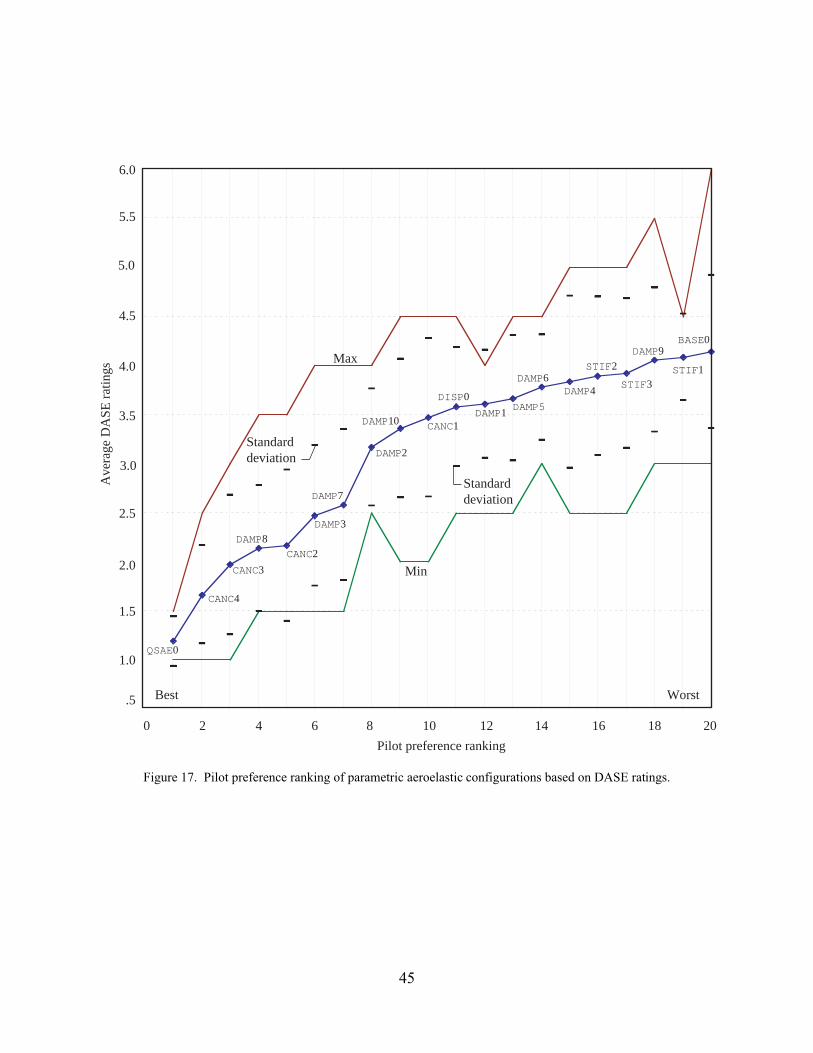
45
CANC2
BASE0
STIF1
DAMP9
STIF3
STIF2
DAMP4DAMP6
DAMP5DAMP1
DISP0
DAMP10
DAMP2
DAMP7
DAMP3DAMP8
CANC3
CANC4
QSAE0
CANC1
Ave
rage
DA
SE ra
tings
Pilot preference ranking0 2 4 6 8 10 12 14 16 18 20
.5
1.5
2.5
3.5
4.5
5.5
6.0
Best Worst
Max
Min
Standarddeviation
1.0
2.0
3.0
4.0
5.0
Standarddeviation
Figure 17. Pilot preference ranking of parametric aeroelastic configurations based on DASE ratings.
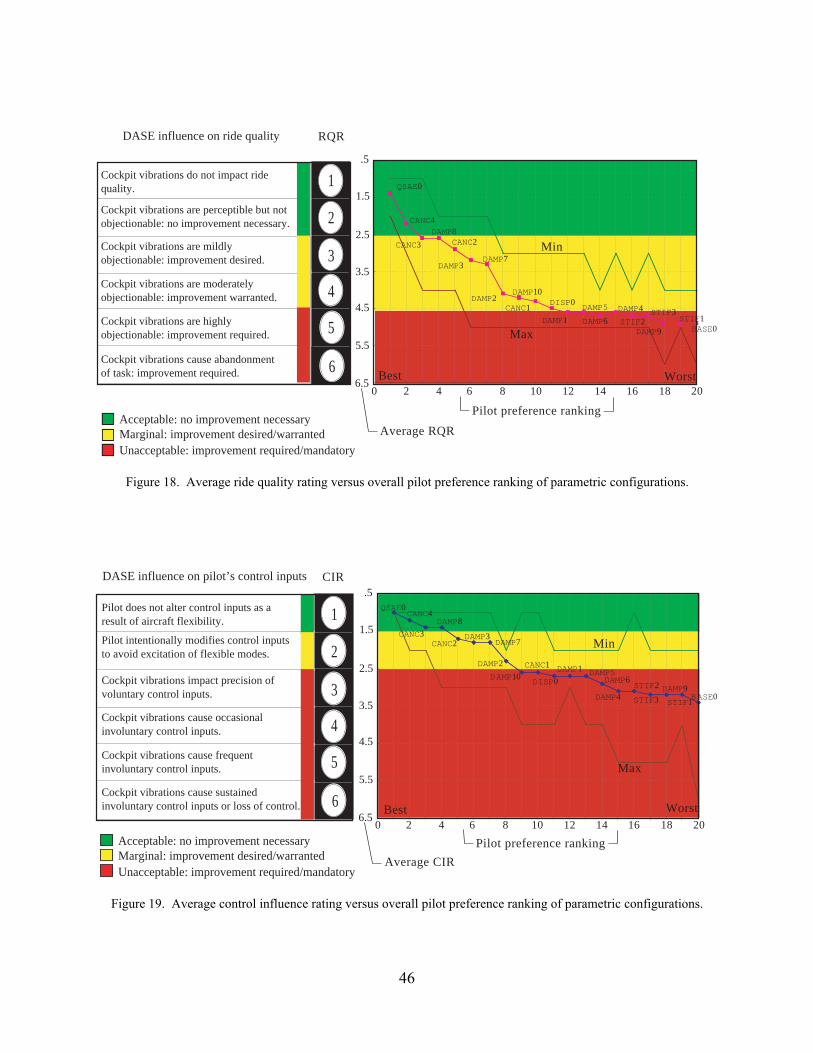
46
Cockpit vibrations do not impact ride quality.
Cockpit vibrations are mildly objectionable: improvement desired.
Cockpit vibrations are moderately objectionable: improvement warranted.
Cockpit vibrations are highly objectionable: improvement required.
Cockpit vibrations cause abandonment of task: improvement required.
Cockpit vibrations are perceptible but not objectionable: no improvement necessary.
.5
10 12 14 16 18 20
Acceptable: no improvement necessaryMarginal: improvement desired/warrantedUnacceptable: improvement required/mandatory
RQR
3
1
2
4
5
6
CANC2
BASE0STIF1
DAMP9
STIF3STIF2DAMP4
DAMP6DAMP5
DAMP1
DISP0DAMP10
DAMP2
DAMP7DAMP3
DAMP8CANC3
CANC4
QSAE0
CANC1
8640 2
Min
Max
Best Worst
DASE influence on ride quality
Pilot preference rankingAverage RQR
1.5
2.5
3.5
4.5
5.5
6.5
Figure 18. Average ride quality rating versus overall pilot preference ranking of parametric configurations.
Pilot intentionally modifies control inputs to avoid excitation of flexible modes.
Cockpit vibrations impact precision of voluntary control inputs.
Cockpit vibrations cause occasional involuntary control inputs.
Cockpit vibrations cause frequent involuntary control inputs.
Pilot does not alter control inputs as a result of aircraft flexibility.
Cockpit vibrations cause sustained involuntary control inputs or loss of control.
CANC2
BASE0STIF1DAMP9
STIF3
STIF2DAMP4
DAMP6DAMP5DAMP1
DISP0DAMP10DAMP2
DAMP7DAMP3
DAMP8CANC3
CANC4QSAE0
CANC1
Min
Max
Best Worst
3
1
2
4
5
6
Acceptable: no improvement necessaryMarginal: improvement desired/warrantedUnacceptable: improvement required/mandatory
Pilot preference ranking
DASE influence on pilot’s control inputs
Average CIR
CIR.5
1.5
2.5
3.5
4.5
5.5
6.510 12 14 16 18 208640 2
Figure 19. Average control influence rating versus overall pilot preference ranking of parametric configurations.
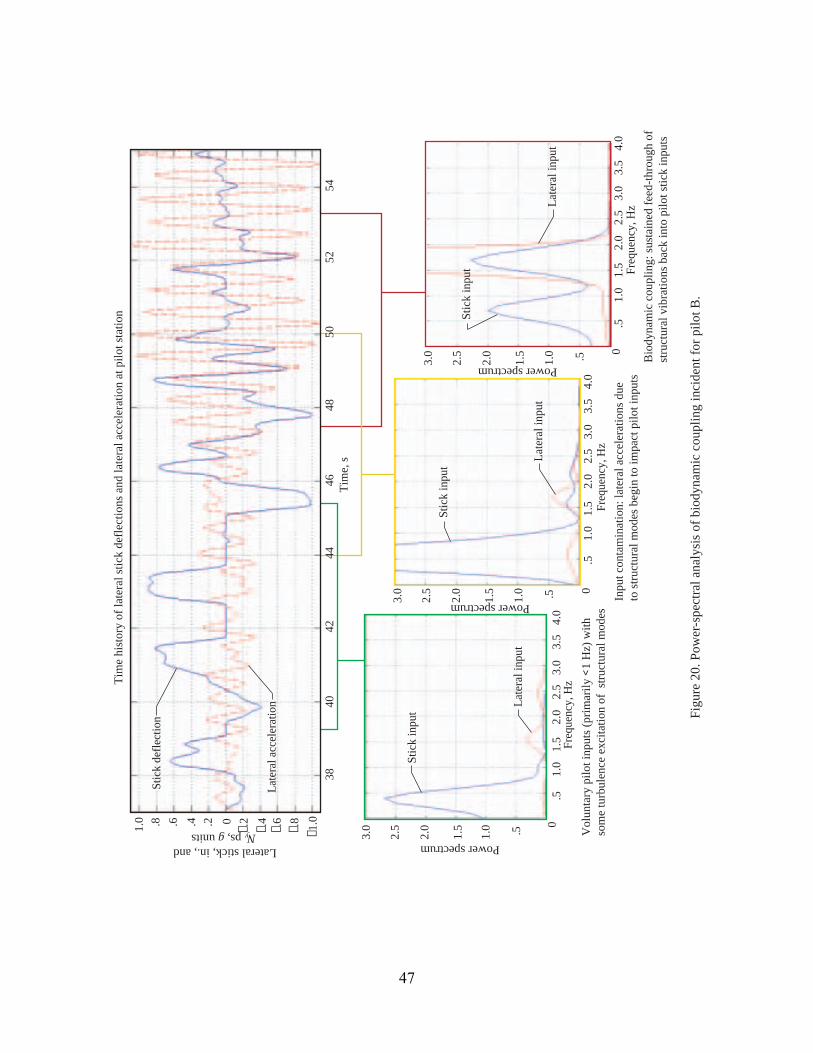
47
.81.0 .6 .4 .2 0 −.2
−.4
−.6
−.8
−1.0
3840
4244
4648
5052
54
Lateral stick, in., and N ps, g units
Tim
e, s
3.0
2.5
2.0
1.5
1.0 .5
0.5
1.0
1.5
2.0
2.5
3.0
3.5
4.0
3.0
2.5
2.0
1.5
1.0 .5 0
.51.
01.
52.
02.
53.
03.
54.
0
3.0
2.5
2.0
1.5
1.0 .5 0
.51.
01.
52.
02.
53.
03.
54.
0
Tim
e hi
stor
y of
late
ral s
tick
defle
ctio
ns a
nd la
tera
l acc
eler
atio
n at
pilo
t sta
tion
Stic
k de
flect
ion
Late
ral a
ccel
erat
ion
Power spectrum
Power spectrum
Power spectrum
Freq
uenc
y, H
z
Freq
uenc
y, H
z
Freq
uenc
y, H
z
Stic
k in
put
Late
ral i
nput
Inpu
t con
tam
inat
ion:
late
ral a
ccel
erat
ions
due
to
stru
ctur
al m
odes
beg
in to
impa
ct p
ilot i
nput
s
Vol
unta
ry p
ilot i
nput
s (pr
imar
ily <
1 H
z) w
ith
som
e tu
rbul
ence
exc
itatio
n of
stru
ctur
al m
odes
Bio
dyna
mic
cou
plin
g: su
stai
ned
feed
-thro
ugh
of
stru
ctur
al v
ibra
tions
bac
k in
to p
ilot s
tick
inpu
ts
Stic
k in
put
Stic
k in
put
Late
ral i
nput
Late
ral i
nput
y
Figu
re 2
0. P
ower
-spe
ctra
l ana
lysi
s of b
iody
nam
ic c
oupl
ing
inci
dent
for p
ilot B
.
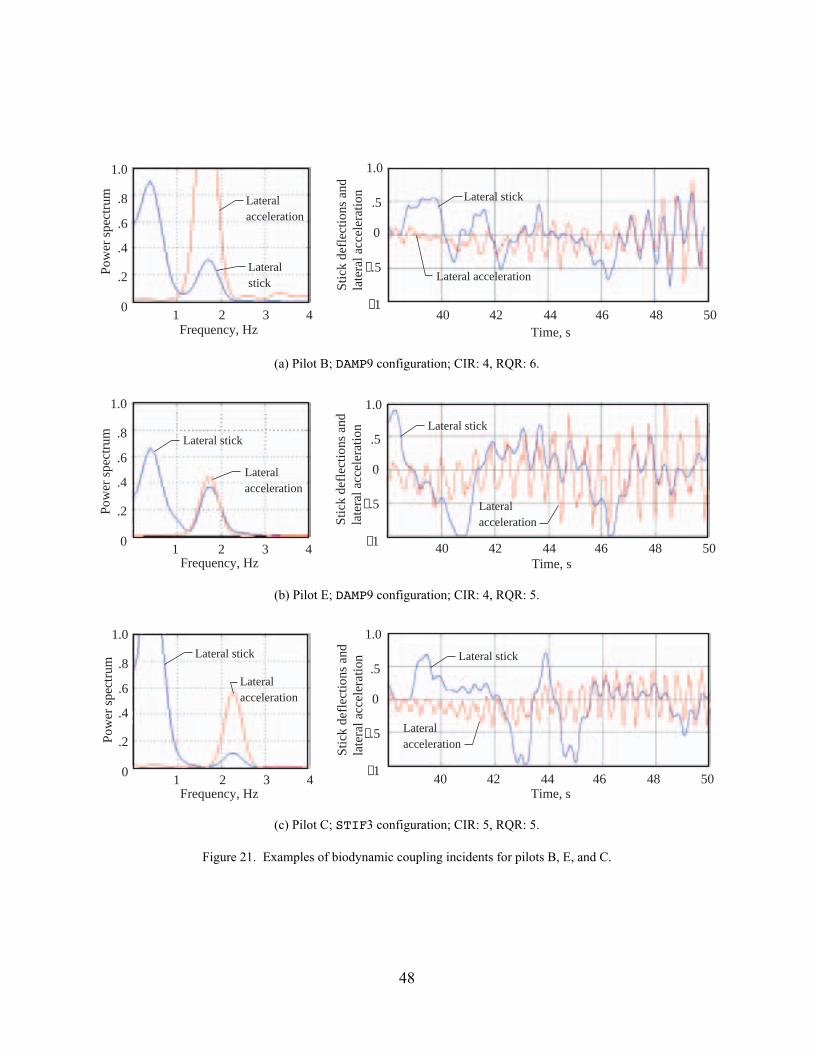
48
.8
1.0
.6
.4
.2
0 1 2 3 4
1.0
.5
0
−.5
−140 42 44 46 48 50
Time, sFrequency, Hz
Lateral stick
Lateral acceleration
Lateral acceleration
Lateral stick
Pow
er sp
ectru
m
Stic
k de
flect
ions
and
late
ral a
ccel
erat
ion
(a) Pilot B; DAMP9 configuration; CIR: 4, RQR: 6.
.8
1.0
.6
.4
.2
0 1 2 3 4
1.0
.5
0
−.5
−1 40 42 44 46 48 50Time, sFrequency, Hz
Lateral stick
Lateral acceleration
Lateral stick
Lateral acceleration
Pow
er sp
ectru
m
Stic
k de
flect
ions
and
late
ral a
ccel
erat
ion
(b) Pilot E; DAMP9 configuration; CIR: 4, RQR: 5.
.8
1.0
.6
.4
.2
0 1 2 3 4
1.0
.5
0
−.5
−1 40 42 44 46 48 50Time, sFrequency, Hz
Lateral stick
Lateral acceleration
Lateral stick
Lateral accelerationPo
wer
spec
trum
Stic
k de
flect
ions
and
late
ral a
ccel
erat
ion
(c) Pilot C; STIF3 configuration; CIR: 5, RQR: 5.
Figure 21. Examples of biodynamic coupling incidents for pilots B, E, and C.
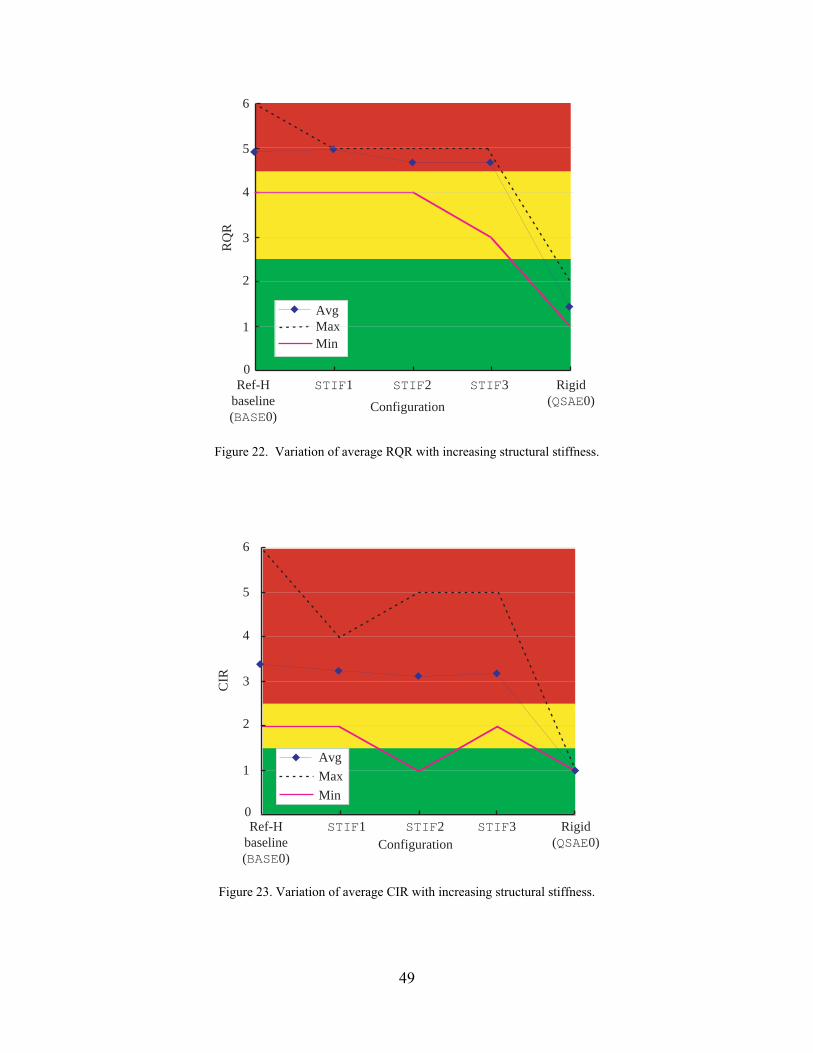
49
AvgMaxMin
6
5
4
3
2
1
Ref-Hbaseline(BASE0)
STIF1 STIF2 STIF3 Rigid(QSAE0)
RQ
R
Configuration
0
Figure 22. Variation of average RQR with increasing structural stiffness.
AvgMaxMin
Ref-Hbaseline(BASE0)
STIF1 STIF2 STIF3 Rigid(QSAE0)
6
5
4
3
2
1
CIR
Configuration
0
Figure 23. Variation of average CIR with increasing structural stiffness.
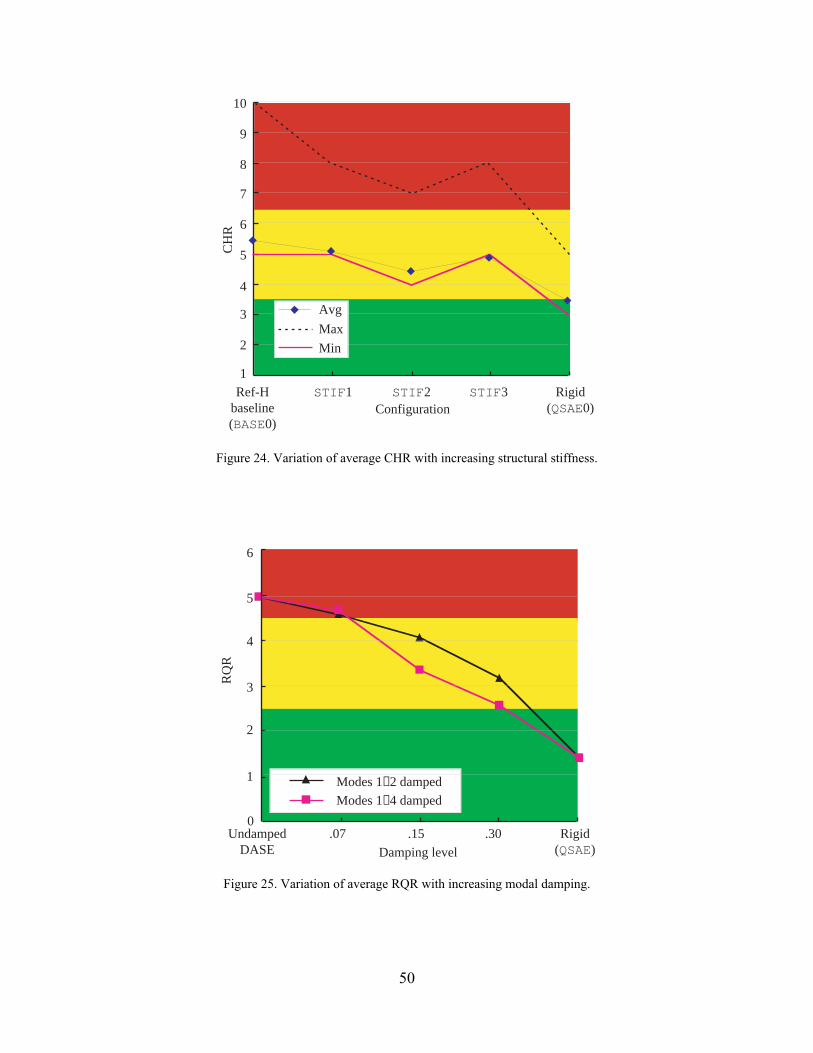
50
6
5
4
3
2
1Ref-H
baseline(BASE0)
STIF1 STIF2 STIF3 Rigid(QSAE0)Configuration
7
8
9
10
CH
R
AvgMaxMin
Figure 24. Variation of average CHR with increasing structural stiffness.
Modes 1−2 dampedModes 1−4 damped
6
5
4
3
2
1
UndampedDASE
.07 .15 .30 Rigid(QSAE)Damping level
RQ
R
0
Figure 25. Variation of average RQR with increasing modal damping.
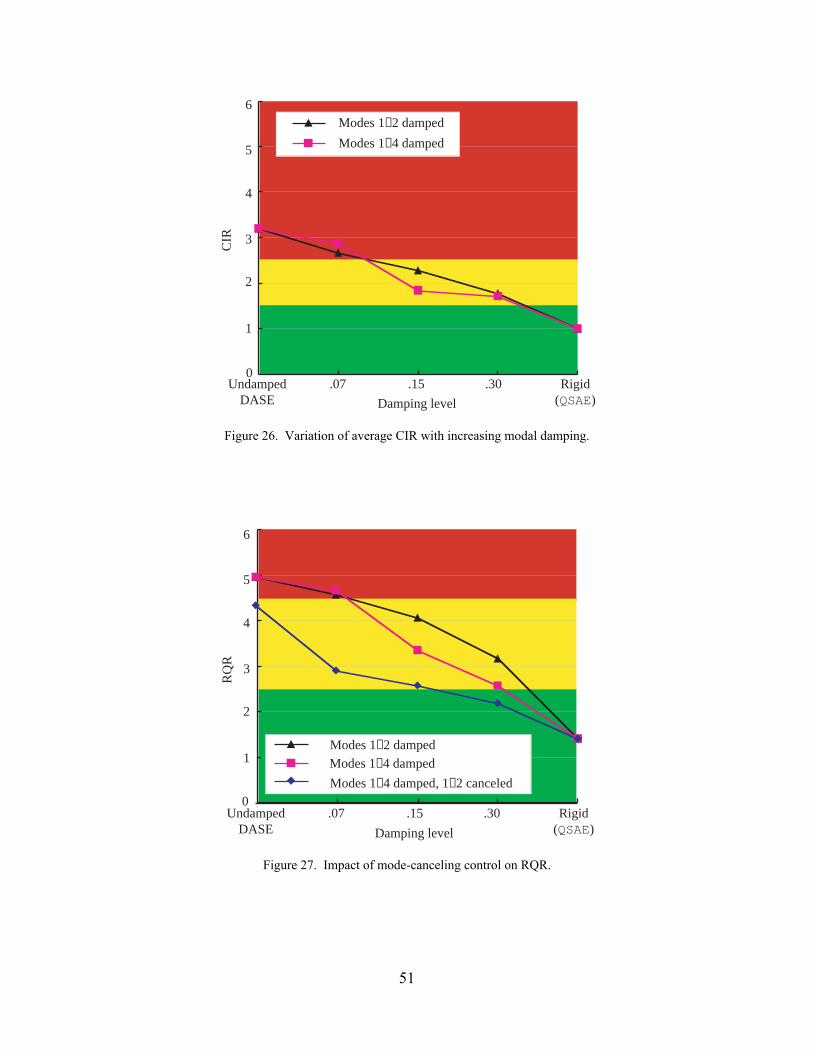
51
UndampedDASE
.07 .15 .30 Rigid(QSAE)
Modes 1−2 dampedModes 1−4 damped
6
5
4
3
2
1
CIR
Damping level
0
Figure 26. Variation of average CIR with increasing modal damping.
UndampedDASE
.07 .15 .30 Rigid(QSAE)
6
5
4
3
2
1Modes 1−2 dampedModes 1−4 dampedModes 1−4 damped, 1−2 canceled
Damping level
RQ
R
0
Figure 27. Impact of mode-canceling control on RQR.

52
UndampedDASE
.07 .15 .30 Rigid(QSAE)
Modes 1−2 dampedModes 1−4 dampedModes 1−4 damped, 1−2 canceled
6
5
4
3
2
1
CIR
Damping level
0
Figure 28. Impact of mode-canceling control on average CIR.
6
5
4
3
2
1
7
8
9
10
UndampedDASE
.07 .15 .30 Rigid(QSAE)
Modes 1−2 dampedModes 1−4 dampedModes 1−4 damped, 1−2 canceled
CH
R
Damping level
Figure 29. Variation of average CHR with increasing damping and modal cancellation.

53
5
4
3
2
1
−1
−2
−3
−4
−5
0
40 42 44 46 48 50 52 54 56
Time, s
Mea
sure
d la
tera
l coc
kpit
acce
lera
tions
, g u
nits
−6
6
Figure 30. Measured lateral accelerations from last 15 s of one example run performed with STIF2 configuration.
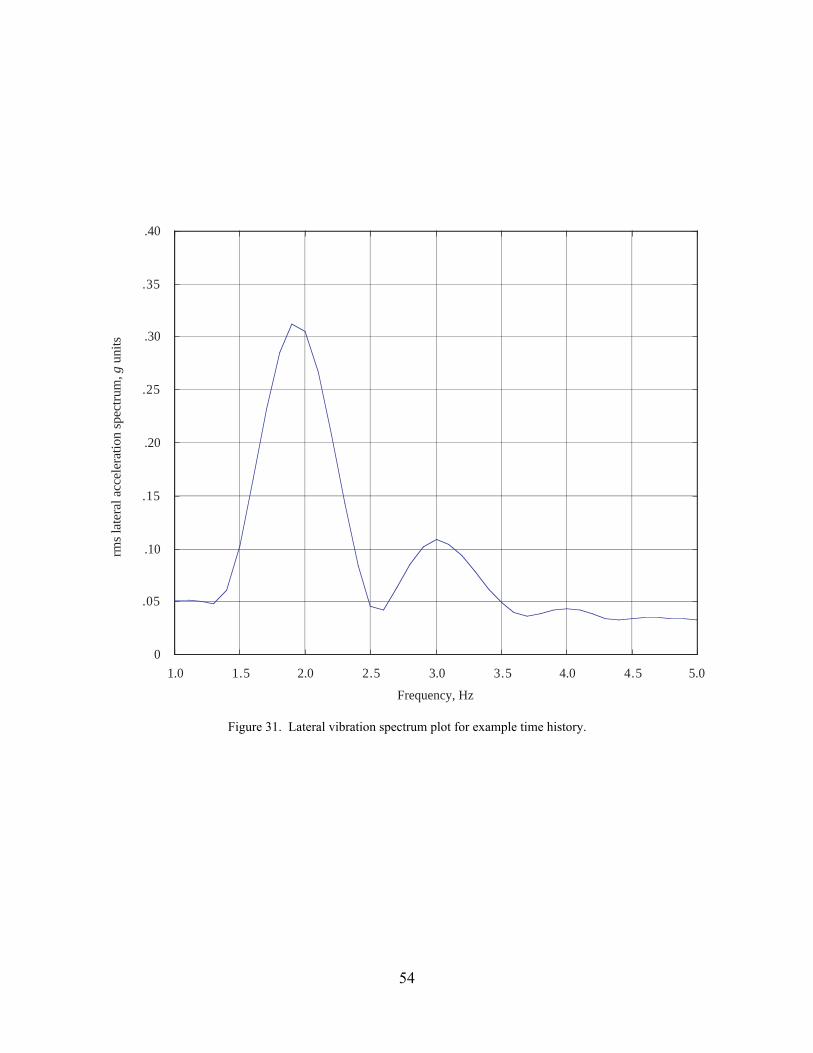
54
1.0 1.5 2.0 2.5 3.0 3.5 4.0 4.5 5.00
.05
.10
.15
.20
.25
.30
.35
.40
Frequency, Hz
rms l
ater
al a
ccel
erat
ion
spec
trum
, g u
nits
Figure 31. Lateral vibration spectrum plot for example time history.
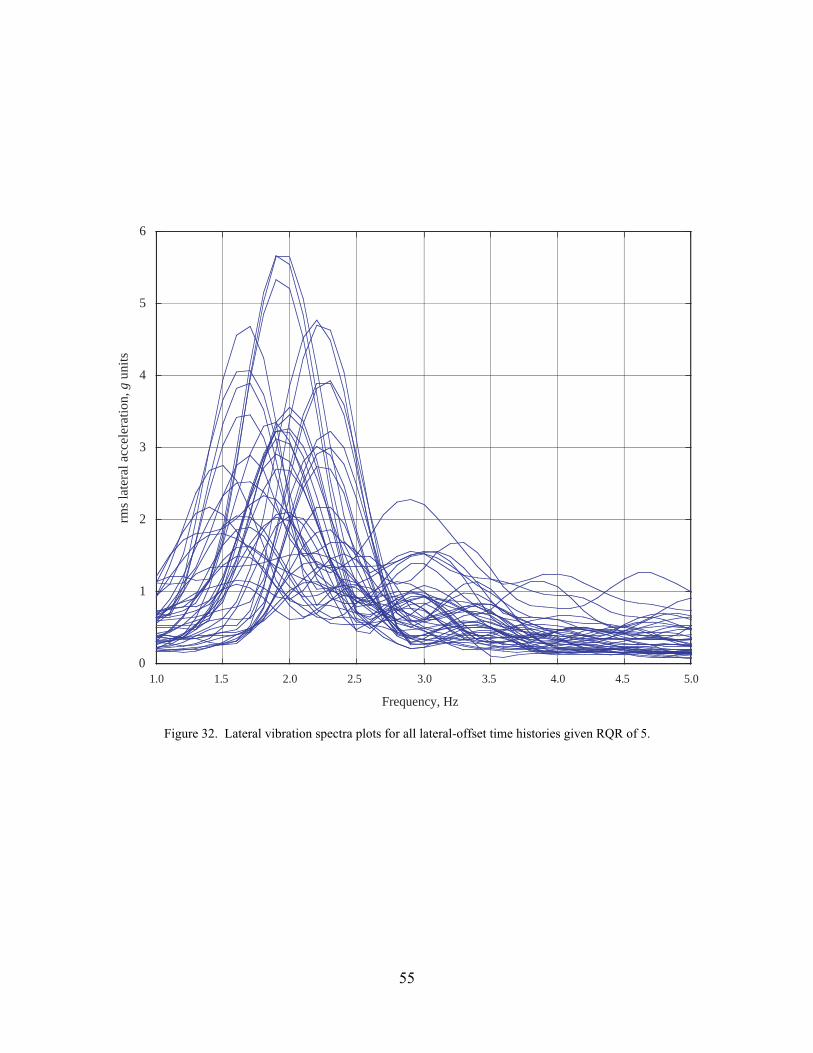
55
1.0 1.5 2.0 2.5 3.0 3.5 4.0 4.5 5.00
1
2
3
4
5
6
Frequency, Hz
rms l
ater
al a
ccel
erat
ion,
g u
nits
Figure 32. Lateral vibration spectra plots for all lateral-offset time histories given RQR of 5.
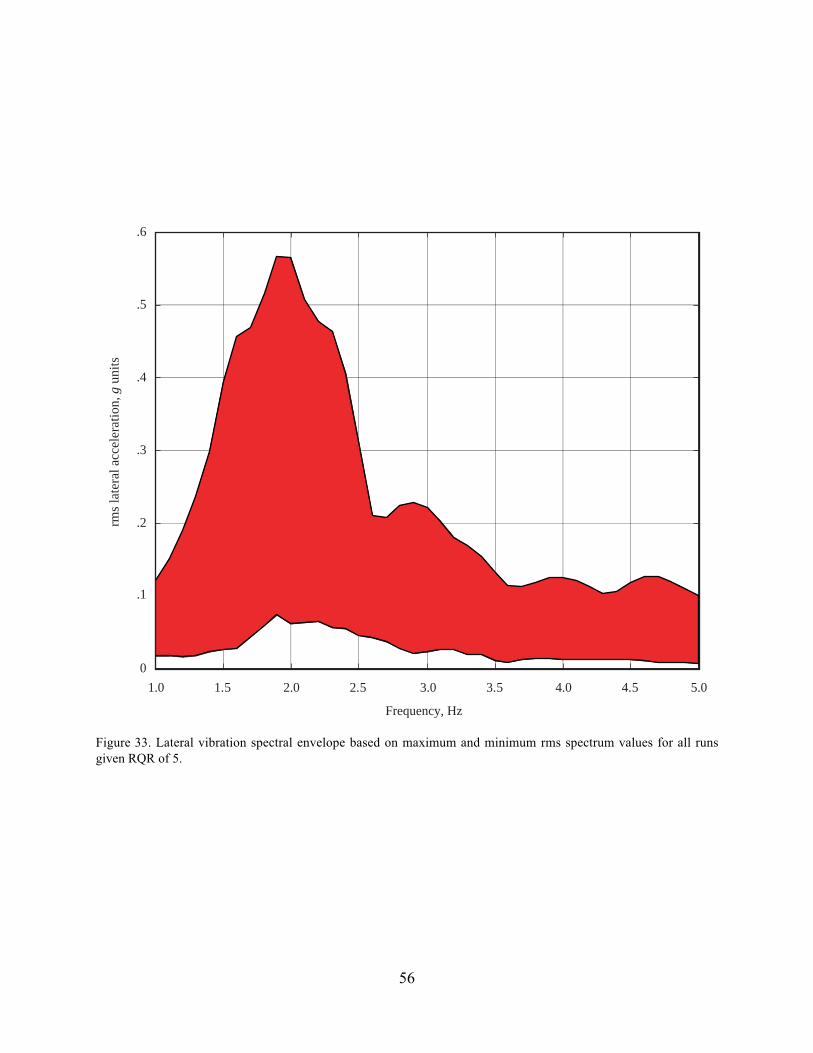
56
1.0 1.5 2.0 2.5 3.0 3.5 4.0 4.5 5.00
.2
.3
.4
.5
.6
Frequency, Hz
rms l
ater
al a
ccel
erat
ion,
g u
nits
.1
Figure 33. Lateral vibration spectral envelope based on maximum and minimum rms spectrum values for all runsgiven RQR of 5.
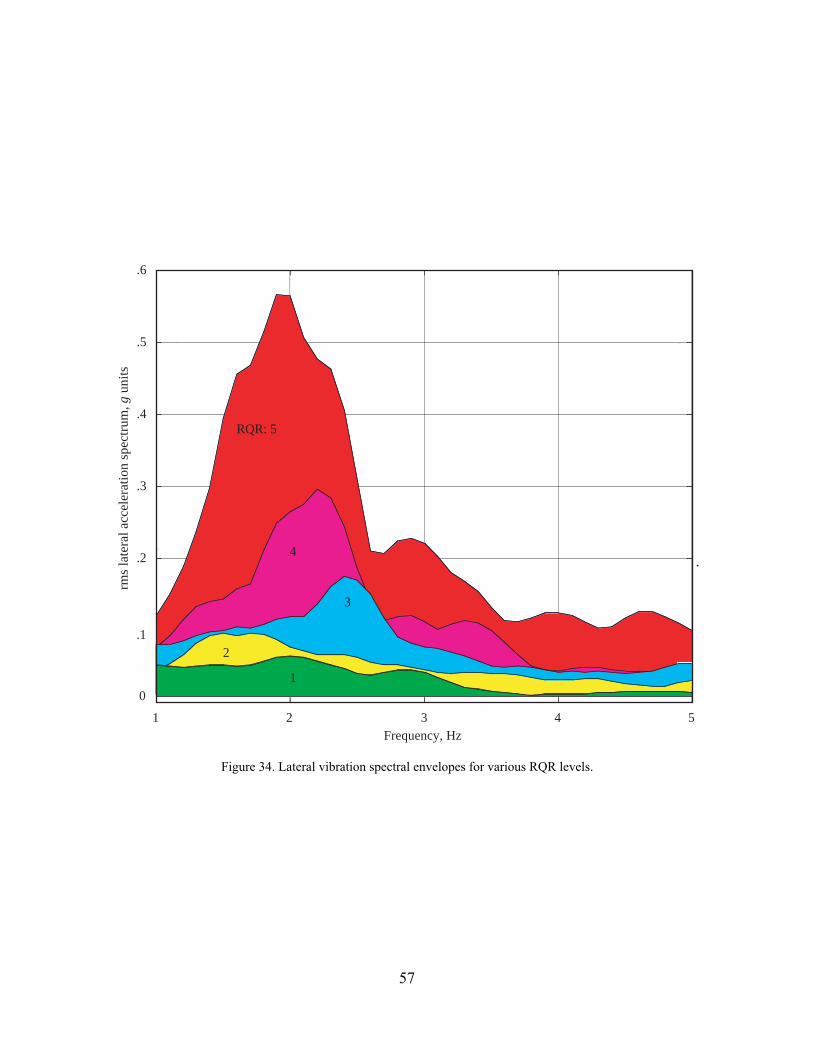
57
1 2 3 4 5
.2
.3
.4
.5
.6
RQR: 5
4
3
2
1
Frequency, Hz
rms l
ater
al a
ccel
erat
ion
spec
trum
, g u
nits
.1
0
Figure 34. Lateral vibration spectral envelopes for various RQR levels.
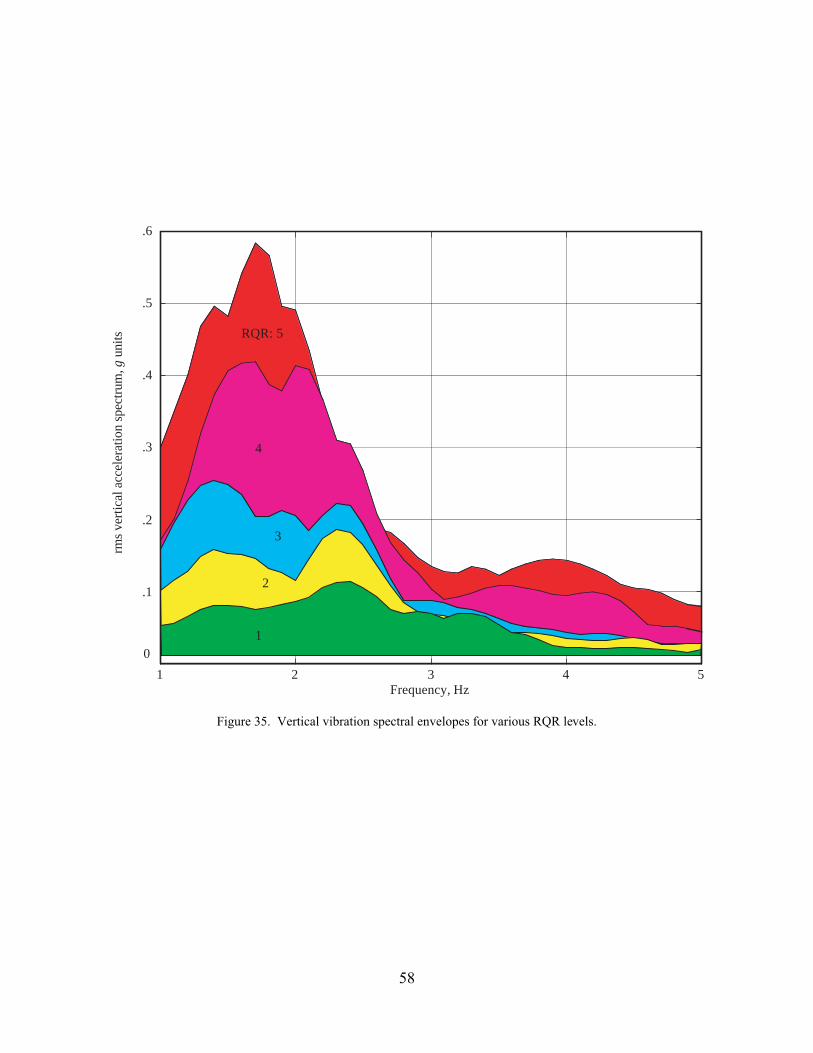
58
1 2 3 4 5
.2
.3
.4
.5
.6
RQR: 5
4
3
2
1
Frequency, Hz
rms v
ertic
al a
ccel
erat
ion
spec
trum
, g u
nits
.1
3
2
10
Figure 35. Vertical vibration spectral envelopes for various RQR levels.

59
1 2 3 4 5
.3
.4
.5
.6
RQR: 5
4
3
2
1
Frequency, Hz
rms v
ertic
al a
ccel
erat
ion
spec
trum
, g u
nits
10 min
20 min
40 min
1 hr
2 hr4 hr1-hr RCB8 hr
.1
.2
Maximum acceptableduration of exposure
0
Figure 36. Vertical vibration spectral envelopes based on ride quality rating plotted with ISO vertical vibrationstandard.
60
Appendix A
Test Pilot Biographies
Pilot A
Pilot A was trained as a Naval Aviator and flew F-8s in both active and reserve duty. Pilot A flewwith a major airline for 4 years in Boeing 727 aircraft before joining NASA as an Instructor Pilot in theShuttle Training Aircraft; then he became a Research Pilot at a NASA Research Center. As a NASApilot, he has flown a number of research aircraft in addition to research simulations of other vehicles.Pilot A holds a Bachelor of Science degree from the University of North Carolina at Chapel Hill and aMasters in Aerospace Engineering degree from the University of Virginia. Pilot A has accumulated over10 000 flying hours in over 45 different aircraft including F-8, F-18, F-16, F-15, F-5, A-4, Boeing 727,Boeing 737, Gulfstream II/STA, T-38, OV-10, LR-28 aircraft, and a number of general aviation types.
Pilot B
Pilot B has a Bachelor of Science degree from the University of Washington where he attended aflight test course. Pilot B served as Engineering Test Pilot for two general aviation manufacturers andaccumulated time as a test pilot on 30 different general aviation fixed wing aircraft, before joining anHSR program industry partner as a research project pilot. He is a graduate of a company-run flight testschool. Pilot B holds an Airline Transport Pilot Certificate with type ratings in seven transport aircraft,and has over 16 000 hours flight time, of which nearly 10 000 hours have been in flight tests. Pilot B is acertificated flight instructor in both general aviation and transport aircraft with 3000 hours of instructiongiven.
Pilot C
Pilot C was trained as a Naval Aviator and graduated from the U.S. Naval Test Pilot School, PatuxentRiver, Maryland. Pilot C has a Ph.D. in Hypersonic Flight Dynamics from the University of SouthernCalifornia. He is employed by an HSR program industry partner as the chief pilot for the High SpeedCivil Transport and as a project experimental test pilot in a number of aircraft programs. He holds anAirline Transport Pilot Certificate, and has first pilot time in over 50 aircraft, including the F-14A andseveral transport aircraft.
Pilot D
Information not available.
Pilot E
Information not available.
Pilot F
Pilot F served with the U.S. Marine Corps from 1953 to 1962 as a single-engine fighter-bomber pilot.He has been a research pilot with NASA since 1962 and has accumulated more than 10 000 total hours ina wide variety of aircraft, including helicopter, VTOL, STOL, and light and heavy fixed wing aircraft. Hehas an Airline Transport Pilot Certificate with type ratings in the Convair 990 and the Douglas DC-8.
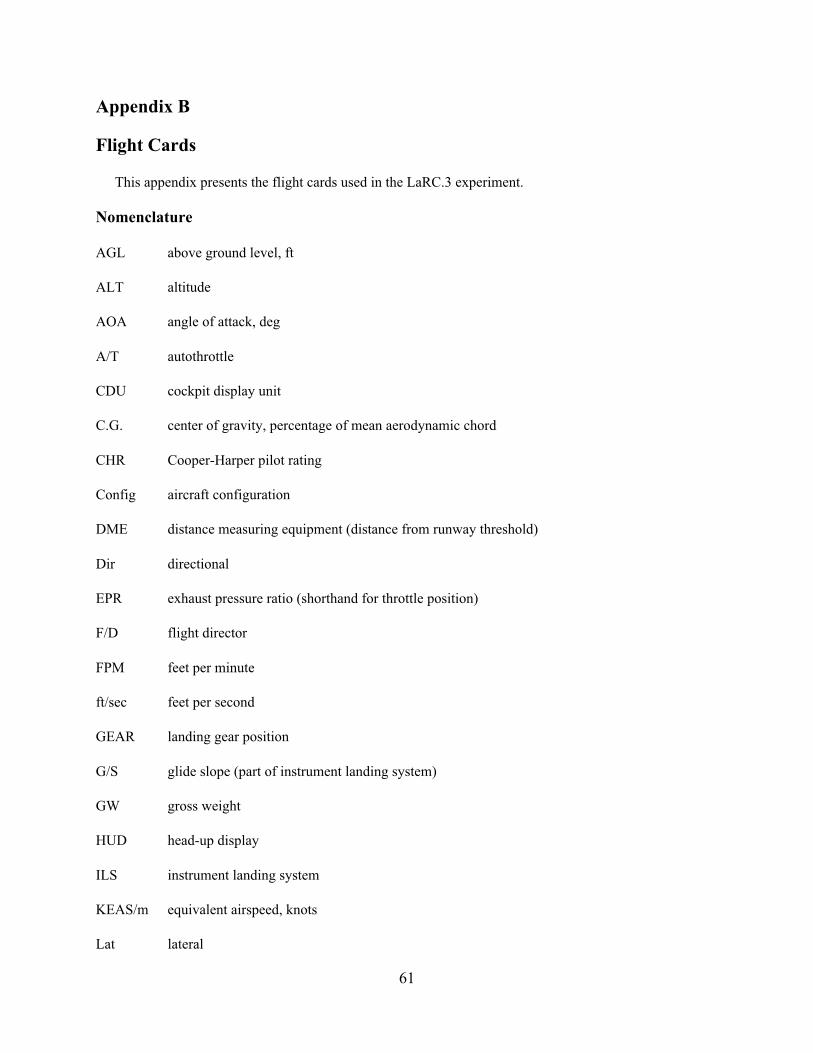
61
Appendix B
Flight Cards
This appendix presents the flight cards used in the LaRC.3 experiment.
Nomenclature
AGL above ground level, ft
ALT altitude
AOA angle of attack, deg
A/T autothrottle
CDU cockpit display unit
C.G. center of gravity, percentage of mean aerodynamic chord
CHR Cooper-Harper pilot rating
Config aircraft configuration
DME distance measuring equipment (distance from runway threshold)
Dir directional
EPR exhaust pressure ratio (shorthand for throttle position)
F/D flight director
FPM feet per minute
ft/sec feet per second
GEAR landing gear position
G/S glide slope (part of instrument landing system)
GW gross weight
HUD head-up display
ILS instrument landing system
KEAS/m equivalent airspeed, knots
Lat lateral

62
LEF leading-edge flaps, deg
LOC localizer (part of instrument landing system)
M Mach number
MFC final cruise mass condition
MIC initial cruise mass condition
MTE mission task element
Mmo maximum operating Mach number
M13 mass case 13: maximum taxi weight at forward C.G.
N/A not applicable
OM outer marker
PF pilot flying
PFD primary flight display
PIO pilot-induced oscillation
PNF pilot not flying
PSCAS pitch stability and control augmentation system
R constant value during run either +1 or −1
R/C rate of climb
RQR ride quality rating
RSCAS roll stability and control augmentation system
Rwy runway
TEF trailing-edge flaps, deg
TIFS total in-flight simulator
Trim indicates this parameter should be set to value required to achieve trimmed (unaccelerated)initial conditions
VFR visual flight rules

63
Vapp approach speed
Vapp1 approach speed, first approach segment
Vapp2 approach speed, second approach segment
Vg/a go-around speed
Vmin minimum operating speed
Vref reference speed
X cross
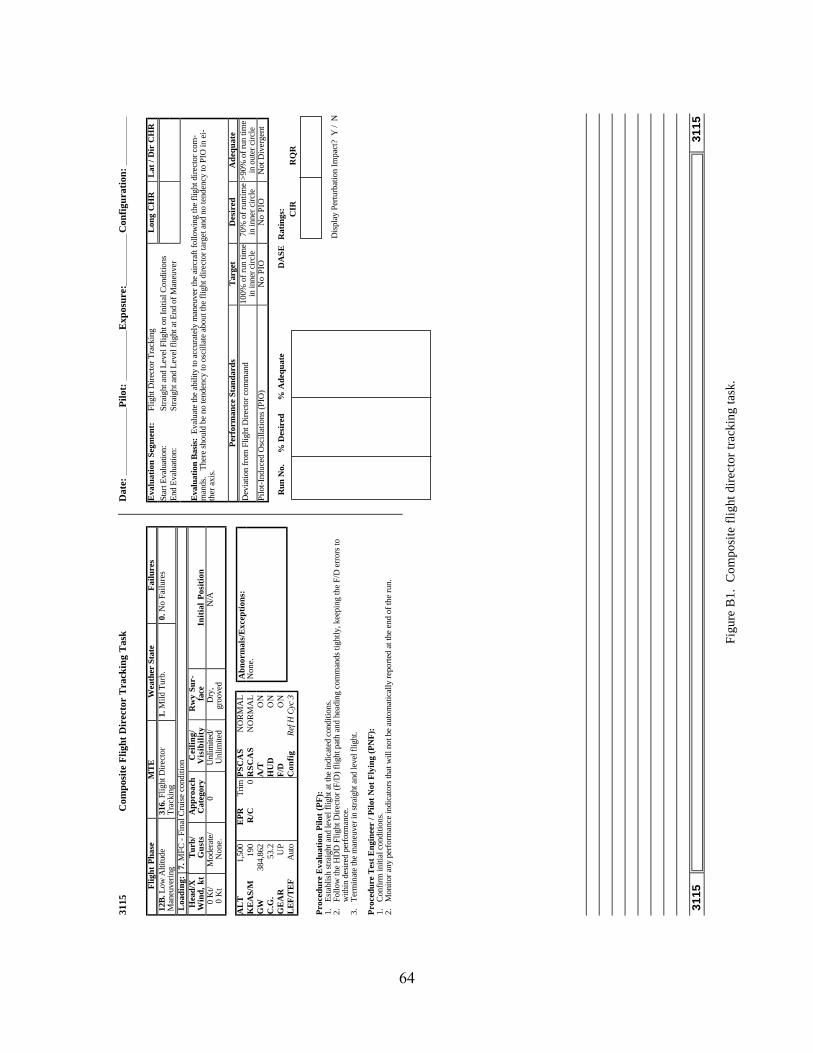
64
3115
3115
3115
C
ompo
site
Flig
ht D
irec
tor
Tra
ckin
g T
ask Figu
re B
1. C
ompo
site
flig
ht d
irect
or tr
acki
ng ta
sk.
Flig
ht P
hase
MT
EW
eath
er S
tate
Fai
lure
s12
B. L
ow A
ltitu
deM
aneu
veri
ng31
6. F
light
Dir
ecto
rT
rack
ing
1. M
ild T
urb.
0. N
o Fa
ilure
s
Loa
ding
:7.
MFC
- F
inal
Cru
ise
cond
ition
Hea
d/X
Win
d, k
tT
urb/
Gus
tsA
ppro
ach
Cat
egor
yC
eili
ng/
Vis
ibil
ity
Rw
y Su
r-fa
ceIn
itia
l P
osit
ion
0 K
t/0
Kt
Mod
erat
e/N
one.
0U
nlim
ited/
Unl
imite
dD
ry,
groo
ved
N/A
AL
T1,
500
EP
RT
rimP
SC
AS
NO
RM
AL
KE
AS/
M19
0R
/C0
RS
CA
SN
OR
MA
LG
W38
4,86
2A
/TO
NC
.G.
53.2
HU
DO
NG
EA
RU
PF
/DO
NL
EF
/TE
FA
uto
Con
fig
Ref
H C
yc 3
Pro
cedu
reE
valu
atio
n P
ilot
(PF
):1.
Est
ablis
h st
raig
ht a
nd le
vel f
light
at t
he in
dica
ted
cond
ition
s.2.
Follo
w th
e H
DD
Flig
ht D
irec
tor
(F/D
) fl
ight
pat
h an
d he
adin
g co
mm
ands
tigh
tly, k
eepi
ng th
e F/
D e
rror
s to
with
in d
esir
ed p
erfo
rman
ce.
3.T
erm
inat
e th
e m
aneu
ver i
n st
raig
ht a
nd le
vel f
light
.
Pro
cedu
reT
est
Eng
inee
r / P
ilot
Not
Fly
ing
(PN
F):
1.C
onfi
rm in
itial
con
ditio
ns.
2.M
onito
r an
y pe
rfor
man
ce in
dica
tors
that
will
not
be
auto
mat
ical
ly r
epor
ted
at th
e en
d of
the
run.
Dat
e:
P
ilot:
Exp
osur
e:
C
onfi
gura
tion
:
Eva
luat
ion
Segm
ent:
Flig
ht D
irec
tor
Tra
ckin
gL
ong
CH
RL
at /
Dir
CH
RSt
art E
valu
atio
n:St
raig
ht a
nd L
evel
Flig
ht o
n In
itial
Con
ditio
nsE
nd E
valu
atio
n:St
raig
ht a
nd L
evel
flig
ht a
t End
of M
aneu
ver
Eva
luat
ion
Bas
is:
Eva
luat
e th
e ab
ility
to a
ccur
atel
y m
aneu
ver
the
airc
raft
fol
low
ing
the
flig
ht d
irec
tor
com
-m
ands
. T
here
sho
uld
be n
o te
nden
cy to
osc
illat
e ab
out t
he f
light
dir
ecto
r ta
rget
and
no
tend
ency
to P
IO in
ei-
ther
axi
s.
Per
form
ance
Sta
ndar
dsT
arge
tD
esir
edA
dequ
ate
Dev
iatio
n fr
om F
light
Dir
ecto
r com
man
d10
0% o
f ru
n tim
ein
inne
r cir
cle
70%
of
runt
ime
in in
ner c
ircl
e>9
0% o
f ru
n tim
ein
out
er c
ircl
ePi
lot-
Indu
ced
Osc
illat
ions
(PI
O)
No
PIO
No
PIO
Not
Div
erge
nt
R
un N
o.
% D
esir
ed
%
Ade
quat
e D
ASE
R
atin
gs:
CIR
RQ
R
Abn
orm
als/
Exc
epti
ons:
Non
e.
Dis
play
Per
turb
atio
n Im
pact
? Y
/ N
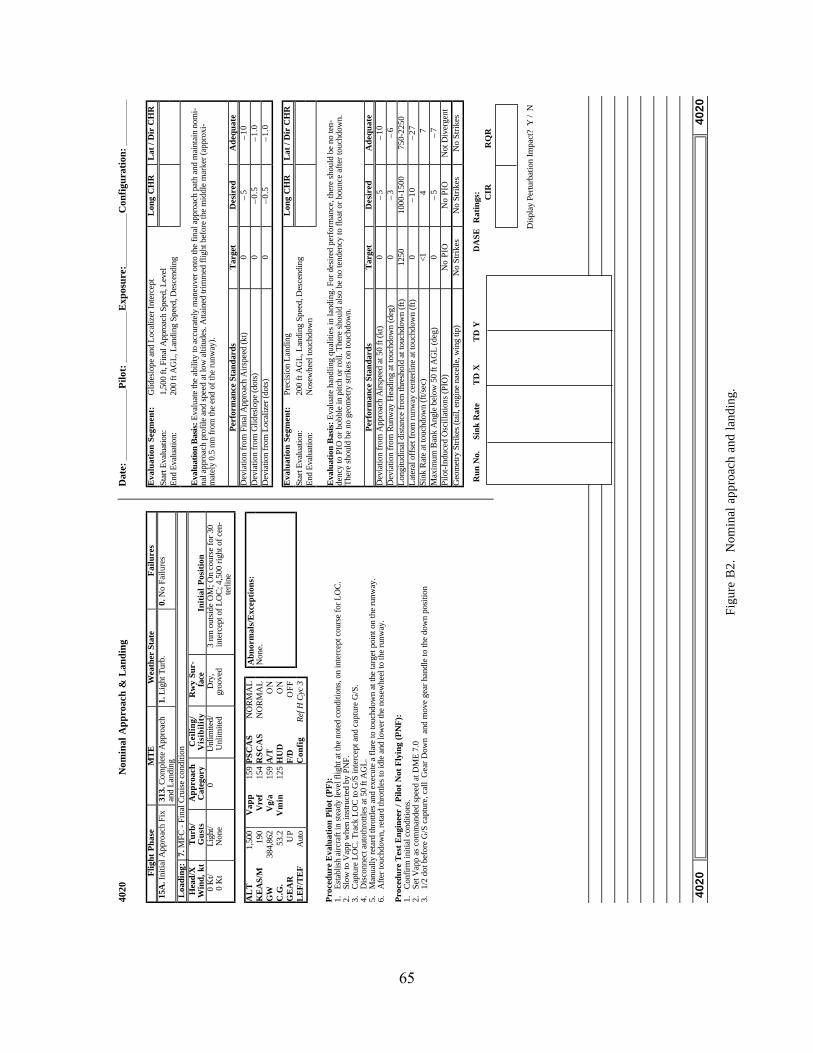
65
4020
4020
4020
N
omin
al A
ppro
ach
& L
andi
ng
Figu
re B
2. N
omin
al a
ppro
ach
and
land
ing.
Flig
ht P
hase
MT
EW
eath
er S
tate
Fai
lure
s15
A. I
nitia
l App
roac
h Fi
x31
3. C
ompl
ete
App
roac
han
d L
andi
ng1.
Lig
ht T
urb.
0. N
o Fa
ilure
s
Loa
ding
:7.
MFC
- F
inal
Cru
ise
cond
ition
Hea
d/X
Win
d, k
tT
urb/
Gus
tsA
ppro
ach
Cat
egor
yC
eili
ng/
Vis
ibil
ity
Rw
y Su
r-fa
ceIn
itia
l P
osit
ion
0 K
t/0
Kt
Lig
ht/
Non
e0
Unl
imite
d/U
nlim
ited
Dry
,gr
oove
d3
nm o
utsi
de O
M; O
n co
urse
for
30
inte
rcep
t of
LO
C; 4
,500
rig
ht o
f ce
n-te
rlin
e
AL
T1,
500
Vap
p15
9P
SC
AS
NO
RM
AL
KE
AS/
M19
0V
ref
154
RS
CA
SN
OR
MA
LG
W38
4,86
2V
g/a
159
A/T
ON
C.G
.53
.2V
min
125
HU
DO
NG
EA
RU
PF
/DO
FF
LE
F/T
EF
Aut
oC
onfi
gR
ef H
Cyc
3
Pro
cedu
reE
valu
atio
n P
ilot
(PF
):1.
Est
ablis
h ai
rcra
ft in
ste
ady
leve
l flig
ht a
t the
not
ed c
ondi
tions
, on
inte
rcep
t cou
rse
for
LO
C.
2.Sl
ow to
Vap
p w
hen
inst
ruct
ed b
y PN
F.3.
Cap
ture
LO
C. T
rack
LO
C to
G/S
inte
rcep
t and
cap
ture
G/S
.4.
Dis
conn
ect a
utot
hrot
tles
at 5
0 ft
AG
L.
5.M
anua
lly r
etar
d th
rottl
es a
nd e
xecu
te a
fla
re to
touc
hdow
n at
the
targ
et p
oint
on
the
runw
ay.
6.A
fter
touc
hdow
n, re
tard
thro
ttles
to id
le a
nd lo
wer
the
nose
whe
el to
the
runw
ay.
Pro
cedu
reT
est
Eng
inee
r / P
ilot
Not
Fly
ing
(PN
F):
1.C
onfi
rm in
itial
con
ditio
ns.
2.Se
t Vap
p as
com
man
ded
spee
d at
DM
E 7
.03.
1/2
dot b
efor
e G
/S c
aptu
re, c
all
Gea
r D
own
and
mov
e ge
ar h
andl
e to
the
dow
n po
sitio
n
Dat
e:
P
ilot:
Exp
osur
e:
C
onfi
gura
tion
:
Eva
luat
ion
Segm
ent:
Glid
eslo
pe a
nd L
ocal
izer
Inte
rcep
tL
ong
CH
RL
at /
Dir
CH
RSt
art E
valu
atio
n:1,
500
ft, F
inal
App
roac
h Sp
eed,
Lev
elE
nd E
valu
atio
n:20
0 ft
AG
L, L
andi
ng S
peed
, Des
cend
ing
Eva
luat
ion
Bas
is: E
valu
ate
the
abili
ty to
acc
urat
ely
man
euve
r on
to th
e fi
nal a
ppro
ach
path
and
mai
ntai
n no
mi-
nal a
ppro
ach
prof
ile a
nd s
peed
at l
ow a
ltitu
des.
Atta
ined
trim
med
flig
ht b
efor
e th
e m
iddl
e m
arke
r (a
ppro
xi-
mat
ely
0.5
nm f
rom
the
end
of th
e ru
nway
).
Per
form
ance
Sta
ndar
dsT
arge
tD
esir
edA
dequ
ate
Dev
iatio
n fr
om F
inal
App
roac
h A
irsp
eed
(kt)
0–
5–
10
Dev
iatio
n fr
om G
lides
lope
(do
ts)
0–
0.5
–1.
0D
evia
tion
from
Loc
aliz
er (d
ots)
0–
0.5
–1.
0
Eva
luat
ion
Segm
ent:
Prec
isio
n L
andi
ngL
ong
CH
RL
at /
Dir
CH
RSt
art E
valu
atio
n:20
0 ft
AG
L, L
andi
ng S
peed
, Des
cend
ing
End
Eva
luat
ion:
Nos
ewhe
el to
uchd
own
Eva
luat
ion
Bas
is: E
valu
ate
hand
ling
qual
ities
in la
ndin
g. F
or d
esir
ed p
erfo
rman
ce, t
here
sho
uld
be n
o te
n-de
ncy
to P
IO o
r bo
bble
in p
itch
or r
oll.
The
re s
houl
d al
so b
e no
tend
ency
to f
loat
or
boun
ce a
fter
touc
hdow
n.T
here
sho
uld
be n
o ge
omet
ry s
trik
es o
n to
uchd
own.
Per
form
ance
Sta
ndar
dsT
arge
tD
esir
edA
dequ
ate
Dev
iatio
n fr
om A
ppro
ach
Air
spee
d at
50
ft (
kt)
0–
5–
10
Dev
iatio
n fr
om R
unw
ay H
eadi
ng a
t tou
chdo
wn
(deg
)0
–3
–6
Lon
gitu
dina
l dis
tanc
e fr
om th
resh
old
at to
uchd
own
(ft)
1250
1000
-150
075
0-22
50L
ater
al o
ffse
t fro
m ru
nway
cen
terl
ine
at to
uchd
own
(ft)
0–
10
–2
7Si
nk R
ate
at to
uchd
own
(ft/s
ec)
<14
7M
axim
um B
ank
Ang
le b
elow
50
ft A
GL
(de
g)0
–5
–7
Pilo
t-In
duce
d O
scill
atio
ns (
PIO
)N
o P
ION
o P
ION
ot D
iver
gent
Geo
met
ry S
trik
es (t
ail,
engi
ne n
acel
le, w
ing
tip)
No
Stri
kes
No
Stri
kes
No
Stri
kes
Run
No.
S
ink
Rat
e
T
D X
T
D Y
DA
SE
Rat
ings
:C
IRR
QR
Abn
orm
als/
Exc
epti
ons:
Non
e.
Dis
play
Per
turb
atio
n Im
pact
? Y
/ N
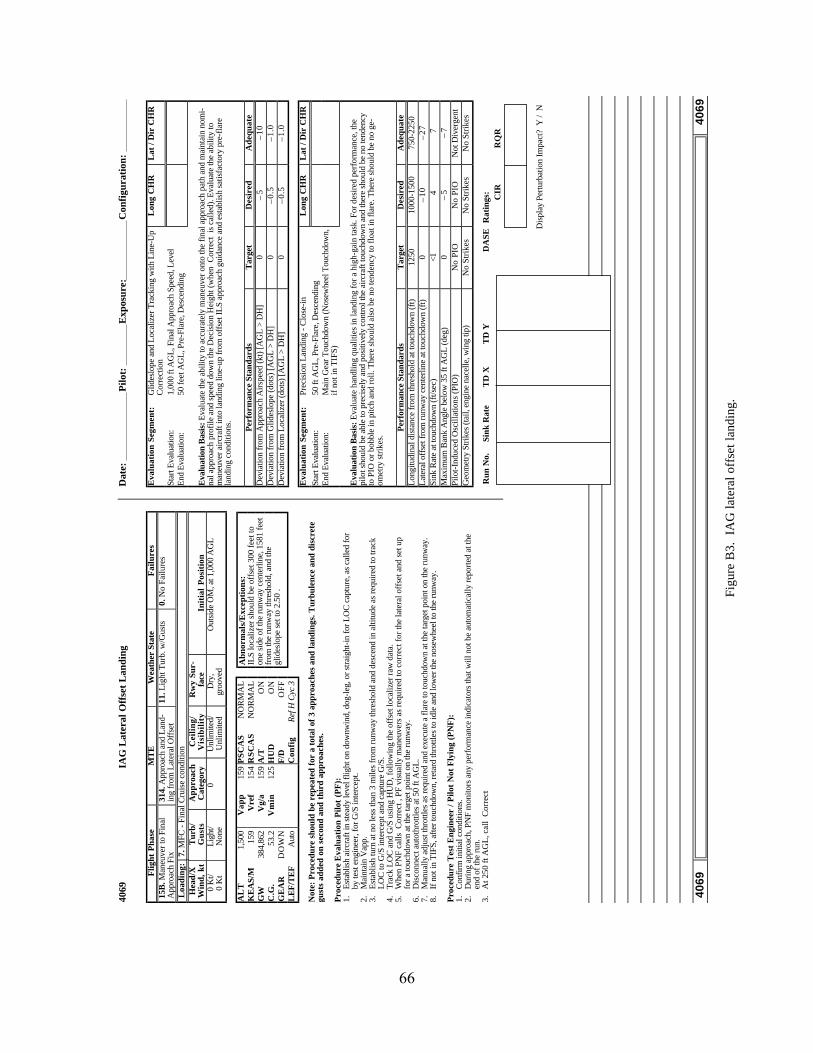
66
4069
4069
4069
IA
G L
ater
al O
ffse
t L
andi
ng
Figu
re B
3. I
AG
late
ral o
ffse
t lan
ding
.
Flig
ht P
hase
MT
EW
eath
er S
tate
Fai
lure
s15
B. M
aneu
ver
to F
inal
App
roac
h Fi
x31
4. A
ppro
ach
and
Lan
d-in
g fr
om L
ater
al O
ffse
t11
. Lig
ht T
urb.
w/G
usts
0. N
o Fa
ilure
s
Loa
ding
:7.
MFC
- F
inal
Cru
ise
cond
ition
Hea
d/X
Win
d, k
tT
urb/
Gus
tsA
ppro
ach
Cat
egor
yC
eili
ng/
Vis
ibil
ity
Rw
y Su
r-fa
ceIn
itia
l P
osit
ion
0 K
t/0
Kt
Lig
ht/
Non
e0
Unl
imite
d/U
nlim
ited
Dry
,gr
oove
dO
utsi
de O
M, a
t 1,0
00 A
GL
AL
T1,
500
Vap
p15
9P
SC
AS
NO
RM
AL
KE
AS/
M15
9V
ref
154
RS
CA
SN
OR
MA
LG
W38
4,86
2V
g/a
159
A/T
ON
C.G
.53
.2V
min
125
HU
DO
NG
EA
RD
OW
NF
/DO
FF
LE
F/T
EF
Aut
oC
onfi
gR
ef H
Cyc
3
Not
e: P
roce
dure
sho
uld
be r
epea
ted
for
a to
tal o
f 3
appr
oach
es a
nd la
ndin
gs. T
urbu
lenc
e an
d di
scre
tegu
sts
adde
d on
sec
ond
and
thir
d ap
proa
ches
.
Pro
cedu
reE
valu
atio
n P
ilot
(PF
):1.
Est
ablis
h ai
rcra
ft in
ste
ady
leve
l flig
ht o
n do
wnw
ind,
dog
-leg
, or s
trai
ght-
in fo
r LO
C c
aptu
re, a
s ca
lled
for
by te
st e
ngin
eer,
for
G/S
inte
rcep
t.2.
Mai
ntai
n V
app.
3.E
stab
lish
turn
at n
o le
ss th
an 3
mile
s fr
om r
unw
ay th
resh
old
and
desc
end
in a
ltitu
de a
s re
quir
ed to
trac
kL
OC
to G
/S in
terc
ept a
nd c
aptu
re G
/S.
4.T
rack
LO
C a
nd G
/S u
sing
HU
D, f
ollo
win
g th
e of
fset
loca
lizer
raw
dat
a.5.
Whe
n PN
F ca
lls C
orre
ct, P
F vi
sual
ly m
aneu
vers
as
requ
ired
to c
orre
ct f
or th
e la
tera
l off
set a
nd s
et u
pfo
r a
touc
hdow
n at
the
targ
et p
oint
on
the
runw
ay.
6.D
isco
nnec
t aut
othr
ottle
s at
50
ft A
GL
.7.
Man
ually
adj
ust t
hrot
tles
as r
equi
red
and
exec
ute
a fl
are
to to
uchd
own
at th
e ta
rget
poi
nt o
n th
e ru
nway
.8.
If n
ot in
TIF
S, a
fter
touc
hdow
n, r
etar
d th
rottl
es to
idle
and
low
er th
e no
sew
heel
to th
e ru
nway
.
Pro
cedu
reT
est
Eng
inee
r / P
ilot
Not
Fly
ing
(PN
F):
1.C
onfi
rm in
itial
con
ditio
ns.
2.D
urin
g ap
proa
ch, P
NF
mon
itors
any
per
form
ance
indi
cato
rs th
at w
ill n
ot b
e au
tom
atic
ally
rep
orte
d at
the
end
of th
e ru
n.3.
At 2
50 f
t AG
L, c
all
Cor
rect
Dat
e:
P
ilot:
E
xpos
ure:
C
onfi
gura
tion
:
Eva
luat
ion
Segm
ent:
Glid
eslo
pe a
nd L
ocal
izer
Tra
ckin
g w
ith L
ine-
Up
Cor
rect
ion
Lon
g C
HR
Lat
/ D
ir C
HR
Star
t Eva
luat
ion:
1,00
0 ft
AG
L, F
inal
App
roac
h Sp
eed,
Lev
elE
nd E
valu
atio
n:50
fee
t AG
L, P
re-F
lare
, Des
cend
ing
Eva
luat
ion
Bas
is: E
valu
ate
the
abili
ty to
acc
urat
ely
man
euve
r on
to th
e fi
nal a
ppro
ach
path
and
mai
ntai
n no
mi-
nal a
ppro
ach
prof
ile a
nd s
peed
dow
n th
e D
ecis
ion
Hei
ght (
whe
n C
orre
ct is
cal
led)
. Eva
luat
e th
e ab
ility
tom
aneu
ver
airc
raft
into
land
ing
line-
up f
rom
off
set I
LS
appr
oach
gui
danc
e an
d es
tabl
ish
satis
fact
ory
pre-
flar
ela
ndin
g co
nditi
ons.
Per
form
ance
Sta
ndar
dsT
arge
tD
esir
edA
dequ
ate
Dev
iatio
n fr
om A
ppro
ach
Air
spee
d (k
t) [
AG
L >
DH
]0
–5
–1
0D
evia
tion
from
Glid
eslo
pe (
dots
) [A
GL
> D
H]
0–
0.5
–1.
0D
evia
tion
from
Loc
aliz
er (
dots
) [A
GL
> D
H]
0–
0.5
–1.
0
Eva
luat
ion
Segm
ent:
Prec
isio
n L
andi
ng -
Clo
se-i
nL
ong
CH
RL
at /
Dir
CH
RSt
art E
valu
atio
n:50
ft A
GL
, Pre
-Fla
re, D
esce
ndin
gE
nd E
valu
atio
n:M
ain
Gea
r T
ouch
dow
n (N
osew
heel
Tou
chdo
wn,
if n
ot in
TIF
S)
Eva
luat
ion
Bas
is: E
valu
ate
hand
ling
qual
ities
in la
ndin
g fo
r a
high
-gai
n ta
sk. F
or d
esir
ed p
erfo
rman
ce, t
hepi
lot s
houl
d be
abl
e to
pre
cise
ly a
nd p
ositi
vely
con
trol
the
airc
raft
touc
hdow
n an
d th
ere
shou
ld b
e no
tend
ency
to P
IO o
r bo
bble
in p
itch
and
roll.
The
re s
houl
d al
so b
e no
tend
ency
to f
loat
in f
lare
. The
re s
houl
d be
no
ge-
omet
ry s
trik
es.
Per
form
ance
Sta
ndar
dsT
arge
tD
esir
edA
dequ
ate
Lon
gitu
dina
l dis
tanc
e fr
om th
resh
old
at to
uchd
own
(ft)
1250
1000
-150
075
0-22
50L
ater
al o
ffse
t fro
m ru
nway
cen
terl
ine
at to
uchd
own
(ft)
0–
10
–2
7Si
nk R
ate
at to
uchd
own
(ft/s
ec)
<14
7M
axim
um B
ank
Ang
le b
elow
35
ft A
GL
(de
g)0
–5
–7
Pilo
t-In
duce
d O
scill
atio
ns (
PIO
)N
o P
ION
o P
ION
ot D
iver
gent
Geo
met
ry S
trik
es (t
ail,
engi
ne n
acel
le, w
ing
tip)
No
Stri
kes
No
Stri
kes
No
Stri
kes
Run
No.
S
ink
Rat
e
T
D X
T
D Y
DA
SE
Rat
ings
:C
IRR
QR
Abn
orm
als/
Exc
epti
ons:
ILS
loca
lizer
sho
uld
be o
ffse
t 300
fee
t to
one
side
of t
he ru
nway
cen
terl
ine,
158
1 fe
etfr
om th
e ru
nway
thre
shol
d, a
nd th
egl
ides
lope
set
to 2
.50
.
Dis
play
Per
turb
atio
n Im
pact
? Y
/ N

67
Tas
k R
atin
g C
ard
Figu
re B
4. T
ask
ratin
g ca
rd.
--
Tas
k ID
:
[ ]
Nom
inal
[
] O
ffse
t
[ ]
Flt
. Dir
.
Pilo
t:
Con
figu
rati
on:
D
ate:
Ev
alu
ati
on
S
eg
me
nt
Lo
ng
CH
RL
at-
Dir
C
HR
DA
SE
C
IRD
AS
E
RQ
RN
/A
App
roac
h
Land
ing
Flt
Dir
Tra
ckin
g &
Cap
utur
e
Exc
elle
ntH
ighl
y de
sira
ble
Pilo
t com
pens
atio
n no
t a fa
ctor
for
desi
red
perf
orm
ance
Goo
dN
eglig
ible
def
icie
ncie
sP
ilot c
ompe
nsat
ion
not a
fact
or fo
rde
sire
d pe
rfor
man
ce
Fai
r -
Som
e m
ildly
unpl
easa
nt d
efic
ienc
ies
Min
imal
pilo
t com
pens
atio
n re
quire
d fo
rde
sire
d pe
rfor
man
ce
Min
or b
ut a
nnoy
ing
defic
ienc
ies
Des
ired
perf
orm
ance
req
uire
s m
oder
ate
pilo
t com
pens
atio
n
Mod
erat
ely
obje
ctio
nabl
ede
ficie
ncie
sA
dequ
ate
perf
orm
ance
req
uire
sco
nsid
erab
le p
ilot c
ompe
nsat
ion
Maj
or d
efic
ienc
ies
Ade
quat
e pe
rfor
man
ce n
ot a
ttain
able
with
max
imum
tole
rabl
e pi
lot c
ompe
nsat
ion.
Con
trol
labi
lity
not i
n qu
estio
n.
Maj
or d
efic
ienc
ies
Con
side
rabl
e pi
lot c
ompe
nsat
ion
is r
equi
red
for
cont
rol
Maj
or d
efic
ienc
ies
Inte
nse
pilo
t com
pens
atio
n is
req
uire
d to
reta
in c
ontr
ol
Maj
or d
efic
ienc
ies
Con
trol
will
be
lost
dur
ing
som
e po
rtio
n of
requ
ired
oper
atio
n
AIR
CR
AF
TC
HA
RA
CT
ER
IST
ICS
DE
MA
ND
ON
TH
E P
ILO
TIN
SE
LE
CT
ED
TA
SK
OR
RE
QU
IRE
D O
PE
RA
TIO
N*
CH
R
Ver
y ob
ject
iona
ble
but
tole
rabl
e de
ficie
ncie
sA
dequ
ate
perf
orm
ance
req
uire
sex
tens
ive
pilo
t com
pens
atio
n
7 8 9 105 642 31
Def
icie
ncie
s w
arra
ntim
prov
emen
t
Impr
ovem
ent
man
dato
ry
Def
icie
ncie
sre
quire
impr
ovem
ent
Is it
satis
fact
ory
with
out
impr
ovem
ent?
No
Yes
Is a
dequ
ate
perf
orm
ance
atta
in-
able
with
a to
lera
ble
wor
kloa
d?
No
Yes
Is it
cont
rolla
ble?
No
Yes
AD
EQ
UA
CY
FO
R S
EL
EC
TE
D T
AS
K O
RR
EQ
UIR
ED
OP
ER
AT
ION
*
Pilo
t dec
isio
ns
*Def
initi
on o
f req
uire
d op
erat
ion
invo
lves
des
igna
tion
of fl
ight
pha
se a
nd/o
rsu
bpha
ses
with
acc
ompa
nyin
g co
nditi
ons.
Pilo
t int
entio
nally
mod
ifies
con
trol
inpu
ts
to a
void
exc
itatio
n of
flex
ible
mod
es.
Coc
kpit
vibr
atio
ns im
pact
pre
cisi
on o
f vo
lunt
ary
cont
rol i
nput
s.
Coc
kpit
vibr
atio
ns c
ause
occ
asio
nal
invo
lunt
ary
cont
rol i
nput
s.
Coc
kpit
vibr
atio
ns c
ause
freq
uent
in
volu
ntar
y co
ntro
l inp
uts.
Pilo
t doe
s no
t alte
r co
ntro
l inp
uts
as a
re
sult
of a
ircra
ft fle
xibi
lity.
3 4 521
DA
SE
INF
LU
EN
CE
ON
PIL
OT
’S
CO
NT
RO
L IN
PU
TS
Coc
kpit
vibr
atio
ns c
ause
sus
tain
ed in
volu
n-
tary
con
trol
inpu
ts o
r lo
ss o
f con
trol
.6
CIR
Coc
kpit
vibr
atio
ns d
o no
t im
pact
rid
e qu
ality
.
Coc
kpit
vibr
atio
ns a
re m
ildly
obj
ectio
nabl
e -
impr
ovem
ent d
esire
d.
Coc
kpit
vibr
atio
ns a
re m
oder
atel
y ob
ject
iona
ble
- im
prov
emen
t war
rant
ed.
DA
SE
INF
LU
EN
CE
ON
RID
E Q
UA
LIT
Y
42 31
Coc
kpit
vibr
atio
ns a
re h
ighl
y ob
ject
iona
ble
-
impr
ovem
ent r
equi
red.
5
Coc
kpit
vibr
atio
ns c
ause
aba
ndon
men
t
of ta
sk -
im
prov
emen
t req
uire
d.
RQ
R
Do
aero
elas
tic d
ispl
ay p
ertu
rbat
ions
impa
ct th
e ea
se
or p
reci
sion
with
whi
ch th
e ta
sk is
per
form
ed?
Y
/ N
Coc
kpit
vibr
atio
ns a
re p
erce
ptib
le b
ut n
ot
obje
ctio
nabl
e -
no im
prov
emen
t nec
essa
ry.
6
Dis
play
Per
turb
atio
n Im
pact
? Y
/ N
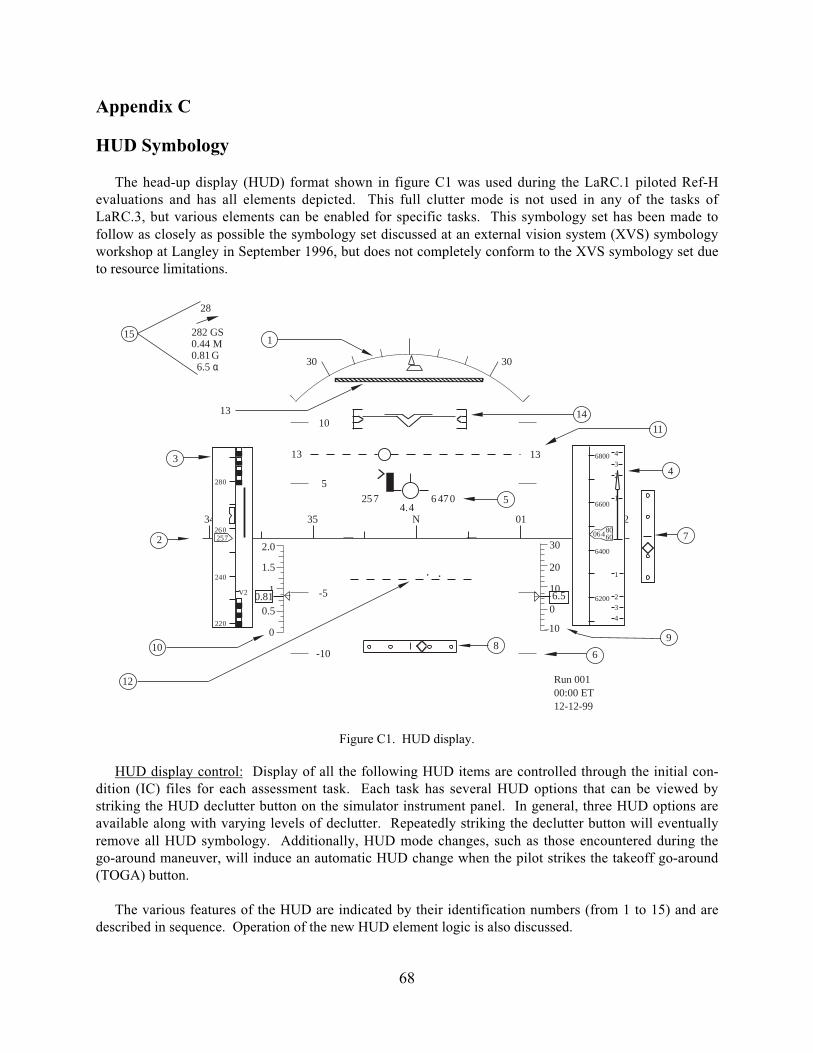
68
Appendix C
HUD Symbology
The head-up display (HUD) format shown in figure C1 was used during the LaRC.1 piloted Ref-Hevaluations and has all elements depicted. This full clutter mode is not used in any of the tasks ofLaRC.3, but various elements can be enabled for specific tasks. This symbology set has been made tofollow as closely as possible the symbology set discussed at an external vision system (XVS) symbologyworkshop at Langley in September 1996, but does not completely conform to the XVS symbology set dueto resource limitations.
Run 00100:00 ET12-12-99
3030
10
5
-5
-10 6
7
8-10
30
10
20
06.5
9
2.0
1
0
1.5
0.50.81
10
1313
11
12
54.4
257 6 470
13 14
1282 GS0.44 M0.81
6.5 α
28
15
2
N3534 01 02
3
280
260
240
220
257
V2
46800
6600
6400
6200
1
234
1
234
0648060
G
Figure C1. HUD display.
HUD display control: Display of all the following HUD items are controlled through the initial con-dition (IC) files for each assessment task. Each task has several HUD options that can be viewed bystriking the HUD declutter button on the simulator instrument panel. In general, three HUD options areavailable along with varying levels of declutter. Repeatedly striking the declutter button will eventuallyremove all HUD symbology. Additionally, HUD mode changes, such as those encountered during thego-around maneuver, will induce an automatic HUD change when the pilot strikes the takeoff go-around(TOGA) button.
The various features of the HUD are indicated by their identification numbers (from 1 to 15) and aredescribed in sequence. Operation of the new HUD element logic is also discussed.
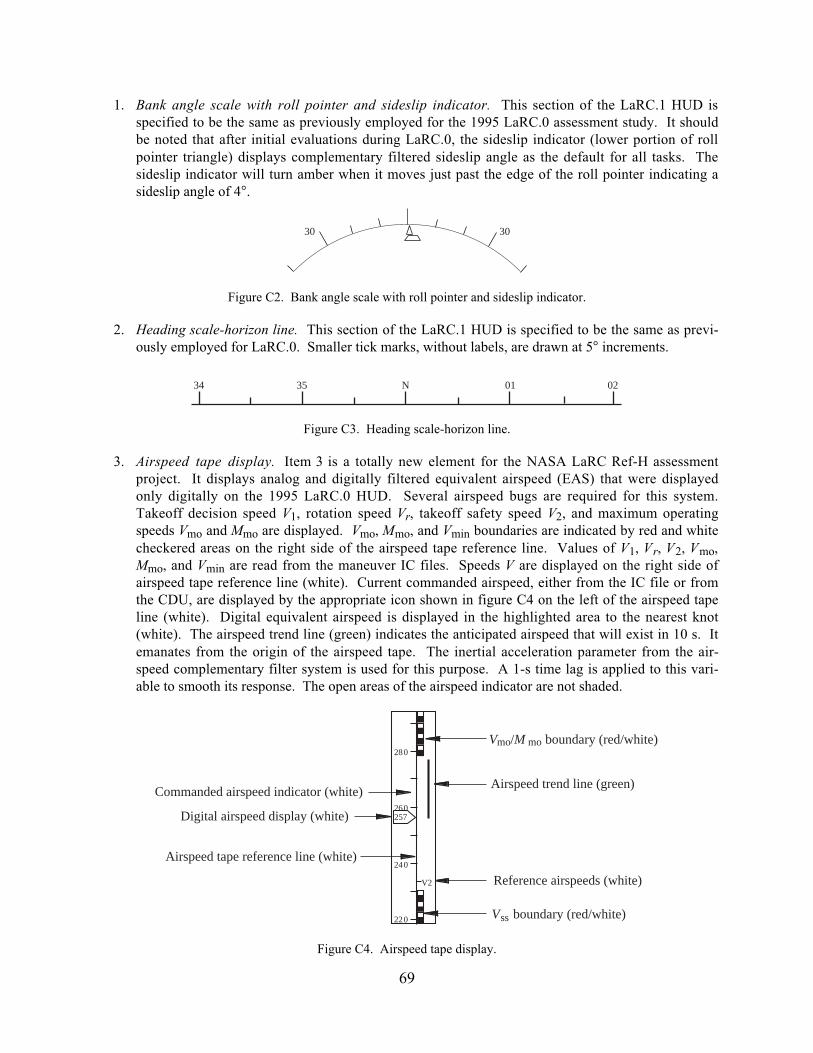
69
1. Bank angle scale with roll pointer and sideslip indicator. This section of the LaRC.1 HUD isspecified to be the same as previously employed for the 1995 LaRC.0 assessment study. It shouldbe noted that after initial evaluations during LaRC.0, the sideslip indicator (lower portion of rollpointer triangle) displays complementary filtered sideslip angle as the default for all tasks. Thesideslip indicator will turn amber when it moves just past the edge of the roll pointer indicating asideslip angle of 4°.
3030
Figure C2. Bank angle scale with roll pointer and sideslip indicator.
2. Heading scale-horizon line. This section of the LaRC.1 HUD is specified to be the same as previ-ously employed for LaRC.0. Smaller tick marks, without labels, are drawn at 5° increments.
N3534 01 02
Figure C3. Heading scale-horizon line.
3. Airspeed tape display. Item 3 is a totally new element for the NASA LaRC Ref-H assessmentproject. It displays analog and digitally filtered equivalent airspeed (EAS) that were displayedonly digitally on the 1995 LaRC.0 HUD. Several airspeed bugs are required for this system.Takeoff decision speed V1, rotation speed Vr, takeoff safety speed V2, and maximum operatingspeeds Vmo and Mmo are displayed. Vmo, Mmo, and Vmin boundaries are indicated by red and whitecheckered areas on the right side of the airspeed tape reference line. Values of V1, Vr, V2, Vmo,Mmo, and Vmin are read from the maneuver IC files. Speeds V are displayed on the right side ofairspeed tape reference line (white). Current commanded airspeed, either from the IC file or fromthe CDU, are displayed by the appropriate icon shown in figure C4 on the left of the airspeed tapeline (white). Digital equivalent airspeed is displayed in the highlighted area to the nearest knot(white). The airspeed trend line (green) indicates the anticipated airspeed that will exist in 10 s. Itemanates from the origin of the airspeed tape. The inertial acceleration parameter from the air-speed complementary filter system is used for this purpose. A 1-s time lag is applied to this vari-able to smooth its response. The open areas of the airspeed indicator are not shaded.
280
260
240
220
257
V2
Commanded airspeed indicator (white)
Digital airspeed display (white)
Airspeed tape reference line (white)
V /M boundary (red/white)
Airspeed trend line (green)
Reference airspeeds (white)
V boundary (red/white)ss
momo
Figure C4. Airspeed tape display.
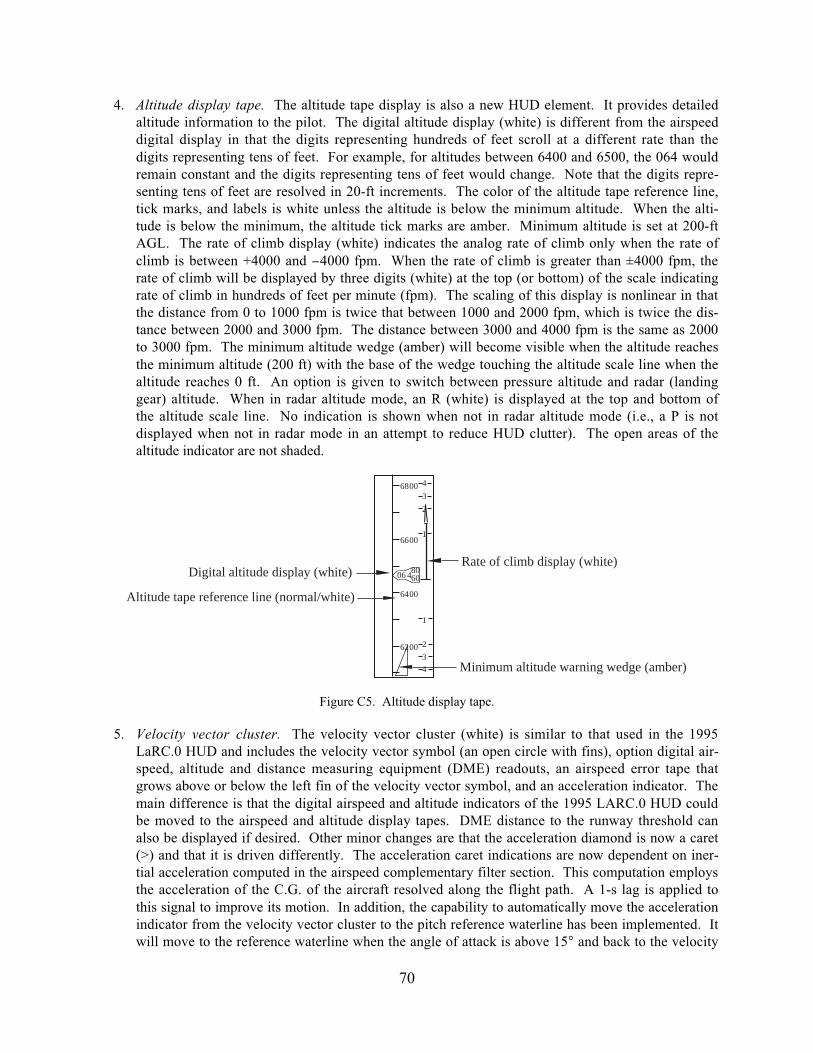
70
4. Altitude display tape. The altitude tape display is also a new HUD element. It provides detailedaltitude information to the pilot. The digital altitude display (white) is different from the airspeeddigital display in that the digits representing hundreds of feet scroll at a different rate than thedigits representing tens of feet. For example, for altitudes between 6400 and 6500, the 064 wouldremain constant and the digits representing tens of feet would change. Note that the digits repre-senting tens of feet are resolved in 20-ft increments. The color of the altitude tape reference line,tick marks, and labels is white unless the altitude is below the minimum altitude. When the alti-tude is below the minimum, the altitude tick marks are amber. Minimum altitude is set at 200-ftAGL. The rate of climb display (white) indicates the analog rate of climb only when the rate ofclimb is between +4000 and −4000 fpm. When the rate of climb is greater than ±4000 fpm, therate of climb will be displayed by three digits (white) at the top (or bottom) of the scale indicatingrate of climb in hundreds of feet per minute (fpm). The scaling of this display is nonlinear in thatthe distance from 0 to 1000 fpm is twice that between 1000 and 2000 fpm, which is twice the dis-tance between 2000 and 3000 fpm. The distance between 3000 and 4000 fpm is the same as 2000to 3000 fpm. The minimum altitude wedge (amber) will become visible when the altitude reachesthe minimum altitude (200 ft) with the base of the wedge touching the altitude scale line when thealtitude reaches 0 ft. An option is given to switch between pressure altitude and radar (landinggear) altitude. When in radar altitude mode, an R (white) is displayed at the top and bottom ofthe altitude scale line. No indication is shown when not in radar altitude mode (i.e., a P is notdisplayed when not in radar mode in an attempt to reduce HUD clutter). The open areas of thealtitude indicator are not shaded.
6800
6600
6400
6200
1
234
1
234
06 48060Digital altitude display (white)
Altitude tape reference line (normal/white)
Rate of climb display (white)
Minimum altitude warning wedge (amber)
Figure C5. Altitude display tape.
5. Velocity vector cluster. The velocity vector cluster (white) is similar to that used in the 1995LaRC.0 HUD and includes the velocity vector symbol (an open circle with fins), option digital air-speed, altitude and distance measuring equipment (DME) readouts, an airspeed error tape thatgrows above or below the left fin of the velocity vector symbol, and an acceleration indicator. Themain difference is that the digital airspeed and altitude indicators of the 1995 LARC.0 HUD couldbe moved to the airspeed and altitude display tapes. DME distance to the runway threshold canalso be displayed if desired. Other minor changes are that the acceleration diamond is now a caret(>) and that it is driven differently. The acceleration caret indications are now dependent on iner-tial acceleration computed in the airspeed complementary filter section. This computation employsthe acceleration of the C.G. of the aircraft resolved along the flight path. A 1-s lag is applied tothis signal to improve its motion. In addition, the capability to automatically move the accelerationindicator from the velocity vector cluster to the pitch reference waterline has been implemented. Itwill move to the reference waterline when the angle of attack is above 15° and back to the velocity
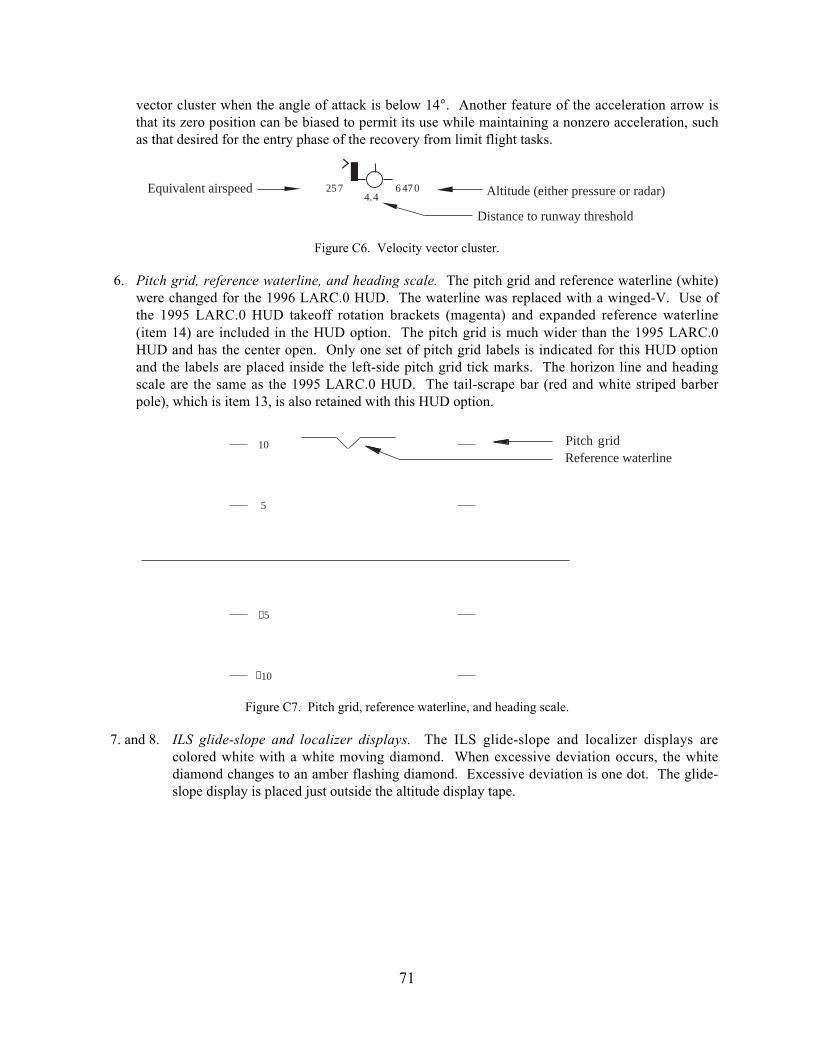
71
vector cluster when the angle of attack is below 14°. Another feature of the acceleration arrow isthat its zero position can be biased to permit its use while maintaining a nonzero acceleration, suchas that desired for the entry phase of the recovery from limit flight tasks.
Equivalent airspeed Altitude (either pressure or radar)
Distance to runway threshold4.4
257 6 470
Figure C6. Velocity vector cluster.
6. Pitch grid, reference waterline, and heading scale. The pitch grid and reference waterline (white)were changed for the 1996 LARC.0 HUD. The waterline was replaced with a winged-V. Use ofthe 1995 LARC.0 HUD takeoff rotation brackets (magenta) and expanded reference waterline(item 14) are included in the HUD option. The pitch grid is much wider than the 1995 LARC.0HUD and has the center open. Only one set of pitch grid labels is indicated for this HUD optionand the labels are placed inside the left-side pitch grid tick marks. The horizon line and headingscale are the same as the 1995 LARC.0 HUD. The tail-scrape bar (red and white striped barberpole), which is item 13, is also retained with this HUD option.
Pitch gridReference waterline
10
5
−5
−10
Figure C7. Pitch grid, reference waterline, and heading scale.
7. and 8. ILS glide-slope and localizer displays. The ILS glide-slope and localizer displays arecolored white with a white moving diamond. When excessive deviation occurs, the whitediamond changes to an amber flashing diamond. Excessive deviation is one dot. The glide-slope display is placed just outside the altitude display tape.
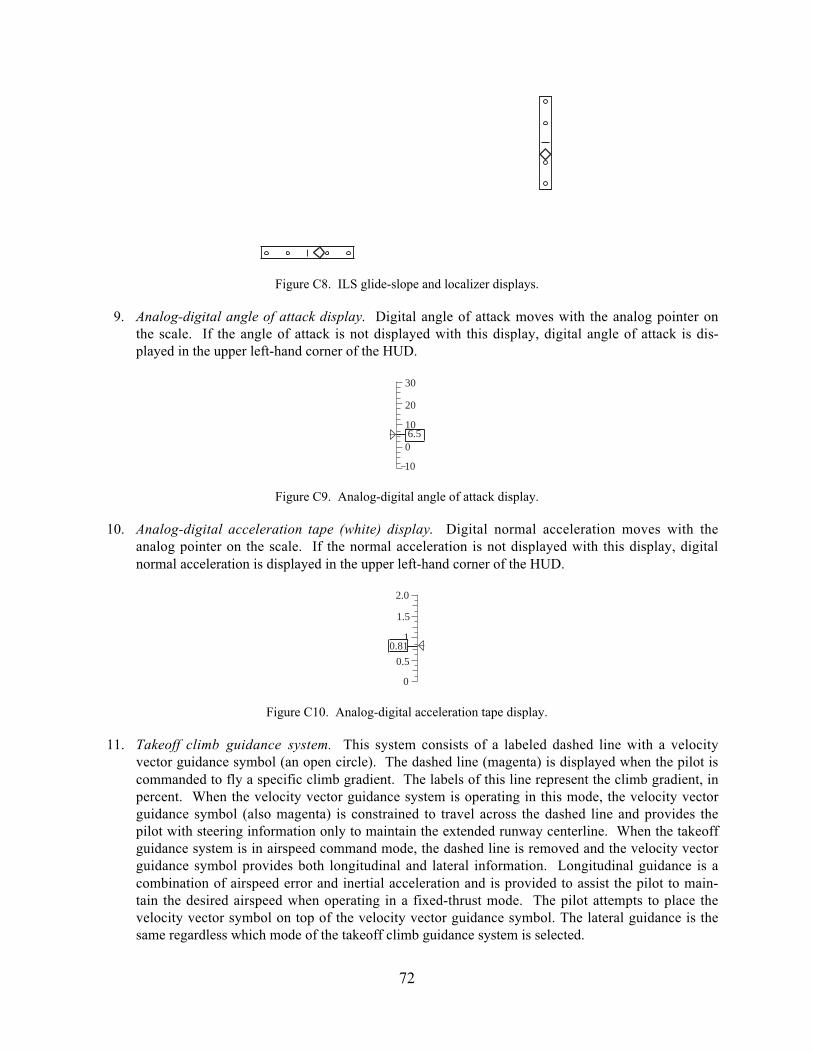
72
Figure C8. ILS glide-slope and localizer displays.
9. Analog-digital angle of attack display. Digital angle of attack moves with the analog pointer onthe scale. If the angle of attack is not displayed with this display, digital angle of attack is dis-played in the upper left-hand corner of the HUD.
–10
30
10
20
06.5
Figure C9. Analog-digital angle of attack display.
10. Analog-digital acceleration tape (white) display. Digital normal acceleration moves with theanalog pointer on the scale. If the normal acceleration is not displayed with this display, digitalnormal acceleration is displayed in the upper left-hand corner of the HUD.
.1
2.0
1.5
0.5
0
0.81
Figure C10. Analog-digital acceleration tape display.
11. Takeoff climb guidance system. This system consists of a labeled dashed line with a velocityvector guidance symbol (an open circle). The dashed line (magenta) is displayed when the pilot iscommanded to fly a specific climb gradient. The labels of this line represent the climb gradient, inpercent. When the velocity vector guidance system is operating in this mode, the velocity vectorguidance symbol (also magenta) is constrained to travel across the dashed line and provides thepilot with steering information only to maintain the extended runway centerline. When the takeoffguidance system is in airspeed command mode, the dashed line is removed and the velocity vectorguidance symbol provides both longitudinal and lateral information. Longitudinal guidance is acombination of airspeed error and inertial acceleration and is provided to assist the pilot to main-tain the desired airspeed when operating in a fixed-thrust mode. The pilot attempts to place thevelocity vector symbol on top of the velocity vector guidance symbol. The lateral guidance is thesame regardless which mode of the takeoff climb guidance system is selected.
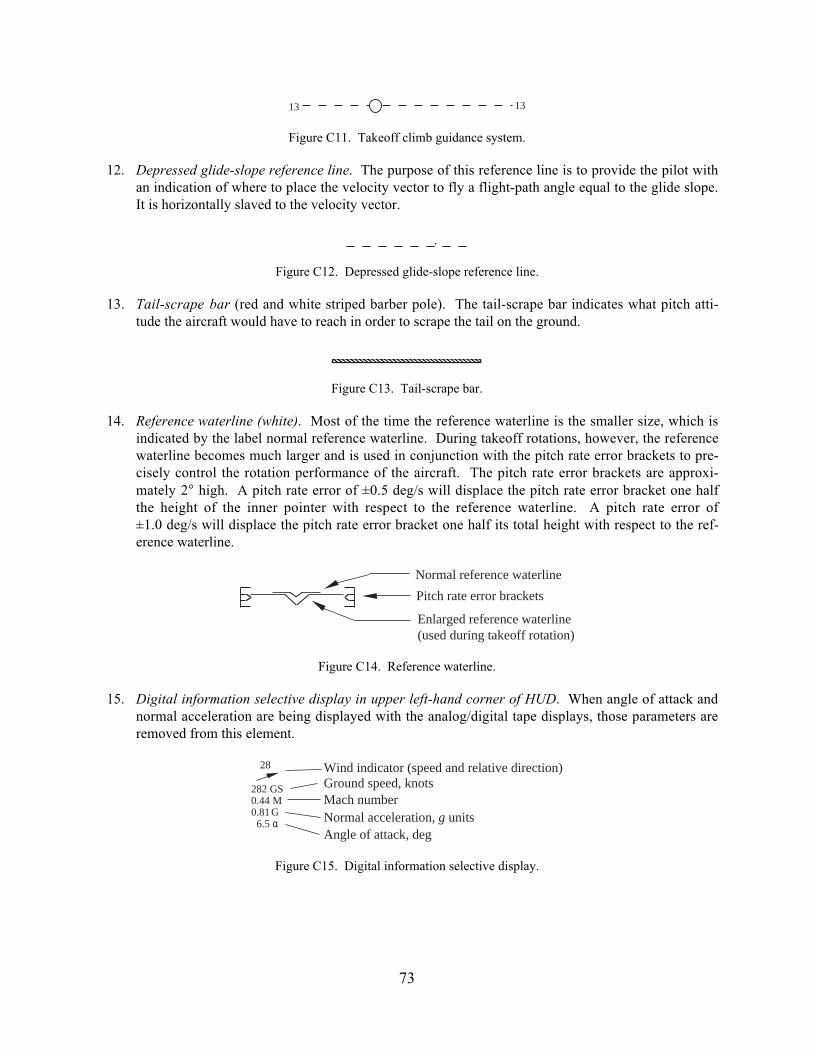
73
13 13
Figure C11. Takeoff climb guidance system.
12. Depressed glide-slope reference line. The purpose of this reference line is to provide the pilot withan indication of where to place the velocity vector to fly a flight-path angle equal to the glide slope.It is horizontally slaved to the velocity vector.
Figure C12. Depressed glide-slope reference line.
13. Tail-scrape bar (red and white striped barber pole). The tail-scrape bar indicates what pitch atti-tude the aircraft would have to reach in order to scrape the tail on the ground.
Figure C13. Tail-scrape bar.
14. Reference waterline (white). Most of the time the reference waterline is the smaller size, which isindicated by the label normal reference waterline. During takeoff rotations, however, the referencewaterline becomes much larger and is used in conjunction with the pitch rate error brackets to pre-cisely control the rotation performance of the aircraft. The pitch rate error brackets are approxi-mately 2° high. A pitch rate error of ±0.5 deg/s will displace the pitch rate error bracket one halfthe height of the inner pointer with respect to the reference waterline. A pitch rate error of±1.0 deg/s will displace the pitch rate error bracket one half its total height with respect to the ref-erence waterline.
Normal reference waterlinePitch rate error brackets
Enlarged reference waterline(used during takeoff rotation)
Figure C14. Reference waterline.
15. Digital information selective display in upper left-hand corner of HUD. When angle of attack andnormal acceleration are being displayed with the analog/digital tape displays, those parameters areremoved from this element.
Wind indicator (speed and relative direction)Ground speed, knotsMach numberNormal acceleration, g unitsAngle of attack, deg
282 GS0.44 M0.81
6.5 α
28
G
Figure C15. Digital information selective display.

74
Appendix D
Flight Director Implementation for Task 3115
The composite flight director tracking task allowed the pilot to evaluate the ability to accuratelymaneuver the aircraft by following flight director commands. The flight director was driven with acomposite signal containing elements from various maneuver segments that had been examined in previ-ous Ref-H simulations. These maneuver segments included a localizer capture from the nominalapproach, glide-slope capture, a descending turn, and a rapid pull-up as found in the landing go-aroundtasks. Each of these segments are described in this appendix. Flight-path and track angle commandsfrom these segments were combined with varying order and sign to produce a flight director behavior thatwas not easily anticipated, but which was still representative of actual flight maneuver tasks.
Maneuver Segments for Use With Composite Flight Director Tracking Task
Go-Around Plus Spiral Descent
A sequence of flight-path and heading changes to the flight director was used to create an aggressivepull-up followed by a descending turn. This sequence is shown in table D1 and figure D1.
Table D1. Flight-Path Angle and Heading Angle Command Sequencesfor Go-Around Plus Spiral Descent Task
Time, sFlight-path anglecommand, deg
Heading angle com-mand, deg (× R1)
010132325
01515 5 5
0 0 0–15–15
0 5 10 15 20 2502468
1012141618
Time, s0 5 10 15 20 25
−18−16−14−12−10−8−6−4−20
Time, s
Flig
ht-p
ath
angl
e co
mm
and,
deg
Hea
ding
ang
le c
omm
and,
deg
Figure D1. Flight-path angle and heading angle time histories.
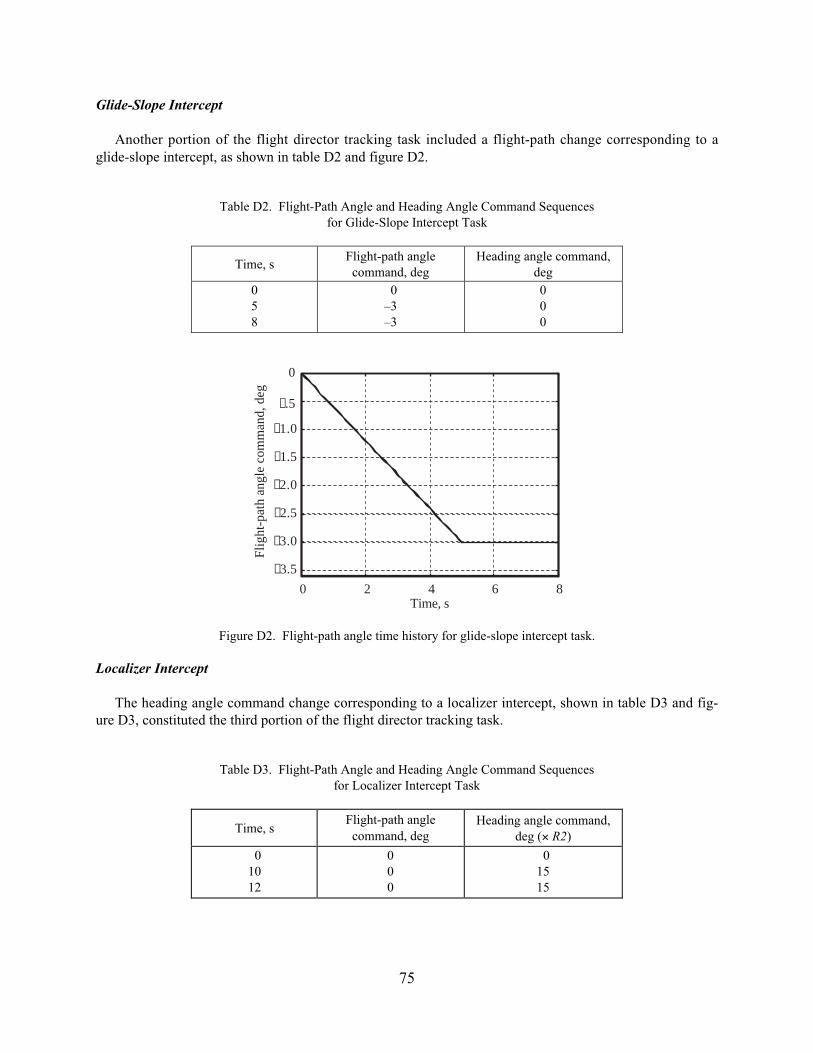
75
Glide-Slope Intercept
Another portion of the flight director tracking task included a flight-path change corresponding to aglide-slope intercept, as shown in table D2 and figure D2.
Table D2. Flight-Path Angle and Heading Angle Command Sequencesfor Glide-Slope Intercept Task
Time, sFlight-path anglecommand, deg
Heading angle command,deg
058
0–3–3
000
0 2 4 6 8−3.5
−3.0
−2.5
−2.0
−1.5
−1.0
0
Time, s
Flig
ht-p
ath
angl
e co
mm
and,
deg
−.5
Figure D2. Flight-path angle time history for glide-slope intercept task.
Localizer Intercept
The heading angle command change corresponding to a localizer intercept, shown in table D3 and fig-ure D3, constituted the third portion of the flight director tracking task.
Table D3. Flight-Path Angle and Heading Angle Command Sequencesfor Localizer Intercept Task
Time, sFlight-path anglecommand, deg
Heading angle command,deg (× R2)
01012
000
01515

76
0 2 4 6 8 10 120
2
4
6
8
10
12
14
16
18
Time, s
Hea
ding
ang
le c
omm
and,
deg
Figure D3. Heading angle command time history for localizer intercept task.
Random Sense and Sequencing for Maneuver Segments
The sequence of execution of maneuver segments 1, 2, and 3 was randomly chosen prior to the start ofa run. If a particular segment ended with a nonzero flight-path or track angle command, then the follow-ing segment was executed relative to that nonzero condition. The sequence would always begin with a3-s interval of straight and level flight before the first of the maneuver segment flight director commands.After this 3-s interval, the flight path and heading command sequence began. The parameters R1 and R2were integers which had a constant value during a run, but which were randomly chosen to be either −1 or+1 prior to the start of a run. Their values were independent of each another.
Filtering of Flight Director Signals
Second-order filters were applied to signals that drove the flight director symbol to prevent overlyabrupt changes in the target climb rate and turn rate. The second-order filters had the form shown inequation (D1).
1As2 +Bs+1
(D1)
where A and B are time constants and s is the LaPlace operator. The time constants for these filters wereseparately tuned for the vertical and lateral command paths based on preliminary pilot evaluations. Thetime constants produced a critically damped second-order behavior with a natural frequency of 1.2 rad/sin the longitudinal path and 0.6 rad/s in the lateral path. The values of the time constants are as follows:
Table D4. Values of Time Constants
Path A B
VerticalLateral
0.702.80
1.302.60

77
Performance Tolerances for Flight Director Tracking Task
To compute the task performance for this maneuver, it was necessary to calculate the percentage oftime spent with the center of the flight-path marker symbol within 1° and within 2° of the center of theflight director symbol. The flight director symbol consisted of two concentric circles centered on theflight director command as shown in figure D4. The inner circle had a radius of 1.25° and the outer circlehad a radius of 2.25°. Desired performance for the flight director tracking task required that the pilotmaintain the entire flight-path marker inside the inner circle (1.25° radius) for at least 70 percent of theduration of the task. Adequate performance required that the pilot maintain the entire flight-path markerinside the blue (2.25° radius) for at least 90 percent of the duration of the task. The task performance wascomputed based on the pilot’s flight-path command symbol (the output from his stick integrator whichappears on the HUD) and not the actual flight path of the vehicle. Therefore, this task provided anindication of the pilot’s ability to issue precise maneuver control inputs in the presence of aeroelasticdisturbances.
Run 00100:00 ET12-12-99
3030
10
5
−5
4.4159 1754
N35 01
161 GS0.45 M1.04 G 12.5 α
28
−10
Concentric flightdirector circles
Figure D4. Flight director symbol.

78
References
1. Jackson, E. Bruce; Raney, David L.; Hahne, David E.; Derry, Stephen D.; and Glaab, Louis J.: Reference HPiloted Assessment (LaRC.1) Pilot Briefing Guide. NASA/TM-1999-209533, 1997.
2. Waszak, Martin R.; Davidson, John B.; and Schmidt, David K.: A Simulation Study of the Flight Dynamics ofElastic Aircraft—Volumes I and II. NASA CR-4102, 1987.
3. Churchill, Brett, et al.: High Speed Civil Transport Reference H—Cycle 3 Simulation Data Base. ContractNAS1-20220, Assignment No. 36, WBS 4.3.5.1.2.1, June 1996.
4. Kraft, Raymond; Duffy, Keith S.; Coleman, Edward E.; and Shaw, John L.: Flight Control System for NASASimulation. HSCT-BE49B-L95-013,14 (Contract NAS1-20220), Boeing Co., Aug. 18. 1995.
5. Williams, T. M.; Griffith, M. J.; and Rossitto, K. F.: Description of Lateral-Directional SCAS Control Laws forRef. H Assessment. Contract NAS1-20220, McDonnell Douglas Aerospace, August 1995.
6. Shweyk, Kamal M.; and Rossitto, Ken F.: Roll Performance and Criteria Development and HSCT LateralControl Issues. Rep. No. CRAD-9408-TR-3729 (Contract NAS1-20220), Boeing Co., Feb. 6, 1998.
7. Davidson, J. B., Jr.: Lateral-Directional Eigenvector Flying Qualities Guidelines and Gain Weighted EigenspaceAssignment Methodology. Ph.D. Thesis, Purdue Univ., May 1997.
8. Bailey, R. E.; and Knotts, L. H.: Interaction of Feel System and Flight Control System Dynamics on LateralFlying Qualities. NASA CR-179445, 1990.
9. Cooper, George E.; and Harper, Robert P., Jr.: The Use of Pilot Rating in the Evaluation of Aircraft HandlingQualities. NASA TN D-5153, 1969.
10. Bailey, Melvin L., ed.: Pilot Comments From the Boeing High Speed Research Aircraft, Cycle 3, SimulationStudy of the Effects of Aeroservoelasticity (LaRC.3), NASA/CR-2000-210307, 2000.
11. Parrish, Russell V.; Dieudonne, James E.; Martin, Dennis J.; and Copeland, James L.: Compensation Based onLinearized Analysis for a Six-Degree-of-Freedom Motion Simulator. NASA TN D-7349, 1973.
12. Ashkenas, I. L.; Magdaleno, R. E.; and McRuer, D. T.: Flight Control and Analysis Methods for StudyingFlying and Ride Qualities of Flexible Transport Aircraft. NASA CR-172201, 1983.
13. Smith, John W.; and Montgomery, Terry: Biomechanically Induced and Controller Coupled OscillationsExperienced on the F-16XL Aircraft During Rolling Maneuvers. NASA TM-4752, 1996.
14. Ray, Jim; and Rossitto, Ken: HSCT Flight Control System Requirements Specification. NASA ContractNAS1-20220, Boeing Co., Oct. 31, 1997.
REPORT DOCUMENTATION PAGE Form ApprovedOMB No. 0704-0188
1. REPORT DATE (DD-MM-YYYY)
10-20022. REPORT TYPE
Technical Publication 4. TITLE AND SUBTITLE
Simulation Study of Impact of Aeroelastic Characteristics on Flying Qualities of a High Speed Civil Transport
5a. CONTRACT NUMBER
6. AUTHOR(S)
Raney, David L.; Jackson, E. Bruce; and Buttrill, Carey S.
7. PERFORMING ORGANIZATION NAME(S) AND ADDRESS(ES)
NASA Langley Research CenterHampton, VA 23681-2199
9. SPONSORING/MONITORING AGENCY NAME(S) AND ADDRESS(ES)
National Aeronautics and Space AdministrationWashington, DC 20546-0001
8. PERFORMING ORGANIZATION REPORT NUMBER
L-18157
10. SPONSOR/MONITOR'S ACRONYM(S)
NASA
13. SUPPLEMENTARY NOTESRaney, Jackson, and Buttrill, Langley Research CenterAn electronic version can be found at http://techreports.larc.nasa.gov/ltrs/ or http://techreports.larc.nasa.gov/cgi-bin/NTRS
12. DISTRIBUTION/AVAILABILITY STATEMENTUnclassified - UnlimitedSubject Category 08Availability: NASA CASI (301) 621-0390 Distribution: Standard
19a. NAME OF RESPONSIBLE PERSON
STI Help Desk (email: [email protected])
14. ABSTRACT
A piloted simulation study conducted in NASA Langley’s Visual Motion Simulator addressed the impact of dynamic aero- servoelastic effects on flying qualities of a High Speed Civil Transport. The intent was to determine effectiveness of measures to reduce the impact of aircraft flexibility on piloting tasks. Potential solutions examined were increasing frequency of elastic modes through structural stiffening, increasing damping of elastic modes through active control, elimination of control effector excitation of the lowest frequency elastic modes, and elimination of visual cues associated with elastic modes. Six test pilots evaluated and performed simulated maneuver tasks, encountering incidents wherein cockpit vibrations due to elastic modes fed back into the control stick through involuntary vibrations of the pilot’s upper body and arm. Structural stiffening and compen- sation of the visual display were of little benefit in alleviating this impact, while increased damping and elimination of control effector excitation of the elastic modes both offered great improvements when applied in sufficient degree.15. SUBJECT TERMS
Supersonic transport; Flying qualities; Cockpit vibration; Structural model control; Mode suppression; Ride quality; Biodynamic coupling
18. NUMBER OF PAGES
92
19b. TELEPHONE NUMBER (Include area code)
(301) 621-0390
a. REPORT
U
c. THIS PAGE
U
b. ABSTRACT
U
17. LIMITATION OF ABSTRACT
UU
Prescribed by ANSI Std. Z39.18Standard Form 298 (Rev. 8-98)
3. DATES COVERED (From - To)
5b. GRANT NUMBER
5c. PROGRAM ELEMENT NUMBER
5d. PROJECT NUMBER
5e. TASK NUMBER
5f. WORK UNIT NUMBER
537-08-23-21
11. SPONSOR/MONITOR'S REPORT NUMBER(S)
NASA/TP-2002-211943
16. SECURITY CLASSIFICATION OF:
The public reporting burden for this collection of information is estimated to average 1 hour per response, including the time for reviewing instructions, searching existing data sources, gathering and maintaining the data needed, and completing and reviewing the collection of information. Send comments regarding this burden estimate or any other aspect of this collection of information, including suggestions for reducing this burden, to Department of Defense, Washington Headquarters Services, Directorate for Information Operations and Reports (0704-0188), 1215 Jefferson Davis Highway, Suite 1204, Arlington, VA 22202-4302. Respondents should be aware that notwithstanding any other provision of law, no person shall be subject to any penalty for failing to comply with a collection of information if it does not display a currently valid OMB control number.PLEASE DO NOT RETURN YOUR FORM TO THE ABOVE ADDRESS.


