
CONSTRUCTION HANDBOOK SERIES:
APPLICATION OF MICROSOFT PROJECT 2013/2016 IN
CONSTRUCTION PROJECT- AN INTRODUCTION
SITI KHALIJAH YAMAN. HAIRUDDIN MOHAMMAD.
EMEDYA MURNIWATY SAMSUDIN. RIDUAN YUNUS.
SEPTEMBER 2021

TABLE OF CONTENTS 1. INTRODUCTION TO CONSTRUCTION PROJECT PLANNING AND SCHEDULING 3 1.1 CONSTRUCTION PROJECT MANAGEMENT CONCEPT 3 1.2 CONSTRUCTION PROJECT LIFE CYCLE 5 1.3 CONSTRUCTION PROJECT PLANNING AND SCHEDULING 10 1.3.1 WORK PROGRAMME DEVELOPMENT 10 1.3.2 THE GENERAL METHOD USED IN PLANNING AND SCHEDULING 11
2 CREATING A NEW PROJECT IN MICROSOFT PROJECT 2013/2016 13 2.1 INTRODUCTION TO MICROSOFT PROJECT 13 2.2 STARTING THE NEW PROJECT 14 2.3 BASIC TERMINOLOGY IN PLANNING AND SCHEDULING 15
3 MANAGING TASKS/ACTIVITIES IN MICROSOFT PROJECT 19 3.1 IDENTIFYING THE SCOPE OF WORK IN PROJECT 19 3.1.1 ENTERING TASK NAME 23 3.1.2 CREATING A MILESTONE 23 3.1.3 RECURRING TASK 24 3.1.4 CREATING A WBS 26 3.1.5 SETTING WORKING TIME 28 3.1.6 ENTERING A PUBLIC HOLIDAY/ EXCEPTION 30 3.1.7 SETTING DEPENDENCIES IN THE PROJECT PLANNING (LINKING TASK) 31
4 MANAGING RESOURCES IN MICROSOFT PROJECT 33 4.1 SETTING UP RESOURCES 33 4.1.1 ASSIGNING A RESOURCES TO TASK/ ACTIVITY 34 4.2 ESTIMATION OF ACTIVITY DURATION 37 4.2.1 HISTORICAL DATA 37 4.2.2 ENTERING A DURATION 39 4.3 CRITICAL PATH METHOD (CPM) 40
5 FINALISING A PROJECT 44 5.1 SETTING UP PROJECT DEADLINE 44 5.1.1 SET UP DEADLINE 44 5.1.2 AUTO-SCHEDULE TASK 45 5.2 SCHEDULE COMPRESSION 47 5.3 ASSIGNING COST TO TASK 52 5.4 SAVE A PROJECT BASELINE 54 5.5 DEVELOPING A FINANCIAL S-CURVE 54 5.5.1 DEVELOPING A PHYSICAL AND FINANCIAL S-CURVE 57 5.6 CREATING A PROJECT REPORT 63 5.7 EXERCISE 66 5.8 REFERENCES 67

| Page | 3
1. INTRODUCTION TO CONSTRUCTION PROJECT PLANNING
AND SCHEDULING
LEARNING OUTCOMES
At the end of this topic, students should be able to:
1. Understand the concept of construction project management. (C1)
2. Explain the method used in planning and scheduling. (C2)
INTRODUCTION
1.1 Construction Project Management Concept
The concept of Construction Project Management (CPM) borrows the generic concept of
management, which comes as early as 5000BC, where the Sumerians kept written records
using papers made of papyrus. Later, the idea spawned throughout vast realms, including
the realm of construction.
By referring to a general construction project, management can be seen through
organisational context, where there are many people involved. Most of the time, they were
from different backgrounds who were intentionally working together to achieve common
objectives.
Besides that, several other things need to be managed, such as money, materials, time and
machines. A big construction project uses many resources and may lead to a chaotic
situation throughout the entire project duration. Thus, construction project management
comes in handy to integrate all manageable items and transform them into an end solid
product.
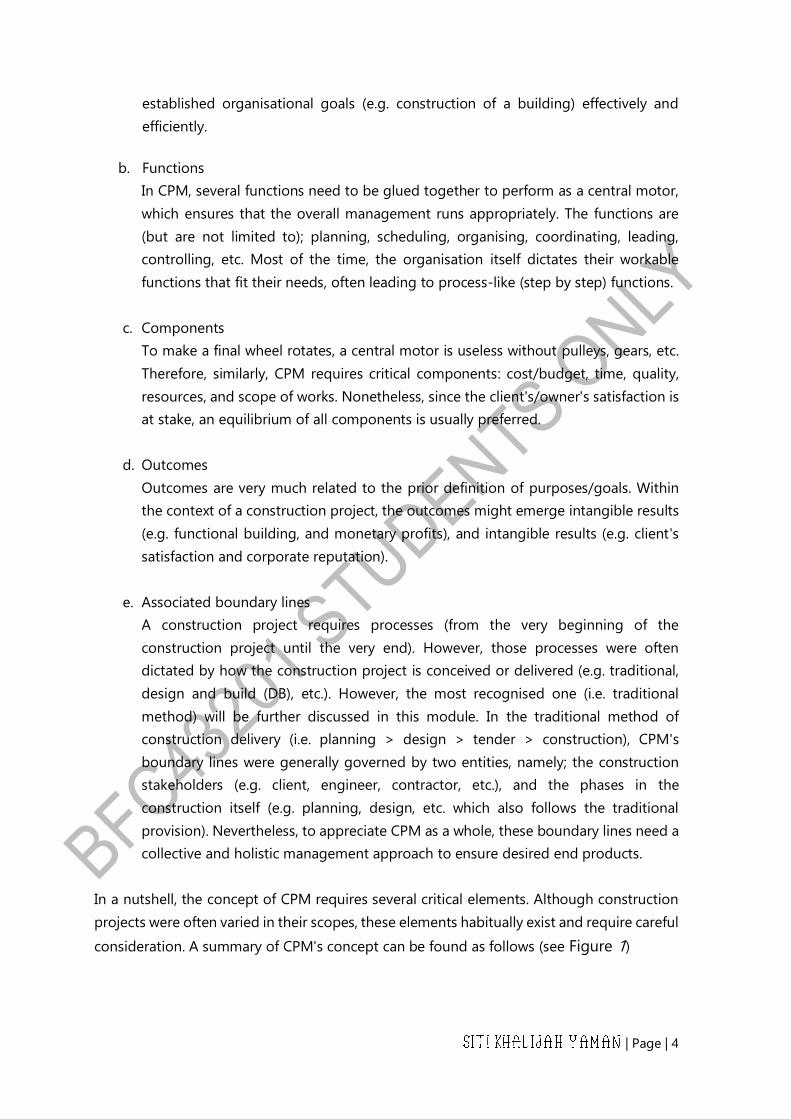
There are several critical elements while discussing CPM: their purposes/goals, functions,
components, outcomes, and associated boundary lines. These elements are critical since
every construction project is somewhat different from each other. Thus it might constitute
a different management approach (e.g. construction of bungalow vs construction of multi-
storey complex). However, in this module, only general discussions on critical elements of
CPM will be outlined, as follows:
a. Purposes/Goals
This element is the first and foremost in CPM, where different parties (e.g. client,
contractor, etc.) might come out with different purposes/goals, thus paved different
ways in appreciating CPM as a whole. Nevertheless, in general, this element
| Page | 4
established organisational goals (e.g. construction of a building) effectively and
efficiently.
b. Functions
In CPM, several functions need to be glued together to perform as a central motor,
which ensures that the overall management runs appropriately. The functions are
(but are not limited to); planning, scheduling, organising, coordinating, leading,
controlling, etc. Most of the time, the organisation itself dictates their workable
functions that fit their needs, often leading to process-like (step by step) functions.
c. Components
To make a final wheel rotates, a central motor is useless without pulleys, gears, etc.
Therefore, similarly, CPM requires critical components: cost/budget, time, quality,
resources, and scope of works. Nonetheless, since the client's/owner's satisfaction is
at stake, an equilibrium of all components is usually preferred.
d. Outcomes
Outcomes are very much related to the prior definition of purposes/goals. Within
the context of a construction project, the outcomes might emerge intangible results
(e.g. functional building, and monetary profits), and intangible results (e.g. client's
satisfaction and corporate reputation).
e. Associated boundary lines
A construction project requires processes (from the very beginning of the
construction project until the very end). However, those processes were often
dictated by how the construction project is conceived or delivered (e.g. traditional,
design and build (DB), etc.). However, the most recognised one (i.e. traditional
method) will be further discussed in this module. In the traditional method of
construction delivery (i.e. planning > design > tender > construction), CPM's
boundary lines were generally governed by two entities, namely; the construction
stakeholders (e.g. client, engineer, contractor, etc.), and the phases in the
construction itself (e.g. planning, design, etc. which also follows the traditional
provision). Nevertheless, to appreciate CPM as a whole, these boundary lines need a
collective and holistic management approach to ensure desired end products.
In a nutshell, the concept of CPM requires several critical elements. Although construction
projects were often varied in their scopes, these elements habitually exist and require careful
consideration. A summary of CPM's concept can be found as follows (see Figure 1)
| Page | 5
Figure 1: Diagram of Overall Concept of CPM
1.2 Construction Project Life Cycle
Construction project life cycle (CPLC) is very much related to the concept of CPM and how
ones conceived the delivery method of the particular construction project. Given that this
module concentrated on traditional delivery method, hence the following discussion will
touch on their provisions thoroughly.
Every construction project was basically governed by a set of rules and regulations,
documented into a single contract document. In the document, aside from protecting the
| Page | 6
stakeholders' objectives, the document outlays a definite start and end date of construction
(which somehow lends some support for CPLC). But bear in mind that actually, the initiation
towards that particular contract document requires several prior processes, which eventually
falls into the overall construction project life cycle.
Before further discussions were made, a thing to be cleared is the term used while discussing
the life cycle. In several references, CPLC is called construction project phases (CPP). Either
way, their deliberations is still the same. Therefore, by removing the semantic inquiry in this
module, both terms might be used interchangeably.
Firstly, without taking into account the types of construction delivery methods, CPLC for
some others consists of only several phases (in series), namely, planning, design, tender, and
construction. However, as far as the traditional delivery method is concerned, there are
several distinct phases were added, as follows (in series):
Idea (client put their intention for construction)
Conceptual design (architect draws the client's idea)
Approval of conceptual design (client agreed with the architectural drawing)
Preliminary & final design (engineers completes their activities)
Bid package complete (quantity surveyors completes their activities)
The decision to release for bid (tendering process)
Advertise notice to bidders (tendering process, where contractor starts to involve)
Bid period & receipt of proposals (tendering process)
Select contractor (selection process)
Notice to proceed (selected contractor are given permission)
Construction period (physical construction commenced)
Inspection & acceptance of project (handing over process)
Those phases were obviously championed by certain groups of construction stakeholders
(which is consistent with entity description in Chapter 1.1.e). Nevertheless, given that CPM
is embedded throughout CPLC, a breakdown of its nature of management approach is of
utmost significance.
As can be seen in most literature, CPM can be divided into several interconnected clusters,
namely, construction project management (CPM), construction management (CM), and site
management (SM). These clusters were also called phases in some literature. However,
consistent with the entity description (as in Chapter 1.1.e), understandably, CPM, CM, or
even SM requires a person to oversee their clusters. For instance, CPM needs a capable
project manager, while CM requires a good construction manager, whereas SM demands a
skilful site manager. Theoretically, these persons are a fraction of construction stakeholders
with the competency specifically for their clusters.
| Page | 7
Therefore, to visualise the CPLC in a richer context, the following diagram may do justice
(see Figure 2). Though, a slight discrepancy can be seen in the figure, especially on the
tender's phase. Due to the fact that CM recognised the construction manager as a key
person who often represents the contractor, therefore CM's phase starts during the bidding
period where contractors' earliest appearance can be seen (as in the traditional delivery
method). Other than that, off-site and on-site segregation is very much self-explanatory.
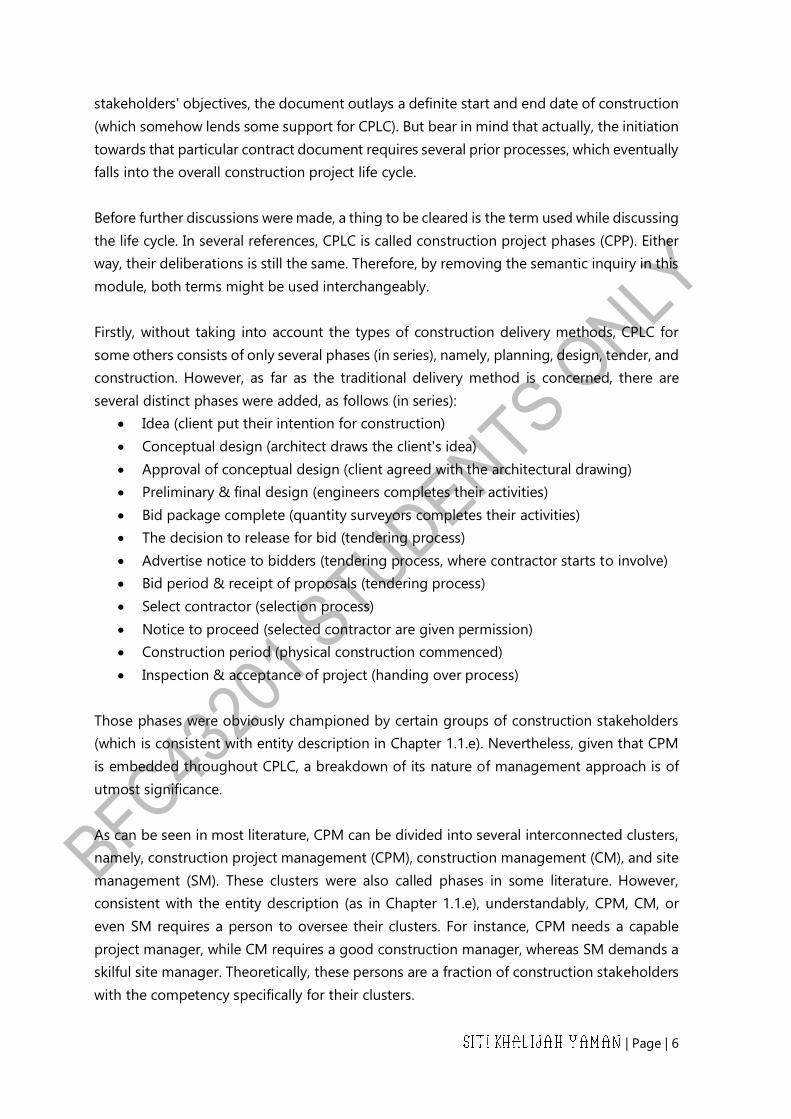
Finally, the aforementioned multiple perspectives were given towards appreciation of CPLC
in a much modest direction. Ones can view them in micro perspective (e.g. idea > conceptual
design > final design > etc.), or in macro perspective (e.g. planning > design > tender >
etc.), or even through the viewpoint of CPM itself (i.e. CPM > CM > SM). Since there is a
definite endpoint for every construction project (as stated in the construction contract
document), thus generally, CPLC will conclude during handing over period (i.e. inspection
and acceptance). Nonetheless, as far as the lifetime of the functional building is concerned,
the following figure (see Figure 3) would suffice to give an overview, especially on the
difference of management clusters.

| Page | 8
Figure 2: The overall CPLC in traditional construction delivery method
Planning Design Tender Construction
Off-site On-site

| Page | 9
Construction project management
Construction management
Site management
Maintenance/facility management
Defect liability
period
management
Project’s
handing over
End of
building life
Figure 3: The overall phase of building lifecycle

| Page | 10
1.3 Construction Project Planning and Scheduling
Project planning, scheduling, monitoring and controlling is a basic process in project
management. The objectives of project management are:
a. To eliminate or reduce project risk
b. Obtain a thorough understanding of project objectives/milestones
c. Formulate a strategy for achieving objectives with available resources
d. Develop a framework for monitoring and controlling the project.
1.3.1 Work Programme Development
A work programme can be described as a sequence of activities to be carried out so that
the construction project can be completed on time. Work programme usually consists of
dates and duration for each activity, a critical path, activity which can only be carried out
after other activities have been completed, activity which can be carried out simultaneously,
float and the need for specific resources. An effective programme must be used to help plan
activities, monitor progress and identify where additional resources may be required.
Work programmes can be prepared for different purposes. It depends on the parties
represent and the phase of CPLC. For the client's work programme, activities include the
overall phase of CPLC, which is important for the appointment of consultant, information
for work outside the contract, the duration for the whole construction project, financial
planning, value proposal by contractor, and instruction of work.
While contractor work programme can be divided into two stages for the construction
phase and the site phase. In the construction stage, the contractor used the work
programme to understand the contract, evaluate risk, decide on construction method and
pricing the tender, and estimate the resources needed to complete the work. The work
programme develops in the construction stage, usually called as Master Work Programme.
In the site phase, the contractor prepares a work programme for detailed planning of
activities involved at the site phase regarding the item in the contract document. The
contractor should commit to the planning activities in a work programme to ensure the
construction project can be completed within the time frame given.
In developing a work programme for planning and scheduling, a few strategies steps should
be considered.
a. Persuade people to perform activities on time
b. Involve people responsible in operations as the plan developed
c. Flexible and not impose excessive restraint
d. The plan must precipitate action and be made available in advance

| Page | 11
e. Distinguish between facts and assumptions.
A process for the development of a work programme is shown in Figure 4.
Figure 4: Process of work programme development
1.3.2 The general method used in planning and scheduling
Gantt Chart
Henry Gantt developed Gantt Chart in 1917. Gantt Chart is a list of activities displayed on a
time scale. Each activity is represented by a bar. The position and length of the bar reflect
the start date, duration and end date of the activity. Gantt Chart represents:
a. The list of activities
b. Start and end date of each activity
c. The duration of each activity
d. The overlapping activities with its duration
e. The start and completion date of projects.
Figure 5: Example of Gantt Chart
Critical Path Method (CPM)
Critical Path Method (CPM) is one of the useful techniques in construction project
scheduling. The basis of CPM is a logic diagram or network which represent the activities in
a construction project. CPM is a method to determine the start and finish date for each
activity, calculate the project's duration, and identify the critical activities in the project.
Identify
Activities
Estimate
Activity
Duration
Develop
Activity
Sequence
Contract
Programme

| Page | 12
There are two methods for representing a logic diagram or network: Precedence Diagram
Method (PDM) and Arrow Diagram Method (ADM). Either of these diagrams can be used,
but PDM offers greater ease of use and understanding with a greater capacity to represent
a wide variety of project situations. PDM consist of activity nodes and relationship arrows,
as shown in Figure 6.
Figure 6: Example of PDM

| Page | 13
2 CREATING A NEW PROJECT IN MICROSOFT PROJECT
2013/2016
2.1 Introduction to Microsoft Project
A Microsoft Project can be open from a Windows Start menu or Project 2013/2016 icon.
Project 2013/2016 initially display the start screen for Project 2013/2016, as shown in Figure
7. Here you can choose template suggested or blank project for your template. By selecting
a Blank Project, it creates the new plan in Project interface Figure 8.
Figure 7: Microsoft Project
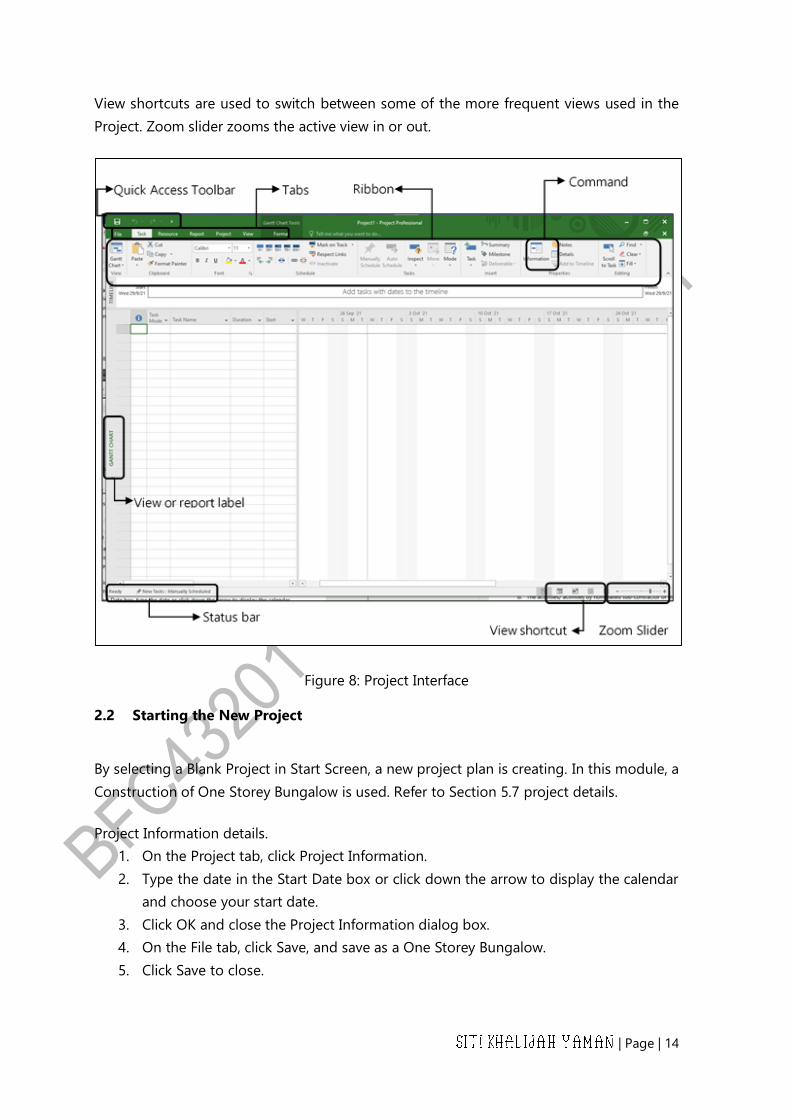
The Quick Access Toolbar is a customisable are interface where frequently used commands
can be added.
Tabs and active ribbon are replacing the pull-down menus and toolbar. The ribbon contains
commands used to control the project.
Groups are a collection of related commands.
Commands are the specified features use to control the Project. Each ribbon contains several
commands following its function.
The active view appears in the main window of the Project.
The view or report label shows the name of the active view for the Project. Microsoft Project
has a lot of views.
| Page | 14
View shortcuts are used to switch between some of the more frequent views used in the
Project. Zoom slider zooms the active view in or out.
Figure 8: Project Interface
2.2 Starting the New Project
By selecting a Blank Project in Start Screen, a new project plan is creating. In this module, a
Construction of One Storey Bungalow is used. Refer to Section 5.7 project details.
Project Information details.
1. On the Project tab, click Project Information.
2. Type the date in the Start Date box or click down the arrow to display the calendar
and choose your start date.
3. Click OK and close the Project Information dialog box.
4. On the File tab, click Save, and save as a One Storey Bungalow.
5. Click Save to close.

| Page | 15
Figure 9: Project Information Dialog Box
As discussed in Sub Chapter 1.3, project planning is the early stage in construction project
management. At the beginning of a construction project, planning needs to be done by
determining the project's scope, defining milestones of the project and developing a work
breakdown structure (WBS).
2.3 Basic terminology in planning and scheduling
Before further application in Microsoft Project, it is best to understand some basic
terminology involves in project planning and scheduling.
Activity: the performance of activities required to complete the project. An activity requires
time, cost, or both.
Activity relationship/ dependencies: An ordered link between 2 activities representing the
order of execution. Four types of relationships are:
a. Finish to Start (FS): The finish date of the predecessor activities determines the start
date of the successor activities.
b. Start to Start (SS): The start date of the predecessor activities determines the start
date of the successor activities.
c. Finish to Finish (FF): The finish date of the predecessor activities determines the finish
date of successor activities.
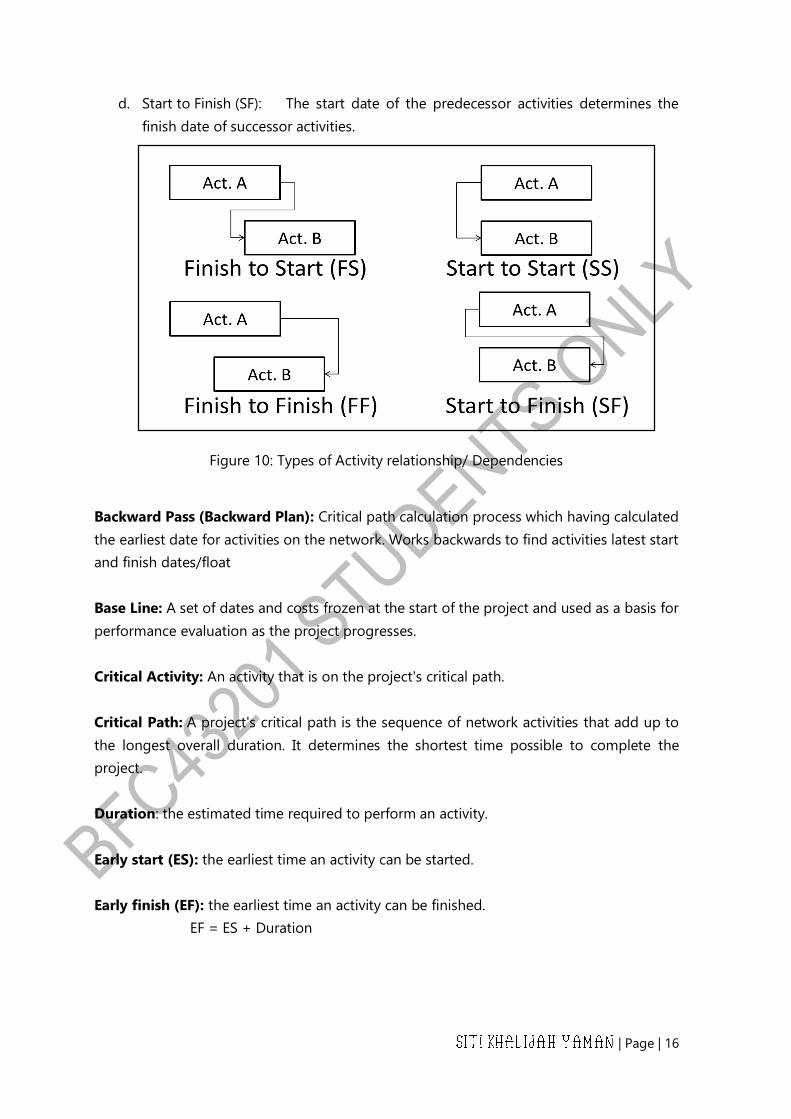
| Page | 16
d. Start to Finish (SF): The start date of the predecessor activities determines the
finish date of successor activities.
Figure 10: Types of Activity relationship/ Dependencies
Backward Pass (Backward Plan): Critical path calculation process which having calculated
the earliest date for activities on the network. Works backwards to find activities latest start
and finish dates/float
Base Line: A set of dates and costs frozen at the start of the project and used as a basis for
performance evaluation as the project progresses.
Critical Activity: An activity that is on the project's critical path.
Critical Path: A project's critical path is the sequence of network activities that add up to
the longest overall duration. It determines the shortest time possible to complete the
project.
Duration: the estimated time required to perform an activity.
Early start (ES): the earliest time an activity can be started.
Early finish (EF): the earliest time an activity can be finished.
EF = ES + Duration
| Page | 17
Float: Float is the amount of time that activity in a project network can be delayed without
causing a delay to subsequent activities (free float) or the project completion date (total
float).
Free float (FF): the amount of time an activity may be delayed without delaying the early
start time of the immediately following activity.
FF (i) = ES (j) –EF (i);
i-preceding activity, j-following activity
Late finish (LF): the latest time an activity can be finished.
Late start (LS): the latest time an activity can be started without delaying the project's
completion date.
LS = LF – Duration
Lag: A scheduled delay on a logic link whereby a successor activity will be delayed with
respect to a predecessor activity
Lead: The amount of time a successor activity can be advanced with respect to a
predecessor activity. Often this is referred to a negative lag.
Network: a diagram to represent the relationship of activities to complete a project. The
network may be drawn as ADM or PDM.
Successor: an activity that cannot start until another activities finishes.
S-Curve: A display of cumulative costs, labour hours, or other quantities plotted against
time. The name derives from the S-like shape of the curve, flatter at the beginning and end
and steeper in the middle, which is typical of most projects. The beginning represents a
slow, deliberate, but accelerating start, while the end represents a deceleration as the work
runs out.
Total float (TF): the amount of time an activity may be delayed without delaying the
project's completion date.
TF = LF – ES – Duration
Predecessor: refers to one (or several) activities(s), that has (have) to be completed before
another activity starts.

| Page | 18
Figure 11: Total Float and Free Float

| Page | 19
3 MANAGING TASKS/ACTIVITIES IN MICROSOFT PROJECT
3.1 Identifying the scope of work in project
The Association for Project Management describes scope as 'The totality of outputs,
outcomes and benefits and the work required to produce them'. In a construction project,
the term 'Scope of Work' refers to the document contract prepared by the client. Scope of
work determines the boundary of work, limitation and function of the contractor in the
construction project. Thus, in this module, the scope of work is “Cadangan Membina dan
Menyiapkan Sebuah Banglo Satu Tingkat di atas Lot 1256, Mukim Peserai, Batu Pahat,
Johor”. For starting, key in the scope of work as the first task in the task name column, as
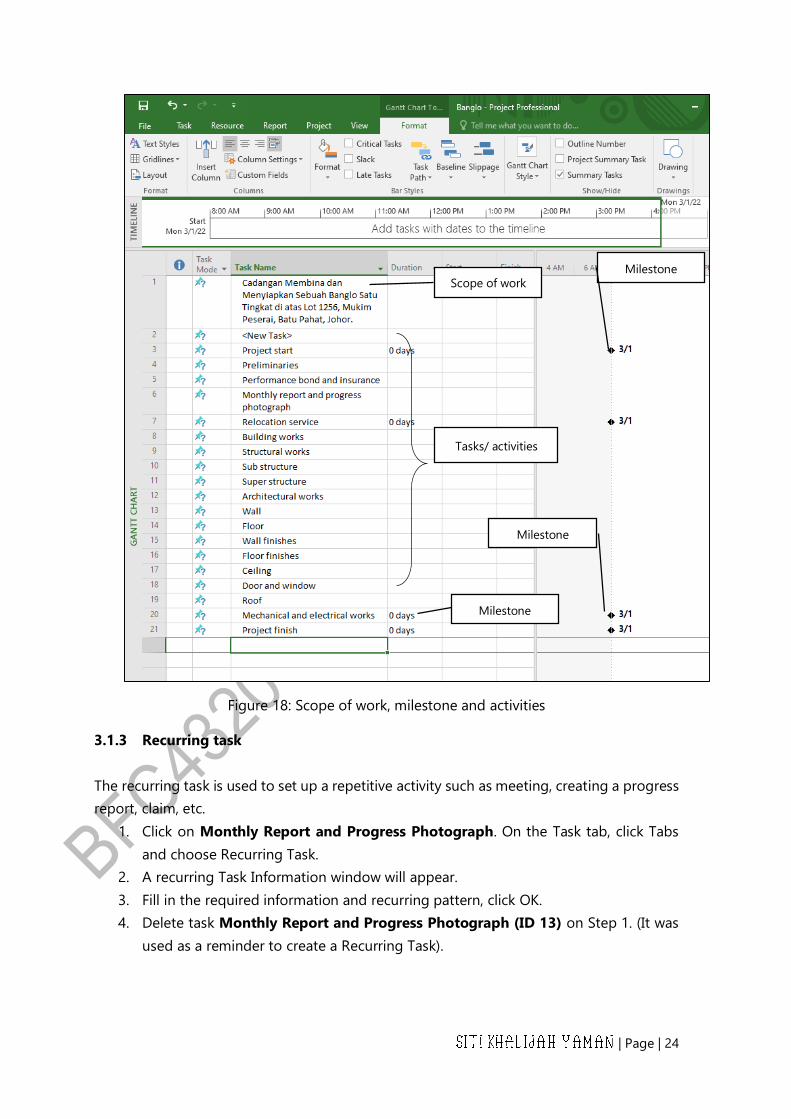
shown in Figure 12.
Figure 12: Scope of Work
While milestones are zero-day activities, they represent a variety of events in the project
schedule. It varies depends on the scope of the project. Milestone is used to marking
specific points in time along a project timeline. It is also used to represent an activity need
to be done by other parties as it is beyond the scope of work listed in the document contract.
Milestones do not impact project duration contracts. The common milestone for a
construction project is:
a. Start or completion of significant series of events in project.

| Page | 20
b. The activity/ activities by nominated sub-contractor or third parties.
c. Major turning point for project such as phased completion date or temporary
occupancy date.
Please note that for each project at least two (2) milestones are created, namely start and
finish. (Please identify the milestone in this exercise based on the list of activities given in
Section 5.7.
Project Management Body of Knowledge (PMBOK) defines the work breakdown structure
(WBS) as a "deliverable oriented hierarchical decomposition of the work to be executed by
the project team". WBS contains a list of activities that need to be done in completing a
construction project. The WBS visually defines the scope into a manageable item that a
project team can understand, as each level of the WBS provides further definition and detail.
Figure 13: Example of WBS for House Construction
In developing a WBS, identifying activities listed in WBS should consider the activities that
require time and cost. Besides that, activities that should be arranged and monitored must
also be listed in WBS activities. Other than that, few characteristics that should be considered
include;
a. Definable: can be described and easily understood by project participants.
b. Manageable: a meaningful unit of work where specific responsibility and authority
can be assigned to a responsible individual.
c. Able to estimate: duration can be estimated in time required to complete, and cost
can be estimated in resources needed to complete.
d. Independent: minimum interface with or dependence on other ongoing elements
(i.e., assignable to a single control account and distinguishable from other work
packages).
| Page | 21
e. Able for integration: integrates with other project work elements and with higher-
level cost estimates and schedules to include the entire project.
f. Measurable: can be used to measure progress; has start and completion dates and
measurable interim milestones.
g. Adaptable: sufficiently flexible so the addition/elimination of work scope can be
readily accommodated in the WBS framework.
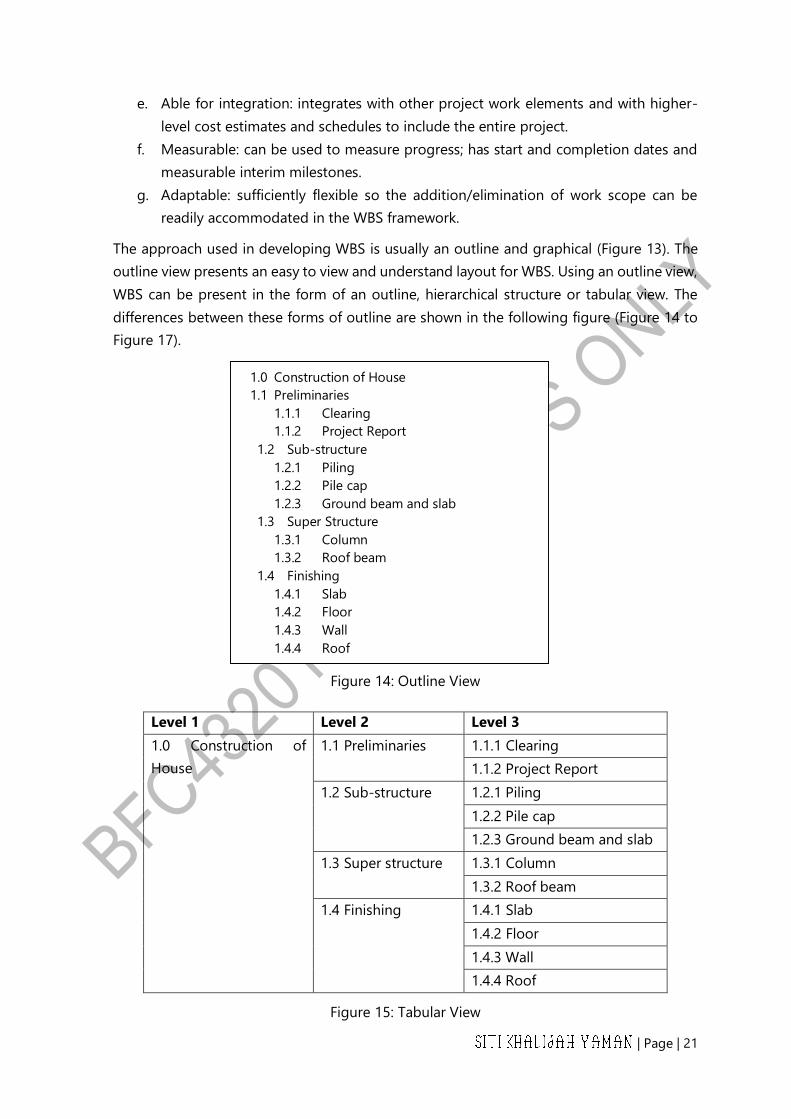
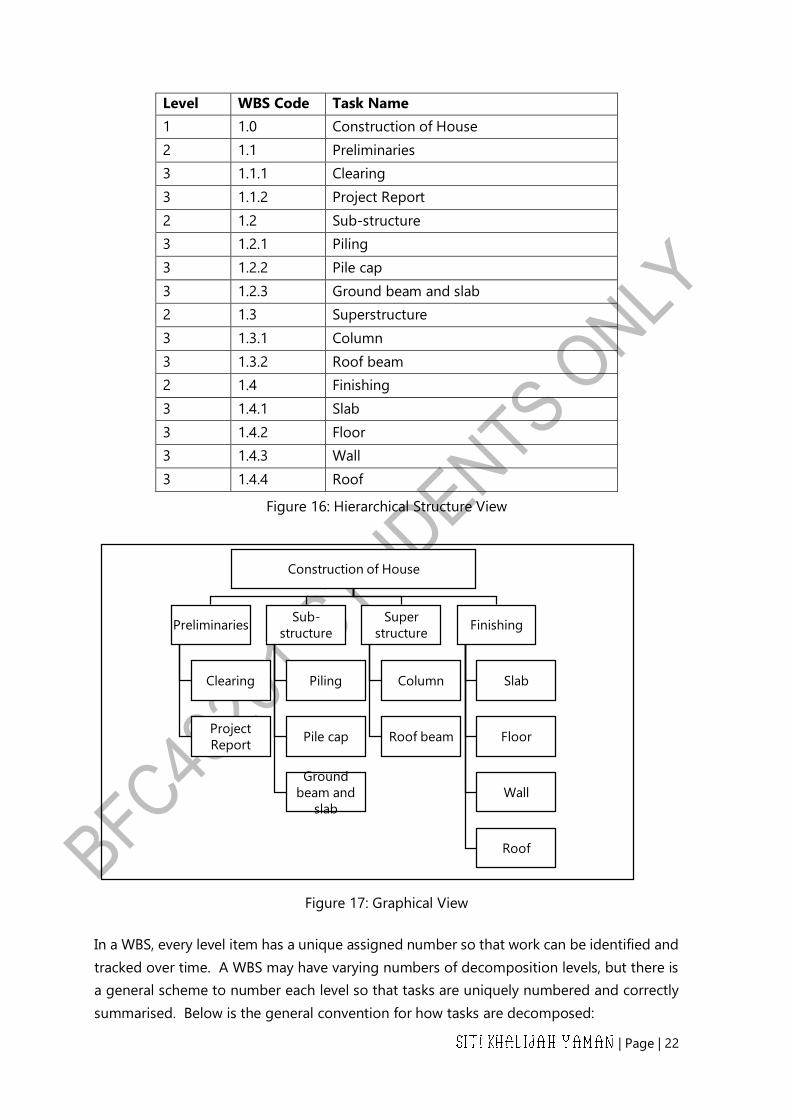
The approach used in developing WBS is usually an outline and graphical (Figure 13). The
outline view presents an easy to view and understand layout for WBS. Using an outline view,
WBS can be present in the form of an outline, hierarchical structure or tabular view. The
differences between these forms of outline are shown in the following figure (Figure 14 to
Figure 17).
Figure 14: Outline View
Figure 15: Tabular View
Level 1 Level 2 Level 3
1.0 Construction of
House
1.1 Preliminaries 1.1.1 Clearing
1.1.2 Project Report
1.2 Sub-structure 1.2.1 Piling
1.2.2 Pile cap
1.2.3 Ground beam and slab
1.3 Super structure 1.3.1 Column
1.3.2 Roof beam
1.4 Finishing 1.4.1 Slab
1.4.2 Floor
1.4.3 Wall
1.4.4 Roof
1.0 Construction of House
1.1 Preliminaries
1.1.1 Clearing
1.1.2 Project Report
1.2 Sub-structure
1.2.1 Piling
1.2.2 Pile cap
1.2.3 Ground beam and slab
1.3 Super Structure
1.3.1 Column
1.3.2 Roof beam
1.4 Finishing
1.4.1 Slab
1.4.2 Floor
1.4.3 Wall
1.4.4 Roof
| Page | 22
Figure 16: Hierarchical Structure View
Figure 17: Graphical View
In a WBS, every level item has a unique assigned number so that work can be identified and
tracked over time. A WBS may have varying numbers of decomposition levels, but there is
a general scheme to number each level so that tasks are uniquely numbered and correctly
summarised. Below is the general convention for how tasks are decomposed:
Construction of House
Preliminaries
Clearing
Project
Report
Sub-
structure
Piling
Pile cap
Ground
beam and
slab
Super
structure
Column
Roof beam
Finishing
Slab
Floor
Wall
Roof
Level WBS Code Task Name
1 1.0 Construction of House
2 1.1 Preliminaries
3 1.1.1 Clearing
3 1.1.2 Project Report
2 1.2 Sub-structure
3 1.2.1 Piling
3 1.2.2 Pile cap
3 1.2.3 Ground beam and slab
2 1.3 Superstructure
3 1.3.1 Column
3 1.3.2 Roof beam
2 1.4 Finishing
3 1.4.1 Slab
3 1.4.2 Floor
3 1.4.3 Wall
3 1.4.4 Roof
| Page | 23
Level 1: Designated by 1.0. This level is the top level of the WBS and is usually the project
name. All other levels are subordinate to this level.
Level 2: Designated by 1.X (e.g., 1.1, 1.2). This level is the summary level.
Level 3: Designated by 1.X.X (e.g., 1.1.1, 1.1.2). This third level comprises the subcomponents
to each level 2 summary element. This effort continues down until progressively subordinate
levels are assigned for all work required for the entire project.
Once WBS is being established, a resource needs to complete the activities, and a person
responsible for it can be identified. The list of individuals assigned to each activity in WBS
creates their responsibility in the organisation, thus providing an Organisational Breakdown
Structure (OBS) for the project. OBS is being used in a construction project in conjunction
with WBS. An OBS is helpful in resource management, the responsibility of resources, cost
by resources, visual references of resources and approval authority. The OBS reflects how a
construction project is functionally organised and how the organisation reflects each other.
As explain earlier, WBS contain all activities required to complete the project and milestone
indicate an event in the project. Therefore, list all activities and milestones for your exercise
in the "Task Column".
3.1.1 Entering Task Name
Entering Task Name
1. Click the cell below the Task Name column heading.
2. Type 'all activities and then press Enter key.
The task you entered is given an ID number. Each task has a unique ID number, but
it does not represent the order in which the task occurs.
3. Enter the other task names, pressing Enter after each task name.
3.1.2 Creating a Milestone
1. Add Task Name Project Start right after the Project Title and Project Finish at the end
of the task to create a milestone.
2. Other milestones are created for nominated sub-contractors or third parties work
(Mechanical and Electrical Works).
3. All duration for Milestone Activity is '0'.
| Page | 24
Figure 18: Scope of work, milestone and activities
3.1.3 Recurring task
The recurring task is used to set up a repetitive activity such as meeting, creating a progress
report, claim, etc.
1. Click on Monthly Report and Progress Photograph. On the Task tab, click Tabs
and choose Recurring Task.
2. A recurring Task Information window will appear.
3. Fill in the required information and recurring pattern, click OK.
4. Delete task Monthly Report and Progress Photograph (ID 13) on Step 1. (It was
used as a reminder to create a Recurring Task).
Scope of work Milestone
Milestone
Milestone
Tasks/ activities

| Page | 25
Delete this activity
Recurring task

| Page | 26
3.1.4 Creating a WBS
As said in Chapter 3.1, WBS contain a list of activities to complete the project. The main
activity is called a Summary Task, while others are sub task. To create a WBS in Microsoft
Project;
1. Select all sub-task (Task 2 to Task 19). On the Task tab, click Indent Task.

| Page | 27
2. The Title of Project (Cadangan Membina dan Menyiapkan Sebuah Banglo SAtu
Tingkat di atas Lot 1256, Mukim Peserai, Batu Pahat, Johor) is called as summary
task.
3. To add another summary task, repeat Step 1.
4. To view a WBS code for each level, insert a new column (choose WBS) on the left
side of the Task Name column.
The graphical view of WBS for this example is shown in Figure 19.
Summary task
Summary task
Sub tasks
| Page | 28
Figure 19: Graphical WBS for project example
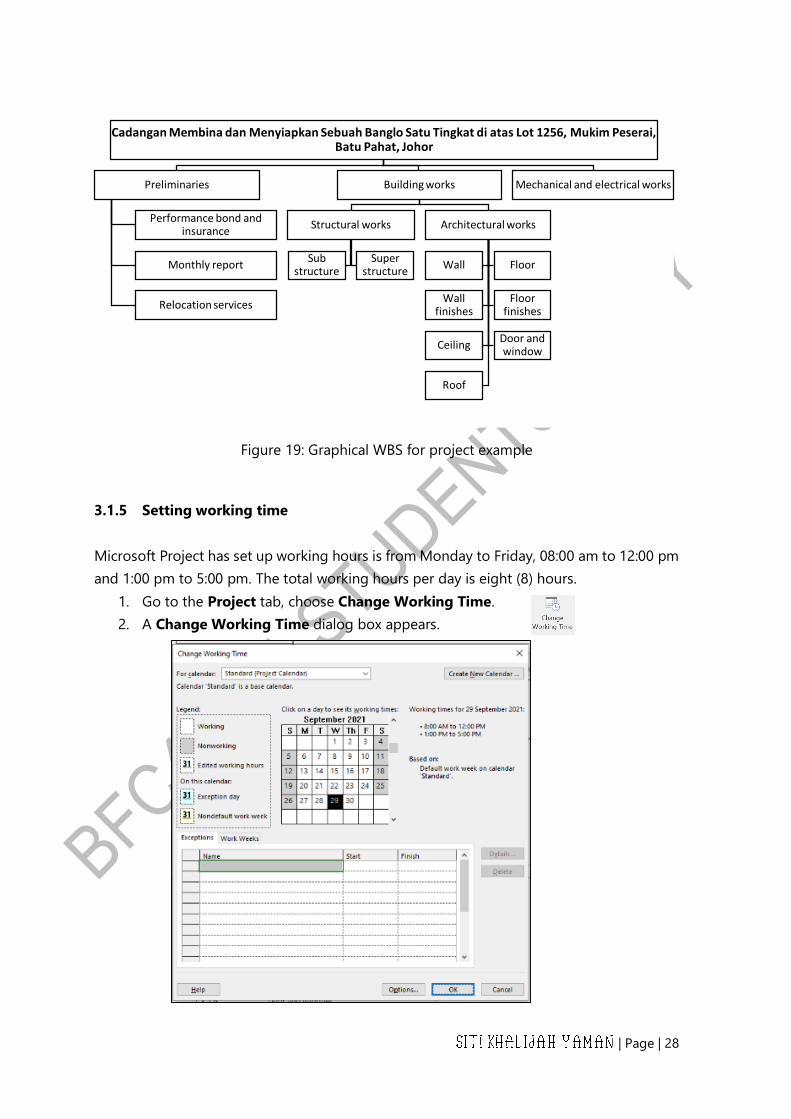
3.1.5 Setting working time
Microsoft Project has set up working hours is from Monday to Friday, 08:00 am to 12:00 pm
and 1:00 pm to 5:00 pm. The total working hours per day is eight (8) hours.
1. Go to the Project tab, choose Change Working Time.
2. A Change Working Time dialog box appears.
Cadangan Membina dan Menyiapkan Sebuah Banglo Satu Tingkat di atas Lot 1256, Mukim Peserai, Batu Pahat, Johor
Preliminaries
Performance bond and insurance
Monthly report
Relocation services
Building works
Structural works
Sub structure
Super structure
Architectural works
Wall Floor
Wall finishes
Floor finishes
CeilingDoor and window
Roof
Mechanical and electrical works
| Page | 29
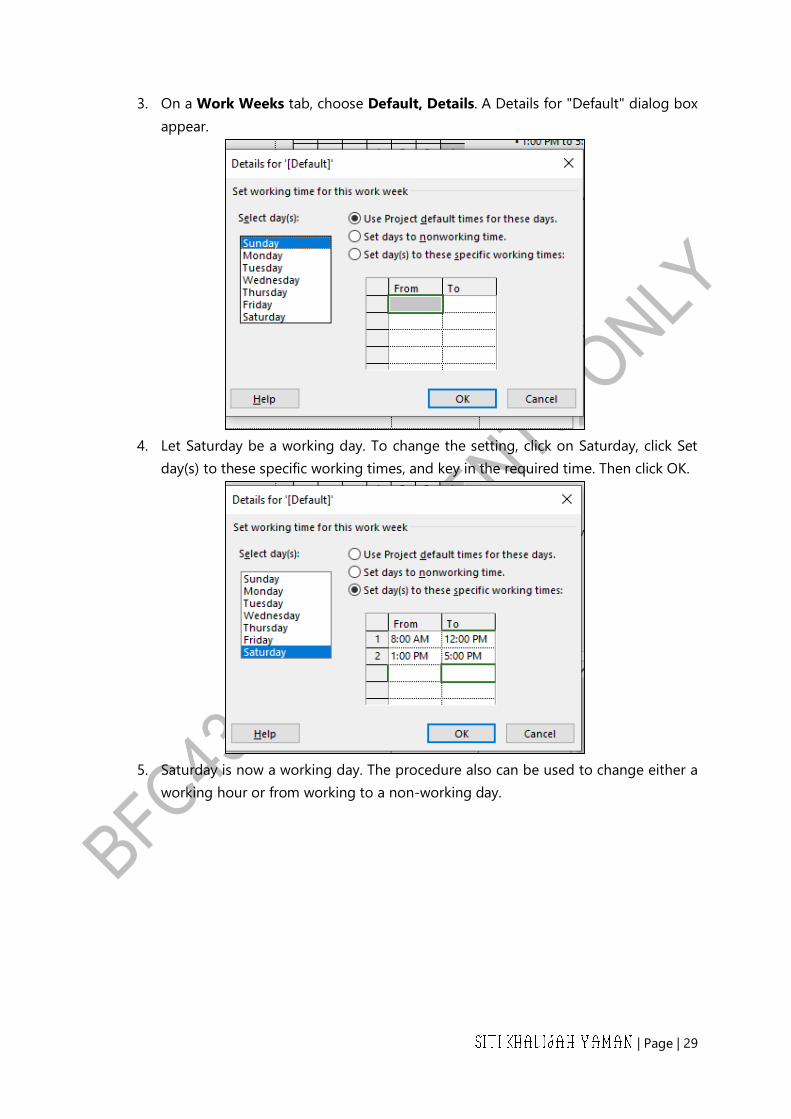
3. On a Work Weeks tab, choose Default, Details. A Details for "Default" dialog box
appear.
4. Let Saturday be a working day. To change the setting, click on Saturday, click Set
day(s) to these specific working times, and key in the required time. Then click OK.
5. Saturday is now a working day. The procedure also can be used to change either a
working hour or from working to a non-working day.

| Page | 30
3.1.6 Entering a Public Holiday/ Exception
1. Go to the Project tab, choose Change Working Time.
2. A Change Working Time dialog box appears.
3. On an Exception tab, key in all Exception day/ Public Holiday in the Name box.
Choose the Start and Finish Date for each exception.
4. Click OK.

| Page | 31
3.1.7 Setting dependencies in the project planning (linking task)
As discussed earlier in Sub Chapter 1.3, planning and scheduling is part of project
management. To this point, only the planning part is fulfilled. Next, in scheduling, the
determination of duration and sequence of activities will be done. The project schedule
should be detailed to show each WBS to be performed, the start and end date of each
activity, the relationship between activities, and the expected duration of each activity. In
construction project scheduling, methods available are Gantt Chart and Critical Path Method
(CPM).
There are several ways of creating dependencies in the Microsoft Project. Refer to Chapter
2.3.
1. Using a Link Task icon.
a. Select two dependencies task. On the Task tab, click Link Tasks.
2. Using Information icon.
a. On the Task Approval of Conceptual Design, in the Properties group, click
Information. Select the Predecessor tab.
b. Click the empty cell below the Task Name, click the down arrow.
c. On the Task Name list, choose a dependency task. Let the type to be Finish-to-
Start.
d. Click OK.
3. The link also can be created by using the Predecessor column.
a. Key in ID number for task to be link. A default setting will be a Finish-to-Start
relationship. If another type of relationship is required, use a short form to link
the task. Start-to-Start (SS), Finish-to-Finish (FF), Start-to-Finish (SF). If there is
lag or lead for each task, the relationship can be typed as SF+3d, FF+1d, SF-1d
or else depending on the type of relationship and number of lag/lead.
| Page | 32
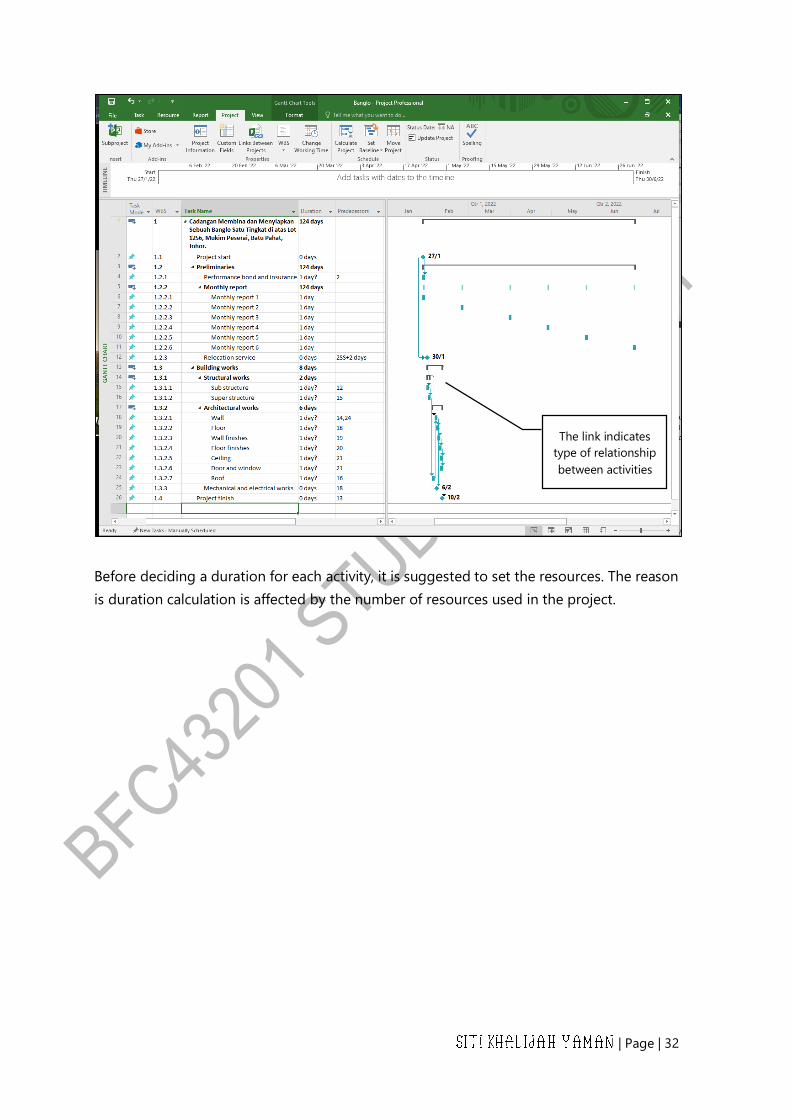
Before deciding a duration for each activity, it is suggested to set the resources. The reason
is duration calculation is affected by the number of resources used in the project.
The link indicates
type of relationship
between activities

| Page | 33
4 MANAGING RESOURCES IN MICROSOFT PROJECT
Work resources are the people and equipment that do the work of the project.
4.1 Setting up resources
For setting up the resources,
1. On the View tab, in the Resource Views group, click Resource Sheet.
The resource sheet is to enter the initial list of resources.
2. Click the cell below the Resource Name column heading.
3. Type Resource Name, and press the Enter key.
4. The project creates new resources.
You can create resources name by referring to specific people (name) or specific job titles
(bar bender, etc.). When you create a new work resource, Microsoft Project assigns it 100%
Max. Units by default. 100% Max. Units mean 100 per cent of that resources working time
is available to work on the assigned task. Entering a Max. Units such as 400% for such as
resources mean that you can expect that four (4) individual people who all belong to that
resource category will be available to work full-time every workday.
You can change the Max. Units as a whole number rather than a percentage.
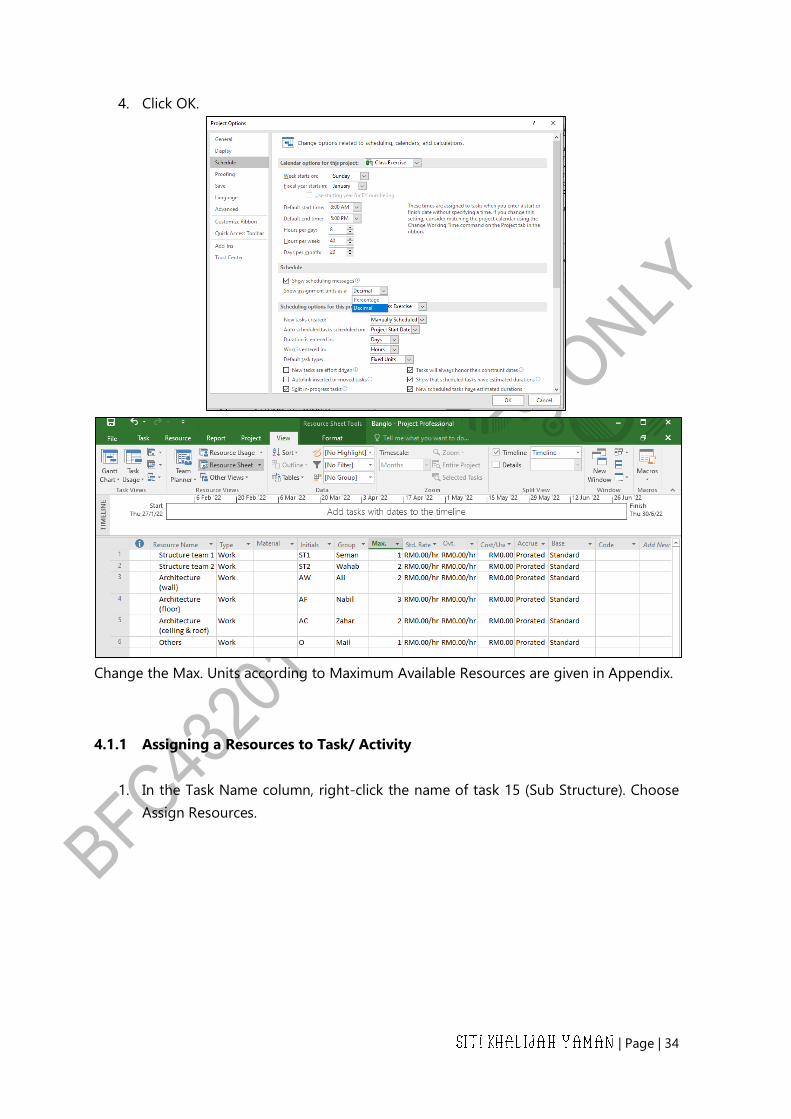
1. On the File tab, click Options.
2. In the Project Options dialog box, click the Schedule tab.
3. In the Show assignment units as a box, click Decimal.
| Page | 34
4. Click OK.
Change the Max. Units according to Maximum Available Resources are given in Appendix.
4.1.1 Assigning a Resources to Task/ Activity
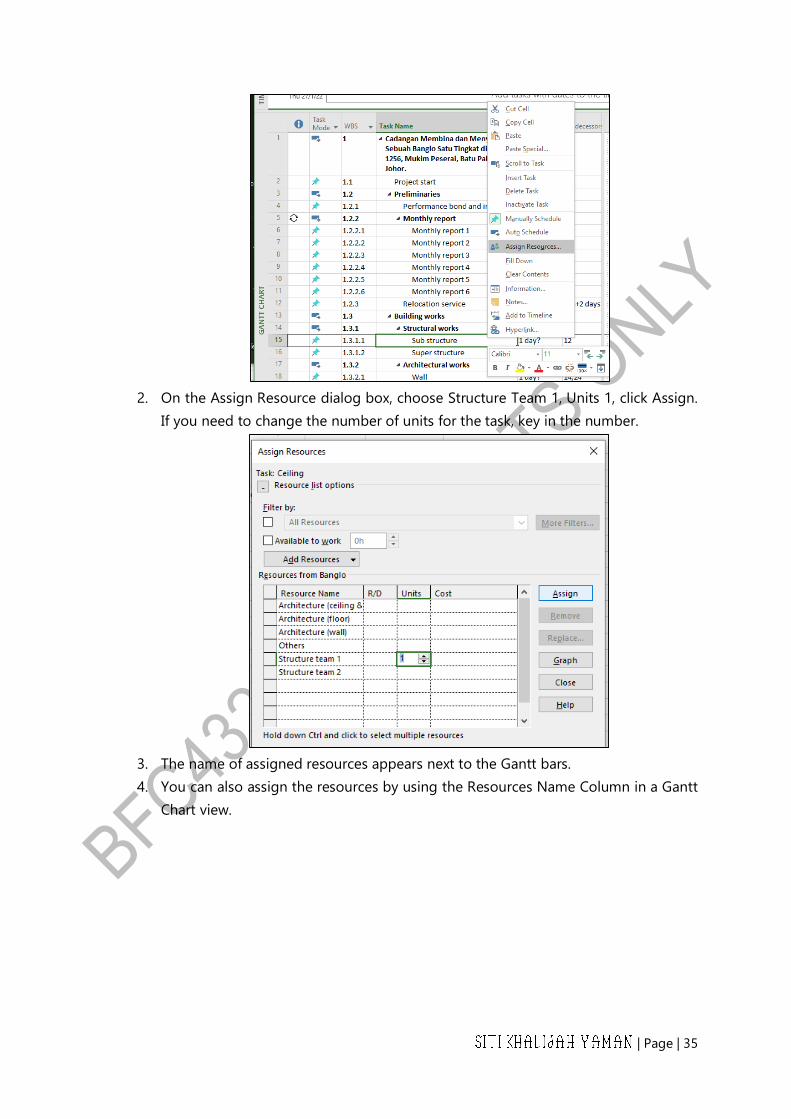
1. In the Task Name column, right-click the name of task 15 (Sub Structure). Choose
Assign Resources.
| Page | 35
2. On the Assign Resource dialog box, choose Structure Team 1, Units 1, click Assign.
If you need to change the number of units for the task, key in the number.
3. The name of assigned resources appears next to the Gantt bars.
4. You can also assign the resources by using the Resources Name Column in a Gantt
Chart view.
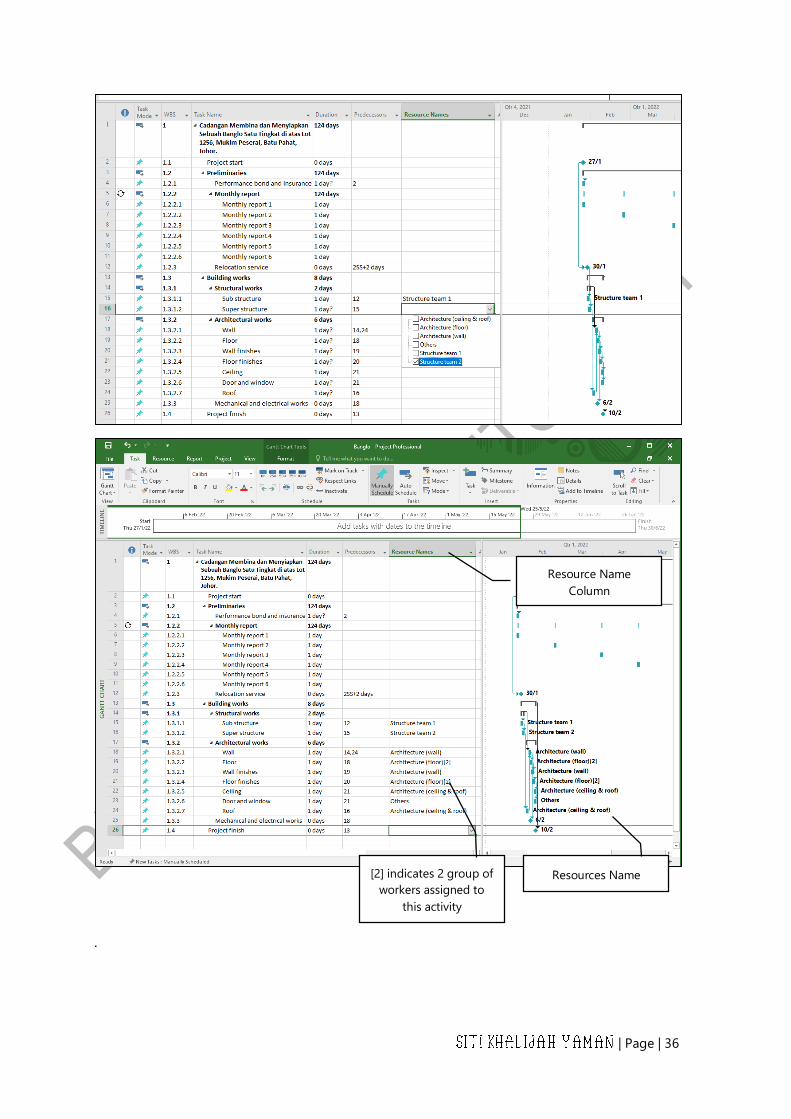
| Page | 36
.
Resource Name
Column
Resources Name [2] indicates 2 group of
workers assigned to
this activity

| Page | 37
4.2 Estimation of Activity Duration
Estimation of each activity duration is important to ensure the activity can be done with the
team member's capacity. Few methods can be used in estimating activity duration.
4.2.1 Historical data
Historical data is the easiest way in estimating activity duration. It is based on the similar
activity of the previous project, and the average duration required to complete the activities
is used in estimating duration.
4.2.1.1 Expert Judgment
Expert judgment is based on the specialist who has reputation and experience in estimating
the duration for each activity.
4.2.1.2 Production rate calculation
The calculation is made based on the quantity of work and productivity rate for each activity.
However, this method requires information on the productivity rate for the activity involved
in a construction project.
Resource Planning
Method Max. Available Resources Productivity rate
Structure team 1 1 12 m3/ day/ group
Structure team 2 2 8 m3/ day/ group
Architecture (wall) 2 20 m2/ day/ group
Architecture (floor) 3 15 m2/ day/ group
Architecture (ceiling & roof) 2 15 m2/ day/ group
Others 1 6 no/ day/ group
Duration = Quantity
Production rate

| Page | 38
Duration Estimation
Description Unit Quantity
Distribution of Resources
Risk Duration
(days) Type of
resources
Numbers
of groups
Structural works
Substructure m3 48 Structure team
1
1 +2 days 6
Superstructure m3 225 Structure team
2
1 +4 days 33
Architectural works
Wall m2 480 Architecture
(wall)
1 +10% 27
Floor m2 600 Architecture
(floor)
2 +15% 23
Wall finishes m2 480 Architecture
(wall)
1 +4 days 28
Floor finishes m2 600 Architecture
(floor)
2 + 4 days 24
Ceiling m2 500 Architecture
(ceiling & roof)
1 + 6 days 18
Door and window no 36 Others 1 + 2 days 8
Roof m2 120 Architecture
(ceiling & roof)
1 + 30% 11
Calculation example of determining duration:
a) Activity Substructure
Duration = Quantity = 48 m3 = 4 days
Productivity rate 1 group x 12 m3/ day/ group
Consider risk (+ 2 days), duration for sub structure is 4 days + 2 days (risk) = 6 days
b) Activity Floor
Duration = Quantity = 600 m2 = 20 days
Productivity rate 2 group x 15 m2/ day/ group
Consider risk (+ 15 %), duration for floor is 20 days + (15% x 20 days) = 23 days

| Page | 39
For entering the duration,
1. Click the cell below the Duration column, Type duration required, and then press
Enter.
You can also click the up and down arrows to enter or change the value in the
Duration field.
2. Project Draws a Gantt bar for the task.
4.2.2 Entering a duration
For entering the duration,
1. Click the cell below the Duration column, Type duration required, and then press
Enter.
You can also click the up and down arrows to enter or change the value in the
Duration field.
2. Project Draws a Gantt bar for the task.
Key in duration in
Duration column

| Page | 40
4.3 Critical Path Method (CPM)
Up to Chapter 4.2, the entered information are (i) task, (ii) working time, (iii) holiday/
exception, (iv) relationship between task, (v) resources, and (vi) duration. To manage the
project, the information on early start (ES), early finish (EF), late start (LS), late finish (LF),
total float (TF), free float (FF) and the duration of the project are required. The calculation
using the Critical Path Method (CPM) is a basis in Microsoft Project software. The purpose
is to determine total time to complete a project and the times each activity can start or must
start to ensure the project can be completed in a given time frame.
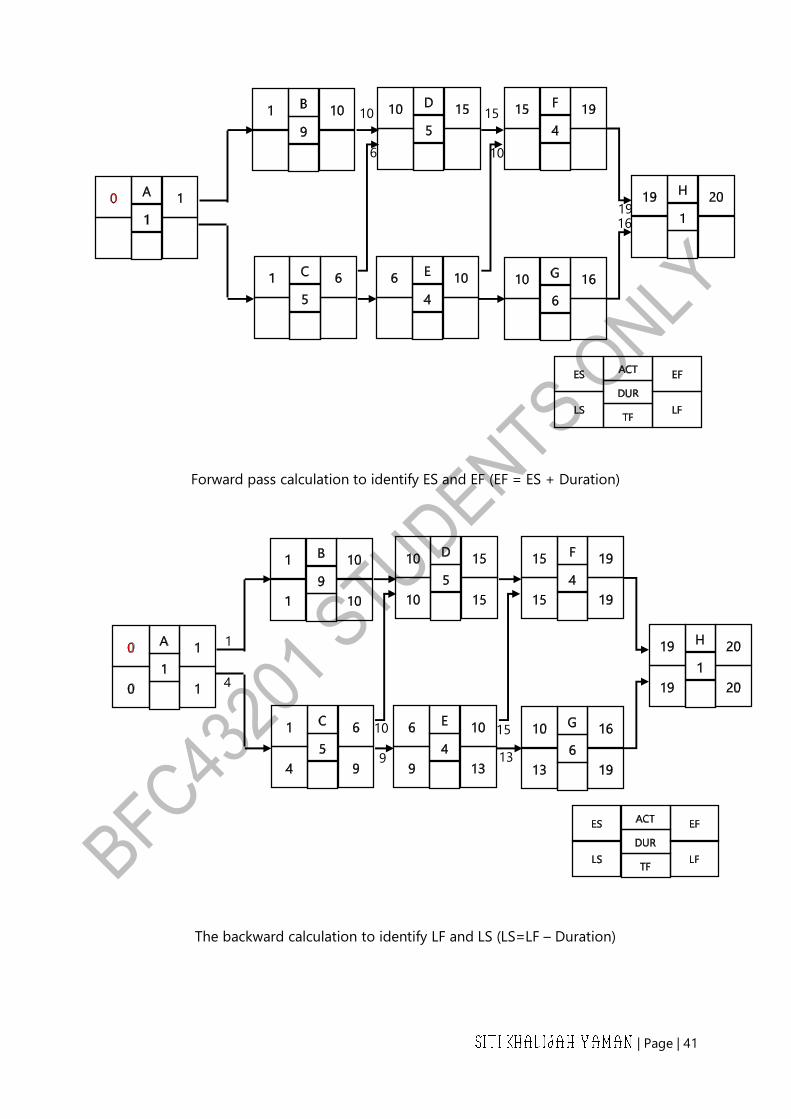
To illustrate the computations on the precedence diagram, a simple network is developed
based on the information in Table 1.
Table 1: List of Activity
Activity Duration (days) Predecessor(s)
A 1 -
B 9 A
C 5 A
D 5 B,C
E 4 C
F 4 D,E
G 6 E
H 1 F,G
Figure 20: PDM
| Page | 41
Forward pass calculation to identify ES and EF (EF = ES + Duration)
The backward calculation to identify LF and LS (LS=LF – Duration)
10
6
15
10
19 16
1
10
13
15
4
9
| Page | 42
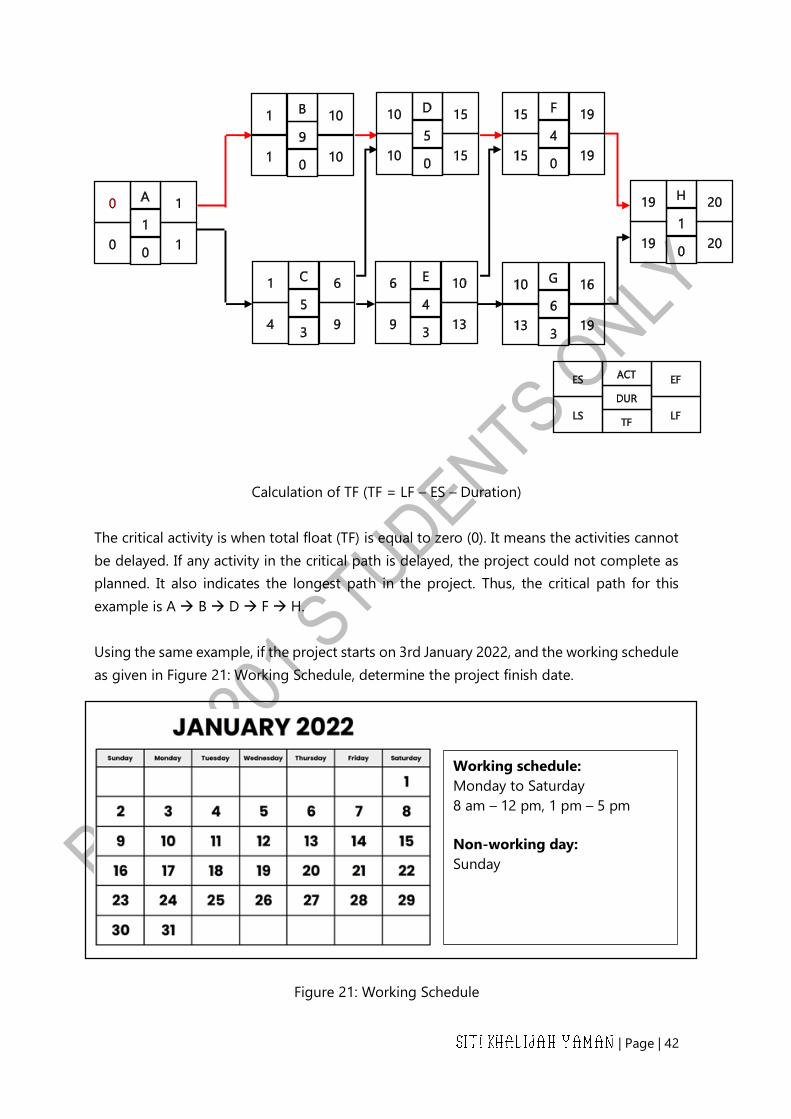
Calculation of TF (TF = LF – ES – Duration)
The critical activity is when total float (TF) is equal to zero (0). It means the activities cannot
be delayed. If any activity in the critical path is delayed, the project could not complete as
planned. It also indicates the longest path in the project. Thus, the critical path for this
example is A B D F H.
Using the same example, if the project starts on 3rd January 2022, and the working schedule
as given in Figure 21: Working Schedule, determine the project finish date.
Figure 21: Working Schedule
Working schedule:
Monday to Saturday
8 am – 12 pm, 1 pm – 5 pm
Non-working day:
Sunday
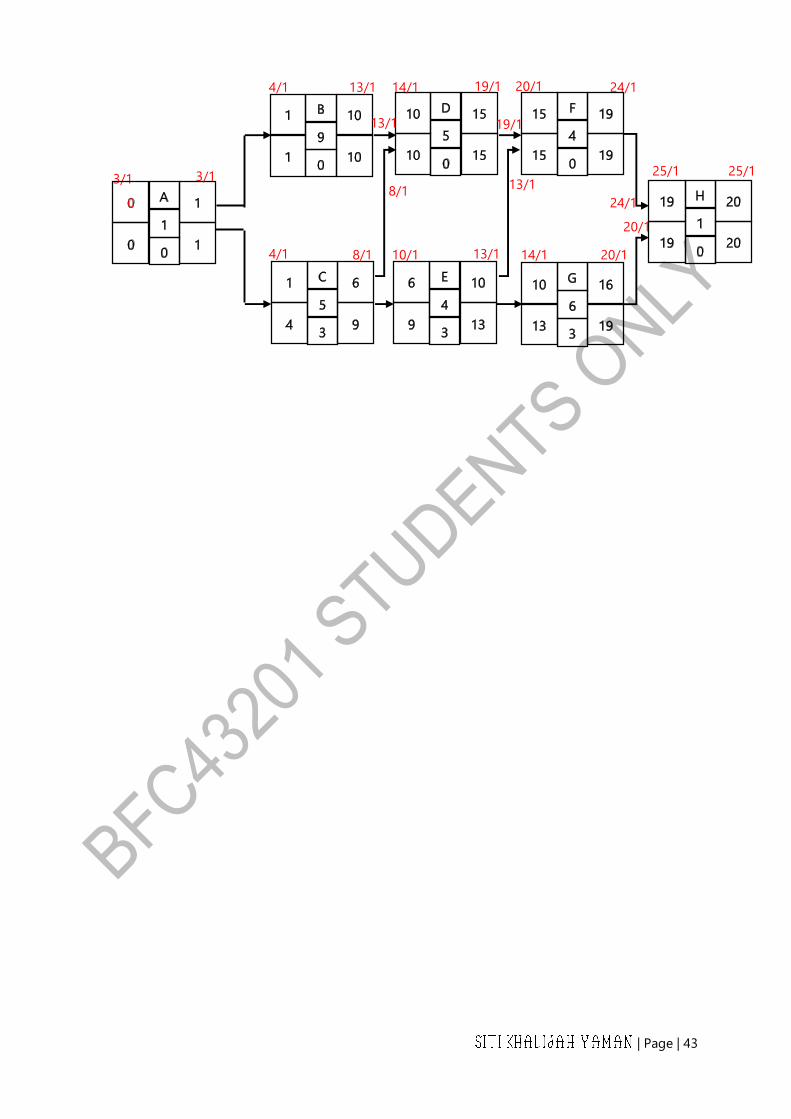
| Page | 43
3/1 3/1
4/1
4/1 8/1
13/1 14/1
13/1
8/1
19/1
10/1 13/1
20/1
19/1
13/1
24/1
14/1 20/1
24/1
20/1
25/1 25/1

| Page | 44
5 FINALISING A PROJECT
5.1 Setting up Project Deadline
The deadline was set in the contract, and it was agreed upon by the parties involved.
Meeting the deadlines and avoiding a delay is crucial. For that reason, Liquidated
Ascertained Damages (LAD) is imposed if the contractor fails to meet the deadline.
5.1.1 Set up Deadline
1. Go to Project Finish task. Right-click the mouse.
2. Click Information. On an Advance tab, Constraint task, Deadline. Choose a
Contract Finish Date. Then click OK.

| Page | 45
3. Green Arrow will appear at the Project Finish task to show the deadline of the project.
5.1.2 Auto-Schedule Task
To ensure the Microsoft Project automatically updates our project, all tasks should be in
"Auto Schedule" mode. The "Auto Schedule" function lets the Microsoft Project
automatically calculate the Start, Finish, and Duration values for this task based on
dependencies, constraints, calendar, and other factors. It calculates the values using CPM.
1. Highlight all activities by click the left corner column.
Deadline

| Page | 46
2. On the Task tab, choose Auto-Schedule. Then, the project will automatically
update.
3. To view a critical activity, on the Format tab, on the Bar Style, click Critical Tasks.
Click here

| Page | 47
4. All the critical activities will change colour to red.
5.2 Schedule Compression
In this exercise, you will find that the Finish Date exceeds Deadline for the project. To meet
the deadline, you have to apply schedule compression techniques.
Schedule compression shortens the project schedule without changing the scope to meet
schedule constraints, imposed dates, or other schedule objectives. Two techniques used in
schedule compression are CRASHING and FAST TRACKING. The other reason to compress
the schedule is:
a. The client wants to complete the project early
b. Opportunity to get other projects if project complete early
c. The contractor may have a monetary incentive to finish ahead of schedule
This step shows the importance of creating a duration calculation table (4.2.1.2). A technique
used in schedule compression is excellent when no extra cost is added. For this reason,
before applying fast-tracking techniques, we might consider reducing the RISK upon
calculating a duration before this.

| Page | 48
Example
Choose any critical activity that you think have a low risk.
Activity Production
rate/day
Number of
workers
group
Duration Risk
New
estimated
duration
(days)
Floor
finishes
m2 600 15 m2/ day/
group
2 20 days 4 days
(change to
2 days)
20 + 2 =
22 days
Ceiling m2 500 15 m2/ day/
group
1 12 days 6 days
(change to
3 days)
12 + 3 =
15 days
Then, change the duration for this activity in your project.
Further, we can apply fast tracking techniques. It is a technique to get back on schedule and
save time and effort by shortening the time it would otherwise take to complete a given
project. Fast Tracking in Microsoft Project can be determined by the use of lag/lead time.
Example:
Before Fast Track
After Fast Track
Brickwork
Electrical Wiring
-X days
Brickwork
Electrical Wiring

| Page | 49
Please identify the activity suitable to apply the Fast Tracking technique.
If there are no other activities suitable for fast-tracking and reducing the risk, you have to
consider adding resources by using crashing techniques. Crashing is a technique where
extra resources are added to the project to compress the schedule and decrease the total
project time duration by the least cost. However, it is limited to the maximum number of
workers for that activity.
Example:
Activity
Number
of
workers
group
Quantity Productivity rate Duration
Floor finishes 2 600 m2 15m2/group/day 22 days
After crashing;
Activity
Number
of
workers
group
Quantity Productivity rate Duration
Floor finishes 3 600 m2 15m2/group/day 16 days

| Page | 50
The duration is shortening with the increase in production rate.
To change the number of resources units, go to Task, right-click, and Task Information
dialog box will appear. Choose resources. Change the number of units.
The Duration for "Floor Finishes" will change to 14.67 days. The Microsoft Project does not
consider the risk as calculated before. So, change the duration to 16 days (Consider risk two
(2) days), and the warning will appear. Then choose, "Increase work but keep the hour's
resources work per day (units) the same.

| Page | 51
Now, the finish date is 30th June 2022 (before the project deadline).
As all the data (task, working schedule, dependent, constraint, resources) has been
confirmed and the project plan meets the deadline, change the performance bond and
insurance duration to (current duration for preliminaries – 1 day).
Note: the duration with ? means the duration is not confirmed.
Example: Current duration for Preliminaries is 144 days. So, the Performance bond
and insurance duration are 144 days – 1 day = 143 days. (The performance bond is
usually deducted during interim payments).
| Page | 52
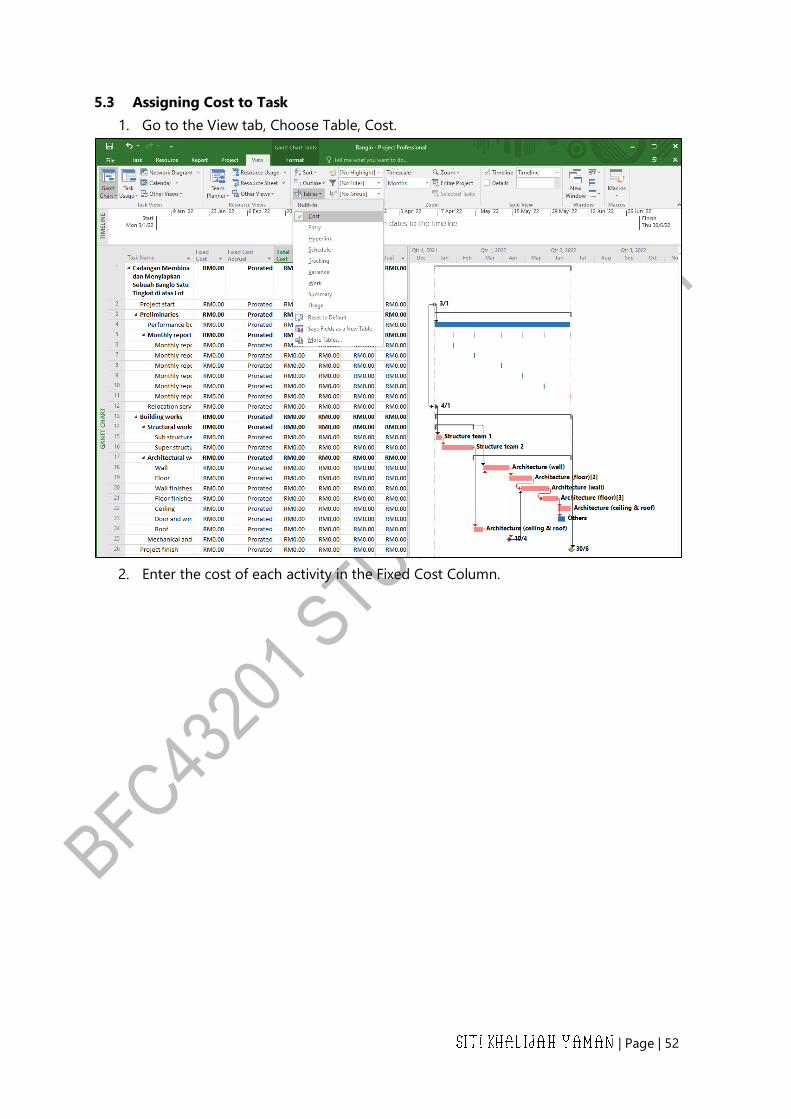
5.3 Assigning Cost to Task
1. Go to the View tab, Choose Table, Cost.
2. Enter the cost of each activity in the Fixed Cost Column.
| Page | 53
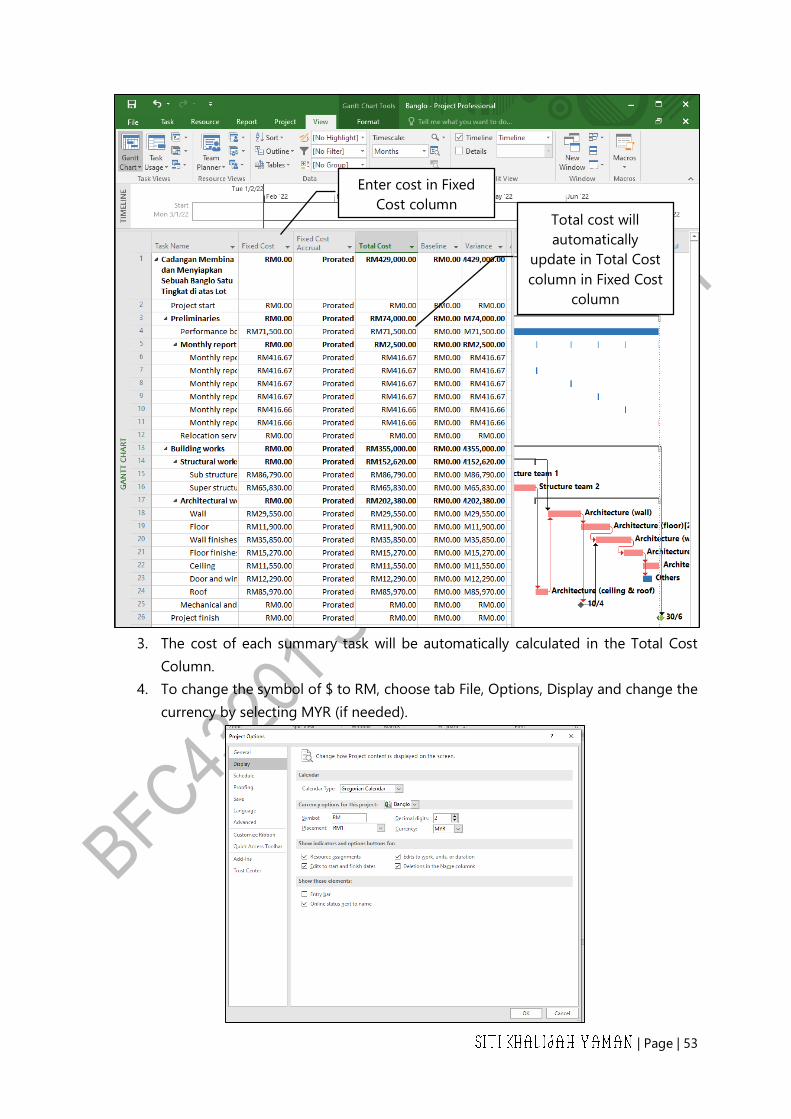
3. The cost of each summary task will be automatically calculated in the Total Cost
Column.
4. To change the symbol of $ to RM, choose tab File, Options, Display and change the
currency by selecting MYR (if needed).
Enter cost in Fixed
Cost column Total cost will
automatically
update in Total Cost
column in Fixed Cost
column

| Page | 54
5.4 Save a Project Baseline
A baseline is an original plan consist of important values in a project plan. A baseline can be
used as a reference and for future comparison. A baseline also can be called a Master Work
Programme.
1. Go to the Project tab, on Schedule group, choose Set Baseline.
2. Choose Set Baseline, then click OK.
5.5 Developing a Financial S-Curve
1. Go to Report tab, on Export group, choose Visual Report.
2. On a Visual Report dialog box, Click on Cash Flow Report (Microsoft Excel) and click
View.
3. The Financial Report automatically export in a Microsoft Excel file (default view).

| Page | 55

| Page | 56
4. The view shows a report based on quarter based. To expand the view into weekly
based, in Microsoft Excel file, go to Task Usage sheet and at the Quarter Column,
just click on the + sign.
Click
here

| Page | 57
5.5.1 Developing a Physical and Financial S-Curve
Usually, in the Malaysian Construction Industry, the Physical and Financial S-Curve is used.
The figure can be used to compare, for a certain time, the status of a construction project
in terms of Cost and Physical.
1. Go to the View tab in the Data group, click Table and choose Tracking.
2. At Task 1 (Summary task), column % Comp. key in 100%. Automatically all task is
completed 100%.

| Page | 58
3. This step is only used to get the data for developing Physical S-Curve. After the data
is taken, the value for % Comp. needs to be changed to 0%.
4. Change the view to Task Usage view, and in the View tab, click Table and choose
Summary in a Data group.
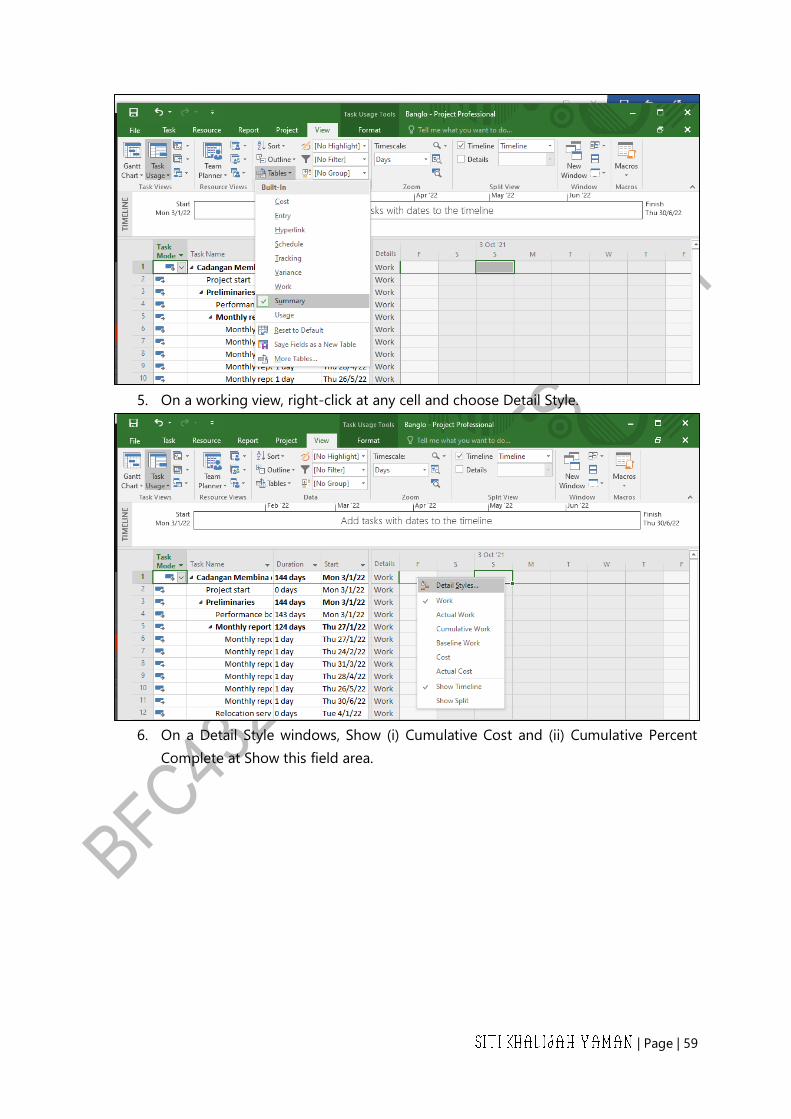
| Page | 59
5. On a working view, right-click at any cell and choose Detail Style.
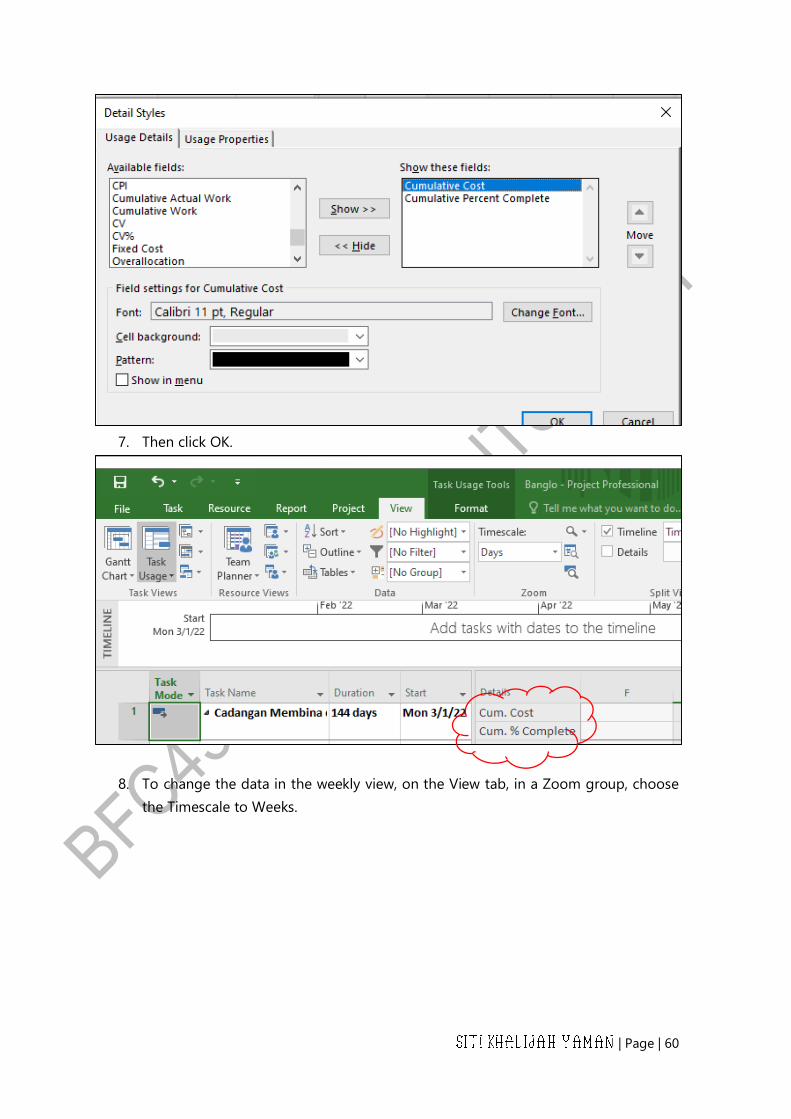
6. On a Detail Style windows, Show (i) Cumulative Cost and (ii) Cumulative Percent
Complete at Show this field area.
| Page | 60
7. Then click OK.
8. To change the data in the weekly view, on the View tab, in a Zoom group, choose
the Timescale to Weeks.

| Page | 61
9. At Details Column, highlight Cum. Cost and Cum. % complete data for Task 1, copy
and paste the data in Microsoft Excel. Name the data following its value. Change the
Cumulative Cost data into Percentage Value.
(You may not be able to see the data. Do not change the zoom, it may change the
value).
10. Create the Comparison S-Curve (the unit must be in percentage) using a suitable
Chart. (After creating this data, please change the value of % Complete to zero (0),
as mentioned in Step 2).
Week W1 W2 W3 W4 W5 W6
Cumulative cost RM45,895.00 RM98,274.55 RM110,748.79 RM126,134.55 RM136,113.94 RM151,083.03
Cum. Percent Complete 2% 6% 9% 13% 16% 20%
Week W7 W8 W9 W10 W11 W12
Cumulative cost RM166,052.12 RM198,899.70 RM248,792.43 RM271,801.12 RM281,367.78 RM289,340.01
Cum. Percent Complete 23% 27% 31% 35% 39% 42%
Week W13 W14 W15 W16 W17 W18
Cumulative cost RM299,323.34 RM307,295.57 RM313,976.97 RM320,081.31 RM331,723.76 RM338,617.01
Cum. Percent Complete 46% 49% 53% 57% 63% 65%
Week W19 W20 W21 W22 W23 W24
Cumulative cost RM350,851.32 RM359,753.11 RM373,715.04 RM387,562.72 RM394,834.59 RM408,968.34
Cum. Percent Complete 70% 73% 78% 83% 86% 92%
Week W25 W26
Cumulative cost RM422,733.34 RM429,000.00
Cum. Percent Complete 97% 100%

| Page | 62

| Page | 63
5.6 Creating a Project Report
Microsoft Project able to create and customised several types of graphical reports. For this
exercise, only Gantt Chart will be used.
1. Change the view of your project to View Gantt Chart, Table Entry.
2. In the Table area, appear all columns that you need to present your Gantt Chart, and
hide all the unnecessary columns. To do that, Click any column, right click your
mouse, and insert a column. To hide the column, just choose the column, right click
your mouse and choose Hide column.
3. Rearrange the column is needed.
| Page | 64
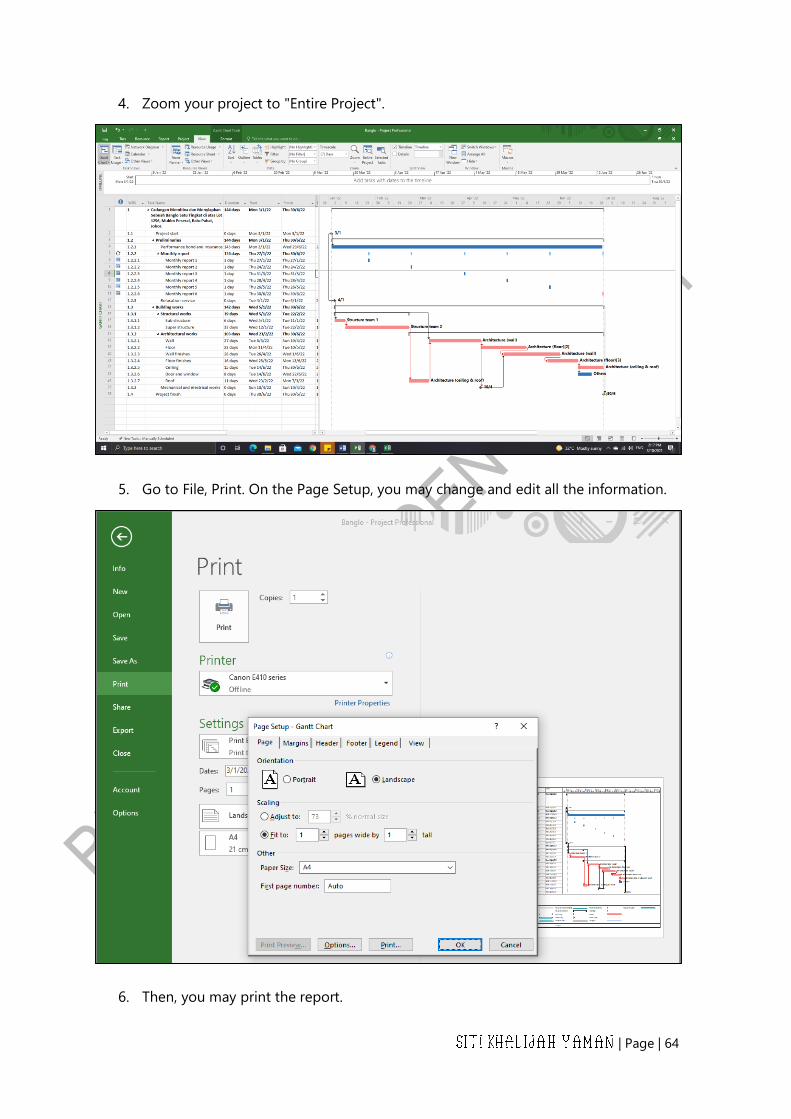
4. Zoom your project to "Entire Project".
5. Go to File, Print. On the Page Setup, you may change and edit all the information.
6. Then, you may print the report.

| Page | 65

| Page | 66
5.7 Exercise
As a Project Planner at Bersatu Bina Sdn. Bhd. you are appoint to prepare a Construction
Work Programme for an approval by client for a project, “Cadangan Membina dan
Menyiapkan Sebuah Banglo Satu Tingkat di atas Lot 1256, Mukim Peserai, Batu Pahat,
Johor”.
1. Contract Duration : 3rd January 2022 to 2nd July 2022.
2. Contract Amount : RM 429,000.00
TENDER DESCRIPTIONS
Item Description Unit Quantity Amount
(RM)
A. Preliminaries
A.1 Performance Bond and Insurance Lump-Sum 71,500.00
A.2 Monthly report and progress photograph Lump-Sum 2,500.00
Working hours
No restrictions are placed on the Contractor on the working hours on-site, but he
shall comply with all Rules and Regulations affecting work and labour and the
State's National/ Public Holiday.
B Building Works
B.1 Structural works
B.1.1 Sub structure m3 48 86,790.00
B.1.2 Super structure m3 225 65,830.00
B.2 Architectural works
B.2.1 Wall m2 480 29,550.00
B.2.2 Floor m2 600 11,900.00
B.2.3 Wall finishes m2 480 35,850.00
B.2.4 Floor finishes m2 600 15,270.00
B.2.5 Ceiling m2 500 11,550.00
B.2.6 Door and window no 36 12,290.00
B.2.7 Roof m2 120 85,970.00
B.3 Mechanical and Electrical Works
(Nominated Sub Contractors Work)
Total 429,000.00
| Page | 67
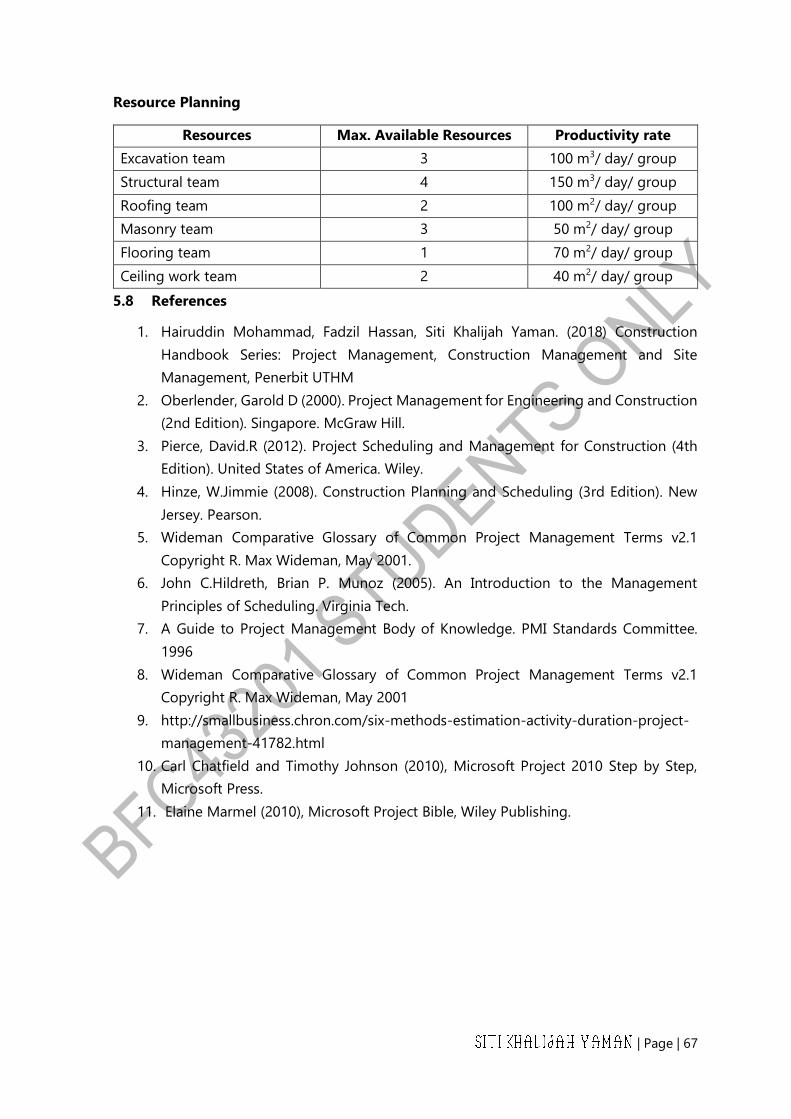
Resource Planning
Resources Max. Available Resources Productivity rate
Excavation team 3 100 m3/ day/ group
Structural team 4 150 m3/ day/ group
Roofing team 2 100 m2/ day/ group
Masonry team 3 50 m2/ day/ group
Flooring team 1 70 m2/ day/ group
Ceiling work team 2 40 m2/ day/ group
5.8 References
1. Hairuddin Mohammad, Fadzil Hassan, Siti Khalijah Yaman. (2018) Construction
Handbook Series: Project Management, Construction Management and Site
Management, Penerbit UTHM
2. Oberlender, Garold D (2000). Project Management for Engineering and Construction
(2nd Edition). Singapore. McGraw Hill.
3. Pierce, David.R (2012). Project Scheduling and Management for Construction (4th
Edition). United States of America. Wiley.
4. Hinze, W.Jimmie (2008). Construction Planning and Scheduling (3rd Edition). New
Jersey. Pearson.
5. Wideman Comparative Glossary of Common Project Management Terms v2.1
Copyright R. Max Wideman, May 2001.
6. John C.Hildreth, Brian P. Munoz (2005). An Introduction to the Management
Principles of Scheduling. Virginia Tech.
7. A Guide to Project Management Body of Knowledge. PMI Standards Committee.
1996
8. Wideman Comparative Glossary of Common Project Management Terms v2.1
Copyright R. Max Wideman, May 2001
9. http://smallbusiness.chron.com/six-methods-estimation-activity-duration-project-
management-41782.html
10. Carl Chatfield and Timothy Johnson (2010), Microsoft Project 2010 Step by Step,
Microsoft Press.
11. Elaine Marmel (2010), Microsoft Project Bible, Wiley Publishing.


