Download - SKuehn_Talk_FootballAnalytics_data2day2015

How smart is Football Data Analytics today?
Dr. Stefan Kühn data2day - Karlsruhe29.09.2015

Topic
Why Football Data Analytics?
• It’s about Football• There is a lot of data out there• There is a lot of ignorance out there• Three examples• Corners• Marginal goals• Substitutions
• Alternatives
2

Infos
Why Football is an interesting Use Case
• 209 FIFA federations - worldwide• Most popular sport - 3.3-3.5 billion fans• Monetary facts - revenue (Deloitte Money League)• Real Madrid 2013/4: 549.5 Million € (Position 1)• Bayern Munich 2013/4: 487.5 Million € (Position 3)• Everton 2013/4: 144.1 Million € (Position 20)
• Social Media facts (Deloitte Money League)• Facebook: FC Barcelona - 81.4 Million Likes• Twitter: Real Madrid - 14.4 Million Followers
3

Some Stats
Why Football is a Data Use Case
• 306 Bundesliga matches per season• 2000+ recorded events per match• 512 Bundesliga players• Live Statistics (Opta, Prozone etc.):
• Shots, Passes, Assists• Tacklings, Blocks, intercepted Passes• Saves and other actions of Goalkeepers• Fouls and Foul types• Position Data including time stamps
• 1.8 Million Amateur matches (Deutschland)
4

Some Remarks
Is there anything left to do?
• Big companies like SAP are involved• Players are tracked in training and matches (and
sometimes at home as well)• Physiological data, nutrition data, training plans
★ BUT:
Big data is not about the data.(Gary King, Harvard University, 2013)
It’s about Analytics.
5

Some Remarks
Where is the ignorance?
• „The Number’s Game - Why Everything You Know About Football Is Wrong“• Book by Chris Anderson (former Cornell University
Prof) and David Sally (Economics and Behavioral Game Theory)
• „Is it easier to score as a sub“? • Blogpost by Dan Altman, founder of North Yard
Analytics
6

Ignorance-
Part 1
7
Corners
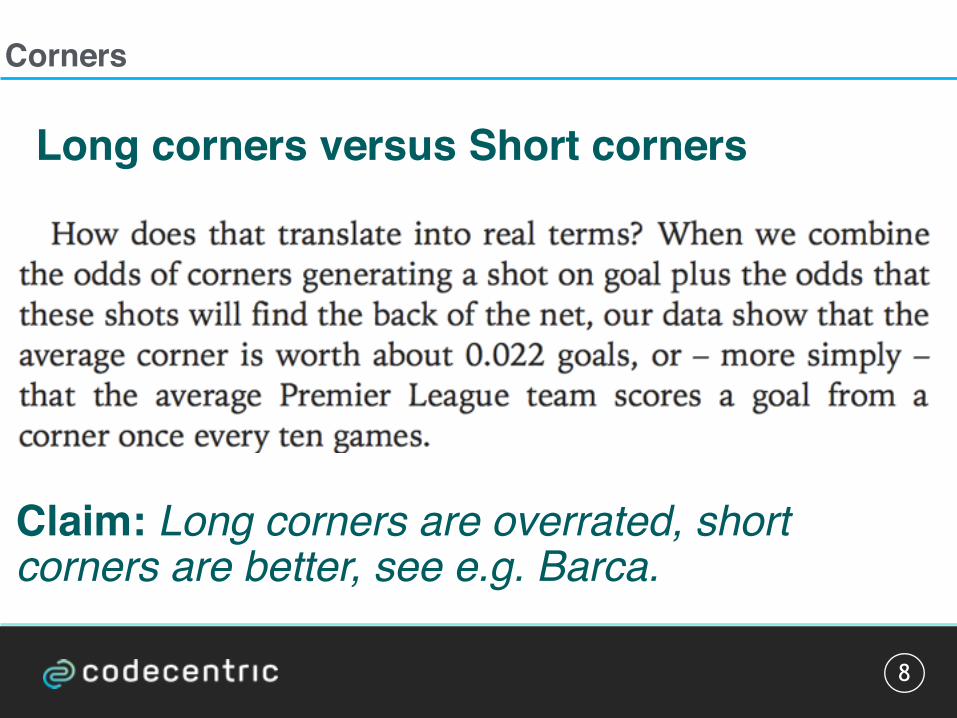
Claim: Long corners are overrated, short corners are better, see e.g. Barca.
8
Long corners versus Short corners

Corners
Some useful stats
• Average number of goals per team per match: 1.3• Average number of corners per team per match: 5• Long corners account for ~8.5% of all goals• Silly question: The average team scores once
every ten games from a penalty, shall they give up on penalties as well?• Lack of relevant context• How efficient are the alternatives?• How efficient is the average possession?
9

Corners
Average Possession
• Average number of possessions per team per match: 200• Average number of goals per team per match: 1.3• Expectation value per possession: 0.0065• Normalized per match (200 possessions):• All possessions are corners: 4.4 goals • Half of the possessions are corner: 2.85 goals• 10% of the possessions are corners: 1.46 goals
• The efficiency of long corners is more than three times as high as the efficiency of the average possession.• Still unknown:• How efficient are the alternatives? • Are there any negative counter effects?
10

Corners
11

Ignorance-
Part 2
12

Marginal Goals
13
Claim: Some goals count more than others, one should rate players according to this.

Marginal goals
14
Why they should have bought Darren Bent
What do you think?

Marginal goals
Why they should have bought a book on hypothesis testing
• How many second goals could have been scored without the first goal?• Do the samples for matches with one (own) goal, two goals etc. differ,
and if yes (it’s a definite yes, selection bias): how?• Is it more likely to score more against weaker teams and less against
stronger teams?• And of course: The events considered here are not statistically
independent.
15
What they should have done
• Compute marginal goals per sample group (e.g. fixed number of own goals). Here, the first goal cannot have less marginal points than the second goal etc. which is the only reasonable result.• Do not compare apples and pies. (In some sense Simpson’s paradox)• Or: Hire the best striker for first goals and the best striker for second goals.

Ignorance-
Part 3
16

Substitutions and Scoring
17

Substitutions and Scoring
ClaimSubs score more than expected
• This is the first correct claim!• But still weak
effect, unknown reason(s)• Do opponents
score more as well?• Corrections needed • 36% of subs are
forwards• Individual Orders• Tactical changes• Lots of other things
18

Substitutions and Scoring
Only forwardsControlled for time on the field
• Claim: Fatigue is the cause of this effect!
19
Substitutions and Scoring
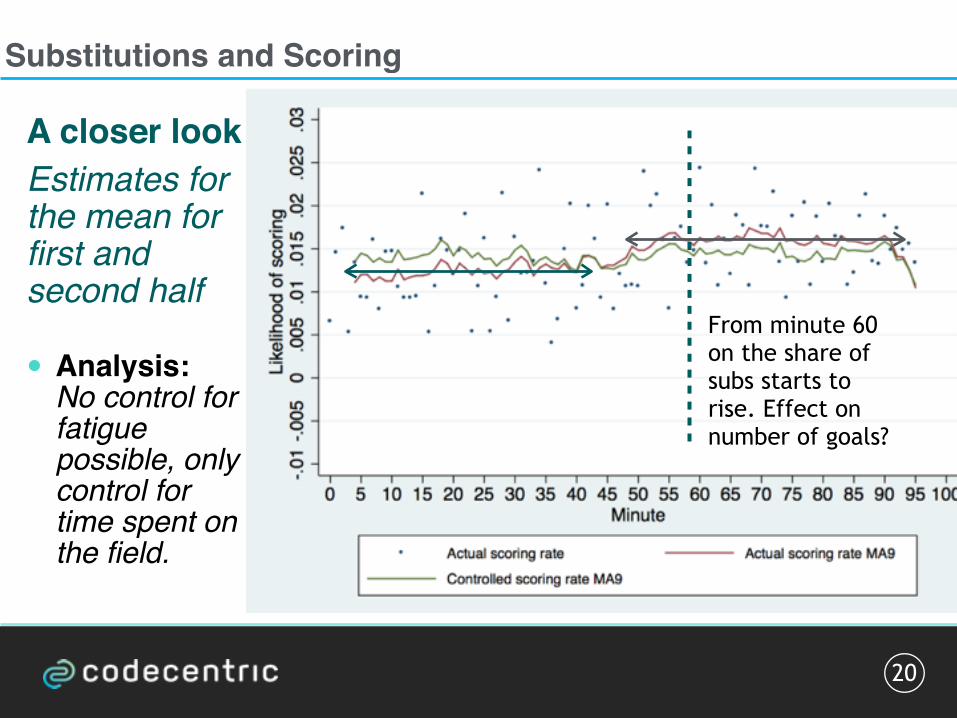
A closer lookEstimates for the mean for first and second half
• Analysis: No control for fatigue possible, only control for time spent on the field.
20
From minute 60 on the share of subs starts to rise. Effect on number of goals?

Substitutions and Scoring
Detected ReasonFatigue, subs are fitter
• What do you think, when looking at this graph?
21

Summary
What are the commonalities in all cases?
• „New“ spectacular insights• Preconceptions• Confirmation Bias• Lack of reflection• Challenging own results?• Alternative explanations?• Do not mix up a variable and your interpretation
of this variable (fatigue vs. time on field)• BUT: Data and Tools have been good!
22

Alternatives
23

What keeps Football Data Analytics from being smart?
24
Requirements
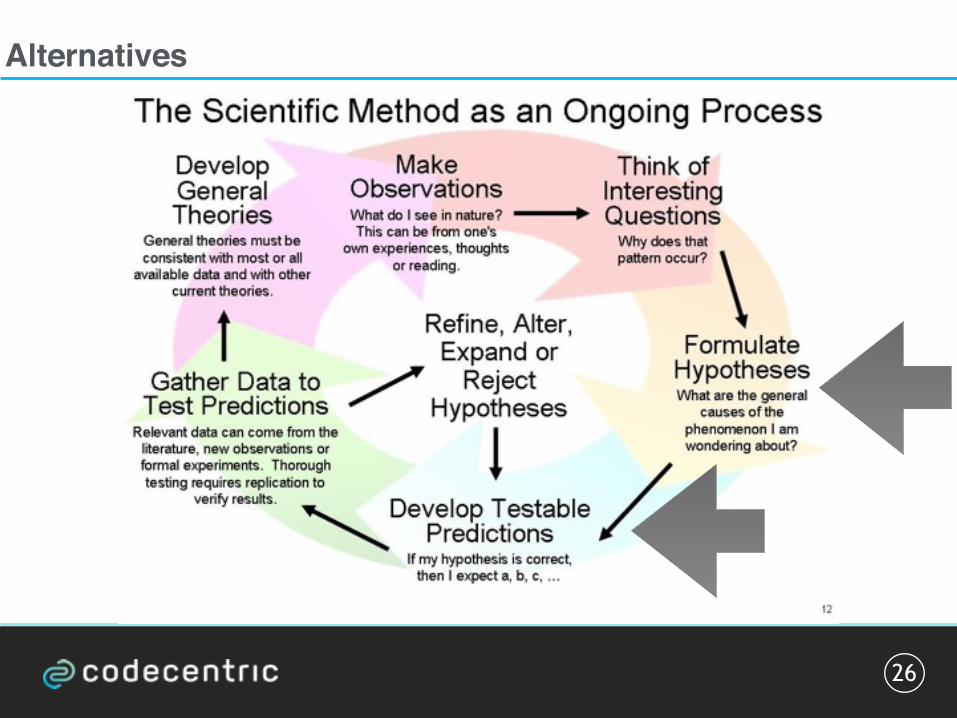
+ Scientific Method!
Reality
Tools Data
Money
???
+ Severe Time Constraint + Results must impress

What keeps Data Analytics from being smart?
25
Requirements
+ Scientific Method!
Reality
Tools Data
Money
???
+ Severe Time Constraint + Results must impress
Alternatives
26

27
Thanks a lot!
And enjoy the game :-)
www.codecentric.deblog.codecentric.de


