
[Type the document title]
Jonathan Woodworth ArresterWorks Page 1
Small Power Station Surge
Protection Analysis and Plan
By ArresterWorks
Small Power Station Surge Protection Analysis and Plan
Jonathan Woodworth ArresterWorks Page 2
Contents
1.0 Executive Summary ................................. 3
1.1 Project Overview ................................... 3
1.2 Analysis Overview ................................ 3
1.3 Conclusions ........................................... 3
1.4 Recommendations ................................ 3
2.0 Project Background .................................. 4
3.0 Project Analysis Method .......................... 5
4.0 Analysis .................................................... 5
4.1 Task 1 - Review of Events and Reports.. 5
4.2 Task 2 - Site Visit .................................... 6
4.3 Task 3 - Transient Analysis ..................... 8
4.3.1 Modeling Overview ......................... 8
4.3.2 No Protection Scenario ................... 8
4.3.3 Riser Pole Arrester Effect .............. 8
4.3.4 May 29, 2012 Configuration ............ 9
4.3.5 Potential Solutions ........................ 10
4.3.6 Effect of Capacitors ....................... 11
4.3.7 Effect of Elbow Arresters .............. 11
4.4 Margin of Protection ............................. 12
5.0 Conclusions ............................................. 13
6.0 Recommendations .................................. 13
7.0 References .............................................. 13
Annex A Surge Capacitor Spec ..................... 14
Elbow Arrester Spec ....................... 15
Small Power Station Surge Protection Analysis and Plan
Jonathan Woodworth ArresterWorks Page 3
Small Power Station Surge Protection Analysis and Plan
Jonathan Woodworth ArresterWorks
1.0 Executive Summary
1.1 Project Overview
The small power plant owned and operated Small Power Inc experienced a phase to ground and
phase-to-phase fault on May 29, 2012 that has shut the plant down. A similar event occurred in August
of 2011. Arresters were installed at that time to eliminate this type of failure in the future. ArresterWorks
was called in to perform a full scale lightning analysis and determine the root cause of the 2012 outage
and make recommendations on how to avoid outages in the future.
1.2 Analysis Overview
ArresterWorks reviewed all previous reports, visited the site on July 23, and ran a transient analysis of
the system. The site visit showed that the arresters installed in 2011 were in the proper locations and
should have solved the problem. A transient analysis was completed that checked the system
response with various scenarios including: 1: No protection, 2. 2011 Configurations, and 3. Alternate
configurations that could resolve the issue.
1.3 Conclusions from the Analysis
1.3.1 The 2011 installed arresters were in the correct location, but due to a very compact circuit,
and an open endpoint in the circuit, it’s possible that the oscillations from a high current
strike could compromise the system BIL. Since a high current strike was not observed on
May 29th, it is more likely that PT2 that failed had been earlier compromised and failed at a
lower stress level from a surge entering the station from the utility line.
1.3.2 The riser pole arresters on the utility pole offer no lightning protection to the power station.
1.3.3 A second set of arresters (referred to as A2) on the generator side of the main breaker have
a positive effect on the system stress during the worst case surge scenario.
1.3.4 The addition of a surge capacitor in parallel with arresters A1 has a positive effect on the
system stress during a worst-case surge scenario.
1.3.5 The addition of elbow arresters reduces the stress significantly on the lines mid and end
points.
1.3.6 The 34.5kV feeder line represents the largest threat for lightning surges. If it were shielded
for several spans, it would eliminate the worst case scenario possibilities and would be
another layer of lightning protection for the station.
1.3.7 It was mentioned in the historical issues with the station that the revenue meter had suffered
damage several times in the past due to lightning. These meters can be protected from
lightning effectively.
1.4 Recommendations
Based on the site visit, document review, and transient analysis, the following recommendations are
made to insure that lightning does not cause an outage in the Small Power Station in the future.
1.4.1 Insure that when the new breaker module arrives, it has 36kV arresters pre-installed.
(referred to as A2 in this report)
1.4.2 Add 35kV, .13uF surge capacitors as specified in Annex A in parallel with Arresters A1.
1.4.3 Add 35kV elbow arresters at the end of the circuit in GM3 as specified in Annex A.
1.4.4 Consider working with First Energy to install better protection of the revenue meter and to
install an overhead shield ground wire with arresters on the 34.5kV feeder.
Small Power Station Surge Protection Analysis and Plan
Jonathan Woodworth ArresterWorks Page 4
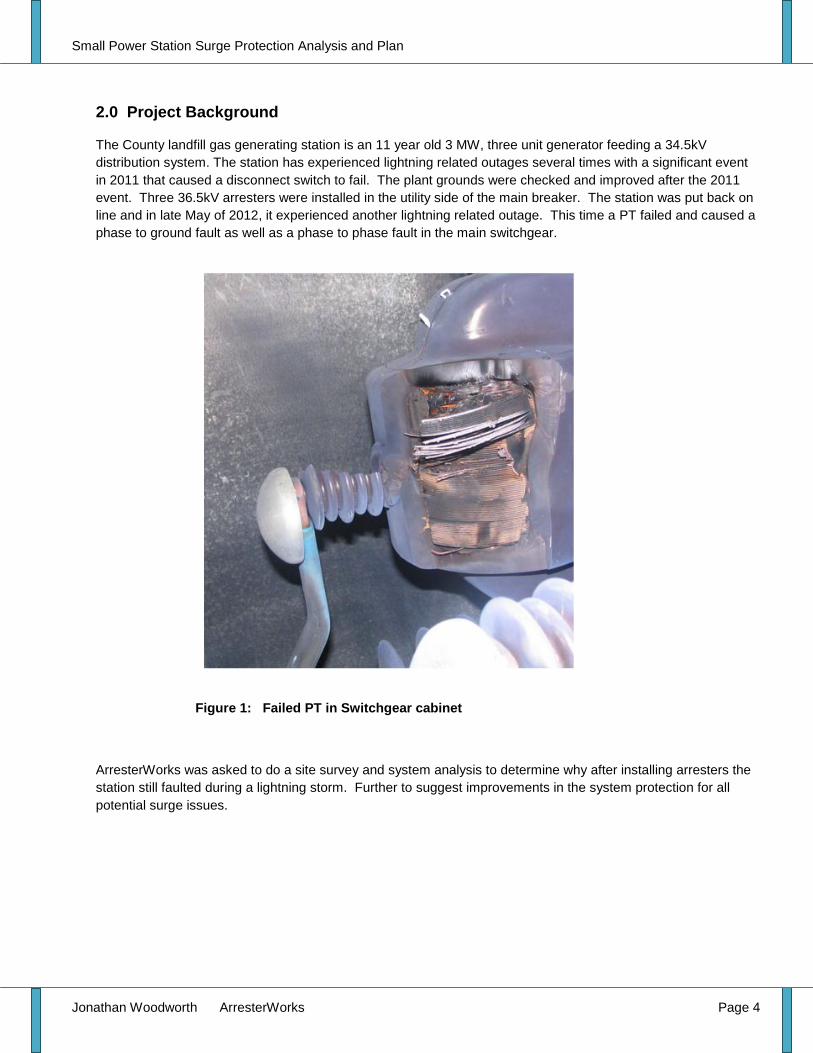
2.0 Project Background
The County landfill gas generating station is an 11 year old 3 MW, three unit generator feeding a 34.5kV
distribution system. The station has experienced lightning related outages several times with a significant event
in 2011 that caused a disconnect switch to fail. The plant grounds were checked and improved after the 2011
event. Three 36.5kV arresters were installed in the utility side of the main breaker. The station was put back on
line and in late May of 2012, it experienced another lightning related outage. This time a PT failed and caused a
phase to ground fault as well as a phase to phase fault in the main switchgear.
Figure 1: Failed PT in Switchgear cabinet
ArresterWorks was asked to do a site survey and system analysis to determine why after installing arresters the
station still faulted during a lightning storm. Further to suggest improvements in the system protection for all
potential surge issues.

Small Power Station Surge Protection Analysis and Plan
Jonathan Woodworth ArresterWorks Page 5
3.0 Analysis Method
There were three separate tasks associated with the analysis
Task 1 Examine the reports and past events. Examine plant diagrams and schematics.
Task 2 Visit the site and evaluate the events, installed equipment, take dimensional data, and discuss the
events with personnel in the know.
Task 3 Model and analyze the system with transient analysis software to check for voltage levels during
lightning events.
4.0 Analysis
4.1 Task 1
Review of Previous Events and Reports
Table 1: Historical Summary of Lightning Events at Ottawa County Power Station
Date Equipment Description Actions
1. July , 2001 GM2 Phase A Load Break.
Station instruments – Flow and pressure transmitters. Analog card station PLC.
Utility Meter damaged
Load break “blown off the load break junction.
Analog card and transmitters damaged
Load break junction and elbow for A phase replaced.
Replaced.
Utility replaced meter
2. July 2003 Metering Pole
Utility Meter damaged
Lightning strike on pole tracked down station HV cables
All three cables replaced.
Utility replaced meter
3. September, 2004 Metering Pole
Utility Meter damaged
Lightning strike on pole damages, CT and one HV cable termination damaged
Utility replaces CT and revenue meter. repairs HV cable termination
Utility replaced meter
4. July, 2011 GM3 Phase B load break Load break terminator flash over to wall of module
Replace load break junction and terminator.
5. August, 2011 Merlin Gerin SF6 Ground Disconnect Switch
Internal flashover, broken rupture disk.
Ground disconnect switch replaced on site.
6. May 2012 “C” phase VT failure in HV circuit breaker compartment.
Phase “C” VT flashes over to the cabinet and other phases
Refer to section 8.3 on repairs and actions taken.
Small Power Station Surge Protection Analysis and Plan
Jonathan Woodworth ArresterWorks Page 6
In the concise history of lightning and surge events taken from SDR report on May 2012 Event it is clear that the
Power Station has had more than normal issues. My comments on this history are as follows:
1. Since the 34.5kV distribution line is not shielded, it is very susceptible to direct strikes. It is clear that the
2003 and 2004 events were direct strikes. It is amazing there was not more damage in the power station
from these strikes.
2. The 2001 and July 2011 events appear to be indirect strikes. This means a voltage was induced on the
system that did not flashover the insulators on the line and when the surge made it into the station, the
voltage reflections caused elbow failures.
3. The May 2012 strike also appears to have been an indirect strike in the area and a voltage was induced onto
the line and it entered the station.
4. It is also clear that the meter on the utility pole is not adequately protected.
System Grounding Report Review
From a lightning perspective, the grounding report is excellent. This type of grounding test is more important for
AC safety and AC operation. If ground resistances are less than 5 ohms on masts and poles, they are adequate
for lightning.
Review of System One Line Diagram
From a lightning perspective, it is incredible that this Small Power Station did not sustain a more serious lightning
related failure in its first 10 years of operation. The riser pole arresters on the Utilities pole offers no protection to
the power station. With no arresters in the power station it appears that the cable failures on the utility pole
actually protected the equipment in the power station.
August 21, 2011, Plant HV Failure,
The final recommendations to add arresters to the utility side of the export module was in the optimum locations
for arrester protection and the best single act that could have been done.
4.2 Task 2
Site Visit
ArresterWorks visited the plant site on July 23rd
and 24th for an examination of the system and a check of actual
arrester and equipment location.
Areas Inspected and Observations
1. Electrical Export Module: All the May 29, 2012 flashover events occurred inside this module. There was
evidence of both phase to ground and phase to phase flashover. The arc had left arc marks in several
locations.
a. The three arresters installed in 2011 were in the correct locations. The arrester ratings were
36.5kV Intermediate arresters.
b. The arrester grounds were in good condition and all connected to the grid ground.
c. The proposed locations for arresters in the new module will provide surge protection to the breaker
and generator if the station is islanded.
2. GM1 34.5kV cable rack: This cable rack is the end of the line, and most susceptible to voltage doubling.
There is room for elbow arresters on this rack if necessary.
3. Riser Pole: The arresters on the riser pole are rated 27kV which indicates that the feeder line is a
grounded wye system. The arresters are installed in the appropriate locations.

Small Power Station Surge Protection Analysis and Plan
Jonathan Woodworth ArresterWorks Page 7
4. General Station: The station masts are all well situated and protect the station well if it were an open air
station, but because all the equipment is enclosed in metal, the masts become less important. The 34.5kV
feeder line is not shielded from the mast since it is outside the mast zone of protection. The 34.5kV line is
also not shielded with an overhead ground wire and is therefore subject to direct strikes. The 34.5kV feeder
line represents the largest potential source of lightning surges.
Conclusions from the Site Visit
1. 2011 installed arresters are not at optimized rating but are in the optimum location.
i. The 27kV (22kV MCOV) arrester on the pole is electrically in parallel with the 36.5kV (29kV MCOV)
2011 installed arresters in switchgear module.
ii. The incoming line is a 3 wire system (most likely wye configured) based on the fact that 27kV arresters
are installed on it in numerous places.
2. The 2011 installed arresters should have prevented the PT failure.
i. Either the PT failure was due to previously weakened insulation or the rate of rise of the surge in the
last event exceeded the insulation withstand.
3. The last failure event appears to be a surge that entered the switchgear module from the incoming
34.5kV line.
4. Pre 2011 failures of the elbows were likely caused by a voltage doubling of an incoming surge that
traveled past the 27kV arresters on the metering pole and doubled at the end point of the circuit.
5. Based on the fact that the plant can potentially be islanded, the 36kV arresters proposed by Schneider to
be installed at the exit of the switchgear module are of the correct rating and location.
6. All grounds appear to be in good condition and in the correct locations for surge protection.
Small Power Station Surge Protection Analysis and Plan
Jonathan Woodworth ArresterWorks Page 8
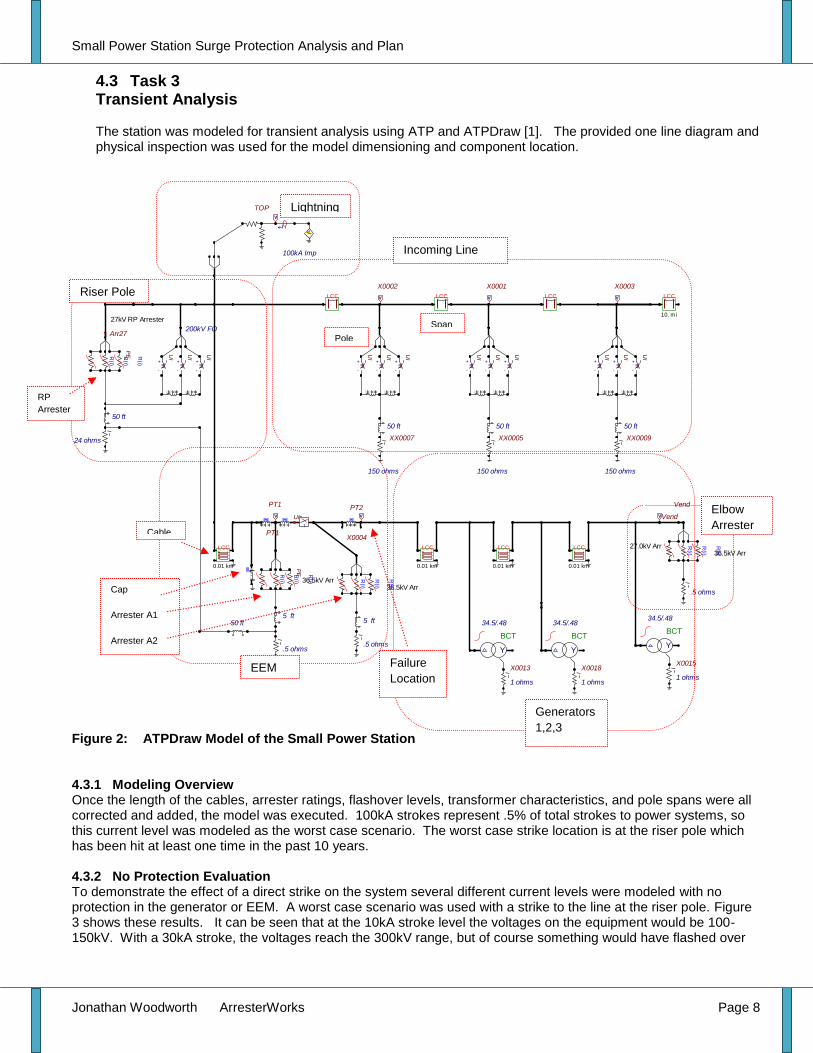
4.3 Task 3 Transient Analysis The station was modeled for transient analysis using ATP and ATPDraw [1]. The provided one line diagram and physical inspection was used for the model dimensioning and component location.
Figure 2: ATPDraw Model of the Small Power Station 4.3.1 Modeling Overview Once the length of the cables, arrester ratings, flashover levels, transformer characteristics, and pole spans were all corrected and added, the model was executed. 100kA strokes represent .5% of total strokes to power systems, so this current level was modeled as the worst case scenario. The worst case strike location is at the riser pole which has been hit at least one time in the past 10 years. 4.3.2 No Protection Evaluation To demonstrate the effect of a direct strike on the system several different current levels were modeled with no protection in the generator or EEM. A worst case scenario was used with a strike to the line at the riser pole. Figure 3 shows these results. It can be seen that at the 10kA stroke level the voltages on the equipment would be 100-150kV. With a 30kA stroke, the voltages reach the 300kV range, but of course something would have flashed over
100kA Imp
H
+V
f-
UI+
Vf
-
UI +
Vf
-
UI
50 ft
150 ohms
XX0005I
X0001
VLCC
+V
f-
UI+
Vf
-
UI +
Vf
-
UI
50 ft
150 ohms
XX0007I
X0002
VLCC
+V
f-
UI
200kV FO
+V
f-
UI +
Vf
-
UI
5 ft
PT1
50 ft
+V
f-
UI
Arr27
PT2
+V
f-
UI +
Vf
-
UI
PT1
50 ft
150 ohms
XX0009I
t
UI
X0003
V LCC
10. mi
V V
50 ft
1 ohms
X0013I
34.5/.48
BCT
Y
1 ohms
X0018I
34.5/.48
BCT
Y
1 ohms
X0015I
LCC
0.01 km
TOP
I
V
R(i)
PER
(i)
LCC
0.01 km
R(i)
24 ohms
I
LCC
0.01 km
.5 ohms
I
LCC
0.01 km
VendV
5 ft
LCC
34.5/.48
BCT
Y
V
R(i)
R(i)
.5 ohms
I
R(i)
X0004
R(i)
PER
(i)
R(i)
R(i)
R(i)
.5 ohms
I
R(i)
Vend
36.5kV Arr
27kV RP Arrester
36.5kV Arr
27.0kV Arr36.5kV Arr
Incoming Line
Lightning
Riser Pole
EEM
Generators
1,2,3
Span
Pole
Cable
RP
Arrester
s
Cap
Arrester A1
Arrester A2
Failure
Location
Elbow
Arrester
Small Power Station Surge Protection Analysis and Plan
Jonathan Woodworth ArresterWorks Page 9
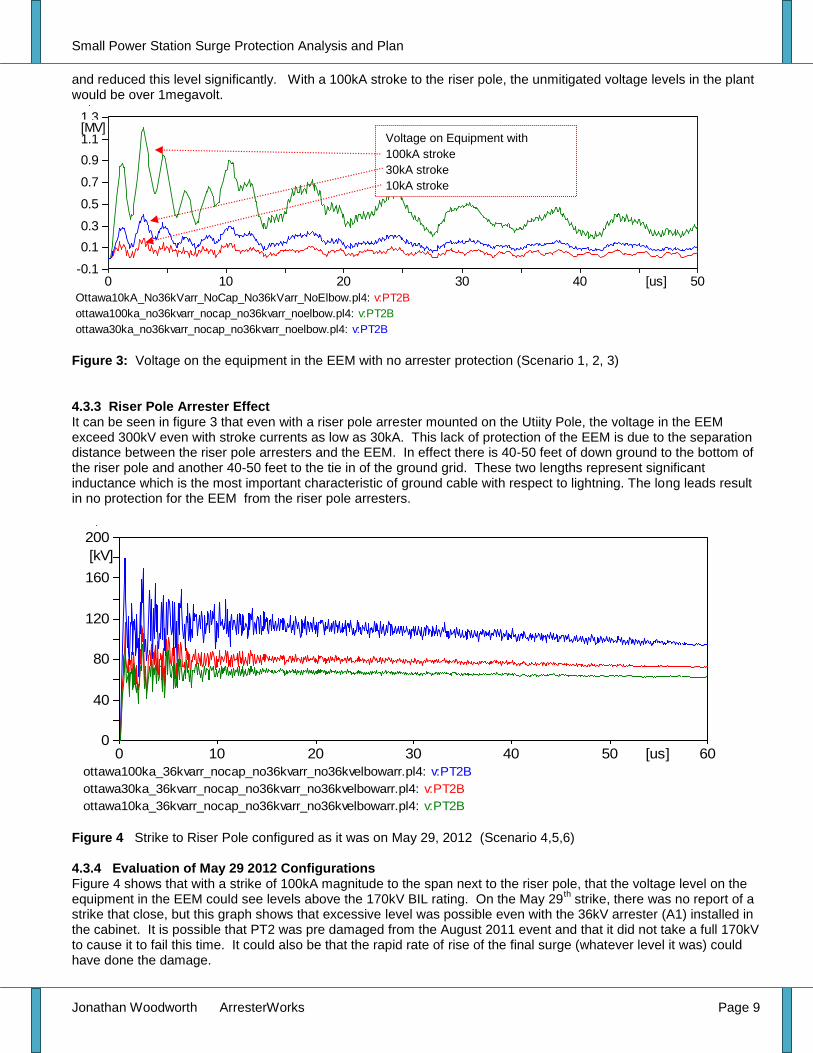
and reduced this level significantly. With a 100kA stroke to the riser pole, the unmitigated voltage levels in the plant would be over 1megavolt.
Figure 3: Voltage on the equipment in the EEM with no arrester protection (Scenario 1, 2, 3) 4.3.3 Riser Pole Arrester Effect It can be seen in figure 3 that even with a riser pole arrester mounted on the Utiity Pole, the voltage in the EEM exceed 300kV even with stroke currents as low as 30kA. This lack of protection of the EEM is due to the separation distance between the riser pole arresters and the EEM. In effect there is 40-50 feet of down ground to the bottom of the riser pole and another 40-50 feet to the tie in of the ground grid. These two lengths represent significant inductance which is the most important characteristic of ground cable with respect to lightning. The long leads result in no protection for the EEM from the riser pole arresters.
Figure 4 Strike to Riser Pole configured as it was on May 29, 2012 (Scenario 4,5,6) 4.3.4 Evaluation of May 29 2012 Configurations Figure 4 shows that with a strike of 100kA magnitude to the span next to the riser pole, that the voltage level on the equipment in the EEM could see levels above the 170kV BIL rating. On the May 29
th strike, there was no report of a
strike that close, but this graph shows that excessive level was possible even with the 36kV arrester (A1) installed in the cabinet. It is possible that PT2 was pre damaged from the August 2011 event and that it did not take a full 170kV to cause it to fail this time. It could also be that the rapid rate of rise of the final surge (whatever level it was) could have done the damage.
Ottawa10kA_No36kVarr_NoCap_No36kVarr_NoElbow.pl4: v:PT2B
ottawa100ka_no36kvarr_nocap_no36kvarr_noelbow.pl4: v:PT2B
ottawa30ka_no36kvarr_nocap_no36kvarr_noelbow.pl4: v:PT2B
0 10 20 30 40 50[us]-0.1
0.1
0.3
0.5
0.7
0.9
1.1
1.3[MV]
ottawa100ka_36kvarr_nocap_no36kvarr_no36kvelbowarr.pl4: v:PT2B
ottawa30ka_36kvarr_nocap_no36kvarr_no36kvelbowarr.pl4: v:PT2B
ottawa10ka_36kvarr_nocap_no36kvarr_no36kvelbowarr.pl4: v:PT2B
0 10 20 30 40 50 60[us]0
40
80
120
160
200
[kV]
Voltage on Equipment with
100kA stroke
30kA stroke
10kA stroke
Small Power Station Surge Protection Analysis and Plan
Jonathan Woodworth ArresterWorks Page 10
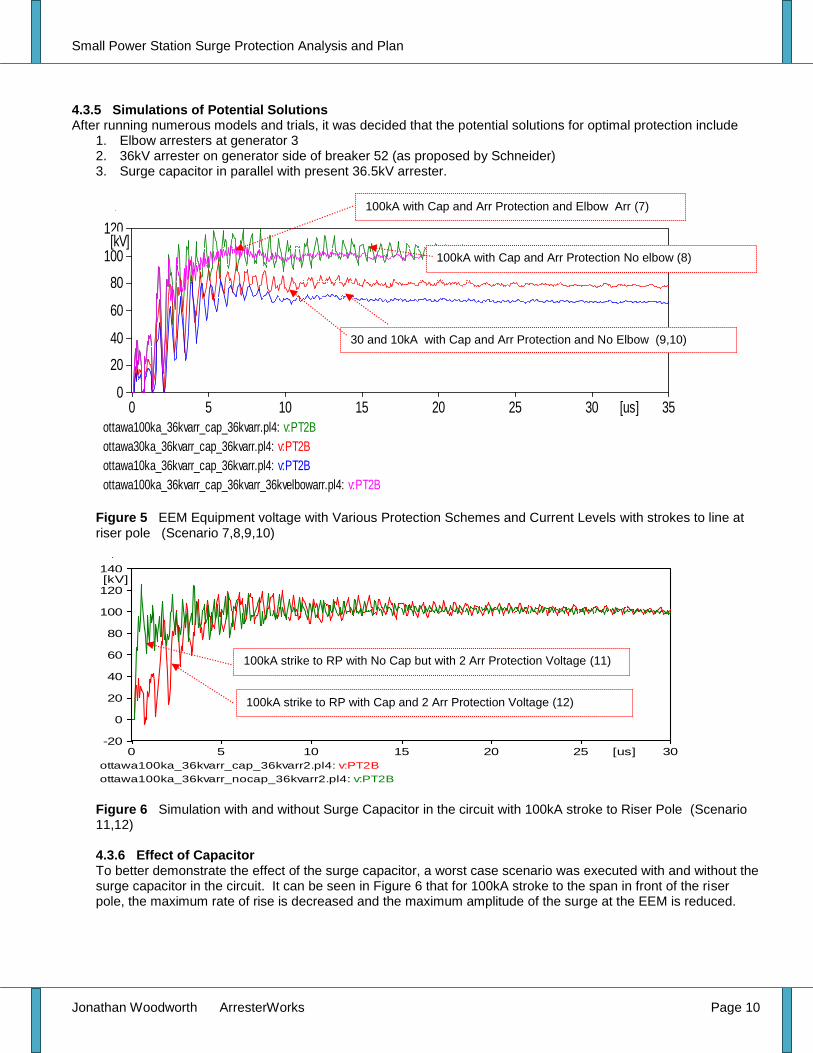
4.3.5 Simulations of Potential Solutions After running numerous models and trials, it was decided that the potential solutions for optimal protection include
1. Elbow arresters at generator 3 2. 36kV arrester on generator side of breaker 52 (as proposed by Schneider) 3. Surge capacitor in parallel with present 36.5kV arrester.
Figure 5 EEM Equipment voltage with Various Protection Schemes and Current Levels with strokes to line at riser pole (Scenario 7,8,9,10)
Figure 6 Simulation with and without Surge Capacitor in the circuit with 100kA stroke to Riser Pole (Scenario 11,12) 4.3.6 Effect of Capacitor To better demonstrate the effect of the surge capacitor, a worst case scenario was executed with and without the surge capacitor in the circuit. It can be seen in Figure 6 that for 100kA stroke to the span in front of the riser pole, the maximum rate of rise is decreased and the maximum amplitude of the surge at the EEM is reduced.
ottawa100ka_36kvarr_cap_36kvarr.pl4: v:PT2B
ottawa30ka_36kvarr_cap_36kvarr.pl4: v:PT2B
ottawa10ka_36kvarr_cap_36kvarr.pl4: v:PT2B
ottawa100ka_36kvarr_cap_36kvarr_36kvelbowarr.pl4: v:PT2B
0 5 10 15 20 25 30 35[us]0
20
40
60
80
100
120[kV]
ottawa100ka_36kvarr_cap_36kvarr2.pl4: v:PT2B
ottawa100ka_36kvarr_nocap_36kvarr2.pl4: v:PT2B
0 5 10 15 20 25 30[us]-20
0
20
40
60
80
100
120
140[kV]
100kA with Cap and Arr Protection No elbow (8)
100kA with Cap and Arr Protection and Elbow Arr (7)
30 and 10kA with Cap and Arr Protection and No Elbow (9,10)
100kA strike to RP with Cap and 2 Arr Protection Voltage (12)
100kA strike to RP with No Cap but with 2 Arr Protection Voltage (11)
Small Power Station Surge Protection Analysis and Plan
Jonathan Woodworth ArresterWorks Page 11
(file ottawa100ka_36kvarr_cap_36kvarr_withelbow.pl4; x-var t) v:PT2B
v:V-MIDB v:VENDB
0.00 0.02 0.04 0.06 0.08 0.10[ms]0
20
40
60
80
100
120
140
[kV]
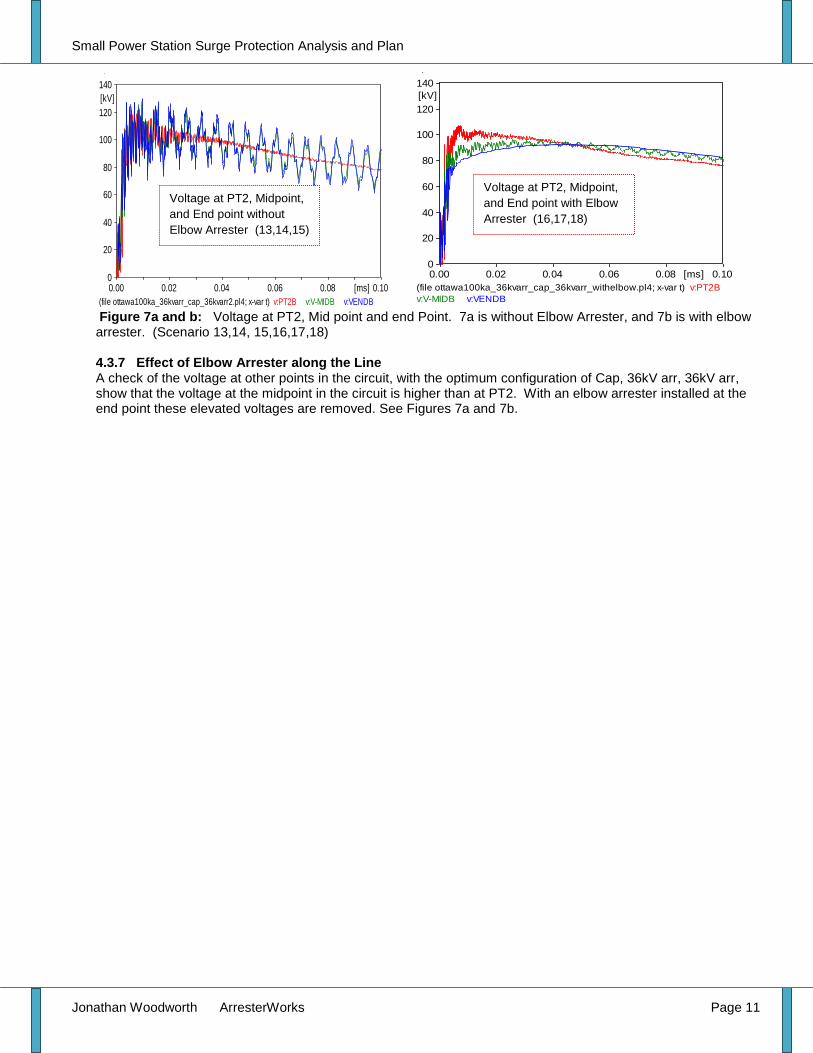
Figure 7a and b: Voltage at PT2, Mid point and end Point. 7a is without Elbow Arrester, and 7b is with elbow arrester. (Scenario 13,14, 15,16,17,18) 4.3.7 Effect of Elbow Arrester along the Line A check of the voltage at other points in the circuit, with the optimum configuration of Cap, 36kV arr, 36kV arr, show that the voltage at the midpoint in the circuit is higher than at PT2. With an elbow arrester installed at the end point these elevated voltages are removed. See Figures 7a and 7b.
(file ottawa100ka_36kvarr_cap_36kvarr2.pl4; x-var t) v:PT2B v:V-MIDB v:VENDB
0.00 0.02 0.04 0.06 0.08 0.10[ms]0
20
40
60
80
100
120
140
[kV]
Voltage at PT2, Midpoint,
and End point without
Elbow Arrester (13,14,15)
Voltage at PT2, Midpoint,
and End point with Elbow
Arrester (16,17,18)

Small Power Station Surge Protection Analysis and Plan
Jonathan Woodworth ArresterWorks Page 12
4.4 Margin of Protection Results for 19 Scenarios A systems margin of protection is a measure of how well the system is protected from lightning and other surges. In this case the only potentially significant surge that can be experienced in this system is from lightning so this is the only case that was monitored. This is also a clean tabular method of comparing scenarios. The margin of protection is calculated as a ratio of withstand voltage to the actual voltage on the system when arresters are installed. Often times the margin is based solely on the 10kA discharge voltage of the arresters used in the protection scheme, however when a transient analysis is executed, the actual voltages can be used in the calculation. Margin of Protection = ( [BIL / V ]-1) x 100 = in % where V is voltage at PT2
Table 2 Margin of Protection Results
Scenario Number
Scenario EEM BIL Max
Voltage at PT2
Margin of Protection
( [BIL / V ]-1) x 100 (%)
Comments
1,2 No Protection in EEM with
100kA and 30kA 170kV >170kV <0% Certain Flashover
3 No Protection in EEM with 10kA
stroke 170kV 170kV 0% High Risk of Flashover
4 May 29 Configuration with
100kA stroke to RP 170kV 180kV 0% Potential Flashover
5 May 29 Configuration with 30kA
stroke to RP 170kV 118kV 44% Reasonable protection
6 May 29 Configuration with 10kA
stroke to RP 170kV 98kV 73%
Excellent Protection at 10kA
7
100kA with Cap and 2x Arr
Protection and Elbow Arr 170kV 105kV 61% Elbow Arrester improves voltage level marginally
at PT2
8
100kA with Cap and Arr Protection
No elbow arr 170kV 120kV 45% Oscillations are evident at this location due to
open end point
9 Two 36kA arresters with no
“Elbow arrester at 30kA 170kV 98kV 73%
No Cap results in low peak but faster rise time.
10 Two 36kA arresters with cap no
“Elbow arrester at 10kA 170kV 90kV 88%
Excellent protection at 10kA stroke
11 100kA strike to RP with No Cap but
with 2 Arr Protection Voltage 170kV 122kV 45% Crest voltages are
similar but rate of rise is different 12
100kA strike to RP with Cap and 2 Arr Protection Voltage
170kV 120kV 45%
13 Voltage at PT2 with two
arresters, and Cap 170kV
120kV 45%
All levels higher than with Elbow Arrester
installed 14
Voltage at Mid-Point with two arresters, and Cap
170kV 125kV 36%
15 Voltage at End Point with two
arresters, and Cap 170kV
130kV 30%
16 Voltage at PT2 with two
arresters, and Cap 170kV
105kV 61%
Biggest impact is at end and midpoint.
17 Voltage at Mid-Point with two
arresters, and Cap 170kV
95kV 78%
18 Voltage at End Point with two
arresters, and Cap 170kV 95kV 78%
Note it is generally understood that any level above 0% is acceptable margin for insulators, and above 15% for equipment.
Small Power Station Surge Protection Analysis and Plan
Jonathan Woodworth ArresterWorks Page 13
5.0 Conclusions from Transient Analysis, Site Visit, and Document Review
5.1 The riser pole arresters protect the cable and riser pole insulation, but do not protect the Generator in any way. Flashover of the equipment in EEM was inevitable.
5.2 The addition of a 36kV arrester (A1) at the utility side of breaker 52 was a positive move, but from Scenario 4 it appears possible that the system BIL could still be compromised if a high current stroke hit near the riser pole. (It is understood that this was not the case on May 29
th, but perhaps it
happened earlier when no operator was in house)
5.3 The addition of a 36kV arrester (A2) on the Generator side of Breaker 52 as proposed by Schneider Electric is a good one and in conjunction with Arrester A1, the margin of protection is good at PT2.
5.4 For one level better protection, the inclusion of a surge capacitor in parallel with Arresters A1 is positive. Scenarios 11 and 12 show the improvement.
5.5 To reduce voltage stresses at the midpoint and endpoint of the circuit, the addition of an elbow arrester at generator 3 is positive. Scenarios 13-18 show the improvement.
5.6 The 34.5kV feeder line represents the largest threat for lightning surges. If it were shielded for
several spans, it would eliminate the worst case scenario possibilities and would be another layer of lightning protection for the station.
5.7 It was mentioned in the historical issues with the station that the revenue meter had suffered
damage several times in the past due to lightning. These meters can be protected from lightning effectively.
6.0 Recommendations Based on the site visit, document review, and transient analysis, the following recommendations are made to insure that lightning does not cause an outage in the Small Power Station in the future.
6.1 Insure that when the new breaker module arrives, it has 36kV arresters pre-installed. (referred to as A2 in this report)
6.2 Add 35kV, .13uF surge capacitors as specified in Annex A in parallel with Arresters A1.
6.3 Add 35kV elbow arresters at the end of the circuit in GM3 as specified in Annex A.
6.4 Consider having an overhead shield wire and line arresters added to 10 spans out from the station.
6.5 Consider working with First Energy to improve the protection of the revenue meter with surge
arresters.
7.0 References
[1] ATP and ATPDraw Alternative Transients Program www.emtp.org the world’s most widely used Electromagnetic Transients Program.

Ottawa County Power Station Surge Protection Analysis and Plan
Jonathan Woodworth ArresterWorks Page 14
Annex A Surge Capacitor Specifications

Ottawa County Power Station Surge Protection Analysis and Plan
Jonathan Woodworth ArresterWorks Page 15
Elbow Arrester Specifications


