
Social and cultural participation in EU-SILC and the problem of output harmonization
Hans Schmeets / Statistics Netherlands / Maastricht University
Bart Huynen / Statistics Netherlands
Q2010, Helsinki, 2010, May 4

Importance of EU-SILC
The SILC “is the main source for the compilation of comparable indicators on social cohesion used for policy monitoring at EU level…” (Eurostat, 2009).

Outline
– 2 Problem examples – Eurostat – EU-Statistics on Income and Living
Conditions – Social and cultural participation (2006)– Problems of comparability:
– Questions – Data collection modes
– Conclusions and discussion

Participation in activities of churches or other religious organisations (%)
France 1 Norway 13 Luxembourg 34
Hungary 4 Austria 14 Slovakia 36
Estonia 5 Finland 16 Portugal 43
Czech Rep 6 Spain 18 Netherlands 45
Latvia 9 Italy 19 Ireland 49
UK 10 Sweden 20 Poland 69
Denmark 11 Lithuania 21 Cyprus 87
Iceland 11 Greece 29 Belgium -

Participation in informal voluntary activities (%)
Czech Rep 4 Portugal 28 Poland 52
Hungary 11 Slovakia 32 Netherlands 55
Belgium 13 Latvia 34 Norway 61
Lithuania 14 Sweden 37 Iceland 67
France 17 Luxembourg 37 Cyprus 67
Greece 19 Austria 39 Estonia 95
Italy 25 Finland 39 UK 99
Ireland 26 Spain 45 Denmark 100

Correlation with gender, age, education and disposable household income
Many across country differences in the strength of the correlations
E.g.: Informal voluntary activities by gender No correlations in Belgium (0.02), Hungary
(0.02) and France (0.03) The Netherlands, UK, Iceland, Italy:
substantially more women than men (> 0.10)

Eurostat: Mission
Eurostat is the Statistical Office of the European Communities. Its mission is to provide the European Union with high-quality statistical information. For that purpose, it gathers and analyses
figures from the national statistical offices across Europe and provides comparable and harmonised data for the European Union to use in the definition, implementation, and analysis of Community policies.
Source: http://ec.europa.eu/eurostat

Eurostat: Output Harmonisation
Output Harmonisation
- Same definition and variables of the defined concepts
Whereas Input Harmonisation requests also the same: - sample design
- questions - data collection mode - rate of proxy-interviews
- response rate and so on…..

Design of the EU-SILC
Various sample designs. Most National Statistical Institutes use a 4-year
rotational design (if EU-SILC is new survey); Other countries integrate EU-SILC with an existing
survey or incorporating it into an existing sample;
Four modes of data collection exist for the
EU-SILCPersonal visits (CAPI);Telephone interviews (CATI); Paper interviews (PAPI);Self-administrated questionnaires (Mail);
Interview duration: 15 minutes for CATI to over 60 minutes for CAPI;
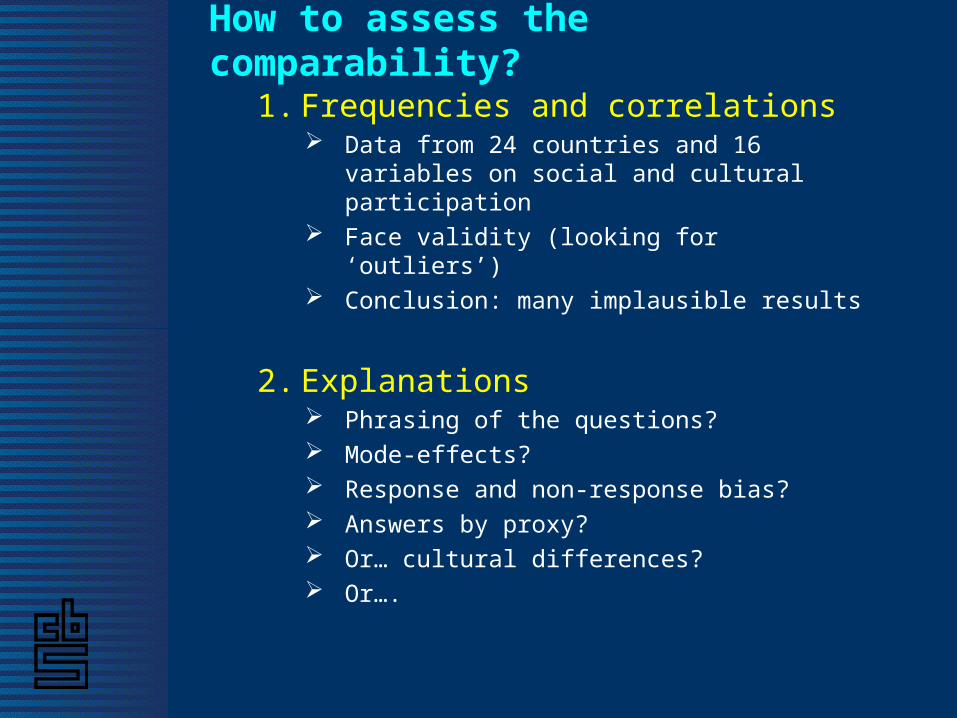
How to assess the comparability?
1. Frequencies and correlations Data from 24 countries and 16 variables on social
and cultural participation Face validity (looking for ‘outliers’) Conclusion: many implausible results
2. Explanations Phrasing of the questions? Mode-effects? Response and non-response bias? Answers by proxy? Or… cultural differences? Or….

How to assess the comparability?
1. Phrasing of the questions? Collected and translated the questionnaires on
social and cultural participation 15 questionnaires translated
Compared the questions Conclusion: many differences
2. Differences One single and more than one question;
Follow-up questions;
The exact phrasing of the question; Presenting a showcard or not; Examples to clarify the meaning of the question; Inclusion and exclusion of groups, e.g. household
members; And more….

Concepts and variablesIdentical Questions (out of 15 countries)
A. Cultural participation
Going to cinema (PS010) 14
Going to live performances (PS020) 10
Visits to cultural sites (PS030) 7
Attending live sport events (PS040) 9
B. Contacts with friends and family
Getting together with relatives (PS050) 11
Getting together with friends (PS060) 7
Contacts with relatives (PS070) 10
Contacts with friends (PS080) 8

Concepts and variablesIdentical Questions (out of 15 countries)
C. Informal help
Ability to ask help (PS090) 4
Informal voluntary activities (PS100) 6
D. Participation in associations
Political parties or trade unions (PS110) 10
Professional organisations (PS120) 11
Churches or religious org (PS130) 7
Recreational groups (PS140) 12
Charitable organisations (PS150) 13
Other groups (PS160) 11

Example 1. Participation in churches and religious organisations
Defined concept:
If the respondent, during the last twelve months, participated in activities related to churches, religious communions or associations.
Attending meetings connected with these activities is included.
Attending holy masses or similar religious acts or helping during these services is also included.

Example 1. Participation in churches and religious organisations
France: “Au cours des douze derniers mois…avez-vous été membre…”
“are you a member”
– France reports relatively low participation in most questions concerning participation in groups or organisations.

Example 1. Participation in churches and religious organisations
In UK:
The next question is about involvement in groups, clubs and organisations. These could be formally organised groups or just groups of people who get together to do an activity or talk about things. Please exclude just paying a subscription, giving money, and anything that was a requirement of jour job.
In the last 12 months, have you been involved with any groups?
Yes 1No 2

Example 1. Participation in churches and religious organisations
In UK: Which of the categories on this card best describe the groups
you have taken part in?
Showcard 32
Hobbies/social clubsSport/exercise groups, including taking part, coaching or going to watchLocal community or neighbourhood groupsEnvironmental groupsPolitical groupsReligious groups, including going to place of worship or belonging to a religious based groupCharitable organisationProfessional associationsOther group

Example 1. Participation in churches and religious organisations
>> In The Netherlands
In the last 12 months, have you been going to a church, mosque, or another religious meeting?
Yes 1
No 2

Participation in activities of churches or other religious organisations (%)
France 1 Norway 13 Luxembourg 34
Hungary 4 Austria 14 Slovakia 36
Estonia 5 Finland 16 Portugal 43
Czech Rep 6 Spain 18 Netherlands 45
Latvia 9 Italy 19 Ireland 49
UK 10 Sweden 20 Poland 69
Denmark 11 Lithuania 21 Cyprus 87
Iceland 11 Greece 29 Belgium -

Data collection modes
CATI CAPI PAPI
Telephone Personal + laptop Personal + Paper
Denmark Austria Czech Rep
Finland Belgium Greece
Iceland Cyprus Hungary
Netherlands Estonia Italy
Norway France Lithuania
Sweden Ireland Luxembourg
Latvia Poland
Portugal Slovakia
Spain
UK

Volunteering work in the last 12 months before interview, 1997-2008, %
1997 Face-to-Face (CAPI) 46
1998 (CAPI) 44
1999 (CAPI) 45
2000 (CAPI) 45
2001 (CAPI) 43
2002 (CAPI) 42
2003 (CAPI) 42
2004 (CAPI) 43
2005 Telephone (CATI) 54
2006 Telephone (CATI) 54
2007 (CAPI) 44
2008 (CAPI) 42
Permanent Survey on Living Conditions in the Netherlands

Participation in activities of political parties or trade unions (%)
Lithuania 2 Italy 4 Slovakia 7
UK 2 Netherlands 4 Cyprus 8
Czech Rep 3 Poland 4 Sweden 9
France 3 Spain 4 Norway 10
Hungary 3 Greece 5 Finland 11
Portugal 3 Luxembourg 5 Denmark 12
Estonia 4 Austria 6 Iceland 16
Ireland 4 Latvia 7 Belgium -

Data collection modes 1) Comparison all 24 countries> CATI-countries higher on all 16 participation
variables than CAPI/PAPI
2) Comparison 15 ‘traditional’ EU-countries > CATI-countries higher on all 16 participation
variables than CAPI/PAPI
3) Comparison of countries with identical questions
CATI-countries higher on all 16 participation variables than CAPI/PAPI
3 examples >>>

Attending live sport events
CAPI
Austria, Belgium,Cyprus Spain,Latvia, UK
CATI
Denmark, Finland, Sweden, Netherlands
PAPI
Italy, Luxembourg
1 or more
Never
29
71
41
59
23
77

Contacts with Friends
CAPI
Austria, Cyprus, Latvia
CATI
Denmark, Finland, Norway
PAPI
Italy, Luxembourg
Daily
Once a year-weekly
Never
21
75
4
30
68
2
22
71
7

Participation in activities of charitable organisations
CAPI
Austria, Belgium,
Cyprus, Spain, Ireland, Latvia, UK
CATI
Denmark, Finland, Netherlands
PAPI
Italy, Luxembourg
Yes
No
10
90
25
75
7
93

Conclusions and discussion
– Eurostat Mission: – high-quality statistical information – comparable and harmonised data
How? >>> Output harmonization
However: – Statistics are hardly comparable– So: Quality is not high, but poor
Solution:– Input harmonization by regulations

THANK YOU !


