Download - Solar Ready Northwest Indiana

SOLAR READY NORTHWEST
INDIANA Kathy Luther
Northwestern Indiana Regional Planning Commission
February 28, 2014

U.S Department Of Energy SunShot Initiative Rooftop Solar Challenge

U.S Department of Energy SunShot Initiative
•The U.S. Department of Energy SunShot Initiative is a collaborative national effort that aggressively drives innovation to make solar energy fully cost-competitive with traditional energy sources before the end of the decade. Through SunShot, DOE supports efforts by private companies, academia, and national laboratories to drive down the cost of solar electricity to $0.06 per kilowatt-hour.

U.S. Department of Energy SunShot Initiative Rooftop Solar Challenge
The U.S. Department of Energy SunShot Initiative Rooftop Solar Challenge incentivizes regional awardee teams to make it easier and more affordable for Americans to go solar. By streamlining permit processes, updating planning and zoning codes, improving standards for connecting solar power to the electric grid, and increasing access to financing, teams will clear a path for rapid expansion of solar energy and serve as models for other communities across the nation.
Solar Ready II
•Partnering with Mid-America Regional Council (MARC), National Association of Regional Councils (NARC), Meister Consultants Group (MCG), and Council of State Governments (CSG).
•Goals are to implement solar best management practices, training materials and methods, and other proven implementation strategies previously established by MARC’s 2012 Solar Ready KC Initiative.
•Ultimately will result in more streamlined and standardized solar practices, and will achieve measurable improvements in solar market conditions and access for ten million people across the US.

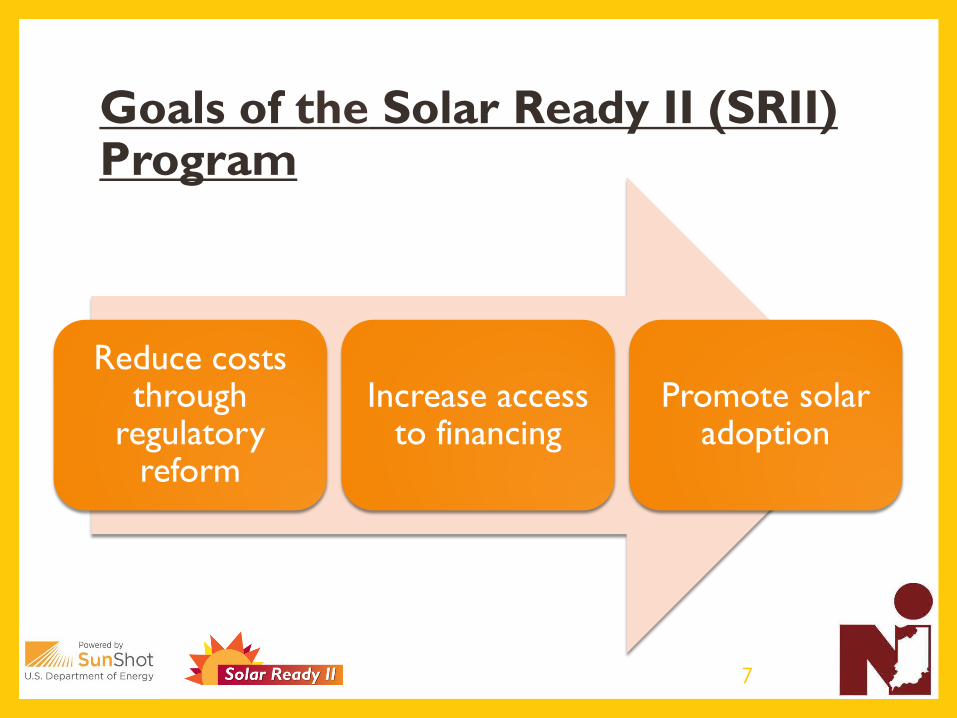
Goals of the Solar Ready II (SRII) Program
7
Reduce costs through
regulatory reform
Increase access to financing
Promote solar adoption
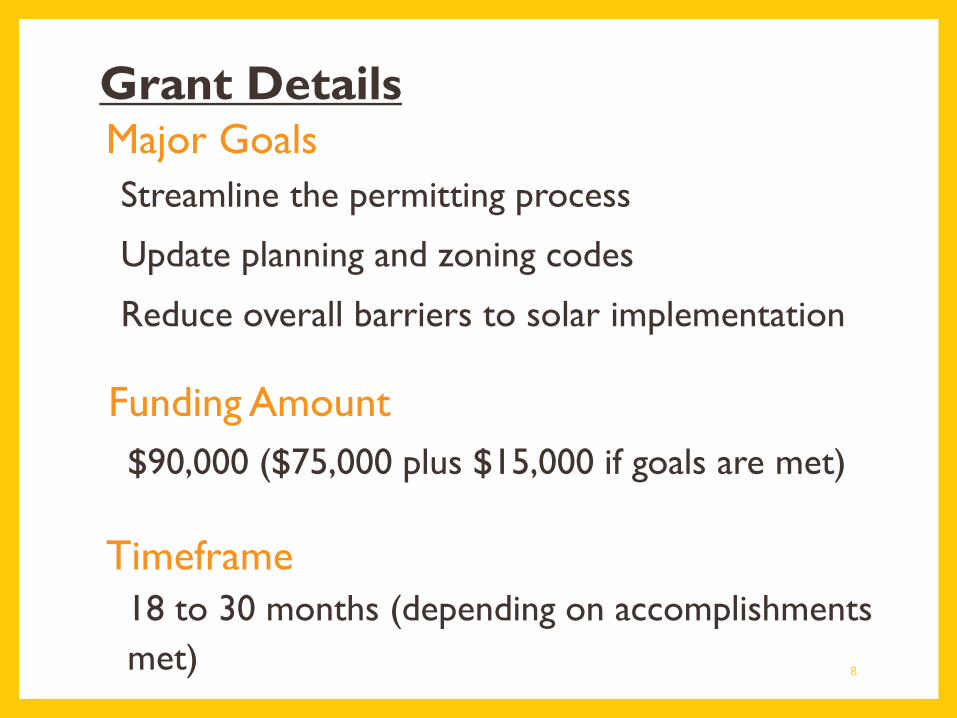
Grant Details Major Goals Streamline the permitting process
Update planning and zoning codes
Reduce overall barriers to solar implementation
Funding Amount $90,000 ($75,000 plus $15,000 if goals are met)
Timeframe 18 to 30 months (depending on accomplishments met)
8

Grant Details National Partners •Mid-America Regional Council (MARC) •National Association of Regional Councils (NARC) •Meister Consultants Group •Council of State Governments
9

Grant Details Regional Participants •Central New York Regional Planning & Development Board (CNYRPDB) •Delaware Valley Regional Planning Commission (DVRPC) •Maricopa Association of Governments (MAG) •Metropolitan Washington Council of Governments (MWCOG) •North Central Texas Council of Governments (NCTCOG) •Northwester Indiana Regional Planning Commission (NIRPC) •Ohio Kentucky Indiana Regional Council of Governments (OKI) •Southwestern Florida Regional Planning Commission (SWFRPC) •Tampa Bay Regional Planning Commission (TBRPC) 10

Major Deliverables and Milestones
11
Subtask Target Date
Engage stakeholders including local government officials, planners, utility representatives, etc. February 2014
Evaluate existing processes/policies and update with Best Management Practices (BMPs) March - ongoing
Submit Jurisdiction Questionnaires March 2014 and ongoing
Engage 10-30 local governments as committed participants March 2014 and ongoing
Provide qualitative and quantitative data from industry professionals to verify market maturity March 2014 and ongoing
Assist MCG in gathering/compiling financial options data for the region March 2014 and ongoing
OPTIONAL: Implement citizen engagement/market research panels July 2014 and ongoing

Kathy Luther Director of Environmental Programs
NIRPC
[email protected] (219) 763-6060 x 127
www.nirpc.org/environment/solar
Mia Colson National Contact
National Association of Regional Councils
[email protected] (202) 986-1032, x218
www.narc.org/solarready
Acknowledgment: This material is based upon work supported by the U.S. Department of Energy under Award Number DE-EE0006310 Disclaimer: This presentation was prepared as an account of work sponsored by an agency of the United States Government. Neither the United Sates Government nor any agency thereof, nor any of their employees, makes any warranty, express or implied, or assumes any legal liability or responsibility for the accuracy, completeness, or usefulness of any information, apparatus, product, or process disclosed, or represents that its use would not infringe privately owned rights. Reference herein to any specific commercial product, process, or service by trade name, trademark, manufacturer, or otherwise does not necessarily constitute or imply its endorsement, recommendation, or favoring by the United States Government or any agency thereof. The views and opinions of authors expressed herein do not necessarily state or reflect those of the United States Government or any agency thereof.
http://www.eere.energy.gov/solarchallenge/index.html

Benefits and Barriers to Solar
Adoption in Your Region
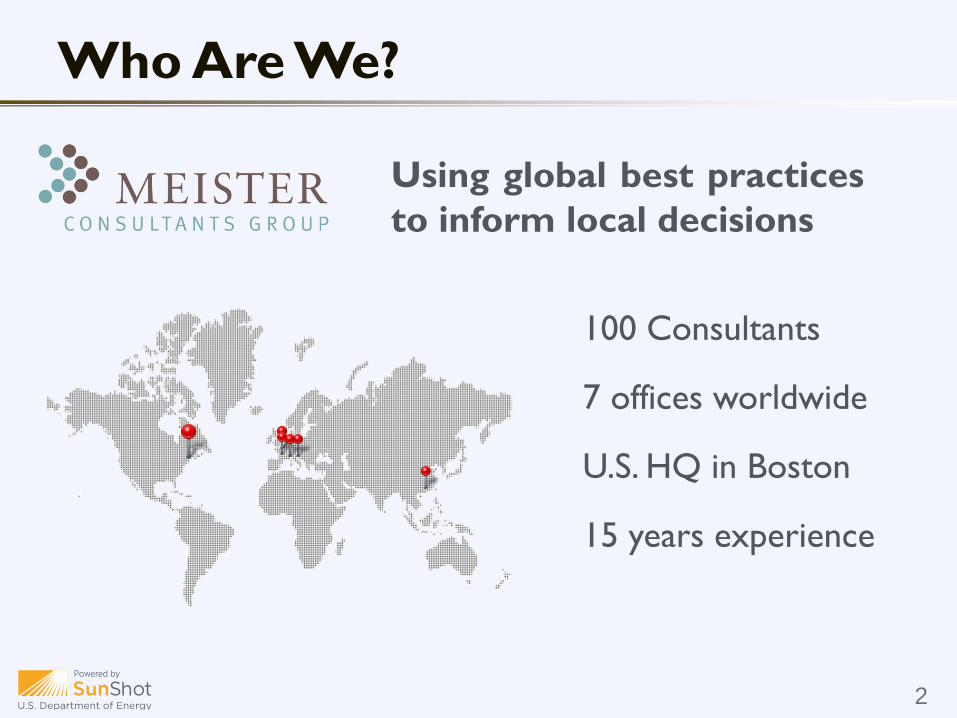
Who Are We?
2
100 Consultants
7 offices worldwide
U.S. HQ in Boston
15 years experience
Using global best practices
to inform local decisions

Meister Consultants Group
(617) 209 -1986
Chad LaurentMeister Consultants Group
(617) 209 -1990
Jayson Uppal
Stakeholders
Elected
Officials
Local
Constituents
Business &
IndustryRegional
Utilities
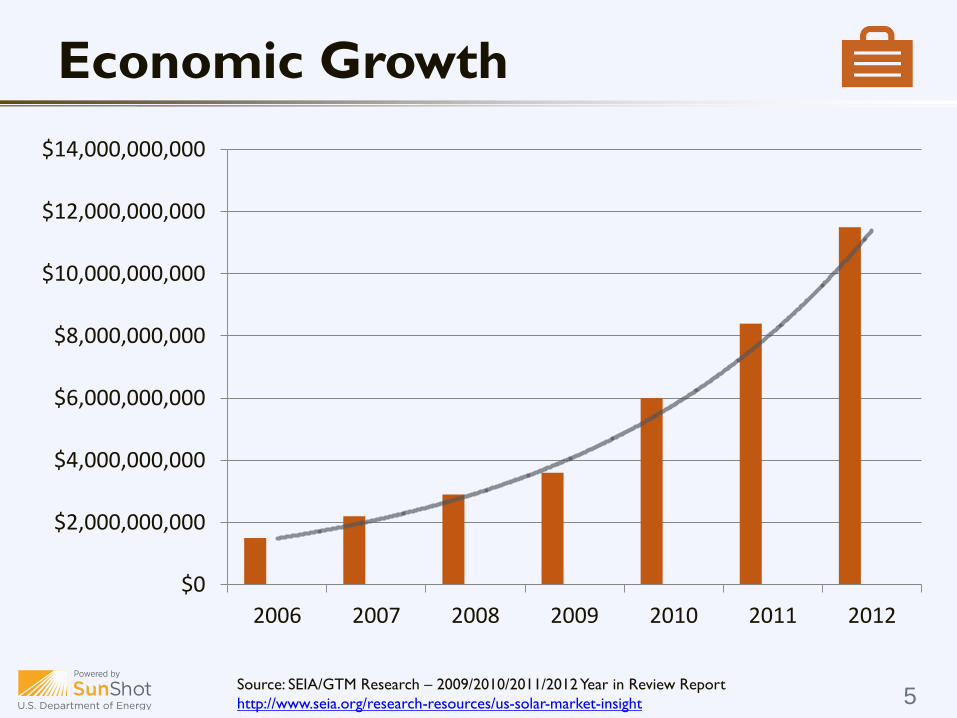
Economic Growth
Source: SEIA/GTM Research – 2009/2010/2011/2012 Year in Review Report
http://www.seia.org/research-resources/us-solar-market-insight 5
$0
$2,000,000,000
$4,000,000,000
$6,000,000,000
$8,000,000,000
$10,000,000,000
$12,000,000,000
$14,000,000,000
2006 2007 2008 2009 2010 2011 2012
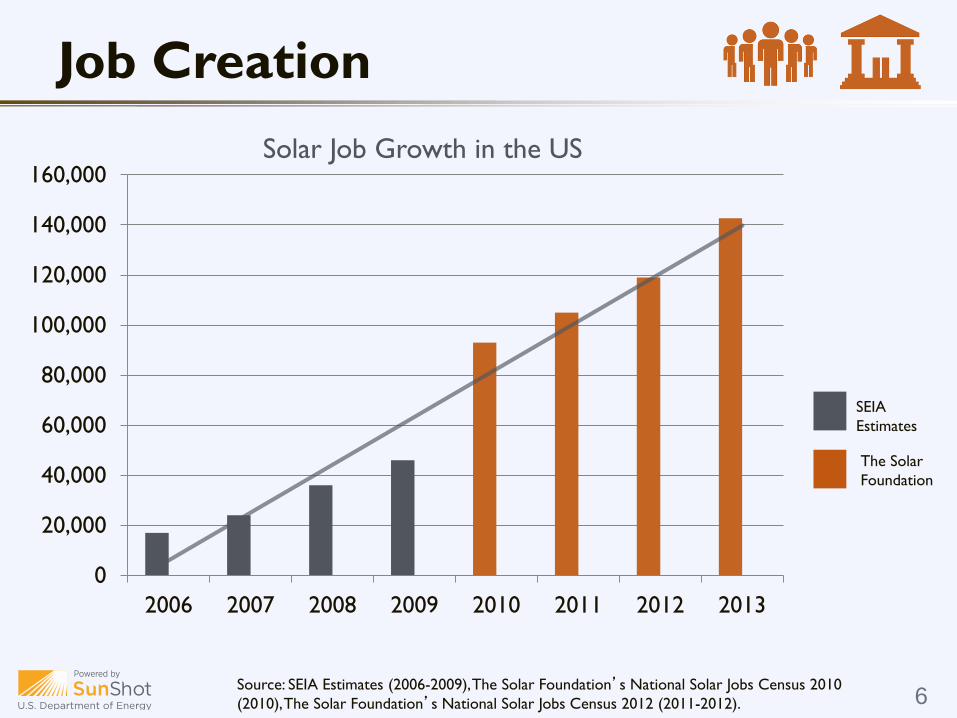
Job Creation
Source: SEIA Estimates (2006-2009), The Solar Foundation’s National Solar Jobs Census 2010
(2010), The Solar Foundation’s National Solar Jobs Census 2012 (2011-2012). 6
0
20,000
40,000
60,000
80,000
100,000
120,000
140,000
160,000
2006 2007 2008 2009 2010 2011 2012 2013
Solar Job Growth in the US
SEIA
Estimates
The Solar
Foundation

Job Creation
Sources: Interstate Renewable Energy Council, The Solar Foundation, Meister Consultants Group 7
0
10,000
20,000
30,000
40,000
50,000
0 500 1000 1500 2000 2500 3000
Num
ber
of So
lar
Jobs
Cumulative Installed Capacity (MW)
Correlation of Market Size & Jobs in Each State
90%
Correlatio
n
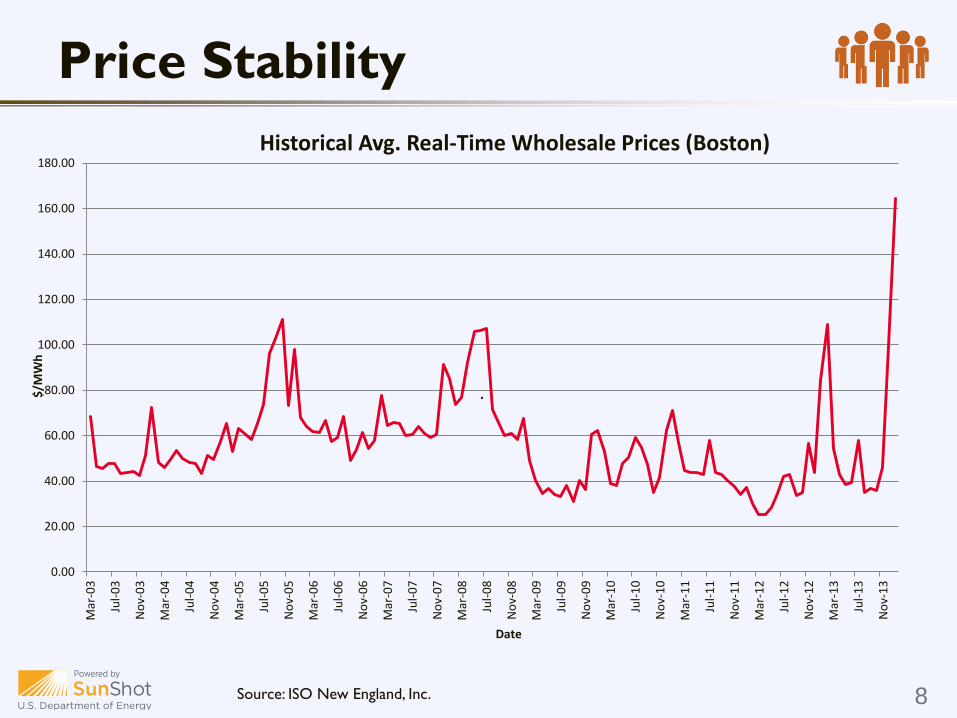
Price Stability
Source: ISO New England, Inc. 8
0.00
20.00
40.00
60.00
80.00
100.00
120.00
140.00
160.00
180.00
Mar
-03
Jul-
03
No
v-0
3
Mar
-04
Jul-
04
No
v-0
4
Mar
-05
Jul-
05
No
v-0
5
Mar
-06
Jul-
06
No
v-0
6
Mar
-07
Jul-
07
No
v-0
7
Mar
-08
Jul-
08
No
v-0
8
Mar
-09
Jul-
09
No
v-0
9
Mar
-10
Jul-
10
No
v-1
0
Mar
-11
Jul-
11
No
v-1
1
Mar
-12
Jul-
12
No
v-1
2
Mar
-13
Jul-
13
No
v-1
3
$/M
Wh
Date
Historical Avg. Real-Time Wholesale Prices (Boston)
.

Solar homes sold
20% fasterand for
17% morethan the equivalent non-solar homes
in surveyed California subdivisions
Smart Investment for Homes
Source: http://www.nrel.gov/docs/fy07osti/38304-01.pdf 9
From NREL:
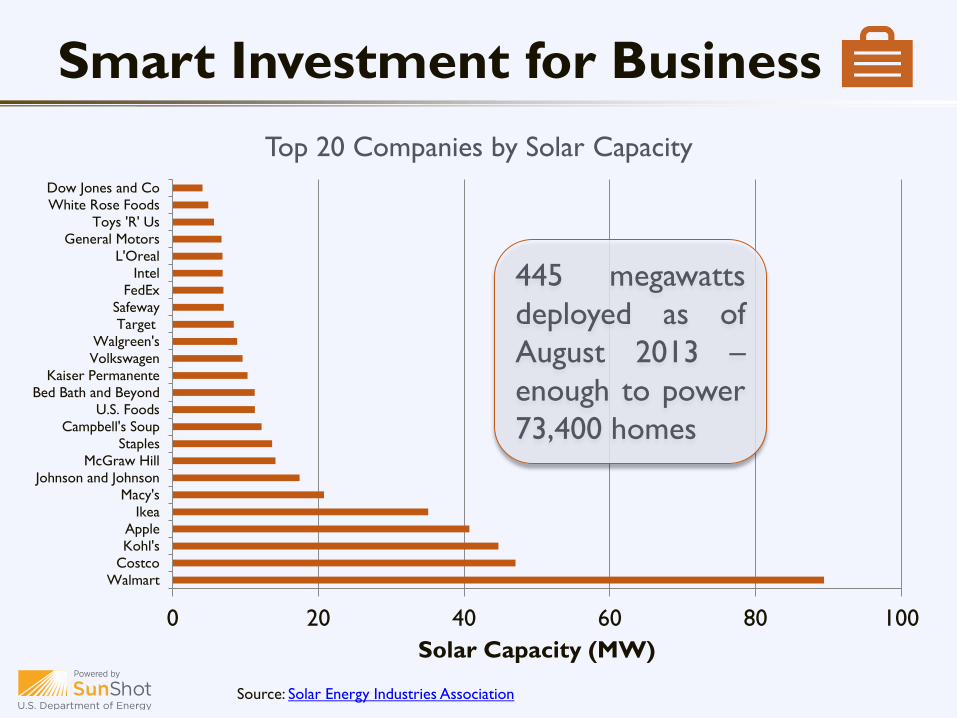
Smart Investment for Business
Source: Solar Energy Industries Association
0 20 40 60 80 100
Walmart
Costco
Kohl's
Apple
Ikea
Macy's
Johnson and Johnson
McGraw Hill
Staples
Campbell's Soup
U.S. Foods
Bed Bath and Beyond
Kaiser Permanente
Volkswagen
Walgreen's
Target
Safeway
FedEx
Intel
L'Oreal
General Motors
Toys 'R' Us
White Rose Foods
Dow Jones and Co
Solar Capacity (MW)
Top 20 Companies by Solar Capacity
445 megawatts
deployed as of
August 2013 –
enough to power
73,400 homes

Smart Investment for Gov’t
Source: Borrego Solar 11
Avoided Energy Purchases
Avoided T&D Line Losses
Avoided Capacity Purchases
Avoided T&D Investments
Fossil Fuel Price Impacts
Backup Power
Valuable to Utilities
12

Valuable to Utilities
Source: Renewable Energy World
2008
2012
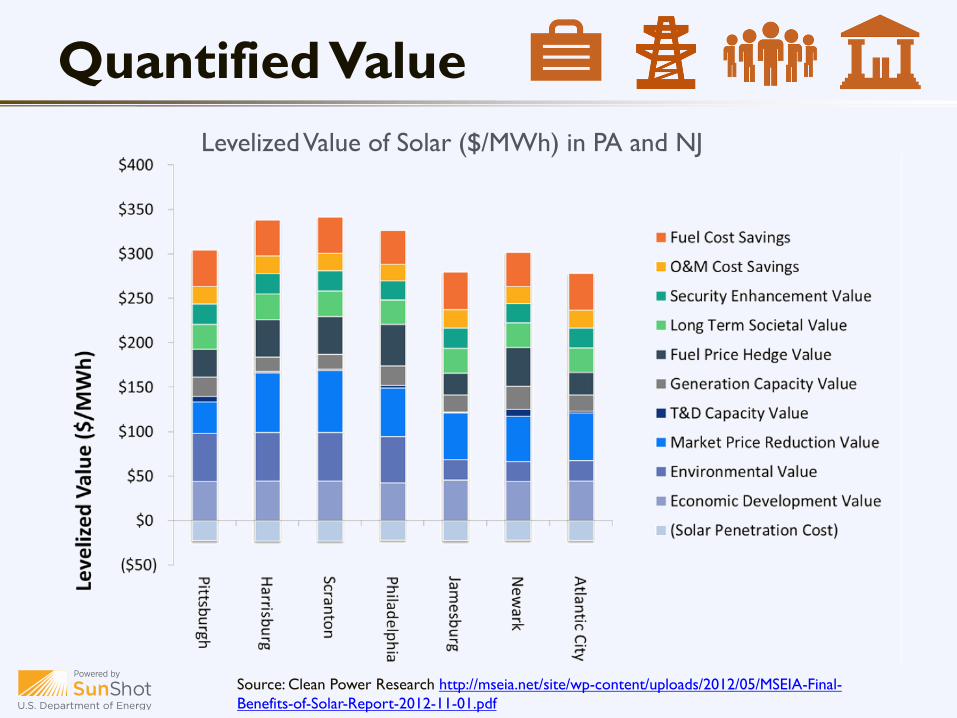
Quantified Value
Source: Clean Power Research http://mseia.net/site/wp-content/uploads/2012/05/MSEIA-Final-
Benefits-of-Solar-Report-2012-11-01.pdf
LevelizedValue of Solar ($/MWh) in PA and NJ
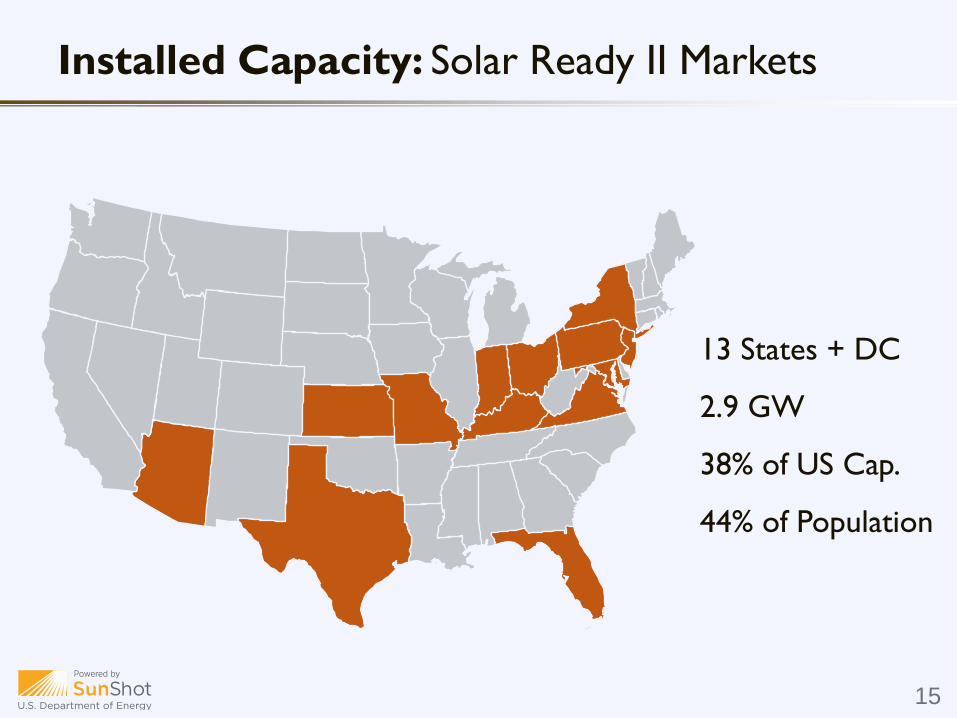
Installed Capacity: Solar Ready II Markets
15
13 States + DC
2.9 GW
38% of US Cap.
44% of Population

Installed Capacity: Solar Ready II Markets
16
0
200
400
600
800
1000
1200
Inst
alled
Cap
acit
y (
MW
)
Cumulative Installed Capacity (2011 - 2012)
Cumulative Installed Capacity 2012
Cumulative Installed Capcaity 2011
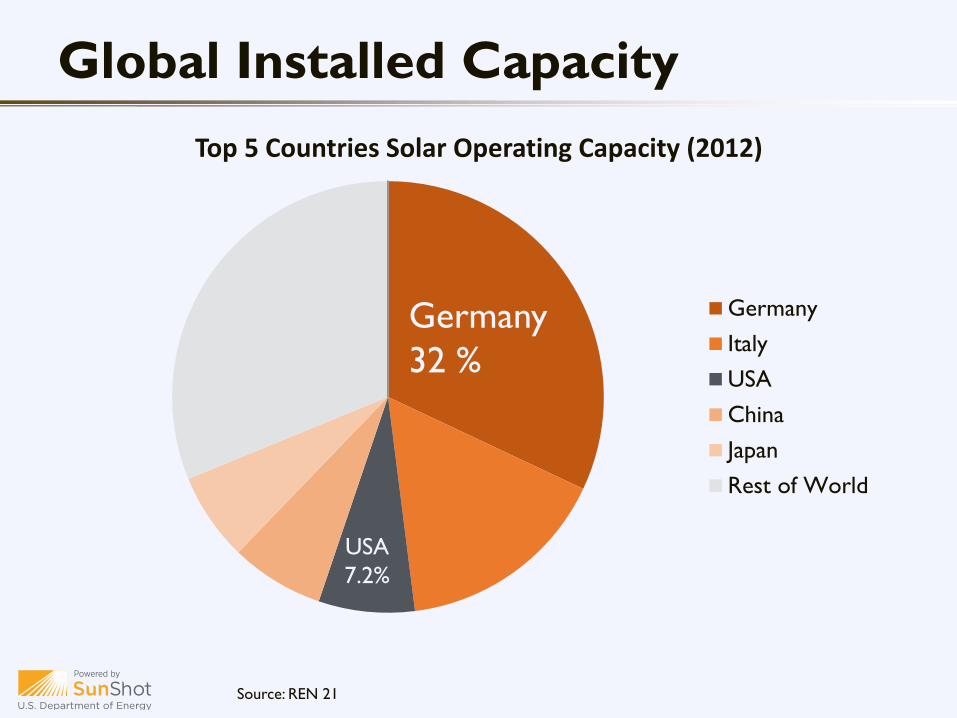
Global Installed Capacity
Source: REN 21
Top 5 Countries Solar Operating Capacity (2012)
Germany
Italy
USA
China
Japan
Rest of World
Germany
32 %
USA
7.2%

Global Installed Capacity per Capita
Source: REN 21, World Bank, Interstate Renewable Energy Council
0
50
100
150
200
250
300
350
400
450
Watt
s p
er
Cap
ita
400 Watts
Per Person
23 Watts
Per Person0.67 Watts
Per Person

Myth: It’s not sunny enough where I live
Source: National Renewable Energy Laboratory 19

Regional Workshop Surveys
Q: What is the greatest barrier to solar adoption in your community?

Survey Results: Barriers
0 50 100 150 200 250 300 350
High Upfront Cost & Low ROI
Lack of Information & Education
Unfriendly Policy Environment & Lack of Incentives
Local Zoning & Permitting
Utility Support
Aesthetics & Historic Preservation
Lack of Support from HOAs
Reliability Concerns
Environmental Impact
Other

The Cost of Solar PV
Tracking the Sun VI: The Installed Cost of Photovoltaics in the US from 1998-2012 (LBNL), GTM 22
$0
$2
$4
$6
$8
$10
$12
$14
1998 2012
Co
st p
er W
att
US Average Installed Cost for Behind-the-Meter Residential PV
36% drop in price2010 - 2013

The Cost of Solar in the US
Source: Solar Electric Power Association
Co
st o
f El
ect
rici
ty
Time
Solar Price
Retail Price
Wholesale Price
Stage 1
Today
Stage 2 Stage 3

Subsidies and Support
Source: Management Information Services, Inc. October 2011. 60 Years of Energy Incentives: Analysis of
Federal Expenditures for Energy Development; SEIA, May 1, 2012. Federal Energy Incentives Report. 24
0 50 100 150 200 250 300 350 400
Solar
Nuclear
Coal
Natural Gas
Oil
Value of Subsidies and Support ($ billions)
Subsidies for Conventional and Solar Energy, 1950-2010
$104 Billion
$73 Billion
$17 Billion
$369 Billion
$121 Billion

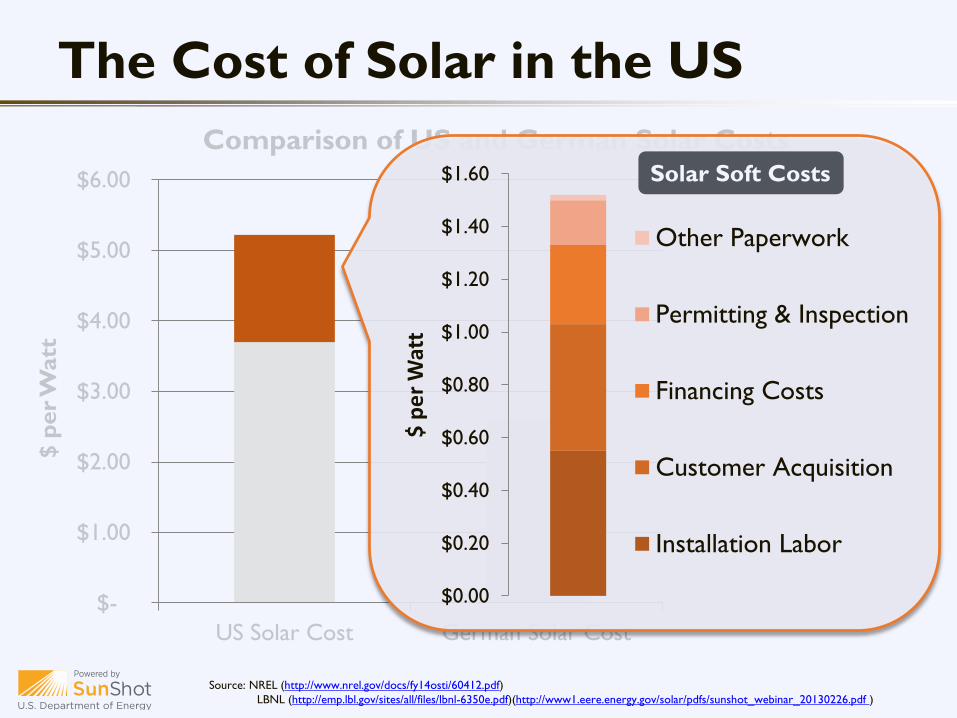
The Cost of Solar in the US
Source: NREL (http://www.nrel.gov/docs/fy14osti/60412.pdf)
LBNL (http://emp.lbl.gov/sites/all/files/lbnl-6350e.pdf)(http://www1.eere.energy.gov/solar/pdfs/sunshot_webinar_20130226.pdf )
$-
$1.00
$2.00
$3.00
$4.00
$5.00
$6.00
US Solar Cost German Solar Cost
$ p
er
Watt
Comparison of US and German Solar Costs
Non-Hardware Cost
Total Installed Cost

The Cost of Solar in the US
Source: NREL (http://www.nrel.gov/docs/fy14osti/60412.pdf)
LBNL (http://emp.lbl.gov/sites/all/files/lbnl-6350e.pdf)(http://www1.eere.energy.gov/solar/pdfs/sunshot_webinar_20130226.pdf )
$-
$1.00
$2.00
$3.00
$4.00
$5.00
$6.00
US Solar Cost German Solar Cost
$ p
er
Watt
Comparison of US and German Solar Costs
Non-Hardware Cost
Hardware Cost

The Cost of Solar in the US
$-
$1.00
$2.00
$3.00
$4.00
$5.00
$6.00
US Solar Cost German Solar Cost
$ p
er
Watt
Comparison of US and German Solar Costs
Non-Hardware Cost
Hardware Cost
Source: NREL (http://www.nrel.gov/docs/fy14osti/60412.pdf)
LBNL (http://emp.lbl.gov/sites/all/files/lbnl-6350e.pdf)(http://www1.eere.energy.gov/solar/pdfs/sunshot_webinar_20130226.pdf )

$-
$1.00
$2.00
$3.00
$4.00
$5.00
$6.00
US Solar Cost German Solar Cost
$ p
er
Watt
Comparison of US and German Solar Costs
Column1
Non-Hardware Cost
Hardware Cost
The Cost of Solar in the US
Profits, Taxes, &
Overhead
Source: NREL (http://www.nrel.gov/docs/fy14osti/60412.pdf)
LBNL (http://emp.lbl.gov/sites/all/files/lbnl-6350e.pdf)(http://www1.eere.energy.gov/solar/pdfs/sunshot_webinar_20130226.pdf )
$-
$1.00
$2.00
$3.00
$4.00
$5.00
$6.00
US Solar Cost German Solar Cost
$ p
er
Watt
Comparison of US and German Solar Costs
Column1
Non-Hardware Cost
Hardware Cost
The Cost of Solar in the US
$0.00
$0.20
$0.40
$0.60
$0.80
$1.00
$1.20
$1.40
$1.60
$ p
er
Wat
t
Other Paperwork
Permitting & Inspection
Financing Costs
Customer Acquisition
Installation Labor
Solar Soft Costs
Source: NREL (http://www.nrel.gov/docs/fy14osti/60412.pdf)
LBNL (http://emp.lbl.gov/sites/all/files/lbnl-6350e.pdf)(http://www1.eere.energy.gov/solar/pdfs/sunshot_webinar_20130226.pdf )
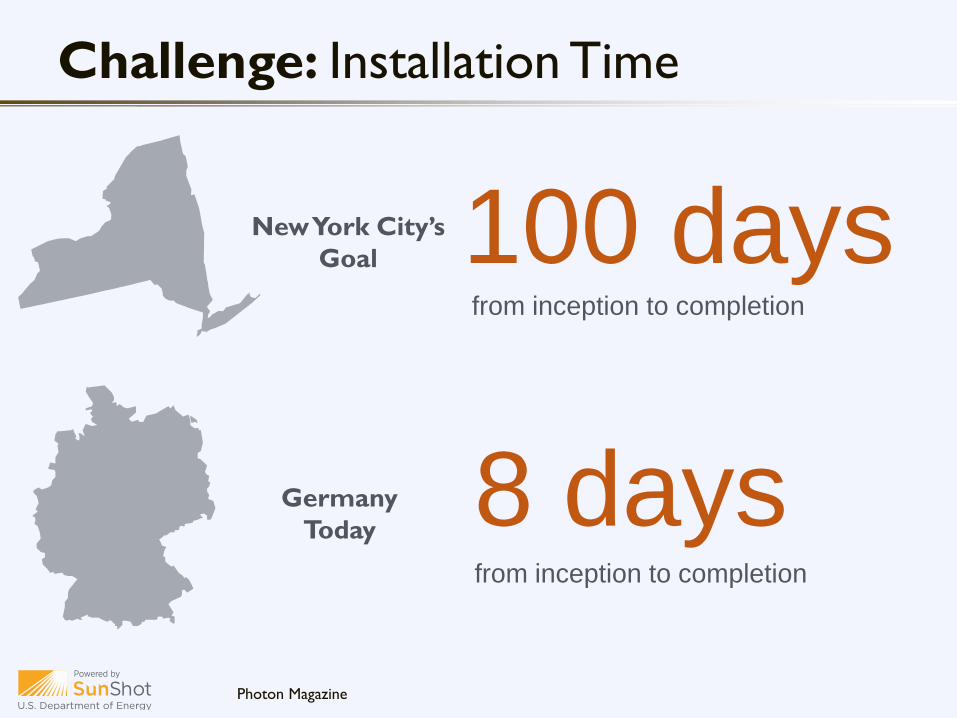
Challenge: Installation Time
Photon Magazine
8 daysfrom inception to completion
Germany
Today
New York City’s
Goal 100 daysfrom inception to completion
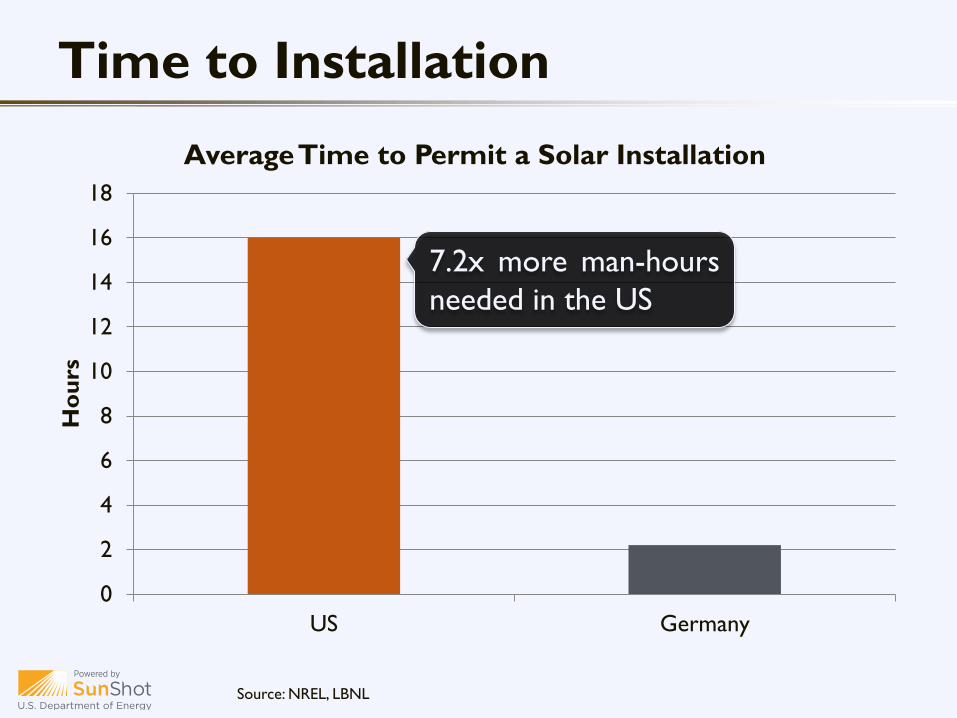
0
2
4
6
8
10
12
14
16
18
US Germany
Ho
urs
Average Time to Permit a Solar Installation
Time to Installation
Source: NREL, LBNL
7.2x more man-hours
needed in the US

Permitting Costs
Source: NREL, LBNL
$-
$0.05
$0.10
$0.15
$0.20
$0.25
US Germany
Co
st p
er
Watt
Average Cost of Permitting in the US and Germany
21x the cost for
permitting in the
US
Consistency and Transparency
through
Standardized Processes
Germany’s Success
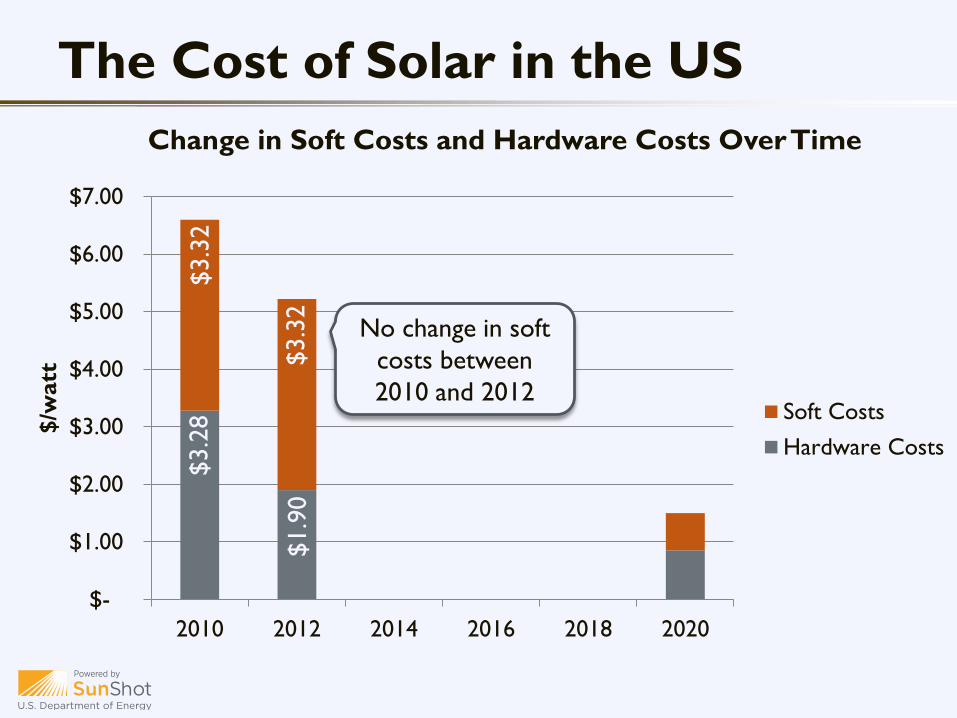
The Cost of Solar in the US
$-
$1.00
$2.00
$3.00
$4.00
$5.00
$6.00
$7.00
2010 2012 2014 2016 2018 2020
$/w
att
Change in Soft Costs and Hardware Costs Over Time
Soft Costs
Hardware Costs
$3.3
2
$3.3
2
$3.2
8
$1.9
0
No change in soft
costs between
2010 and 2012

Enable local governments to replicate
successful solar practices to reduce soft
costs and expand local adoption of solar
energy
Program Goal

Solar Ready Roadmap
36
PlanningZoning Code Improvements
Enable Solar Access
Building Code Improvements
ProcessPermitting Process
ImprovementsPermit Fees
Prequalify Installers
Financing & Solar
Adoption
Distribute Cost Survey to Installers
Engage Local Lenders
Enact a Solarize Program
Step 1 Step 2 Step 3


