
Solar Spectral Irradiance:Solar Spectral Irradiance:Users, Applications, ModelsUsers, Applications, Models
Judith LeanNaval Research Laboratory, Washington DC
MotivationMotivation- atmospheric, surface and ocean transmission, reflection, scattering and absorption are all wavelength dependent
- solar radiative forcing is spatially and altitudinally dependent
Users and ApplicationsUsers and Applications- inputs for model simulations of present and past climate and atmospheric processes and variability
Spectral Irradiance Variability ModelSpectral Irradiance Variability Model- wavelength-dependent sunspot and facular influences
SORCE Irradiance ObservationsSORCE Irradiance Observations- SIM and SOLSTICE TIM (thanks to Jerry H. for sending SIM data)
- comparison with models

Global Heat FlowsGlobal Heat Flows
Kiehl and Trenberth, 1997
5880 K 4 K
SUN (255 K)+GHG (33 K)=288 K

Incoming Solar RadiationIncoming Solar Radiation
cycle 21max
cycle 22max
341.5 Wm-2
= 1366/4
SOHO: 1996
ACRIMSAT: 1999
SORCE: 2003

StratosphereStratosphere
unit
optical
depth
UV radiation( < 315 nm)
20 Wm-2Sun
Solar Radiative Processes Depend onSolar Radiative Processes Depend on
Geography Geography andand AltitudeAltitude
near UV,VIS,IR Radiation
( > 315 nm)1346 Wm-2
ozone
cloud cover

Spectral Irradiance Users & ApplicationsSpectral Irradiance Users & Applications
1975-2000
monthly
1882-2000
monthly
1976-2005
daily
1976-2004
monthly
1880-2005
monthly
Time Period
Cadence
117-100,000 nm
190 bins
David RindNASA/GISS
GCM simulations
120-735 nm
134 bins
Don WuebblesUniv. Illinois
Strat. model
116-735 nm
171 bins
Kunihiko KoderaMRI, Tskuba, Japan
Strat.-climate model
121-850 nm
203 bins
David LaryNASA/GSFC
AutoChem
202-100,000 nm
18 bins
V. RamaswamyNOAA/GFDL
GCM simulations
Wavelength Range
Number of Bins
User
Application

Climate ModelsClimate Models
Hansen et al., JGR, 2002
117-100,000 nm190 bands

Lary, DJ, Halogens and the chemistry of the free
troposphere, Atmospheric Chemistry And Physics,
5, 227-237, 2005.
Atmospheric ChemistryAtmospheric ChemistryModeling andModeling andAssimilation:Assimilation:AutoChemAutoChemCDACentralCDACentral
121-859 nm203 bands

Solar Irradiance Variability Models: Solar Irradiance Variability Models: TotalTotal
- faculae
- sunspots
Fröhlich & Lean, Astron. Astrophys. Rev., 2004
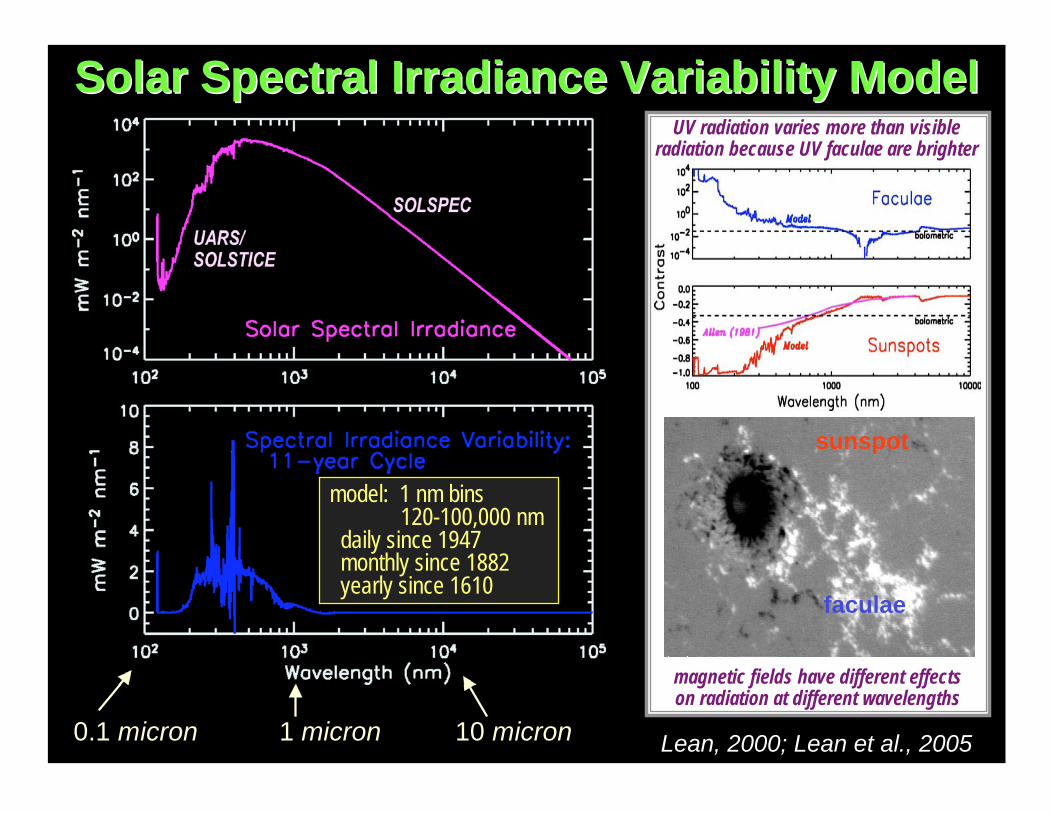
0.1 micron 1 micron 10 micron
magnetic fields have different effectson radiation at different wavelengths
sunspot
faculae
UV radiation varies more than visibleradiation because UV faculae are brighter
Solar Spectral Irradiance Variability ModelSolar Spectral Irradiance Variability Model
Lean, 2000; Lean et al., 2005
UARS/SOLSTICE
SOLSPEC
model: 1 nm bins 120-100,000 nm daily since 1947 monthly since 1882 yearly since 1610

Reconstructed Historical Solar IrradianceReconstructed Historical Solar Irradiance
0.075%
0.2%
Flux transport simulations suggest that
accumulated total magnetic flux produces a
smaller facular contribution to secular irradiance
change than in previous reconstructions
Since the Maunder Minimum: total irradiance increase = 1.1 Wm-2
climate forcing = 0.2 Wm-2
surface temperature increase = 0.1-0.2oC ( = 0.5-1oC per Wm-2)
Wang et al., ApJ, 2005
Solar Spectral Irradiance
Lean et al., Sol. Phys., 2005

Solar Irradiance Validation: Solar Irradiance Validation: TotalTotal
17 O
CT
03
30 O
CT
03
Lean et al., Solar Phys., 2005
-0.069(0.005%)
0.96341.003650.4791365.95Model
-0.191(0.014%)
0.99671.004230.5771366.73SARR
-0.261(0.019%)
0.98291.003750.5821366.09ACRIM
-0.134(0.010%)
0.99641.003510.5731365.76PMOD
-0.182(0.013%)
110.5791360.98TIM
Slope(W m-2 per
year)
Correlationwith TIM
Ratio toTIM
StandardDeviation(W m-2)
MeanValue
(W m-2)
TSIRecord
Irradiance variability model derived
from multiple regression of sunspot
and facular indices with the PMOD
composite underestimates the TSI
variance observed by SORCE/TIM

Solar SpectralSolar SpectralIrradiance Irradiance Validation:Validation:
UV/Vis/IRUV/Vis/IR
17 OCT 03 30 OCT 03
1.000250.99820.99801000-1600
1.00040.99750.9979700-1000
1.00080.99670.9965400-700
1.0020.99560.9959315-400
1.0130.99930.9990200-300
ModelSolarCycle
1989/1986
ModelRotation
30 Oct 2003/17 Oct 2003
SORCERotation
30 Oct 2003/17 Oct 2003
SpectralBand(nm)
//

TSI Model from TIM Multiple RegressionTSI Model from TIM Multiple Regression
Variance is increased in irradiance
variability model derived from multiple
regression of sunspot and facular
indices with TIM data, relative to
model derived from PMOD composite
0.448
0.385
0.463Standard
Deviation
(Wm-2)
-0.125
-0.135
-0.150Slope
(Wm-2yr-1)
1360.9
1365.84
1360.9Mean
(Wm-2)
TIM Model
PMOD Model
TIM
common TSI data2003.17-2006

Comparison of PMOD and TIM ModelsComparison of PMOD and TIM Models

New UV/Vis/IR Spectral IrradianceNew UV/Vis/IR Spectral IrradianceVariability Variability ModelModel
integral of sunspot blocking andfacular brightening match thebolometric (total) values derivedfrom the multiple regression of TIMdata
- bolometric sunspot contrast 0.43
integral of sunspot blocking andfacular brightening match thebolometric (total) values derivedfrom the multiple regression ofPMOD composite data
- bolometric sunspot contrast 0.36
wavelength-dependent sunspot and
facular contrasts are consistent
with rotational modulation
measured by SIM and SOLSTICE
( < 1600 nm) and from Unruh
theoretical model ( > 1600 nm)
wavelength-dependent sunspot and
facular contrasts are consistent
with rotational modulation
measured by UARS SOLSTICE
( < 400 nm) and from Unruh
theoretical model ( > 400 nm)
reference (quiet Sun) spectrum
consistent with SIM and SOLSTICE
reference (quiet Sun) spectrum from
UARS/SOLSTICE and SOLSPEC
New Model
(from SORCE data)
Current Model

SORCE vs. Modeled VariabilitySORCE vs. Modeled VariabilitySORCE
Lean (2000)new model

SORCE vs. Modeled Spectral IrradianceSORCE vs. Modeled Spectral Irradiance

SORCE solar irradiance spectra are helpingSORCE solar irradiance spectra are helpinganswer the Sun-climate questions:answer the Sun-climate questions:
- how and why does climate respond to wavelength-dependentirradiance variations?
- are solar-induced surface temperature changes limited to 0.1-0.2oC?
- what are the roles of land, atmosphere and oceans in directsurface heating?
- what are the indirect effects of radiative and dynamical verticalatmospheric couplings?
- does solar forcing induce mode amplification (ENSO, QBO),stochastic resonance, frequency modulation, triggering alteredstability states (AO, AAO)?
- mechanisms for significant hydrological cycle responses?
- how and why does solar irradiance vary?
- what are the mechanisms of irradiance variability?
- are long-term changes occurring in addition to the 11-year cycle?

Construction of a Solar Spectral IrradianceConstruction of a Solar Spectral IrradianceVariability Model from SORCE dataVariability Model from SORCE data
SOLSTICE B V5 (115.5 -179.5 nm)
SOLSTICE A V5 (180.5 – 309.5 nm
SIM V9 UV (201.5 – 306.5 nm)
SIM V9 VIS1 (310.5 – 955.5 nm)
SIM V9 VIS2 (338.5 – 1071.5 nm)
SIM V9 IR (849.5 – 1664.5 nm)
1 nm grid (on 0.5 nm centers) from 115 to 1600 nm
daily mean time series from April 2004 – 2006 F( ,t)
bolometric sunspot and faculae time series from TIM TSI model, Ps(t) Pf(t)All time series smoothed twice with ±40-day squarewave
- detrended by converting to fractional changes
Fd=(F( ,t)- Fs( ,t))/ Fa( )
Multiple linear regression performed for detrended spectral irradiance time
series at each Fd=a0( )+ a1( ) Pfd(t)+a2 ( ) Psd(t)
Irradiance model calculated from proxies byFm( ,t)=(a0( )+ a1( ) (Pf(t)-Pfa)/Pfa+a2 ( ) (Ps(t)-Psa)/Psa)
Fa( ,t)+Fa( ,t)


