
Solar Thermal Marketsin Europe

Solar Thermal Markets in Europe Trends and Market Statistics 2011
Table of contents
Editorial
Robin M. Welling
President of ESTIF
What have we achieved for the European solar thermal industry in 2011?
ESTIF a very successful ESTEC 2011 conference
ESTIF the
CE marking in both the Construction Product Directive and the
Pressure Equipment Directive for our products
ESTIF
energy labelling of space and water heating appliances
ESTIF the work of the solar thermal panel of the
RHC-Platform
ESTIF to several European projects
of great value for the solar thermal industry QAiST
project dealing with standardisation, QualiCert project in
connection with the certification of installers
European Solar Days, the reference grassroots campaign now
involving 20 European countries
ESTIF entered into collaboration with the IEA Solar Heating
and Cooling Programme
International Energy Agency Solar Heating and Cooling Roadmap
ESTIF
area to energy
model for converting the installed solar thermal collector area into
energy actually produced
ESTIF collaborated with the Global Solar Water Heating Development
Programme
ESTIF several events, conferences and
workshops involving the European Institutions, to promote
solar thermal
European Solar Thermal Industry Federation (ESTIF)
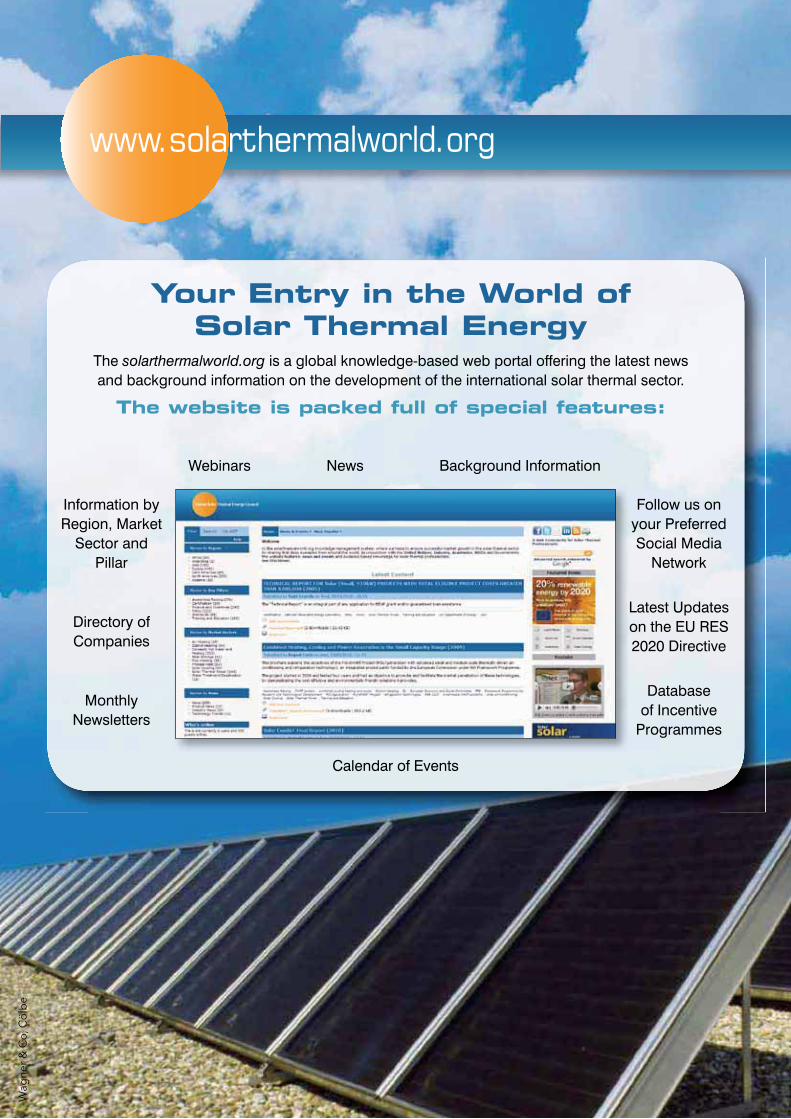
www.solarthermalworld.org
Wag
ner
& C
o, C
ölb
e

Solar Thermal Markets in EU 27 and Switzerland (glazed collectors)
0
500 000
1 000 000
1 500 000
2 000 000
2 500 000
3 000 000
3 500 000
Germany Next top 6 countries (AT, ES, FR, GR, IT, PL)Other 20 EU countries and Switzerland
5 000 000
4 000 000
3 000 000
2 000 000
1 000 000
0
Solar Thermal Market in EU 27 and Switzerland (Glazed Collectors)kWth m2
© ESTIF 2012
2000 2001 2002 2003 2004 2005 2006 2007 2008 2009 2010 2011
Germany
Solar Thermal Market in Germany Newly Installed Capacity - Glazed CollectorskWth m2
© ESTIF 2012
2002 2003 2004 2005 2006 2007 2008 2009 2010 20110
200 000
400 000
600 000
800 000
1 000 000
1 200 000
1 400 000
1 600 000
2 000 000
1 500 000
1 000 000
500 000
0

Solar Thermal Markets in Europe Trends and Market Statistics 2011
2002 2003 2004 2005 2006 2007 2008 2009 2010 2011
Solar Thermal Market in Italy Newly Installed Capacity - Glazed CollectorskWth m2
0
50 000
100 000
150 000
200 000
250 000
300 000
350 000
© ESTIF 2012
500 000
400 000
300 000
200 000
100 000
0
2001 2002 2003 2004 2005 2006 2007 2008 2009 2010 20110
50 000
100 000
150 000
200 000
250 000
300 000
350 000
Newly Installed Capacity for Markets Between 200 000 and 500 000 m²
© ESTIF 2012
500 000
400 000
300 000
200 000
100 000
0
kWth m2
Italy Spain Austria Poland France Greece
Solar Thermal Markets between 200 000 and 500 000 m²
Italy
Spain
2002 2003 2004 2005 2006 2007 2008 2009 2010 2011
Solar Thermal Market in Spain Newly Installed Capacity - Glazed Collectors
kWth m2
0
50 000
100 000
150 000
200 000
250 000
300 000
350 000
© ESTIF 2012
500 000
400 000
300 000
200 000
100 000
0
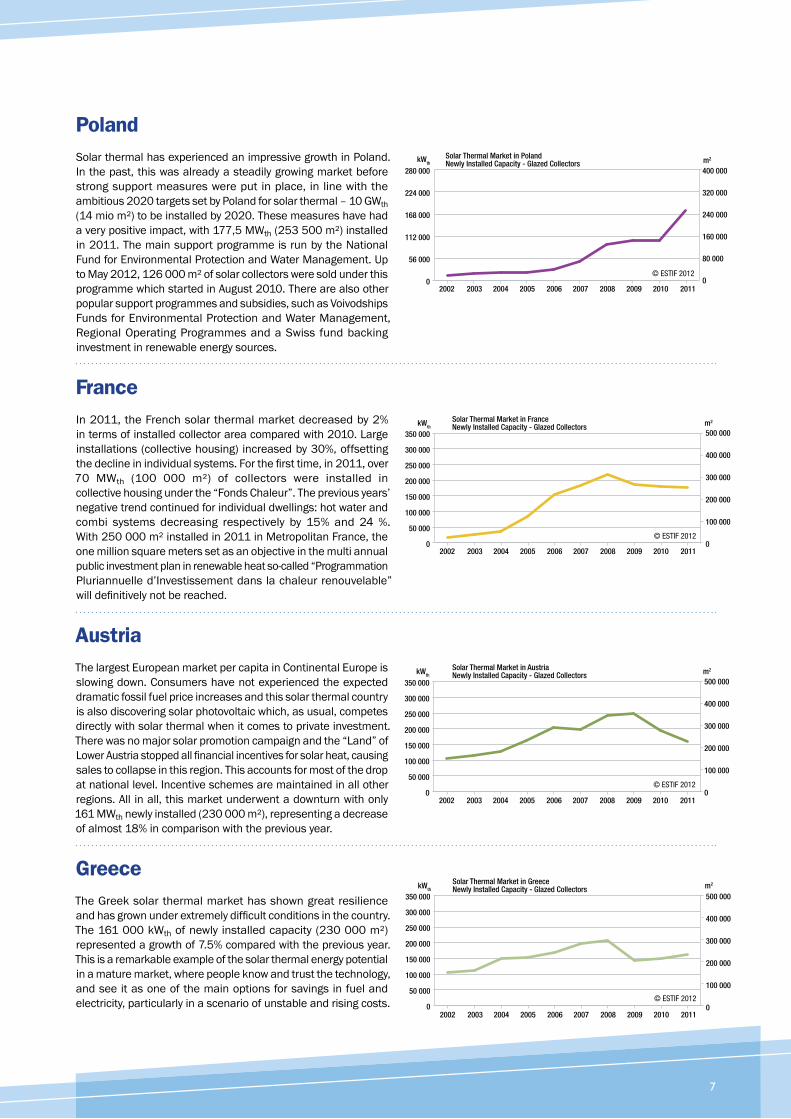
Poland
France
Austria
Greece
2002 2003 2004 2005 2006 2007 2008 2009 2010 2011
Solar Thermal Market in Austria Newly Installed Capacity - Glazed CollectorskWth m2
0
50 000
100 000
150 000
200 000
250 000
300 000
350 000
© ESTIF 2012
500 000
400 000
300 000
200 000
100 000
0
2002 2003 2004 2005 2006 2007 2008 2009 2010 2011
Solar Thermal Market in France Newly Installed Capacity - Glazed CollectorskWth m2
0
50 000
100 000
150 000
200 000
250 000
300 000
350 000
© ESTIF 2012
500 000
400 000
300 000
200 000
100 000
0
2002 2003 2004 2005 2006 2007 2008 2009 2010 2011
Solar Thermal Market in Greece Newly Installed Capacity - Glazed CollectorskWth m2
0
50 000
100 000
150 000
200 000
250 000
300 000
350 000
© ESTIF 2012
500 000
400 000
300 000
200 000
100 000
0
0
56 000
112 000
168 000
224 000
280 000
© ESTIF 2012
Solar Thermal Market in Poland Newly Installed Capacity - Glazed Collectors
400 000
320 000
240 000
160 000
80 000
0
kWth m2
2002 2003 2004 2005 2006 2007 2008 2009 2010 2011
Solar Thermal Markets in Europe Trends and Market Statistics 2011
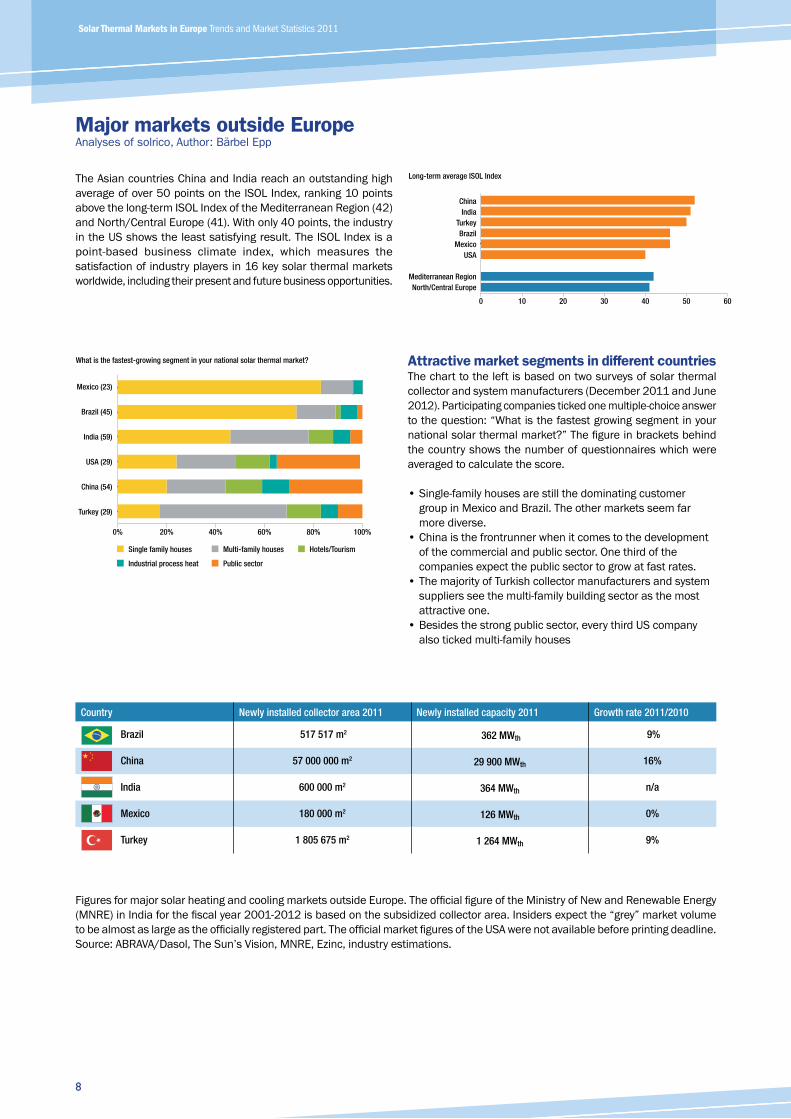
Major markets outside EuropeAnalyses of solrico, Author: Bärbel Epp
Attractive market segments in different countries
Long-term average ISOL Index
ChinaIndia
TurkeyBrazil
MexicoUSA
Mediterranean RegionNorth/Central Europe
0 10 20 30 40 50 60
What is the fastest-growing segment in your national solar thermal market?
Mexico (23)
Brazil (45)
India (59)
USA (29)
China (54)
Turkey (29)
0% 20% 40% 60% 80% 100%
Single family houses Multi-family houses Hotels/Tourism
Industrial process heat Public sector
Country Newly installed collector area 2011 Newly installed capacity 2011 Growth rate 2011/2010
Brazil 517 517 m2 362 MWth 9%
China 57 000 000 m2 29 900 MWth 16%
India 600 000 m2 364 MWth n/a
Mexico 180 000 m2 126 MWth 0%
Turkey 1 805 675 m2 1 264 MWth 9%

Forecast Index June 2012
Forecast 2012: no great changes expected
The European Technology Platform on Renewable Heating & Cooling (RHC-Platform)
brings together stakeholders from the solar thermal, biomass and geothermal sector.
The objective of the RHC-Platform is to encourage the use of renewable energy
technologies for heating and cooling by maximizing synergies and strengthening
efforts towards research, development and technological innovation to consolidate
Europe’s leading position in the sector. In May 2011, the RHC-Platform published its
“Common Vision” which is now complemented by the “Strategic Research Priorities
for Solar Thermal Technology”.
This new publication describes the potential of solar thermal, as well as the
technological requirements and R&D priorities needed to facilitate the greater
deployment of solar thermal in multiple market segments.
Membership is free! Join the Platform today and become part
of the community!
www.rhc-platform.org
You want more information on the RHC-Platform? Check page 17 of this brochure!
Strategic Research Priorities for Solar Thermal Technology
European Technology Platform on Renewable Heating and Cooling
The Secretariat of the European Technology Platform on Renewable Heating and Cooling
is financially supported by the 7th Framework Programme of the European Commission (GA n. 268205).
Turkey -2%Mexico -2%USA -4%
Global average -9%
Brazil +4%India +4%
European Technology Platform
RenewableHeating & Cooling
Strategic Research Priorities for Solar Thermal Technology
The presented results are taken from the latest ISOL Navigator study published in June 2012.
Further information: www.solrico.com

Solar Thermal Markets at a Glance Data for 2011
Solar Thermal Markets in Europe Trends and Market Statistics 2011
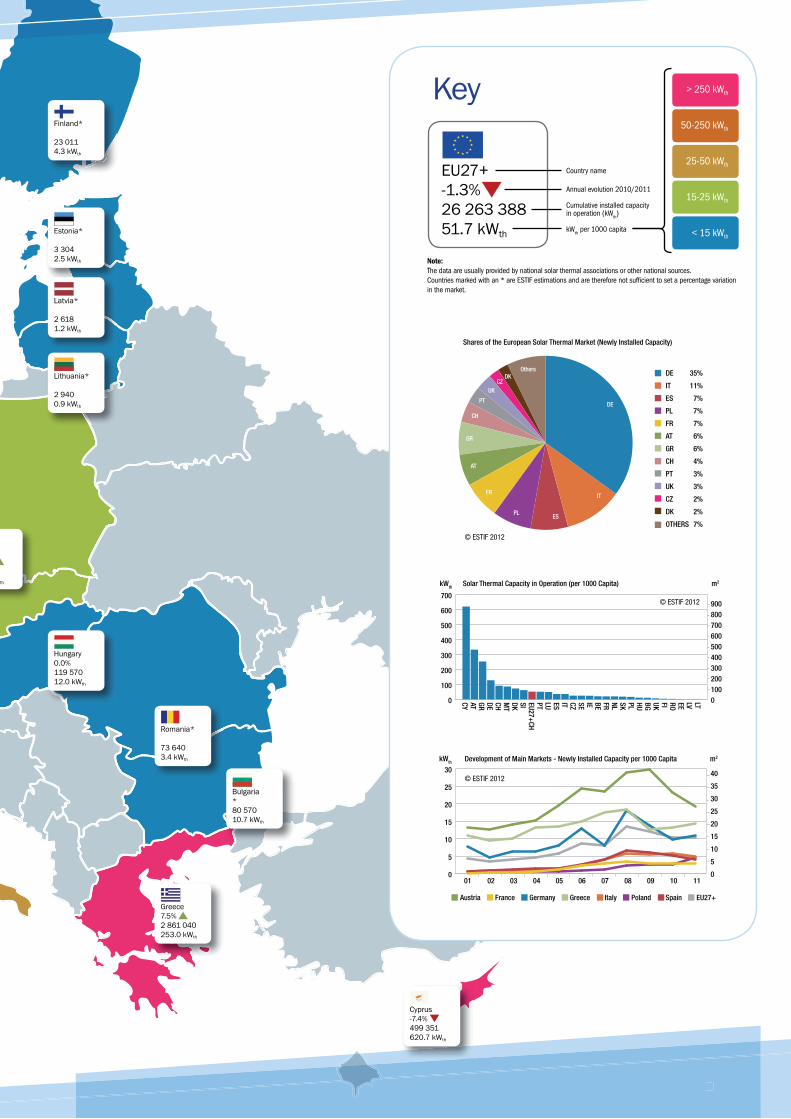
Key
0
100
200
300
400
500
600
700
LTLVEEROFIUKBGHUPLSKNLFRBEIESECZITESLUPTEU27+CH
SIDKMT
CHDEGRATCY
Solar Thermal Capacity in Operation (per 1000 Capita)
© ESTIF 2012 9008007006005004003002001000
kWth m2
DE 35%
IT 11%
ES 7%
PL 7%
FR 7%
AT 6%
GR 6%
CH 4%
PT 3%
UK 3%
CZ 2%
DK 2%
OTHERS 7%
Shares of the European Solar Thermal Market (Newly Installed Capacity)
DE
AT
PLES
FR IT
CH
PT
UK
Others
GR
© ESTIF 2012
CZDK
0
5
10
15
20
25
30
Development of Main Markets - Newly Installed Capacity per 1000 CapitakWth m2
40
35
30
25
20
15
10
5
0
Austria France Germany Greece Italy Poland Spain EU27+
© ESTIF 2012
01 02 03 04 05 06 07 08 09 10 11
Country name
Annual evolution 2010/2011
Cumulative installed capacityin operation (kW
th)
kWth per 1000 capita
Note:The data are usually provided by national solar thermal associations or other national sources.
Countries marked with an * are ESTIF estimations and are therefore not sufficient to set a percentage variation
in the market.
> 250 kWth
50-250 kWth
25-50 kWth
15-25 kWth
< 15 kWth
Solar Thermal Markets in Europe Trends and Market Statistics 2011
European Solar Thermal Industry Federation (ESTIF)Renewable Energy HouseRue d’ Arlon 63-67B-1040 BrusselsBelgiumTel: +32 2 546 19 38Fax: +32 2 546 19 [email protected]
* Countries in dark grey have already organized Solar Days events
Visit the website www.solardays.eu and get all the information you need!
For a bright FutureEuropean Solar Days
EuropeanSolarDaysSpreading the message across Europe
Want to know more? Contact ESTIF, the project coordinator:
THE NEXT CAMPAIGN IS SCHEDULED FOR
1-19 May 2013
The number of events and participants is growing each year!
In 2011 over 8000 events attended by half a million people in 19 countries!
Join the campaign and get involved by organizing or attending an event!
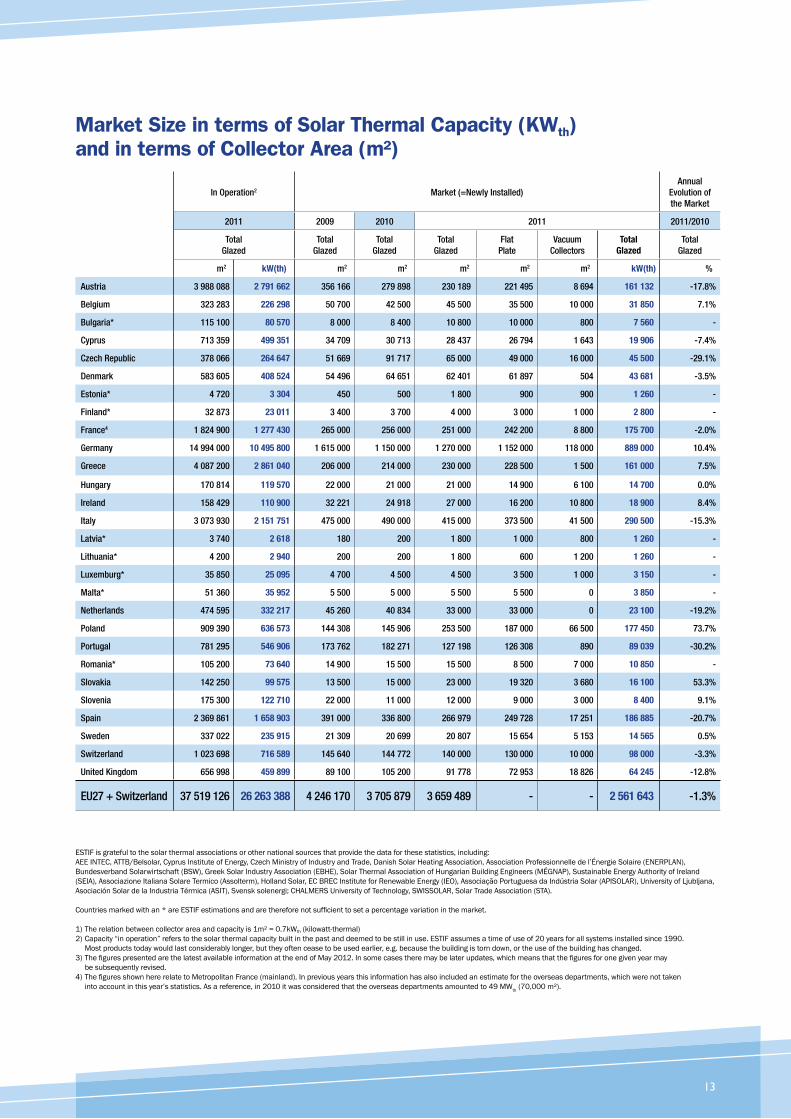
Market Size in terms of Solar Thermal Capacity (KWth) and in terms of Collector Area (m²)
In Operation2 Market (=Newly Installed)Annual
Evolution of the Market
2011 2009 2010 2011 2011/2010
Total Glazed
Total Glazed
Total Glazed
Total Glazed
Flat Plate
Vacuum Collectors
Total Glazed
Total Glazed
m2 kW(th) m2 m2 m2 m2 m2 kW(th) %
Austria 3 988 088 2 791 662 356 166 279 898 230 189 221 495 8 694 161 132 -17.8%
Belgium 323 283 226 298 50 700 42 500 45 500 35 500 10 000 31 850 7.1%
Bulgaria* 115 100 80 570 8 000 8 400 10 800 10 000 800 7 560 -
Cyprus 713 359 499 351 34 709 30 713 28 437 26 794 1 643 19 906 -7.4%
Czech Republic 378 066 264 647 51 669 91 717 65 000 49 000 16 000 45 500 -29.1%
Denmark 583 605 408 524 54 496 64 651 62 401 61 897 504 43 681 -3.5%
Estonia* 4 720 3 304 450 500 1 800 900 900 1 260 -
Finland* 32 873 23 011 3 400 3 700 4 000 3 000 1 000 2 800 -
France4 1 824 900 1 277 430 265 000 256 000 251 000 242 200 8 800 175 700 -2.0%
Germany 14 994 000 10 495 800 1 615 000 1 150 000 1 270 000 1 152 000 118 000 889 000 10.4%
Greece 4 087 200 2 861 040 206 000 214 000 230 000 228 500 1 500 161 000 7.5%
Hungary 170 814 119 570 22 000 21 000 21 000 14 900 6 100 14 700 0.0%
Ireland 158 429 110 900 32 221 24 918 27 000 16 200 10 800 18 900 8.4%
Italy 3 073 930 2 151 751 475 000 490 000 415 000 373 500 41 500 290 500 -15.3%
Latvia* 3 740 2 618 180 200 1 800 1 000 800 1 260 -
Lithuania* 4 200 2 940 200 200 1 800 600 1 200 1 260 -
Luxemburg* 35 850 25 095 4 700 4 500 4 500 3 500 1 000 3 150 -
Malta* 51 360 35 952 5 500 5 000 5 500 5 500 0 3 850 -
Netherlands 474 595 332 217 45 260 40 834 33 000 33 000 0 23 100 -19.2%
Poland 909 390 636 573 144 308 145 906 253 500 187 000 66 500 177 450 73.7%
Portugal 781 295 546 906 173 762 182 271 127 198 126 308 890 89 039 -30.2%
Romania* 105 200 73 640 14 900 15 500 15 500 8 500 7 000 10 850 -
Slovakia 142 250 99 575 13 500 15 000 23 000 19 320 3 680 16 100 53.3%
Slovenia 175 300 122 710 22 000 11 000 12 000 9 000 3 000 8 400 9.1%
Spain 2 369 861 1 658 903 391 000 336 800 266 979 249 728 17 251 186 885 -20.7%
Sweden 337 022 235 915 21 309 20 699 20 807 15 654 5 153 14 565 0.5%
Switzerland 1 023 698 716 589 145 640 144 772 140 000 130 000 10 000 98 000 -3.3%
United Kingdom 656 998 459 899 89 100 105 200 91 778 72 953 18 826 64 245 -12.8%
EU27 + Switzerland 37 519 126 26 263 388 4 246 170 3 705 879 3 659 489 - - 2 561 643 -1.3%

Solar Thermal Markets in Europe Trends and Market Statistics 2011
2001 2002 2003 2004 2005 2006 2007 2008 2009 2010 20110
20 000
40 000
60 000
80 000
100 000
120 000
140 000
© ESTIF 2012
Newly Installed Capacity for Markets Below 200 000 m²
200 000
160 000
120 000
80 000
40 000
0
kWth m2
Czech Republic Denmark Portugal Switzerland UK
0
20 000
40 000
60 000
80 000
100 000
120 000
140 000
© ESTIF 2012
Solar Thermal Market in Portugal Newly Installed Capacity - Glazed Collectors
200 000
160 000
120 000
80 000
40 000
0
kWth m2
2002 2003 2004 2005 2006 2007 2008 2009 2010 2011
0
20 000
40 000
60 000
80 000
100 000
120 000
140 000
© ESTIF 2012
Solar Thermal Market in Switzerland Newly Installed Capacity - Glazed Collectors
200 000
160 000
120 000
80 000
40 000
0
kWth m2
2002 2003 2004 2005 2006 2007 2008 2009 2010 2011
Portugal
Switzerland
Solar Thermal Markets Below 200 000 m²

United Kingdom
Czech Republic
Denmark
0
20 000
40 000
60 000
80 000
100 000
120 000
140 000
© ESTIF 2012
Solar Thermal Market in the United Kingdom Newly Installed Capacity - Glazed CollectorskWth m2
200 000
160 000
120 000
80 000
40 000
02002 2003 2004 2005 2006 2007 2008 2009 2010 2011
0
10 000
20 000
30 000
40 000
50 000
60 000
70 000
© ESTIF 2012
Solar Thermal Market in Czech Republic Newly Installed Capacity - Glazed Collectors
100 000
80 000
60 000
40 000
20 000
0
kWth m2
2002 2003 2004 2005 2006 2007 2008 2009 2010 2011
0
10 000
20 000
30 000
40 000
50 000
60 000
70 000
© ESTIF 2012
Solar Thermal Market in Denmark Newly Installed Capacity - Glazed Collectors
100 000
80 000
60 000
40 000
20 000
0
kWth m2
2002 2003 2004 2005 2006 2007 2008 2009 2010 2011

Solar Thermal Markets in Europe Trends and Market Statistics 2011
• Simple test procedure• One test valid across Europe• Licensed products• Access to subsidies• Reliable quality and performance
The Solar Keymark is a voluntary third-party certification mark
for solar thermal products, showing that a product conforms to
relevant European standards and fulfils additional requirements.
It is used in Europe and increasingly recognized worldwide.
It was developed by the European Solar Thermal Industry Federation
(ESTIF) and CEN (European Committee for Standardisation) in close
co-operation with leading European test labs and with the support of the
European Commission. It is the European quality label for solar thermal
products, aiming to reduce trade barriers and promote the use of high
quality solar thermal products in the European market and beyond.
Ja
n 2
00
3
Ja
n 2
00
4
Ja
n 2
00
5
Ja
n 2
00
6
Ja
n 2
00
7
Ja
n 2
00
8
Ja
n 2
00
9
Ja
n 2
01
0
Ja
n 2
01
1
1 200
1 000
800
600
400
200
0
Number of Solar Keymark licenses
Source: www.solarkeymark.org
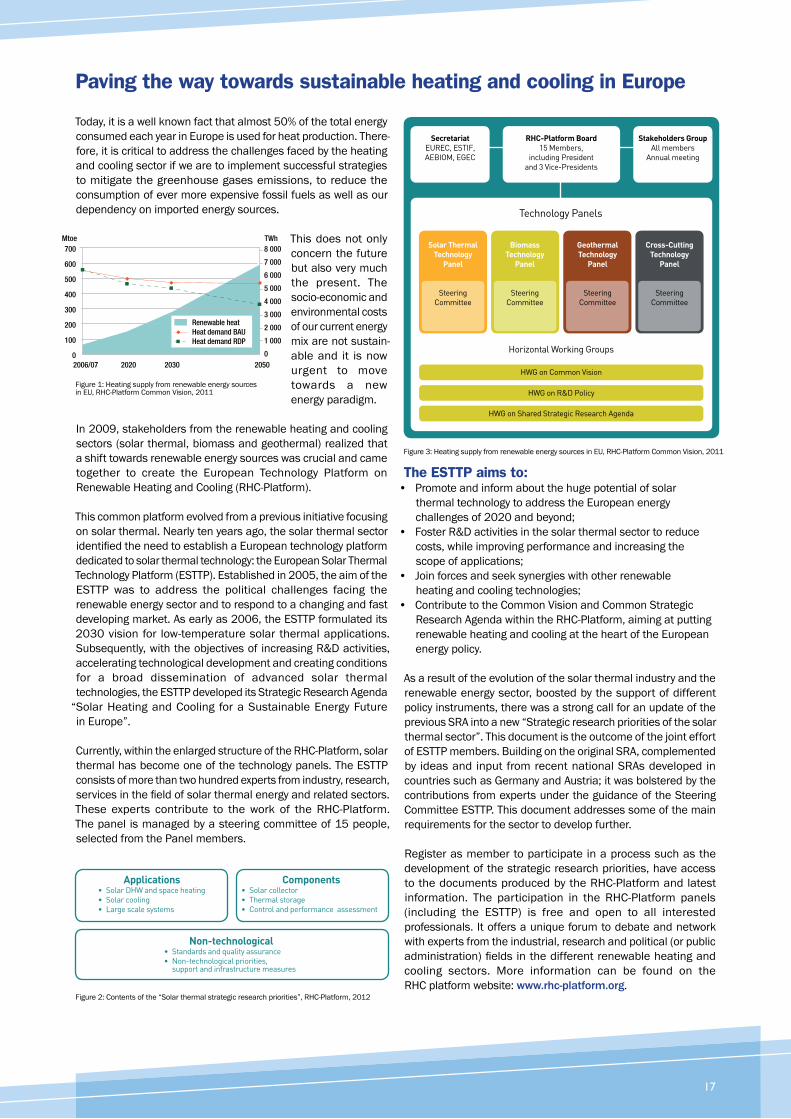
Paving the way towards sustainable heating and cooling in Europe
The ESTTP aims to:
HWG on Common Vision
HWG on R&D Policy
HWG on Shared Strategic Research Agenda
Solar Thermal
Technology
Panel
Steering
Committee
Biomass
Technology
Panel
Steering
Committee
Geothermal
Technology
Panel
Steering
Committee
Cross-Cutting
Technology
Panel
Steering
Committee
Secretariat
EUREC, ESTIF,
AEBIOM, EGEC
Stakeholders Group
All members
Annual meeting
RHC-Platform Board
15 Members,
including President
and 3 Vice-Presidents
Applications• Solar DHW and space heating
• Solar cooling
• Large scale systems
Components• Solar collector
• Thermal storage
• Control and performance assessment
Non-technological• Standards and quality assurance
• Non-technological priorities, support and infrastructure measures
TWhMtoe
2006/07 2020 2030 2050
700
600
500
400
300
200
100
0
8 000
7 000
6 000
5 000
4 000
3 000
2 000
1 000
0
Renewable heatHeat demand BAUHeat demand RDP
Solar Thermal Markets in Europe Trends and Market Statistics 2011
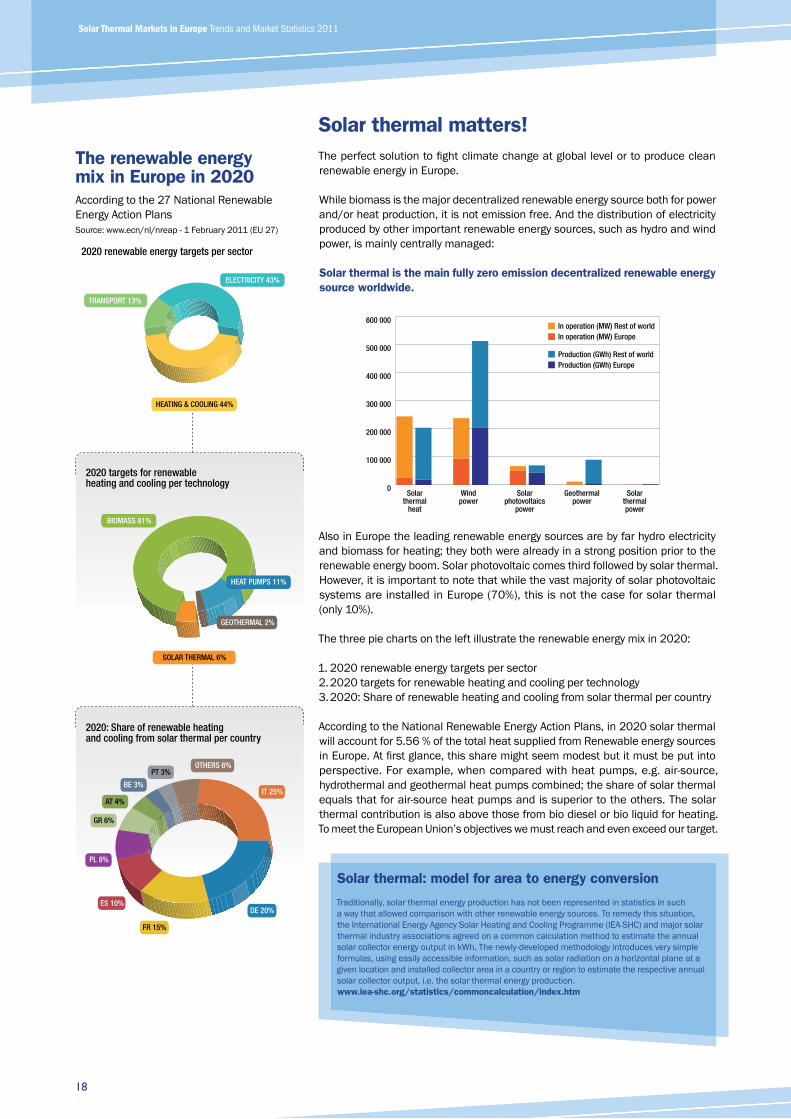
Solar thermal matters!
Solar thermal is the main fully zero emission decentralized renewable energy
source worldwide.
Solar thermal: model for area to energy conversion
www.iea-shc.org/statistics/commoncalculation/index.htm
Solar thermal
heat
Windpower
Solar photovoltaics
power
Geothermalpower
Solar thermalpower
Production (GWh) Rest of worldProduction (GWh) Europe
In operation (MW) Rest of worldIn operation (MW) Europe
0
100 000
200 000
300 000
400 000
500 000
600 000
The renewable energy mix in Europe in 2020
ELECTRICITY 43%
HEATING & COOLING 44%
GEOTHERMAL 2%
SOLAR THERMAL 6%
BIOMASS 81%
IT 25%
PL 8%
PT 3%OTHERS 6%
GR 6%
AT 4%
BE 3%
DE 20%
FR 15%
ES 10%
TRANSPORT 13%
HEAT PUMPS 11%
2020 renewable energy targets per sector
2020 targets for renewable heating and cooling per technology
2020: Share of renewable heating and cooling from solar thermal per country

Is the EU on the right path to achieve the 2020 targets?
Other 15
HU
CY
BE
PT
AT
GR
ES
PL
DE
FR
IT
2011
NREAP Barometer
80
70
60
50
40
30
20
10
0
Solar heat generation in Europe

The International Energy Agency Solar Heating and Cooling
Programme (IEA SHC) and the European Solar Thermal Industry
Federation (ESTIF) have decided to combine forces to organise in 2013
what will be one of the largest Solar Thermal Conferences worldwide.
With IEA SHC and ESTIF you get the best of both worlds:Solar Thermal Technology, Innovation and Standardisation
Solar Thermal Markets, Industry and Policy
The new annual SHC Conference series will take off on 9 July this year in San Francisco,USA,
co-located with Intersolar North America. After a very successful ESTEC 2011 in Marseille, France,
and ten years after the first edition of ESTEC in Freiburg in 2003, the cooperation between ESTIF
and IEA SHC will give a new impetus to the solar thermal conferences in Europe and create
a worldwide reference solar thermal event for all audiences:
• SHC 2013 for Industry: latest market updates and outlook, as well as state of the art
innovations, product development, standards, technical regulations
• SHC 2013 for Research: high scientific standards for the presentation of project results,
and first hand information on the European research policy framework and funding
• SHC 2013 for representatives from public authorities, regulators, local authorities,
energy agencies, Non Governmental Organisations: the latest news on best practices,
tools, policies and framework for promoting solar thermal
• SHC 2013 for a global audience because the European sector is leading the way
in solar thermal developments
2013SEPTEMBER 23-25FREIBURG, GERMANY


