Download - Solvent Estraction

STRIPPING RARE EARTH ELEMENTS AND IRON
FROM D2EHPA DURING ZINC SOLVENT EXTRACTION
by
Estelle Alberts
Thesis submitted in partial fulfillment of the requirements for the Degree
of
MASTER OF SCIENCE IN ENGINEERING (EXTRACTIVE METALLURGICAL ENGINEERING)
in the Faculty of Engineering
at Stellenbosch University
Supervised by Mr. Christie Dorfling
December 2011

ii
Declaration
By submitting this thesis electronically, I declare that the entirety of the work contained therein is
my own, original work, that I am the sole author thereof (save to the extent explicitly otherwise
stated), that reproduction and publication thereof by Stellenbosch University will not infringe any
third party rights and that I have not previously in its entirety or in part submitted it for obtaining
any qualification.
Signature Date
Copyright © 2011 Stellenbosch University All rights reserved
Stellenbosch University http://scholar.sun.ac.za

iii
Abstract
At Skorpion Zinc mine, in south-west Namibia, zinc oxide ore is refined through sulphuric acid
leaching, solvent extraction, electrowinning and casting of the final 99.995 % Zn metal. Over the
last four years, the rare earth element concentrations, with particular reference to Y, Yb, Er and
Sc, have significantly increased in the circulating electrolyte and the zinc-stripped organic phase
streams in the electrowinning and solvent extraction processes. This project had two main
objectives: firstly, the effect(s) of rare earths on the zinc solvent extraction and electrowinning
processes were to be determined; based on these results, the second objective was to find a
suitable method for removing rare earth elements from the organic phase during zinc solvent
extraction.
The investigation into the effect of the rare earths on zinc electrowinning showed that an
increase of 100 mg/l in the electrolyte Y concentration caused a decrease of 6 % in current
efficiency. The elemental order of decreasing current efficiency was found to be: Y > Yb > Er >
Sc. In the zinc solvent extraction process, it was found that an increase in the total organic rare
earth elements and iron concentration from 3100 to 6250 mg/l resulted in doubled viscosity and
an increase in phase disengagement time from 100 to 700 seconds. The organic zinc loading
capacity after two extraction stages was reduced by 1 – 3 g/l depending on the pregnant leach
solution used.
The detrimental effect of rare earth elements on solvent extraction and electroplating of zinc
therefore justified the development of a rare earth element removal process. Stripping of low
concentrations of rare earth elements from 40% D2EHPA diluted in kerosene to produce a clean
organic for zinc extraction was investigated using bench-scale experiments in a glass jacketed
mixing cylinder. For the rare earths, the best stripping agent was found to be H2SO4, followed by
HCl and then HNO3. Hydrochloric acid achieved better Fe stripping than sulphuric acid. Acid
concentration was tested in the range of 1 to 7 M, organic-to-aqueous ratio for the range of 0.25
to 6.0 and temperatures between 30 and 55 °C. More than 80% stripping of yttrium and erbium
could be achieved at an optimum hydrochloric acid concentration of 5 M and more than 90%
rare earth element (specifically Y, Er, Yb) stripping from the organic phase could be achieved
with 5 M sulphuric acid.
Stellenbosch University http://scholar.sun.ac.za

iv
Stripping was improved by reducing the organic-to-aqueous ratio to as low as 0.5 and increasing
the temperature. Stripping increased with increasing temperature in an S-shaped curve,
flattening off at 50°C. The effect of O:A ratio was more significant than the effect of temperature
on rare earth stripping. The results showed good repeatability, and were not limited by the rare
earth concentration, agitation rate or equilibrium time in the range of set points used in the
experiments.
Statistical models were compiled to fit the experimental data obtained for Y, Yb, Er and Fe when
stripped with sulphuric and hydrochloric acid respectively. All models showed dependence on
the acid concentration and squared-concentration and interaction effects between the O:A ratio
and temperature and stripping agent concentration were significant. The models were compiled
for the experimental data obtained from stripping synthetically prepared organic and then tested
on results obtained when stripping the plant organic phase.
The following three process solutions were discussed for implementation on a plant scale for the
removal of rare earths from the organic phase during zinc solvent extraction: Sulphuric acid
stripping mixer settler or stripping column, improvement of available HCl stripping section and
replacement of the organic inventory. The possibility of an oxalic acid precipitation process to
obtain value from the rare earths as by-product was also discussed. It was concluded that the
current process that uses HCl to strip off iron and rare earths would be the best practically and
financially feasible process. Value can be gained from the rare earths if a rare earth element -
oxalic acid precipitation section that is financially feasible can be established.
Stellenbosch University http://scholar.sun.ac.za

v
Opsomming
By Skorpion Zinc myn, in suidwes Namibië, word sinkoksied erts gesuiwer deur middel van
swaelsuur-loging, oplosmiddel ekstraksie, elektroplatering en gieting van die finale 99.995 % Zn
metaal. Oor die afgelope vier jaar het die seldsame aardmetale konsentrasie, spesifiek Y, Yb,
Er en Sc, noemenswaardig in die sirkulerende elektroliet en sink-gestroopte organiese fase
toegeneem. Hierdie projek het twee hoofdoelstellings gehad: eerstens moes die effek van
seldsame aardmetale op die sink oplosmiddel ekstraksie en elektroplatering prosesse bepaal
word; gebaseer op hierdie resultate, was die tweede doelstelling om ‘n geskikte metode vir die
verwydering van seldsame aardmetale vanaf die organiese fase gedurende sink oplosmiddel
ekstraksie te vind.
Die ondersoek na die effek van seldsame aardmetale op sink elektroplatering het gewys dat ‘n
verhoging van 100 mg/l in die elektroliet Y konsentrasie ‘n verlaging van 6 % in
kragdoeltreffendheid veroorsaak het. Die element-orde van verminderende
kragdoeltreffendheid was Y > Yb > Er > Sc. Vir die sink oplosmiddel ekstraksie proses, is
gevind dat ‘n verhoging in die totale organiese seldsame aardmetaal- en yster konsentrasie van
3100 tot 6250 mg/l ‘n verdubbelde viskositeit en ‘n verlenging in faseskeidingstyd van 100 tot
700 sekondes tot gevolg gehad het. Die organiese sink ladingskapasiteit na twee ekstraksie
stappe is met 1 – 3 g/l verminder afhangende van die logings oplossing wat gebruik is.
Die nadelige effek van seldsame aardmetale op oplosmiddel ekstraksie en sink elektroplatering
het die ontwikkeling van ‘n seldsame aardmetale verwyderingsproses regverdig. Die
verwydering van lae konsentrasies seldsame aardmetale vanaf die D2EHPA-keroseen
organiese fase om ‘n skoon organiese fase vir sink-ekstraksie te verkry is ondersoek deur
banktoetsskaal eksperimente. Vir die seldsame aardmetale is bevind dat H2SO4 die beste
stropingsagent is, gevolg deur HCl en dan HNO3. Soutsuur het beter yster verwydering as
swaelsuur bewerkstellig. Suurkonsentrasies van 1 tot 7 M, O:A verhoudings van 0.25 tot 6 en
temperature tussen 30 en 55°C is getoets. Meer as 80% verwydering van yttrium en erbium kon
bereik word met ‘n optimum HCl konsentrasie van 5 M en meer as 90% seldsame aardmetale
(spesifiek Y, Er en Yb) verwydering vanaf die organiese fase met 5 M swaelsuur.
Stellenbosch University http://scholar.sun.ac.za

vi
Seldsame aardmetale en yster verwydering kon verbeter word deur die organies-tot-waterfase
(O:A) verhouding te verminder tot so laag as 0.5 en deur die temperatuur te verhoog. Stroping
het in ‘n S-kurwe verhoog soos die temperatuur verhoog het, en het afgeplat teen 50°C. Die
effek van die O:A verhouding was belangriker as die effek van temperatuur op stroping. Die
resultate het goeie herhaalbaarheid gewys, en is nie deur massaoordrag beperk nie.
Statistiese modelle is saamgestel om die eksperimentele data wat vir Y, Yb, Er en Fe verkry is
vir stroping met swaelsuur en soutsuur te pas. Al die modelle het afhanklikheid van die
suurkonsentrasie en kwadratiese suurkonsentrasie gewys en interaksie effekte tussen die O:A
verhouding, temperatuur en suurkonsentrasie was belangrik. Die modelle is saamgestel vir die
eksperimentele data wat verkry is vanaf stroping van ‘n sintetiese organiese fase en is toe
getoets op resultate wat verkry is vanaf stroping van die aanleg se organiese fase.
Die volgende drie proses-oplossings is oorweeg vir implementering op ‘n aanlegskaal vir die
verwydering van seldsame aardmetale vanaf die organiese fase gedurende sink oplosmiddel
ekstraksie: Swaelsuur stroping menger-afskeidingstenk of stropingskolom, verbetering van die
bestaande HCl aanleg en vervanging van die organiese inventaris. ‘n Moontlike oksaalsuur
presipitasie proses om waarde vanaf die seldsame aardmetale as by-produk te verkry is ook
bespreek. Daar is tot die gevolgtrekking gekom dat die huidige proses wat HCl gebruik om yster
en seldsame aardmetale van die organiese fase af te stroop, die beste praktiese en finansieel
vatbare proses huidiglik is. Waarde kan vanaf die seldsame aardmetale verkry word as ‘n
seldsame aardmetale – oksaalsuur presipitasie afdeling wat finansieel haalbaar is daargestel
kan word.
Stellenbosch University http://scholar.sun.ac.za

vii
Acknowledgements
I would like to thank the following individuals/companies without whom this report would not
have been possible:
Skorpion Zinc Mine/Namzinc Refinery, who provided the facilities for experimental work as
well as the financial support for analysis of the samples.
De Bruyn Spectroscopic Solutions, who assisted with timely ICP-OES analysis of the rare
earth samples.
Mr. Christie Dorfling, for the guidance and support that you gave me throughout the project.
Your insight was invaluable as well as the understanding of other factors influencing the project,
as it was done part-time and in another country.
Stellenbosch University http://scholar.sun.ac.za

viii
Table of Contents
Declaration .................................................................................................................................. ii
Abstract ...................................................................................................................................... iii
Opsomming ................................................................................................................................. v
Acknowledgements ................................................................................................................... vii
Table of Contents ...................................................................................................................... viii
List of Figures ............................................................................................................................. xi
List of Tables ............................................................................................................................. xiii
Nomenclature ........................................................................................................................... xiv
Chapter 1: Introduction ............................................................................................................... 1
1.1 Importance of solvent extraction in the metallurgical industry ....................................... 1
1.2 The Skorpion Zinc process .......................................................................................... 2
1.3 Rare earth history ........................................................................................................ 3
1.3.1 Rare earth occurrence and uses .............................................................................. 3
1.3.2 Source of rare earths at Skorpion Zinc ..................................................................... 4
1.3.3 Rare earth concentration in process streams ........................................................... 6
1.3.4 Relevance of rare earths for Skorpion Zinc ............................................................ 10
1.4 Objectives .................................................................................................................. 11
1.5 Thesis Overview ........................................................................................................ 12
Chapter 2: Literature Review .................................................................................................... 13
2.1 Zinc Electroplating ..................................................................................................... 13
2.2 Organic health ........................................................................................................... 14
2.3 D2EHPA and kerosene organic phase characteristics ............................................... 15
2.4 Rare earth and iron properties ................................................................................... 16
2.5 Solvent extraction fundamental chemistry .................................................................. 17
2.6 Variables affecting rare earth stripping ....................................................................... 19
2.6.1 Stripping agent type and concentration .................................................................. 19
2.6.2 Equilibrium and mass transfer considerations ........................................................ 20
2.6.3 Effect of temperature on stripping .......................................................................... 21
2.6.4 Effect of the organic-to-aqueous (O:A) ratio ........................................................... 21
Stellenbosch University http://scholar.sun.ac.za

ix
Chapter 3: Materials and methods ............................................................................................ 23
3.1 Assumptions .............................................................................................................. 23
3.2 Experimental design and methodology ...................................................................... 23
3.2.1 Current efficiency tests ........................................................................................... 23
3.2.2 Preparation of synthetic organic reagents .............................................................. 26
3.2.3 Organic health tests ............................................................................................... 29
3.2.4 Stripping tests ........................................................................................................ 30
3.2.5 Stripping tests variables ......................................................................................... 32
Chapter 4: Effect of rare earths on zinc electroplating .............................................................. 34
4.1 Introduction ................................................................................................................ 34
4.2 Effect of yttrium on zinc electrowinning ...................................................................... 34
4.3 Effect of different rare earths on zinc electrowinning .................................................. 35
4.4 Conclusions ............................................................................................................... 36
Chapter 5: Effect of rare earths on organic phase health .......................................................... 37
5.1 Introduction ................................................................................................................ 37
5.2 Synthetic organic manufacture ................................................................................... 37
5.3 Zinc loading ............................................................................................................... 39
5.4 Organic phase viscosity ............................................................................................. 41
5.5 Phase disengagement time ........................................................................................ 43
5.6 Conclusions ............................................................................................................... 47
Chapter 6: Stripping rare earth elements from the organic phase ............................................. 48
6.1 Introduction ................................................................................................................ 48
6.2 Rare earth and iron stripping from synthetic organic .................................................. 48
6.2.1 Stripping agent type and concentration .................................................................. 48
6.2.2 Experimental results verification ............................................................................. 54
6.2.3 O:A ratio and stripping ........................................................................................... 57
6.2.4 Temperature .......................................................................................................... 60
6.2.5 Interaction effects in rare earth stripping ................................................................ 61
6.3 Rare earth and iron stripping from plant organic ........................................................ 61
6.3.1 Stripping agent concentration: sulphuric acid ........................................................ 61
6.3.2 Stripping agent concentration: hydrochloric acid ................................................... 64
6.3.3 O:A ratio ................................................................................................................. 66
Stellenbosch University http://scholar.sun.ac.za

x
6.4 Statistical regression models for rare earth stripping with H2SO4 ............................... 68
6.5 Statistical regression models for rare earth stripping with HCl .................................... 73
6.6 Conclusions ............................................................................................................... 76
Chapter 7: Process solutions .................................................................................................... 78
7.1 Process solutions considered ..................................................................................... 78
7.1.1 Sulphuric acid stripping mixer-settler ...................................................................... 78
7.1.2 Expand/improve available HCl stripping section ..................................................... 81
7.1.3 Replace organic inventory ...................................................................................... 83
7.2 Feasible process solutions ......................................................................................... 84
7.2.1 Expand/improve available HCl stripping section ..................................................... 84
7.2.2 Replace organic inventory ...................................................................................... 85
7.3 Proposed process solution ......................................................................................... 85
7.4 Conclusions ............................................................................................................... 85
Chapter 8: Conclusions and recommendations ........................................................................ 87
8.1 Conclusions ..................................................................................................................... 87
8.2 Recommendations ........................................................................................................... 89
References ................................................................................................................................ 91
Appendix A: Experimental design ............................................................................................. 96
Appendix B: Experimental results ........................................................................................... 101
Appendix C: Anova tables ...................................................................................................... 105
Stellenbosch University http://scholar.sun.ac.za

xi
List of Figures
Figure 1: Skorpion Zinc process flow diagram ............................................................................ 3
Figure 2: Rare earth concentration of mined material (ore and waste) ........................................ 4
Figure 3: Rare earth concentration of leached and neutralised ore ............................................. 5
Figure 4: Percentage of REE in ore feed that is leached and precipitated/un-leached ................ 6
Figure 5: Rare earth concentration of organic and aqueous streams in SX and EW ................... 7
Figure 6: Skorpion Zinc neutralisation, solvent extraction and electrowinning process streams .. 8
Figure 7: REE analysis of zinc-stripped organic.......................................................................... 9
Figure 8: REE analysis of incoming pregnant leach liquor (PLS) ................................................ 9
Figure 9: REE analysis of spent electrolyte from the cell house ................................................ 10
Figure 10: Mini-cell tests set-up ................................................................................................ 24
Figure 11: Mini-cell beaker with anode (left) and cathode (right) ............................................... 25
Figure 12: Jacketed glass mixing cylinder used for experiments .............................................. 27
Figure 13: Current efficiency as a function of Y concentration in spent electrolyte .................... 35
Figure 14: Current efficiency for different REE increased by 200 mg/l ...................................... 36
Figure 15: Rare earth, iron and zinc concentration on synthetic organic ................................... 38
Figure 16: Effect of total REE concentration on zinc loading .................................................... 39
Figure 17: Maximum zinc loading after two extraction stages ................................................... 40
Figure 18: Viscosity vs organic phase rare earth concentration ................................................ 42
Figure 19: Relationship between organic phase viscosity and density ...................................... 43
Figure 20: Phase disengagement times for organic after first zinc loading with synthetic pregnant
leach solution ............................................................................................................................ 44
Figure 21: Phase disengagement times for organic after first zinc loading with plant pregnant
leach solution ............................................................................................................................ 45
Figure 22: Phase disengagement time after 1st and 2nd zinc loadings ....................................... 46
Figure 23: Viscosity and phase disengagement times after first Zn loading for different organic
phases ...................................................................................................................................... 46
Figure 24: Phase disengagement time against viscosity ........................................................... 47
Figure 25: Rare earth stripping from synthetic organic at O:A 1:2 and T = 50°C for different acid
concentrations ........................................................................................................................... 49
Figure 26: Rare earth stripping from synthetic organic at O:A 2:1 and T = 50°C for different acid
concentrations ........................................................................................................................... 49
Stellenbosch University http://scholar.sun.ac.za

xii
Figure 27: Rare earth stripping from synthetic organic at O:A 1:2 and T = 30°C for different acid
concentrations ........................................................................................................................... 50
Figure 28: Rare earth stripping from synthetic organic at O:A 2:1 and T = 30°C for different acid
concentrations ........................................................................................................................... 50
Figure 29: Iron stripping from synthetic organic vs acid concentration, at O:A ratio of 1:2 and a
temperature of 50 °C ................................................................................................................. 52
Figure 30: Scandium stripping from synthetic organic vs acid concentration ............................ 53
Figure 31: Stripping percentages for 5 M H2SO4 at 45 °C and an O:A ratio of 2:1 at different
agitation rates ............................................................................................................................ 55
Figure 32: Stripping rare earths and iron from synthetic organic with H2SO4 plotted against
reaction time .............................................................................................................................. 56
Figure 33: Stripping Y, Er and Yb from synthetic organic with 5M H2SO4 at different O:A ratios57
Figure 34: Stripping Fe from synthetic organic with 5M H2SO4 at different O:A ratios ............... 58
Figure 35: Stripping Y, Er and Yb from synthetic organic with 5M HCl at different O:A ratios ... 59
Figure 36: Stripping Fe from synthetic organic with 5M HCl at different O:A ratios ................... 59
Figure 37: Rare earth stripping from synthetic organic with 5 M H2SO4 as a function of
temperature, for O:A ratios of 1:2 and 2:1.................................................................................. 60
Figure 38: Stripping rare earths from plant organic with H2SO4 at O:A 1:2 ................................ 62
Figure 39: Stripping rare earths from plant organic with H2SO4 at O:A 2:1 ................................ 63
Figure 40: Stripping iron from plant organic with H2SO4 ............................................................ 64
Figure 41: Stripping rare earths from plant organic with HCl at O:A 2:1 .................................... 65
Figure 42: Stripping rare earths from plant organic with HCl at O:A 1:2 .................................... 65
Figure 43: Stripping iron from plant organic with HCl ................................................................ 66
Figure 44: Stripping plant organic with 5 M H2SO4 at T = 50°C ...................................... ........... 67
Figure 45: Stripping plant organic with 5 M HCl at T= 50°C .......................................... ............ 68
Figure 46: Backward elimination regression process ................................................................ 69
Figure 47: Difference between plant experimental results for H2SO4 and model predictions for
model fitted to synthetic organic data ........................................................................................ 72
Figure 48: Difference between plant experimental results for HCl and model predictions for
model fitted to synthetic organic data ........................................................................................ 75
Figure 49: Schematic of sulphuric acid mixer-settler process ................................................... 79
Figure 50: Schematic of sulphuric acid stripping column process ............................................. 80
Figure 51: Simplified schematic of HCl regeneration plant ........................................................ 82
Stellenbosch University http://scholar.sun.ac.za

xiii
List of Tables
Table 1: D2EHPA viscosity related to temperature .................................................................... 15
Table 2: D2EHPA density related to temperature ...................................................................... 15
Table 3: Properties of rare earth elements (Gupta and Krishnamurthy, 2005) .......................... 17
Table 4: Experimental design for mini-cell tests ........................................................................ 26
Table 5: Element concentrations on organic ............................................................................. 28
Table 6: Organic and aqueous phases used for phase disengagement tests ........................... 29
Table 7: Definition of experiments ............................................................................................ 30
Table 8: Results for four blank samples .................................................................................... 34
Table 9: Repeatability of experiments ....................................................................................... 54
Table 10: Stripping % for different rare earth concentrations .................................................... 55
Table 11: Experimental results compared to predicted percentage stripping with H2SO4 for 17
tests .......................................................................................................................................... 71
Table 12: Experimental results compared to predicted percentage stripping with HCl for 17 tests
.................................................................................................................................................. 74
Table 13: Organic inventory replacement costs ........................................................................ 83
Table 14: Cost summary .......................................................................................................... 85
Stellenbosch University http://scholar.sun.ac.za
xiv
Nomenclature
C concentration
CE current efficiency
D2EHPA di-2-ethylhexyl phosphoric acid
EW electrowinning
F Faraday’s constant
HR D2EHPA molecule represented by H for the acid proton and R for the
organophosphorous part in reactions
i applied current
mt metric ton
M metal, for e.g. Zn, as used in reactions
Mw molecular weight
n oxidation state
O:A ratio organic-to-aqueous ratio
OAC organic-to-aqueous ratio-concentration interaction
OAT organic-to-aqueous ratio-temperature interaction
PLS pregnant leach solution
REE rare earth element(s)
rpm revolutions per minute
SX solvent extraction
t plating time
T temperature
Y yttrium, also representative of rare earths when used in reactions
Stellenbosch University http://scholar.sun.ac.za

1
Chapter 1: Introduction
1.1 Importance of solvent extraction in the metallurgical industry Solvent extraction is currently one of the most important separation processes in hydrometallurgy and
is used in the processing of Cu, Ni, Zn, Co, U, V, Zr, rare earth elements (REE) and the platinum
group metals (Flett, 2005). This technology has the ability to selectively extract one element from a
mixture of elements under certain pH conditions, enabling the purification of a metal or separation of
different metals from one another. Different types of extractants are available, with different
selectivities for specific metals. The solvent extraction process can have co-current or counter-current
flow, although counter-current flow is more often used industrially (Gupta and Krishnamurthy, 2005).
Commercial solvent extraction bloomed in Southern Africa in the early 1970s, being applied to copper,
uranium and the platinum group metals. Solvent extraction is currently still used in this region for gold
extraction at Harmony Gold Mine in South Africa, copper extraction in the Copper Belt in Zambia,
cobalt extraction at Kasese Cobalt in Uganda, Chambishi Metals in Zambia and Kolwezi Tailings in
the Democratic Republic of Congo. Solvent extraction is also used to produce nickel at Tati Nickel in
Botswana and to recover nickel and palladium from spent catalyst at Mintek, South Africa. At Anglo
Platinum Rustenburg’s and Impala Platinum’s Base Metals refineries, Cyanex 272 is used to achieve
nickel and cobalt separation (Cole et al., 2006). The other important application of solvent extraction is
the separation of rare earth elements from one another so that value can be gained from the pure
product, since most REE applications require high purity rare earth elements as raw material (Gupta
and Krishnamurthy, 2005).
Solvent extraction is utilized at Skorpion Zinc to selectively recover zinc from the pregnant leach
solution (PLS) produced by leaching of zinc silicate oxide ore. Di-2-ethylhexyl phosphoric acid
(D2EHPA), which is a cation exchange extractant, ensures that selective extraction of zinc is
achieved, while Cu, Co, Cd and Ni as well as the halides are rejected. Cu, Co, Cd, Ni, Cl and F are
detrimental to zinc electrowinning. The solvent extraction process also allows for the solution zinc
content to be upgraded from 35 g/l (as a result of the high silica content) in the leach liquor to 115 g/l
in the loaded electrolyte. The selectivity of the solvent extraction process therefore allows production
of zinc by means of electrowinning despite the large amount of trace impurities present in the leach
solution, and it is critical to the existence of Skorpion Zinc mine (Martin, et al., 2002 and Cole et al.,
2006).
Stellenbosch University http://scholar.sun.ac.za

2
1.2 The Skorpion Zinc process
The Skorpion Zinc process was designed to produce 150 000 mt super high grade zinc per year. The
refining process is shown in Figure 1 (Gnoinski, 2007). The refinery is designed to treat 200 t/h zinc
silicate oxide ore. After comminution, the ore is leached with sulphuric acid to obtain zinc in aqueous
form. After leaching, the slurry is neutralised to a pH of 4.2 to precipitate elements such as Al, Fe and
Si which have co-leached with zinc, and then thickened. Approximately 75% of the thickener overflow
solution (pregnant leach solution) is clarified and pumped to the solvent extraction process while the
other 25% is treated with zinc dust to precipitate Cu, Cd and Ni before being recycled to the process
feed. After thickening, the solids are reacidified with sulphuric acid to re-leach precipitated zinc. The
slurry is then filtered and the solids disposed of as tailings. The liquid filtrate is treated with limestone
and milk of lime to precipitate any remaining zinc as basic zinc sulphate, which is returned to the
neutralization section of the plant.
The pregnant leach solution contains approximately 35 g/l Zn. In the solvent extraction process, di-2-
ethylhexyl phosphoric acid (D2EHPA) diluted in kerosene is used to selectively extract zinc from the
pregnant leach solution at a pH of 4.2 – 4.4 and a temperature of 43°C. The solvent extraction
process used at Skorpion Zinc is the modified Zincex process patented by Técnicas Reunidas (Martin,
et al., 2002). After extraction of zinc into the organic, the organic phase is washed with demineralised
water and spent electrolyte from the downstream electrowinning process to remove impurities. Spent
electrolyte from the electrowinning plant is then used to strip the zinc from the D2EHPA and produce
loaded electrolyte of a quality which can be fed to the cell house for zinc electroplating. Once the zinc
has been stripped, part of the organic phase stream is regenerated with 5 M HCl in order to remove
iron, which is co-extracted with zinc.
In the cell house, zinc is plated at 175 kA on aluminium cathodes. The zinc electrowinning plant is
very sensitive to impurities such as Ni, Cu, Co and Cd, which lowers the hydrogen overpotential,
resulting in excessive hydrogen formation and hydrogen fires in the cell house (Gnoinski, 2007).
Through selective extraction of zinc, the solvent extraction plant makes the operation of the zinc cell
house possible by effectively reducing the impurity content from the mg/l range in the pregnant leach
solution to the µg/l range in the electrolyte. The product from the cell house is super high grade
(SHG) zinc cathodes which are then melted to produce ingots or jumbos containing more than
99.995% Zn.
Stellenbosch University http://scholar.sun.ac.za

3
Figure 1: Skorpion Zinc process flow diagram
1.3 Rare earth history
1.3.1 Rare earth occurrence and uses
Rare earths occur in different mineralogical forms, of which carbonatites are the most common.
Although the occurrences of rare earths are widespread, rare earths are not always found in high
enough concentrations to make mining and refining feasible (Wall, 2011). China is the world’s largest
rare earth producer, producing 95% of the world supply at its Bayan Obo, Sichuan and Jiangxi mines
(Tse, 2011). The United States of America (Mountain Pass in California), Malaysia and Australia also
produce rare earths (Gupta and Krishnamurthy, 2005).
Stellenbosch University http://scholar.sun.ac.za

4
Different rare earth elements have different applications, ranging from magnet manufacturing,
petroleum cracking, catalytic converters, radar detection, nuclear plants, ceramics and glass
manufacturing, polishing powder and hydrogen storage. While the entire world is dependent on rare
earths for many new and green technology applications, China is in a position to govern the rare earth
element prices to a large extent given their monopoly on world production of these elements (Tse,
2011 and Hurst, 2010).
1.3.2 Source of rare earths at Skorpion Zinc
Although Skorpion Zinc mine does not produce rare earths, it has been found that certain rare earth
elements accumulate in the process streams. An attempt was made to determine what the sources of
the rare earths were. Twelve samples were collected from different areas of the Skorpion Zinc mine
pit and analysed for rare earth elements in order to determine the origin of the increasing REE
concentration seen in some of the refinery process streams. Although twelve samples cannot be
considered representative of an entire mining pit with a cross-sectional area of more than 1 km2, the
results gave a better understanding of the possible high-potential REE areas. From Figure 2 it can be
seen that the greatest concentration of rare earths occur where the ore body is enriched with
manganese and iron in the Core West part of the pit and also in the white schist (SSS) layer in the
Central North area of the pit. These are mostly waste areas of ore body. The main elements present
are Ce, Y, La, Nd and Er.
0
40
80
120
160
Sc Y La Ce Pr
Nd
Sm Eu
Gd Er
Tm Yb
Rare earth element
Con
cent
ratio
n (g
/t)
SSS, South East SSS, Central North BSA, Core East Mn/Fe enriched, Core West
BSA/Limestone, Core East Mn/Fe enriched, Core West BSA/Cu, Core West BSA/Limestone, Core West
BSA, Core East BSA/Limestone, Core West BSA/Limestone, Core West Ore feed
Figure 2: Rare earth concentration of mined material (ore and waste)
Stellenbosch University http://scholar.sun.ac.za

5
As discussed previously, ore fed to the refinery is leached with sulphuric acid and neutralised with
limestone. The zinc is contained in the pregnant leach solution while the solids are disposed of as
tailings. Comparing the rare earth element concentrations in the liquid and solid streams (see
Figure 3) it was seen that the solid streams contain higher concentrations of rare earths. The residue
solids after neutralisation with limestone also contain more rare earths than the solids obtained after
leaching. This suggests that rare earth precipitation with limestone occurs during neutralisation,
reducing the REE concentration in the neutralisation residue liquid (PLS) going to the solvent
extraction process.
The percentage of rare earths that are dissolved during leaching and the percentage reporting to the
solids are indicated in Figure 4. The percentage in the solids is a combination of rare earths not
leached and rare earths precipitated during neutralisation. It was seen that Y, Gd, Er and Yb are
easily leached, while the rest of the elements remain in the solids. Y, Gd and Yb are then precipitated
again, while Er showed a low tendency to precipitate. However, it should be taken into consideration
that the analysis results presented in Figures 3 and 4 were obtained from taking one batch of samples
and that it was not verified by taking more samples at other times and operating conditions and
comparing the results. However, it does give an idea of the relative dissolution, precipitation and
concentration of rare earth elements in the leaching and neutralisation process streams.
0
40
80
120
160
200
Sc Y La Ce Pr
Nd
Sm Eu
Gd Er
Tm Yb
Rare earth element
Sol
id c
once
ntra
tion
(g/t)
0
1
2
3
4
5
6
Liqu
id c
once
ntra
tion
(mg/
l)
Leach residue solid Neutralisation residue solid
Leach residue liquid Neutralisation residue liquid
Figure 3: Rare earth concentration of leached and neutralised ore
Stellenbosch University http://scholar.sun.ac.za

6
0%
20%
40%
60%
80%
100%
Sc Y La Ce Pr Nd Sm Eu Gd Er Tm Yb
Per
cent
age
of fe
ed (%
)
Rare earth element
REE dissolved REE precipitated/un-leached
Figure 4: Percentage of REE in ore feed that is leached and precipitated/un-leached
1.3.3 Rare earth concentration in process streams
Figure 5 shows the rare earth concentration of the process streams in the solvent extraction and
electrowinning processes. The organic streams (stripped organic and regenerated organic) shows an
accumulation of Y, Yb, Er, Sc and Lu, whereas the aqueous streams (spent and loaded electrolyte)
shows a build-up of Y, Er, Yb, Nd, Sm, Gd and Ce. Yttrium is therefore present in high concentration
in the incoming ore, as well as in all other process streams. Yb, Er, Sc and Lu seem to be more
easily extracted onto the organic phase and less easily stripped, while Nd, Sm, Gd and Ce are not
easily extracted, but almost all of what is extracted is stripped off and accumulates in the electrolyte
streams. The presence of Y, Yb and Er in the bleed stream from the hydrochloric acid plant used for
organic regeneration indicates that some rare earths are stripped off during organic regeneration with
HCl.
Stellenbosch University http://scholar.sun.ac.za

7
0
100
200
300
400
500
600
Sc Y
Ce Pr
Nd
Sm Gd
Dy
Ho Er
Tm Yb
Lu
Rare earth element
Aqu
eous
C
once
ntra
tion
(mg/
l)
0500100015002000250030003500
Org
anic
C
once
ntra
tion
(mg/
l)
Spent electrolyte Loaded electrolyte HCl bleed
Stripped organic Regenerated organic
Figure 5: Rare earth concentration of organic and aqueous streams in SX and EW
Figure 6 shows the flow rates and relative concentrations of zinc and rare earths in the solvent
extraction and electrowinning process streams as at January 2011. Over the past 4 years it has been
found that the concentration of rare earth elements (yttrium in particular) in the zinc-stripped organic
phase is increasing (see Figure 7). The rare earths in the incoming pregnant leach solution (PLS)
seem to remain constant (see Figure 8), while the electrolyte solution circulating between the solvent
extraction plant and the cell house also showed an increase in rare earths, as shown in Figure 9.
Stellenbosch University http://scholar.sun.ac.za

8
Nr Stream name Flow rate (m3/h)
Zn (g/l)
Total REE (mg/l)
1 Organic (40%D2EHPA-60%Kerosene) 1400 <1 4750 2 Raffinate 1100 12 15 3 Pregnant leach solution 950 35 20 4 Wash solution 50 30 unknown 5 Loaded electrolyte 300 115 420 6 Spent electrolyte 300 45 540 7 Spent HCl 5 0 unknown 8 Regenerated HCl 5 0 unknown 9 Regenerated organic 20 <1 4350
Extraction
Washing
Stripping
Regeneration
1
3
2 4 5 6 7 8
EW
Leach&Neutralisation
HCl plant
Aqueous Organic
9
Figure 6: Skorpion Zinc neutralisation, solvent ext raction and electrowinning process streams
Stellenbosch University http://scholar.sun.ac.za

9
0
1000
2000
3000
4000
5000
6000
Oct
-06
Mar
-07
Aug
-07
Jan-
08
Jun-
08
Oct
-08
Mar
-09
Aug
-09
Jan-
10
Jun-
10
Nov
-10
Apr
-11
Y, Y
b, T
otal
(mg/
l)
0
100
200
300
400
500
Fe,
Sc
(mg/
l)
Total Y Yb Sc Fe
Figure 7: REE analysis of zinc-stripped organic
0
2
4
6
8
10
Oct
-06
Mar
-07
Aug
-07
Jan-
08
Jun-
08
Oct
-08
Mar
-09
Aug
-09
Jan-
10
Jun-
10
Nov
-10
Apr
-11
Y, F
e (m
g/l)
0.0
0.4
0.7
1.1
1.4
1.8
Yb,
Er (
mg/
l)
Y Er Fe Yb
Figure 8: REE analysis of incoming pregnant leach liquor (PLS)
Stellenbosch University http://scholar.sun.ac.za

10
0
50
100
150
200
250
Oct
-06
Mar
-07
Aug
-07
Jan-
08
Jun-
08
Oct
-08
Mar
-09
Aug
-09
Jan-
10
Jun-
10
Nov
-10
Apr
-11
Date
Y (m
g/l)
0
5
10
15
20
25
Yb,
Er,
Fe
(mg/
l)
Y Yb Er Fe
Figure 9: REE analysis of spent electrolyte from the cell house
1.3.4 Relevance of rare earths for Skorpion Zinc
An increase in the concentration of rare earth elements (REE) in the organic phase was a concern for
four reasons: firstly, excessive rare earth loading leads to the formation of gel (Sole, 2011), which
settles to the bottom of the washing stage settlers and lead to costly clean-up operations. From XRF
analysis of the dried gel in February 2010, December 2010 and January 2011, it was found that the
gel was mostly composed of the organic phase, zinc, rare earths, particularly yttrium, ytterbium and
scandium, and iron (Sole, 2010). The recommended zinc loading on the organic phase is 14 g/l,
although the practically possible loading on a plant scale is 18 g/l Zn according to Técnicas Reunidas
(Diaz, 2011). As is seen in Figure 7 the current rare earth loading on the organic phase is more than
5 g/l.
Secondly, the high rare earth concentration in the organic phase also means that numerous sites on
the organic are occupied by elements such as Y and Yb, reducing the amount of sites available for
zinc extraction and therefore reduces the capacity of the solvent extraction process.
Thirdly, apart from causing gel-formation under excessive loading, the effect of the increased
presence of REE on the solvent extraction chemistry and phase separation was unknown.
Stellenbosch University http://scholar.sun.ac.za
11
Lastly, the effect of rare earths on zinc plating and current efficiency in the cell house, if rare earths
are transferred from solvent extraction to electrowinning, was not known.
The purpose of this project was therefore to determine the effects of rare earth elements on the
solvent extraction and electrowinning processes and to find a suitable process for removal of the
accumulated rare earth elements from the organic. Research work on solvent extraction in the rare
earth industry has been done by a number of authors (Hirashima et al., 1978, Gupta and
Krishnamurthy, 2005, Rachandra Rao, 2006 and Weiwei et al.,2006). This literature was used to
obtain the basis parameters for the project based on the assumption that stripping REE from an
organic phase after zinc solvent extraction is similar to stripping REE from organic during rare earth
refining. This assumption was considered valid since the organic phase under consideration was
D2EHPA in kerosene, which is commonly used on an industrial scale for rare earth extraction (Gupta
and Krishnamurthy, 2005)
1.4 Objectives
The objectives of the project were twofold: firstly, to determine what the effect(s) of rare earths are on
the zinc solvent extraction and electrowinning processes, and secondly to find a suitable method for
removing rare earth elements from the organic phase during zinc solvent extraction.
The scope of the project is limited to determination of the effect of REE on solvent extraction and
electrowinning, detailed stripping tests and proposition of a suitable REE removal process, and does
not include detailed design and implementation of such a process.
The following actions were performed in order to achieve the objectives of the project:
� Show the effect, if any, that rare earth elements, particularly yttrium, have on the current
efficiency during the electrowinning of zinc.
� Show the effect, if any, that rare earth elements have on the organic phase characteristics
during solvent extraction.
� Report on the very basic chemistry involved in REE extraction and stripping.
� Find the optimum stripping agent and stripping agent concentration for the rare earths yttrium,
erbium and ytterbium, as well as for iron.
Stellenbosch University http://scholar.sun.ac.za

12
� Investigate the effect of temperature and O:A ratio and possible interactions between the two on
rare earth stripping.
� Compare the rare earth stripping achieved for Skorpion Zinc plant organic phase with that
achieved for synthetic organic.
� Provide statistical models for the data obtained.
� Suggest a practically feasible process for rare earth removal that can be implemented on a
plant scale.
� Do a preliminary financial feasibility assessment of the process to be implemented at Skorpion
Zinc for rare earth removal.
1.5 Thesis Overview
The project first looked at the effects of rare earth elements on the Skorpion Zinc solvent extraction
and electrowinning processes. Based on the results, an investigation into the stripping of rare earths
from the organic phase used in solvent extraction was justified. The stripping process was
investigated on a laboratory scale and a possible plant-scale process is discussed.
The thesis is structured around the project objectives, with the literature review discussed first,
followed by the experimental design and method used. Thereafter the experimental results for the
effect of rare earths on zinc electrowinning are presented in Chapter 4 and the effect on organic
phase health in Chapter 5. Chapter 6 is where the experimental results for stripping rare earths from
the organic phase are discussed. The thesis is concluded with possible processes which can be
implemented on a plant scale, also including recommendations for further investigations.
Stellenbosch University http://scholar.sun.ac.za

13
Chapter 2: Literature Review
2.1 Zinc Electroplating
The Skorpion Zinc cell house was designed to produce 153 000 mt of cathodic zinc per year at a
nominal current density of 400 A/m2 and a maximum of 460 A/m2 (Umicore Engineering Process and
Operation manual, 2001). The design current efficiency is 90% but the average current efficiency
achieved over the last year was 88%. During zinc electroplating the cathodic reaction is:
Zn2+ + 2e- → Zn [Equation 1]
The above equation has reversible potential of -0.793 V vs SHE (standard hydrogen electrode). The
anodic reaction is:
H2O – 2e- → 2H+ + ½O 2 [Equation 2]
Including the anodic and cathodic reaction reversible potentials, overpotentials and resistances
involved, the potential needed for zinc metal plating is 3.2 – 3.4 V between the anode and the
cathode.
The current efficiency can be calculated from:
100plated_mass_ltheoretica
plated_massCE% ×= [Equation 3]
Where the actual mass plated is weighed in grams and the theoretical mass is calculated from:
nF
itw
Mplatedmassltheoretica =__ [Equation 4]
Where Mw is the molecular weight of Zn in this case, i is the applied current in A, t is the plating time in
seconds, n is the oxidation state of Zn and F is Faraday’s constant in Coulomb/s.
Stellenbosch University http://scholar.sun.ac.za

14
The effect of rare earth elements, and yttrium in particular, on the current efficiency is not known and
no previous work on the subject could be found in literature. No literature could be found on the
mechanism by which rare earths influence zinc electrowinning or electrowinning of other metals. The
effect of rare earths on zinc electroplating was also discussed with two experts in the field of zinc
electroplating (Dewalens, 2011 and Nicol, 2011) and neither could shed light on the mechanisms
which might cause the electrolyte rare earth concentration to affect zinc plating or how it would affect
zinc plating.
2.2 Organic health
Organic health is the combination of characteristics that quantifies the performance of the organic
phase and is measured by measuring its viscosity, zinc loading capacity and the phase
disengagement time when mixed with an aqueous phase. Any reference hereafter to “organic health”
refers to the viscosity, zinc loading capacity and phase disengagement characteristics of the organic
phase.
Standard validation tests (Skorpion Zinc Solvent Extraction Operational Manual, 2003) are used to
determine the condition of the organic phase (“organic health”) in terms of its characteristic phase
disengagement time, viscosity and zinc loading capacity. These organic characteristic properties
need to be monitored continuously to ensure that it meets the minimum requirements specified by
Técnicas Reunidas for the modified Zincex© process (Martin et al., 2002). The phase disengagement
time should be below 200 seconds and the zinc loading at 22 g/l for the laboratory bench scale tests.
Viscosity should be less than 5 mPa.s and is usually compared to fresh organic.
The organic phase that is validated is the zinc-stripped organic phase. The viscosity and density of
di-2-ethylhexyl phosphoric acid decrease with temperature as shown in Tables 1 and 2 (Rhodia,
2010). Phase disengagement time is affected by the density difference between the liquids in the
emulsion, the rate of diffusion and the rate of coalescence. The rate of diffusion is affected by
temperature and viscosity. This was confirmed by Musadaidzwa and Tshiningayamwe (2009) who
observed that as the viscosity increases, the phase disengagement time increases. One of the
factors affecting the rate of coalescence is the pH, with the rate of coalescence increasing as the pH
decreases since a reduction in pH causes a reduction in interfacial tension (Hoh et al., 1986). Hoh et
al. (1986) considered specifically the lanthanum nitrate-D2EHPA-diluent system but the findings
indicate that the type of extractant and diluent, and the pH affects interfacial tension and not the
specific rare earth element under consideration.
Stellenbosch University http://scholar.sun.ac.za

15
Mansur et al. (2001) found that the zinc extraction reaction kinetics are controlled jointly by both the
chemical reaction rate and diffusion, while the stripping reaction is purely diffusion controlled. The
increased viscosity of the organic complex when loaded with zinc and the high viscosity of the
D2EHPA organic phase limit mass transfer and therefore reduce the reaction rate during extraction
and stripping operations (Bart and Rousselle, 1998 and Mansur et al., 2001).
Table 1: D2EHPA viscosity related to temperature Temperature Viscosity
°°°°C mPa.s0 160
20 5640 21
100 4.4 Table 2: D2EHPA density related to temperature
Temperature Density°°°°C g/cm 3
25 0.97440 0.95260 0.937
2.3 D2EHPA and kerosene organic phase characteristics
Di-2-ethylhexyl phosphoric acid (D2EHPA) is used as the extractant of choice for extraction of Zn2+ at
Skorpion Zinc. It is also widely used in the rare earth industry for solvent extraction of rare earth
elements and separation extraction of different rare earths. Kerosene is the diluent of choice used at
Skorpion Zinc for zinc solvent extraction, but has been shown to also be the best diluent to use for
rare earth extraction (Gupta and Krishnamurthy, 2005). D2EHPA is discussed here to give better
insight into the experimental results discussed later in the report.
The industrial D2EHPA used by Skorpion Zinc, and which was also used for the test work in this
project, has a 95% di-2-ethylhexyl phosphoric acid (D2EHPA) concentration (minimum), with a
maximum of 3% mono-ethylhexyl phosphoric acid (MEHPA) and 5% water. D2EHPA is an acidic
extractant which can deprotonate to form the following anion (Rhodia, 2010):
O O || ||
(C8H17O)2-P-OH ↔ (C8H17O)2-P-O- + H+ [Equation 5]
Stellenbosch University http://scholar.sun.ac.za

16
The anion is hydrophobic and can chelate a cation from an aqueous phase to form an organic-soluble
chelate. Extraction by D2EHPA is pH dependant, as discussed in Chapter 2.5, but also depends on
the structure of the chelate and the valence of the cation (Rhodia, 2010).
The viscosity of the organic phase increases with loading (Kumar and Tulasie, 2005 and Kolarik and
Grimm, 1992). Kumar and Tulasi (2005) proposed a reaction mechanism which involves aggregation
of the metal-organic complexes in the bulk organic phase at high zinc loading conditions. The MR2
complexes (where M is the metal ion and R the D2EHPA anion), formed as discussed below in
Chapter 2.5, combine to form larger M2R4 complexes which have a severe effect on the viscosity of
the organic phase. The viscosity can be decreased by the addition of a small amount of extractant
which will break up the large complexes (Kumar and Tulasi, 2005).
A high D2EHPA concentration also increases the viscosity (Mansur et al., 2001). The D2EHPA
concentration should be high enough to provide sufficient extraction capacity, but not as high as to
compromise viscosity. Kerosene diluent addition is used to maintain the desired D2EHPA
concentration.
2.4 Rare earth and iron properties
The rare earth elements are located in the lanthanide series on the Periodic Table. In a phenomenon
known as lanthanide contraction, their atomic radii are reduced by the increased effective nuclear
charge over the sixth row transition elements (Gupta and Krishnamurthy, 2005). Lanthanide
contraction is responsible for the high densities of the rare earths and their very similar chemical
properties. Separation of a mixture of rare earths into individual elements is therefore not easy. With
the exception of samarium and ytterbium, which have oxidation states of 2+, and cerium, which is
tetravalent, all the other rare earth elements, including yttrium, have oxidation states of 3+. The
tetravalent ion is preferentially extracted to the trivalent ion, which is again better extracted than the
divalent ion (Gupta and Krishnamurthy, 2005).
Yttrium has a similar outer electron arrangement to that of the heavier lanthanides and also a similar
size due to lanthanide contraction. Yttrium has properties similar to the heavier lanthanides and is
often found with the heavier rare earths in nature. Yttrium is therefore also included as a heavy rare
earth, having properties to occur as a pseudo-lanthanide between erbium and ytterbium.
Stellenbosch University http://scholar.sun.ac.za

17
Based on the concentrations displayed on the graphs in Chapter 1, the elements of main interest for
this work are scandium, yttrium, ytterbium and erbium. Table 3 displays some of the properties of
these elements. It should be noted that scandium is not strongly affected by lanthanide contraction
since it has a very small ionic radius. The chemistry of scandium is therefore very different from the
other rare earths and it is not expected to show the same extraction and stripping behaviour.
Table 3: Properties of rare earth elements (Gupta and Krishnamurthy, 2005) Element Atomic number Atomic mass Valence Density
g/mol g/cm3
Scandium 21 44.96 2 2.989Yttrium 39 88.91 3 4.469Erbium 68 167.26 3 9.066
Ytterbium 70 173.04 3 or 2 6.966
Iron is a transition metal ion and not a rare earth element, but seems to behave similarly to the
lanthanides with regard to its extraction and stripping behaviour onto/from the organic phase.
2.5 Solvent extraction fundamental chemistry
During zinc solvent extraction, zinc is extracted according to equation 6, where D2EHPA is
represented by RH (Skorpion Zinc Solvent Extraction Operational Manual, 2003):
ZnSO4 + 2RH ↔ R2Zn + H2SO4 [Equation 6]
The zinc-loaded organic phase is then washed with spent electrolyte and demineralised water which
removes impurities by the following displacement reaction, where M is other base metal ions:
R2M + Zn2+ ↔ R2Zn + M2+ [Equation 7]
After washing, zinc is stripped from the organic to the aqueous phase (namely sulphuric acid spent
electrolyte) to produce loaded electrolyte for the downstream electrowinning process:
R2Zn + H2SO4 ↔ ZnSO4 + 2RH [Equation 8]
However, during the solvent extraction process of zinc, the organic phase is poisoned by other
elements, specifically iron, rare earths and scandium, which are co-extracted with the zinc and
Stellenbosch University http://scholar.sun.ac.za

18
accumulate on the organic. Iron is co-extracted with zinc according to (Skorpion Zinc Solvent
Extraction Operational Manual, 2003):
Fe2(SO4)3 + 6RH ↔ 2R3Fe + 3H2SO4 [Equation 9]
Once the zinc has been stripped from the organic, the organic phase is regenerated by removing the
iron with HCl (Skorpion Zinc Solvent Extraction Operational Manual, 2003):
R3Fe + 3HCl → 3RH + FeCl3 [Equation 10]
Since rare earths are present in low concentrations, it is suspected that the elements are extracted
onto D2EHPA to form chain polymer D2EHPA complexes which could have gel characteristics (Anticó
et al., 1996). Since Fe3+ is also present in low concentrations it may form chain polymers according to
equation 11 instead of reacting according to reaction 9. The rare earth extraction or organic poisoning
reaction is therefore (Anticó et al., 1996 and Gupta and Krishnamurthy, 2005):
(Y3+)aq + 3((RH)2)org ↔ (YR3.3HR)org + 3(H+)aq [Equation 11]
where rare earths are represented by the symbol for yttrium, Y.
The organic phase can then be stripped of rare earths by the reaction shown in equation 12 (Doyle et
al., 1993 and Konishi et al., 1998), where H+ is provided by an acid such as HCl, HNO3 or H2SO4, or
alternatively the H+ can be replaced by Na+ when using NaOH. The equilibrium constant for the
stripping reaction is given in equation 13. It shows that the reaction is strongly dependent on pH, with
the equilibrium constant inversely proportional to [H+]3.
YR3.3RH + 3H+ ↔ Y3+ + 3R2H2 [Equation 12]
33
32
3
]H][HR3.YR[
])HR][(Y[K +
+
= [Equation 13]
Stellenbosch University http://scholar.sun.ac.za

19
To remove rare earths from the after-stripping solution, further processing is possible by precipitation
with oxalic acid (Doyle et al., 1993 and Konishi et al., 1998):
2Y3+ + 3(COO-)2 → Y2((COO)2)3 [Equation 14]
The rare earth oxalate can then be further converted to an oxide by calcination if desired.
2.6 Variables affecting rare earth stripping
2.6.1 Stripping agent type and concentration
Limited information is available on rare earth removal from the specific D2EHPA-kerosene system of
interest here. Similar processes involving other organophosphorous organic phases were therefore
considered to provide a basis for test variable values. The literature research focused on the effect of
acid concentration on rare earth stripping, differences in extraction or stripping between different rare
earth elements and comparison of the results of different acids with each other.
Ramachandra Rao (2006) found that different concentrations of HCl are required to strip different
types of rare earths from an organic phase carrying multiple rare earth elements. For example, for
1 M D2EHPA in kerosene, carrying gadolinium, lanthanum and yttrium, 1.3 M HCl strips gadolinium
while 7 M HCl is needed for yttrium stripping. Similarly, Geist et al. (1999) and Lee et al. (2002) found
rare earth separation and extraction largely dependent on pH. This would be expected, based on the
inverse [H+]3 dependency of the equilibrium constant in equation 13.
Hirashima et al. (1978) also determined that different lanthanides and yttrium showed different
distribution ratios, according to atomic number, when extracted from HCl by D2EHPA. Yttrium and
erbium showed a similar extractability and ytterbium a slightly higher extractability. This was further
confirmed by Gupta and Krishnamurthy (2005) who found that, for any organophosphorous acid, the
extraction efficiency of rare earths increases with an increase in atomic number. This is attributed to
an increase in the electrostatic attraction strength between the extractant anion and the rare earth
cation as a result of cation decrease over the period. This means that stripping of the relevant rare
earth elements should be tested individually and not only one, for instance yttrium, and assumed that
it is indicative of the behaviour of all rare earth elements under discussion, although many similarities
exist.
Stellenbosch University http://scholar.sun.ac.za

20
Various stripping agents, including H2SO4, HNO3, HCl, KOH, NaOH and NH4OH can be used to strip
rare earth elements from the organic phase, depending on the organic phase under consideration as
well as the type of salt the element under consideration occurs in (Desouky et al., 2009, Gupta and
Krishnamurthy, 2005 and Mahmoud et al., 2008). Gupta and Krishnamurthy (2005) state that
D2EHPA extracts better from chloride than nitrate mediums, but did not compare it with sulphuric
acid. Lee et al. (2002) found sulphuric acid to be a superior stripping agent compared to hydrochloric
acid for the indium and gallium systems. Weiwei et al. (2006) found that sulphuric acid gave the best
stripping results of ytterbium from Cyanex 923, hydrochloric acid second and nitric acid third. It was
found that a low concentration of less than 0.2 M sulphuric acid is sufficient to give high (97 %)
stripping percentages of ytterbium from Cyanex 923. Although it is recognised that Cyanex 923 and
D2EHPA are not equivalent and do not use the same extraction mechanism (Flett, 2005), results from
the Cyanex system are considered as Cyanex is also an organophosphorous acid. Wu et al. (2007)
mention that, for D2EHPA, higher acidities are required for extraction and stripping than for most other
organophosphorous extractants.
From the literature review discussed above it can be concluded that the stripping reaction is highly
dependent on pH or, alternatively, acid concentration. It was therefore expected that experimental
results would show correlation between the stripping percentage achieved and the initial acid
concentration. Based on the literature, lanthanide contraction across the lanthanide period causes
differences in extractability and stripping of the different rare earth elements relative to each other. It
was therefore expected that, of the elements under consideration for this project, Y and Er will strip
easier than Yb, as a result of their relative atomic numbers. Comparing different acids with each
other, the literature research indicated that sulphuric acid performs better than HCl or HNO3 in terms
of rare earth stripping. The reasons for this were not explored in the literature reviewed. However,
based on the strong dependence of the equilibrium constant on hydrogen ion concentration and
relatively more hydrogen ions available in H2SO4 than in HCl or HNO3, this could be expected.
2.6.2 Equilibrium and mass transfer considerations
Desouky et al. (2009) and Mahmoud et al. (2008) found that the time needed for equilibrium to be
reached during yttrium stripping from primene-JMT and trazolopyrimidine are three minutes and five
minutes, respectively. Primene-JMT and trazolopyrimidine are other organics also used for rare earth
extraction. Weiwei et al. (2006) determined that the equilibrium time for ytterbium stripping from
Cyanex 923 is 18 minutes. Radhika et al., (2010) did extraction and stripping tests of light and heavy
rare earths with TOPS 99 (equivalent of di-2-ethylhexyl phosphoric acid) diluted in kerosene, using
Stellenbosch University http://scholar.sun.ac.za

21
phosphoric acid to provide hydrogen ions and found five minutes to be sufficient for reaching
equilibrium. It is therefore expected that the equilibrium time necessary will vary according to the rare
earth element to be stripped since the organic phase will be the same (D2EHPA in kerosene) for all
the tests. The effects of temperature, agitation rate and the type of agitator should also be considered
when determining equilibrium time.
Wang et al. (2010) and Wu et al. (2007) found ytterbium and yttrium reaction rates are limited by
mass transfer and that the stirring speed affects the mass transfer rate below 400 rpm. It is therefore
necessary to determine, for a specific experimental setup, the minimum agitation rate above which
mass transfer is no longer limiting the reaction rate.
2.6.3 Effect of temperature on stripping
Similar to extraction, stripping involves a change in entropy and enthalpy (Desouky et al., 2009) and is
therefore affected by temperature, but the literature review did not deliver specific results as to
whether the specific system under consideration would be endothermic or exothermic. However,
Wang et al. (2010) and Geist et al. (1999) found that rare earth extraction and stripping kinetics are
diffusion-controlled. Diffusion is affected by temperature since an increase in temperature provides
kinetic energy to the molecules, resulting in molecular movement. Based on the literature indication
that the reaction rate is influenced by diffusion, it is important to ensure sufficient mass transfer and
enough time to reach equilibrium if the effect of temperature is to be determined on the equilibrium
composition alone, without the effects that temperature has on mass transfer.
2.6.4 Effect of the organic-to-aqueous (O:A) ratio
Mahmoud et al. (2008) found that high stripping percentages of yttrium from triazolopyrimidine are
attainable at an O:A ratio of 1:1. Desouky et al. (2009) tested O:A ratios of 5:1 to 1:1 for stripping
yttrium from primene-JMT and found that stripping increased with a reduction in O:A ratio, with the
best stripping achieved at a ratio of 1:1. A review of the kinetics of rare earth extraction with D2EHPA
indicated that the reaction occurs mainly on the liquid-liquid interface (Geist et al., 1999). Based on
this it would be expected that the organic-to-aqueous ratio would influence the reaction since it affects
the effective liquid-liquid surface area.
Stellenbosch University http://scholar.sun.ac.za

22
No literature is available on whether there is any interaction between temperature, O:A ratio and the
concentration or type of stripping agent used affecting stripping efficiency. The mass transfer process
from the organic to the aqueous phase, through an interfacial layer, as indicated by Wang et al.
(2010) and Geist et al. (1999), would be influenced by all three of these factors. However, this does
not imply that there will be interaction effects amongst temperature, acid concentration and O:A ratio
at equilibrium.
Stellenbosch University http://scholar.sun.ac.za

23
Chapter 3: Materials and methods
3.1 Assumptions
The project scope was established based on the assumption that yttrium and other rare earth
elements could be stripped from the organic phase used in zinc solvent extraction by using the same
stripping agents as used in the rare earth industry for stripping during solvent extraction of rare earths.
This assumption was considered valid since the organic phase considered was D2EHPA in kerosene,
which is used on an industrial scale for rare earth solvent extraction. Also, the purpose of using
solvent extraction in the rare earth industry is to concentrate elements which are in low concentration
in the feed streams (Gupta and Krishnamurthy, 2005), similar to the case considered here, where rare
earths are present in low concentrations in the zinc-rich process streams.
It was further assumed that the laboratory experimental results would give a good indication of the
results that the plant process would yield. This was a valid assumption for the stripping and organic
health tests, since experience and literature have shown that experimental tests can closely simulate
plant conditions in SX (Bart et al., 1991). For the tests involving EW, this was not a very good
assumption for precise experimental values since the laboratory scale equipment was not a scaled-
down version of the plant size equipment, affecting mass transfer and inter-cathode-anode distance.
However, the trends shown by the laboratory data would be indicative of trends that can be expected
in the plant, based on literature where researches have tested the effect of other elements on zinc
electrowinning (O’Keefe et al., 1990).
3.2 Experimental design and methodology
3.2.1 Current efficiency tests
The effect that an increase in yttrium, erbium, scandium and ytterbium will have on zinc plating current
efficiency was investigated by using mini-cells in the laboratory.
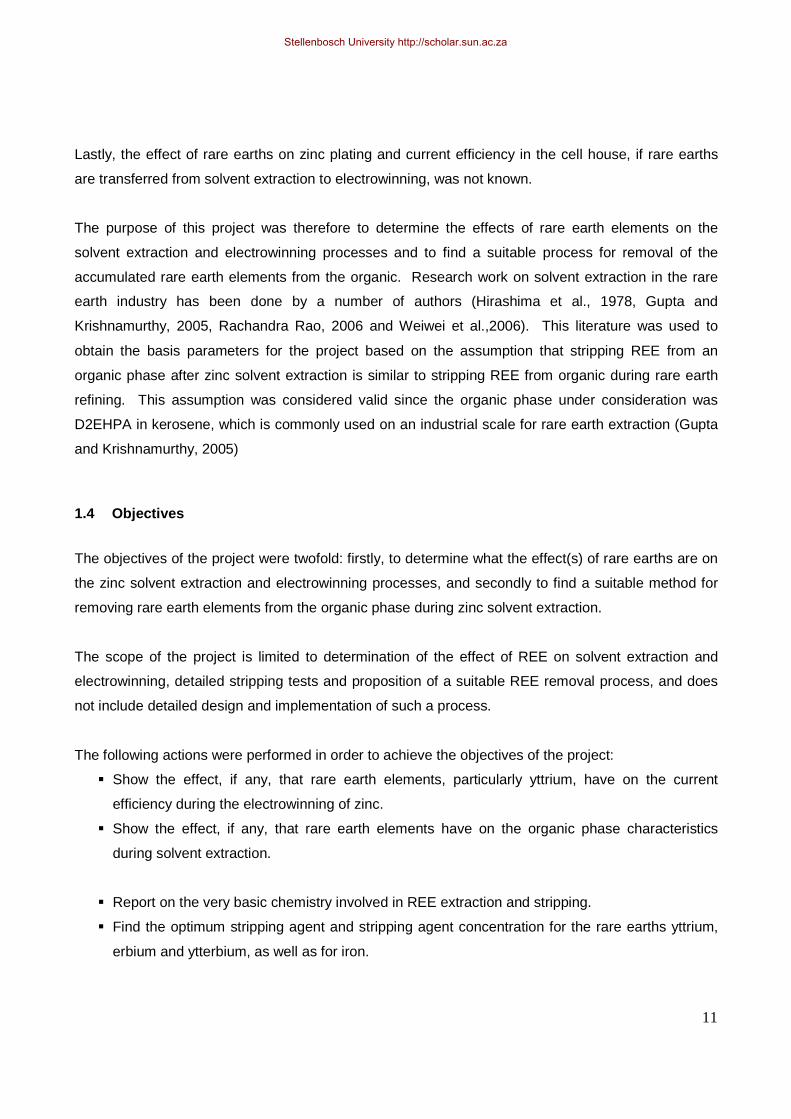
The mini-cell set-up is shown in the diagram in Figure 10. The mini-cells consisted of 500 mℓ glass
beakers with 1 cm2 aluminium cathodes and 1 cm2 lead-silver anodes (see Figure 11). The anode
and cathode are mounted in silicone, which is held in place in a Pyrex lid to ensure that the cathode
Stellenbosch University http://scholar.sun.ac.za
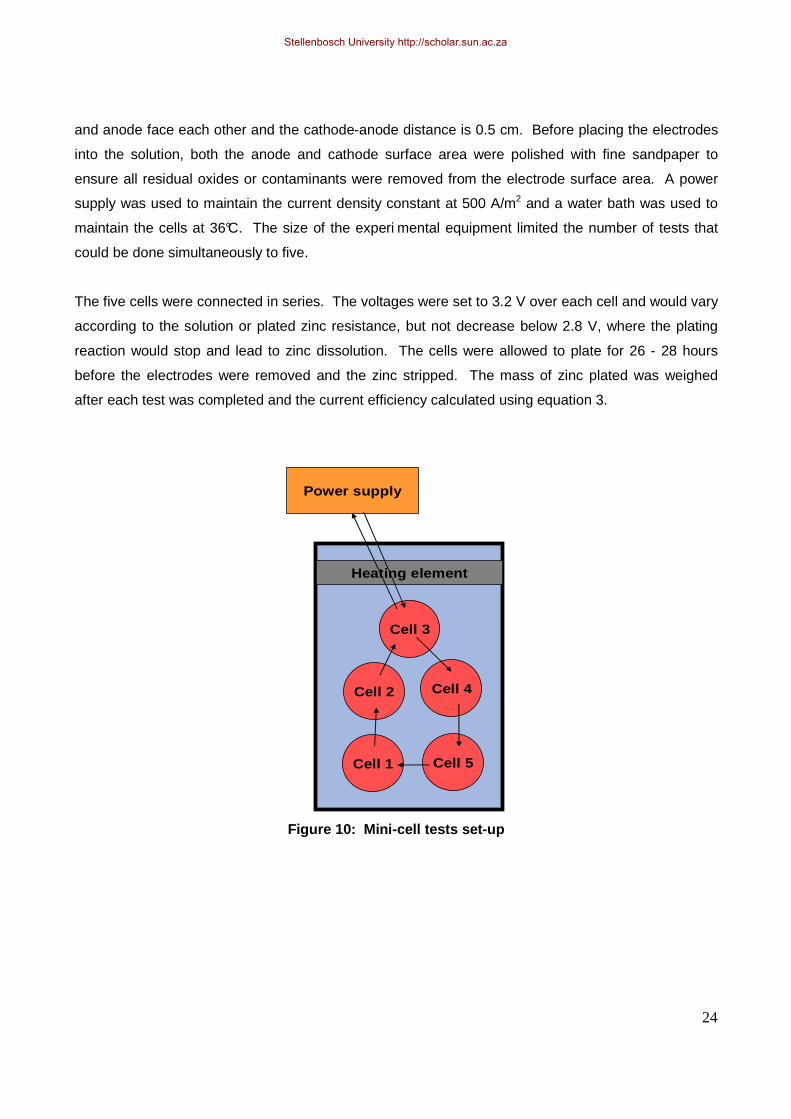
24
and anode face each other and the cathode-anode distance is 0.5 cm. Before placing the electrodes
into the solution, both the anode and cathode surface area were polished with fine sandpaper to
ensure all residual oxides or contaminants were removed from the electrode surface area. A power
supply was used to maintain the current density constant at 500 A/m2 and a water bath was used to
maintain the cells at 36°C. The size of the experi mental equipment limited the number of tests that
could be done simultaneously to five.
The five cells were connected in series. The voltages were set to 3.2 V over each cell and would vary
according to the solution or plated zinc resistance, but not decrease below 2.8 V, where the plating
reaction would stop and lead to zinc dissolution. The cells were allowed to plate for 26 - 28 hours
before the electrodes were removed and the zinc stripped. The mass of zinc plated was weighed
after each test was completed and the current efficiency calculated using equation 3.
Cell 3
Cell 4Cell 2
Cell 1 Cell 5
Heating element
Power supply
Figure 10: Mini-cell tests set-up
Stellenbosch University http://scholar.sun.ac.za
25
Figure 11: Mini-cell beaker with anode (left) and cathode (right)
Since the objective of this test work was to determine only the effect that rare earth elements have on
the electrowinning of zinc, all other variables (temperature, anode-cathode distance, acid
concentration and manganese concentration) were kept constant and only the rare earth
concentration in the electrolyte varied. Also, to ensure that results could be validated, two blanks
(control samples) were included in all batches of tests done to test repeatability of results across
batches and across cells within the same batch.
Two tests were done, but in three batches. The first test looked at the effect that different yttrium
concentrations have on the electroplating of zinc. The effect that it had was determined by looking at
the effect that it had on the current efficiency when plating, as well as visual observations of the plated
metal. The yttrium concentration was considered since it is the rare earth present in the highest
concentration in the spent electrolyte (see Figure 9). The second test (third batch) considered the
effect that the same increase in concentration of the different rare earth elements would have on the
zinc plating current efficiency, i.e., which rare earth element would have the most detrimental effect.
Table 4 shows the experimental design. The values were selected to see what an increase of
100 mg/l in yttrium’s concentration would do to the zinc plating current efficiency. For the batch where
Stellenbosch University http://scholar.sun.ac.za

26
the different elements were compared with each other, the concentration was uniformly increased by
200 mg/l to ensure that some effect is seen.
Table 4: Experimental design for mini-cell tests Test Element Cell Concentration (mg/l)
1 200 (blank)
2 600
3 200 (blank)4 1000
1 200 (blank)
2 300
3 200 (blank)
4 4005 500
Blank 1 SZ electroyte
Y 2 SZ electroyte + 200
Sc 3 SZ electroyte + 200
Er 4 SZ electroyte + 200 Yb 5 SZ electroyte + 200
3
Y1
Y2
For the first test, plant spent electrolyte (containing 50 g/l Zn, 175 g/l H2SO4, 2.5 g/l Mn, trace base
metal impurities, 200 mg/l Y, 21 mg/l Er and 3 mg/l Yb) was collected and spiked with 99.999%
element standard 100 000 mg/l Y solution to the desired Y concentration. According to Figure 9 the
plant spent electrolyte already had a baseline yttrium concentration of 200 mg/l. Y was then added to
give solutions containing 200, 300, 400, 500, 600 and 1000 mg/l Y, respectively. The solution
containing 200 mg/l Y was therefore the blank solution to which no further Y was added. For the
second test, the baseline levels of the rare earth elements were increased by 200 mg/l of Y, Yb, Er
and Sc. One cell was the control (‘blank’), with no elements added to the spent electrolyte.
3.2.2 Preparation of synthetic organic reagents
Two categories of experiments were performed: one group using organic from the Skorpion Zinc
solvent extraction plant and the other using synthetic organic manufactured in the laboratory. This
chapter discusses how the synthetic organic phase was prepared.
To manufacture synthetic organic, the rare earths and other ions such as Fe3+ and Zn2+ had to be
extracted from an aqueous phase onto the organic phase to ensure that the elements bind to the
organic. This was done in a 250 ml glass jacketed mixing cylinder (see Figure 12) with three baffles.
Stellenbosch University http://scholar.sun.ac.za

27
The baffle width was 5 mm from the inside surface of the cylinder and extended for the full height of
the cylinder. The agitator used for mixing had a single impeller composed of two 10 mm vertical
rectangular HDPE blades. The impeller-to-vessel diameter ratio was 0.8 and the clearance from the
bottom of the vessel to the impeller underside was 20 mm. An agitation rate of 500 rpm was used.
The temperature inside the cylinder was maintained with a continuous water stream at a set
temperature of 30°C flowing through the jacket.
Figure 12: Jacketed glass mixing cylinder used for experiments
Three batches of the synthetic organic phase were required: one with a high concentration of
elements bonded to it, one with a middle concentration and one with a low concentration of elements
on it. Table 5 shows the desired element concentrations on the organic. It was expected that the
exact values in Table 5 would not be obtained. However, the aim was only to produce three
variations of organic where there is a clear distinction between low, middle and high element
concentrations. It was found that a lower acid concentration increases the percentage extraction
(Mahmoud et al., 2008, and Desouky et al., 2009), which is in agreement with equation 11 which
shows that a low hydrogen ion concentration favours the forward reaction. It was therefore decided to
make up the aqueous phase in 0.5 M H2SO4.
Stellenbosch University http://scholar.sun.ac.za

28
Table 5: Element concentrations on organic
Low Middle HighY 700 1100 1500
Yb 300 450 600Er 80 110 140Zn 1000 1000 1000Fe 200 300 400Sc 65 65 65
Concentration (mg/l)Element
A factorial design, considering three concentration levels and two temperature levels (see Appendix
A), was used to design the experiments for synthetic organic manufacture. The experiments were
planned to show the effect of the “concentration” and “temperature” parameters on the response
variable, which was “percentage extraction” in this case, as well as interactions between the
parameters. A fractional factorial design was used since the aim was to obtain only a guideline for
the extraction that can be expected at different conditions. The results were used to establish at
which conditions sufficient extraction of rare earths onto the organic will be obtained to give the
desired organic phase for use in the test work.
The following experimental method was followed to manufacture synthetic organic containing rare
earths of a desired concentration: Firstly, a synthetic aqueous phase with a composition of 1200 mg/l
Y, 500 mg/l Yb, 120 mg/l Er, 300 mg/l Fe, 70 mg/l Sc, 1000 mg/l Zn and 0.5 M H2SO4 was
manufactured. For each test, 100 mℓ of the synthetic aqueous and 100 mℓ of pure organic phase
(giving an O:A ratio of 1:1, as is used in the Skorpion Zinc process for zinc extraction) were mixed
together.
The aqueous phase consisted of 99.999% element standards of Y, Yb, Er, Fe, Sc and Zn diluted in
demineralised water to the desired concentrations. The organic phase consisted of 40 wt% D2EHPA
and 60 wt% kerosene, with a D2EHPA specification of 95 wt% D2EHPA (minimum), 3 wt% MEHPA
(maximum) and 5 wt% water (maximum).
The solution was mixed for 12 minutes where after two minutes were allowed for phase
disengagement. Based on literature that report five minutes to be sufficient to reach equilibrium
(Radhika et al., 2010), 12 minutes were selected as an adequate mixing time. The aqueous and
organic phases were collected separately and the organic phase filtered through silicon dioxide-
Stellenbosch University http://scholar.sun.ac.za

29
coated filter paper to remove any entrained aqueous. The samples were then dispatched for ICP-
OES analysis of the rare earth element and iron concentrations.
Once the effect of different conditions had been determined on the extraction behaviour of rare earths,
a large volume of organic was manufactured with as close as possible to the desired element
concentrations, so that all the tests discussed below could be done with the same organic, eliminating
inaccuracies introduced by changes in the organic phase.
3.2.3 Organic health tests
Organic health tests involved determining the phase disengagement, viscosity and zinc loading
characteristics of the organic phase. These characteristics were measured when zinc was extracted
from pregnant leach solution (aqueous phase) onto the organic phase. Using the method discussed
in chapter 3.2.2, three synthetic organic phases with ”low”, ”medium” and ”high” concentrations of rare
earths and iron relative to plant organic were prepared. Clean organic, containing only D2EHPA and
kerosene and no rare earths, and plant zinc-stripped organic were the other two organic phases used.
The tests were done using the same mixing cylinder and associated equipment as displayed in
Figure 12. Zinc was extracted onto the organic phases from plant pregnant leach solution and
synthetic PLS containing 31 g/l Zn, 0.5 g/l Cu, 0.5 g/l Cd, 0.5 g/l Ni and 0.5 g/l Ca in sulphate solution
with a pH of 4. For the nine experiments that were performed (see Table 6), the type of PLS and
organic phase used were varied. The temperature was kept constant at 43°C and the O:A ratio at 1:1.
Table 6: Organic and aqueous phases used for phase disengagement tests
Test Organic phasePregnant leach
solutionY Er Yb Sc Fe
1 Low REE 2000 130 700 70 200 Plant2 Medium REE 3000 200 1000 100 300 Plant3 High REE 4000 300 1500 150 400 Plant4 Clean organic Plant5 Plant Zn-stripped Plant6 Low REE 2000 130 700 70 200 Synthetic7 Medium REE 3000 200 1000 100 300 Synthetic8 Medium-High REE 3500 250 1250 125 350 Synthetic9 High REE 4000 300 1500 150 400 Synthetic
Organic phase composition (mg/l)
below detectionnot determined
Stellenbosch University http://scholar.sun.ac.za

30
For each test, 200 mℓ of the aqueous and 200 mℓ of the organic phase were added together in the
mixing cylinder and agitated for 15 minutes at 620 rpm where after agitation was stopped. The
following procedure was followed to determine phase disengagement time: a vertical strip of tape
was stuck onto the outside of the mixing cylinder. Once the agitation was stopped, the level of the
mixture was marked with a pen. As time progressed, the level of the emulsion band was marked off
on the strip every 10 seconds using a stopwatch. Once the emulsion band was zero, the stopwatch
was stopped and the total phase disengagement time was recorded. A plot of the emulsion band
level against time yielded the disengagement profile. This was the first loading stage and simulated
the first stage in an extraction operation.
The aqueous phase was then drained and another 200 mℓ of fresh aqueous phase added. The
mixture was again agitated for 15 minutes and the phase disengagement time measured. This was
the second loading or second stage in a mixer-settler operation. After the second loading stage, the
aqueous phase was drained and the organic phase collected.
10 mℓ of the organic phase was used to measure the kinematic viscosity with an Anton Paar
Stabinger SVM 3000 viscometer (0.35% accurate on kinematic viscosity measurements and to
0.0005 g/cm3 on density measurements). The organic sample was then analysed for Zn to determine
the amount of zinc that had been loaded onto the organic phase after two extraction stages. The
results were compared for the different organic and aqueous phases used.
3.2.4 Stripping tests
The experiments were divided into 4 groups, namely A to D. The groups are defined in Table 7 and
the experimental variables that were used for each test are indicated in Appendix A.
Table 7: Definition of experiments Group Definition
A Optimum stripping agent type and concentration with O:A and temperature interactions
B Optimum stripping agent concentration (more detail)
C Results validation: Agitation rate, Equilibrium time, REE concentrationD Optimum O:A and temperature (more detail)
Stripping agent concentration, O:A ratio and temperature were identified as the key variables
influencing REE stripping. The experimental design used was a factorial design looking at four levels
Stellenbosch University http://scholar.sun.ac.za

31
for stripping agent type, three levels for acid concentration, two levels for O:A ratio and two levels for
temperature (see Appendix A).
Based on the literature review, the stripping agent type and the acid concentration were seen to be
the most influential in the stripping percentage achieved, and therefore the factorial design increased
the levels of these two parameters. Four stripping agents were tested, the O:A factor at a ”high” and
”low” value and the temperature (T) parameter at a ”high” and ”low” value. The concentration
parameter was tested on ”high”, ”middle” and ”low” values to eliminate the possibility of a polynomial
relationship between percentage extraction and concentration being distorted as a linear relationship
when only two values are tested. The fractional factorial design would also indicate any interactions
between any two parameters, affecting the response variable.
This experimental design would show which stripping agent is the most effective at ”high”, ”middle”
and ”low” concentrations and whether the temperature and the O:A ratio affect stripping. It would
show whether there is any interaction between temperature, O:A, concentration and the concentration
of stripping agent used.
The same equipment was used for the stripping tests as was explained in Chapter 3.2.2 and Chapter
3.2.3. For the “A” tests as indicated in Appendix A, the following experimental method was followed to
strip rare earths from synthetic organic: aqueous solutions of HCl, HNO3 and H2SO4 at 1 M, 3 M and
5 M were made up and NaOH at 20%. 70 mℓ of the aqueous phase and 140 mℓ of the synthetic
organic phase were added together for an O:A ratio of 2:1 or 140 mℓ of aqueous and 70 mℓ of the
synthetic organic phase for an O:A ratio of 1:2.
The mixture was agitated for 12 minutes at 500 rpm in the jacketed glass mixing cylinder (see
Figure 12) where after agitation was stopped and two minutes allowed for phase disengagement. The
temperature of the glass mixing cylinder was maintained at a desired temperature between 30°C and
50°C. The aqueous and organic phases were collected separately and the organic phase filtered
through silicon dioxide-coated filter paper to remove any entrained aqueous. Samples were then
dispatched for ICP-OES analysis of rare earths.
The same method and equipment were used for the “B”,”C” and “D” experiments indicated in
Appendix A, with only the parameters changing as indicated.
Stellenbosch University http://scholar.sun.ac.za

32
3.2.5 Stripping tests variables
The values of the variables that will be investigated are discussed below. The choice of values was
based on the literature discussed in Chapter 2.6 and practical considerations.
Stripping agent type
HCl, HNO3 and NaOH were tested as stripping agents on a bench scale to determine the most
effective one for the current REE element concentrations and also taking into consideration the
Skorpion Zinc process. H2SO4 was investigated based on the literature from Weiwei et al. (2006) and
Lee et al. (2002), and since it is of high availability at the Skorpion Zinc refinery which has a sulphuric
acid plant as an auxiliary plant to the main zinc refining process.
Stripping agent concentrations
For this test work, HNO3, HCl and H2SO4 were investigated in the range of 1 – 7 M and NaOH at
concentrations of 20 – 30 %.
Equilibrium and mass transfer considerations
Test work was done with mixing times of 12 minutes. According to literature, equilibrium is achieved
in five minutes (Radhika et al., 2010); the selected mixing time would hence be long enough to
achieve equilibrium.
Agitation rates of 400, 500 and 600 rpm were investigated to ensure that the stripping reaction was
not mass transfer limited and that the results achieved were not influenced by the agitation rate.
Effect of temperature on stripping
Temperatures of 30 – 55°C were investigated since these temperatures span the temperature range
of 40 – 45°C that is maintained in the zinc solvent extraction plant at Skorpion Zinc.
Effect of the Organic:Aqueous (O:A) ratio
Preliminary tests were done at O:A ratios of 1:2 (low) and 2:1 (high) to determine whether there were
any interactions between the different variables. Thereafter, the range of O:A ratios from 0.25 to 6.0
Stellenbosch University http://scholar.sun.ac.za

33
were tested to establish whether the test results correlate with the trend from literature as mentioned
in Chapter 2.6.4.
Stellenbosch University http://scholar.sun.ac.za
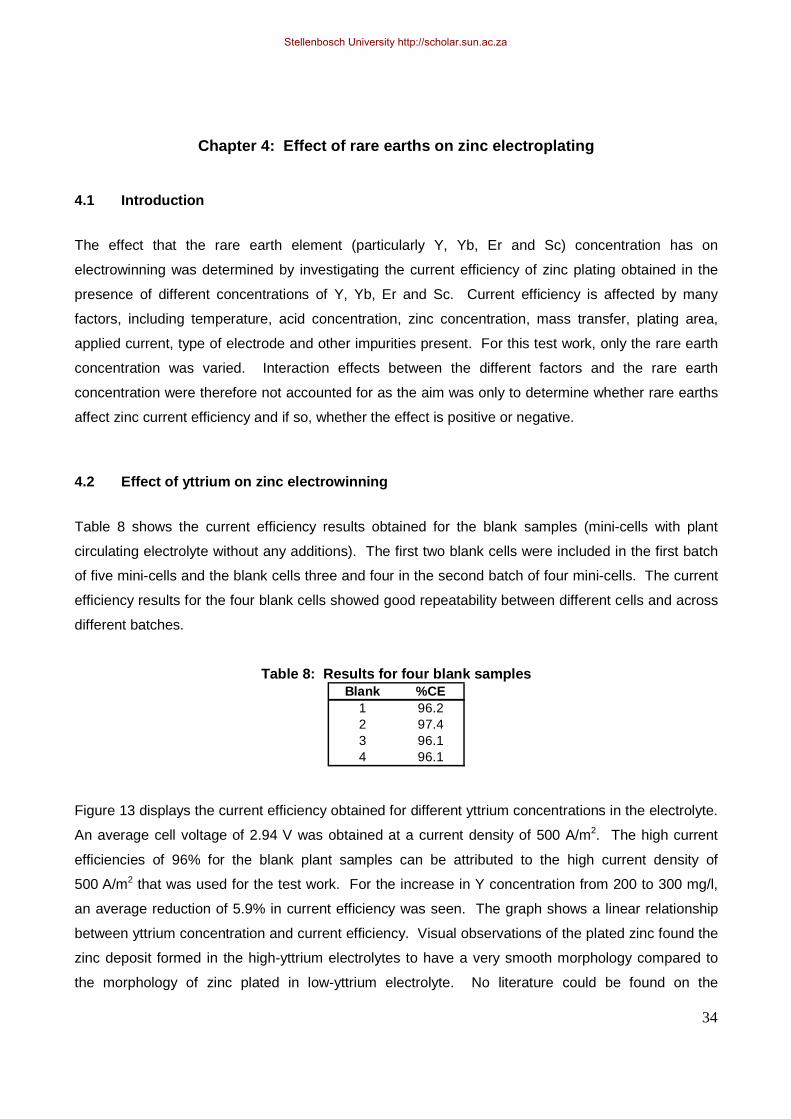
34
Chapter 4: Effect of rare earths on zinc electroplating
4.1 Introduction
The effect that the rare earth element (particularly Y, Yb, Er and Sc) concentration has on
electrowinning was determined by investigating the current efficiency of zinc plating obtained in the
presence of different concentrations of Y, Yb, Er and Sc. Current efficiency is affected by many
factors, including temperature, acid concentration, zinc concentration, mass transfer, plating area,
applied current, type of electrode and other impurities present. For this test work, only the rare earth
concentration was varied. Interaction effects between the different factors and the rare earth
concentration were therefore not accounted for as the aim was only to determine whether rare earths
affect zinc current efficiency and if so, whether the effect is positive or negative.
4.2 Effect of yttrium on zinc electrowinning
Table 8 shows the current efficiency results obtained for the blank samples (mini-cells with plant
circulating electrolyte without any additions). The first two blank cells were included in the first batch
of five mini-cells and the blank cells three and four in the second batch of four mini-cells. The current
efficiency results for the four blank cells showed good repeatability between different cells and across
different batches.
Table 8: Results for four blank samples Blank %CE
1 96.22 97.43 96.14 96.1
Figure 13 displays the current efficiency obtained for different yttrium concentrations in the electrolyte.
An average cell voltage of 2.94 V was obtained at a current density of 500 A/m2. The high current
efficiencies of 96% for the blank plant samples can be attributed to the high current density of
500 A/m2 that was used for the test work. For the increase in Y concentration from 200 to 300 mg/l,
an average reduction of 5.9% in current efficiency was seen. The graph shows a linear relationship
between yttrium concentration and current efficiency. Visual observations of the plated zinc found the
zinc deposit formed in the high-yttrium electrolytes to have a very smooth morphology compared to
the morphology of zinc plated in low-yttrium electrolyte. No literature could be found on the
Stellenbosch University http://scholar.sun.ac.za

35
mechanisms by which yttrium affects zinc plating. However, the smooth morphology might be
indicative of hydride formation, but this has not been proven yet.
40
50
60
70
80
90
100
0 200 400 600 800 1000 1200
Y concentration (mg/l)
Cur
rent
Effi
cien
cy (%
)
Figure 13: Current efficiency as a function of Y concentration in spent electrolyte
4.3 Effect of different rare earths on zinc electrowinning
Mini-cell tests were also done where 200 mg/l of different rare earth elements were added to the
circulating electrolyte from the plant. From the calculated current efficiencies displayed in Figure 14,
an increase in the scandium concentration had the most detrimental effect, reducing the current
efficiency by 38%. In order of decreasing current efficiency the elements tested showed: Y > Yb > Er
> Sc.
Stellenbosch University http://scholar.sun.ac.za

36
0
10
20
30
40
50
60
70
80
90
100
Blank Y Sc Er Yb
REE element
Cur
rent
Effi
cien
cy (%
)
Figure 14: Current efficiency for different REE increased by 200 mg/l
4.4 Conclusions
From the results an increase of 100 mg/l in the electrolyte yttrium concentration caused a decrease of
5 % in current efficiency. Current efficiencies for cells containing REE elements showed that Sc had
the most detrimental effect, followed by Er, Yb and Y. The mechanism by which these elements
affect zinc plating is not known. The presence of rare earth elements in the electrolyte is possibly
originating from rare earth elements stripped with Zn from the loaded organic phase in SX. In order to
reduce REE levels in EW it is therefore first necessary to reduce the concentration on the organic
phase in SX. Once incoming concentrations on the loaded electrolyte are lower than that in the spent
electrolyte, rare earths in accumulation will be reduced by the bleed stream to SX.
Stellenbosch University http://scholar.sun.ac.za
37
Chapter 5: Effect of rare earths on organic phase health
5.1 Introduction
The effect that rare earth elements have on the viscosity, phase disengagement time and zinc loading
capability of the organic phase was investigated. Organic phases containing different concentrations
of rare earths were firstly prepared and then loaded with either synthetically manufactured leach
solution or leach solution from the Skorpion Zinc process plant. Only the effect of the organic rare
earth element concentration was investigated, although it is recognised that a number of factors,
including temperature, pH and mixing, affect organic viscosity, phase disengagement time and zinc
loading.
5.2 Synthetic organic manufacture
Clean industrial-grade kerosene (60%) and D2EHPA (40%) were contacted with an aqueous solution
of rare earth elements containing different concentrations of Y, Er, Sc and Yb, and also Fe and Zn to
prepare a synthetic organic phase with specific rare earth concentrations. The aqueous solution
contained 0.5 M H2SO4. The results are plotted in Figure 15. Tests one and two were done with an
aqueous solution having a ”low” concentration of rare earths, tests three and four with a ”middle”
amount of rare earths compared to the current levels in the plant and tests five and six with an
aqueous phase containing a ”high” amount of rare earths. O:A ratios of 1:1 were used in all tests.
Tests one, three and five were performed at 30°C an d tests two, four and six at 50°C.
Stellenbosch University http://scholar.sun.ac.za

38
0
200
400
600
800
1000
1200
1400
Low REE,30 °C
Low REE,50 °C
Med REE,30 °C
Med REE,50 °C
High REE,30 °C
High REE,50 °C
Test
Con
cent
ratio
n (m
g/l)
Y Er Sc Fe Zn Yb
Figure 15: Rare earth, iron and zinc concentration on synthetic organic
From Figure 15 it can be seen that the temperature difference did not significantly affect extraction of
the elements from the aqueous to the organic phase. The results showed that the average
percentage extraction was 85% for the rare earths and yttrium and 100% for iron.
Zinc did not extract well (only 5% extraction) onto the organic, yielding concentrations of 20 – 50 mg/l
and the desired 1000 mg/l as in the plant could not be achieved. The reason for the poor zinc
extraction is attributed to the hydrogen ion concentration. Based on the Zn and REE extraction
reactions given in equations 6 and 11, respectively, the equilibrium constant for the Zn extraction
reaction is dependent on the square of the hydrogen ion concentration and while the equilibrium
constant for the rare earth extraction reaction is dependent on the third power of the hydrogen ion
concentration. This means that for a hydrogen ion concentration of less than one mol per litre, the
REE extraction reaction would be favoured. The test work was continued with the low zinc
concentration on the synthetic organic since the main focus was the rare earths and not the zinc as
the process solution under consideration was the zinc-stripped organic. However, this should be
taken into account when comparing results for plant- and synthetic organic.
The results were used to prepare the synthetic organic phases containing different concentrations of
Y, Yb, Er, Sc and Fe needed for the stripping and loading tests.
Stellenbosch University http://scholar.sun.ac.za

39
5.3 Zinc loading Zn was extracted from plant PLS containing 32 g/l Zn onto the synthetically manufactured organic
phases discussed in the previous chapter. The organic phases were also loaded with synthetic PLS
containing 31 g/l Zn, 0.5 g/l Cu, 0.5 g/l Cd, 0.5 g/l Ni and 0.5 g/l Ca. Figure 16 gives the Zn loading
obtained after two extraction stages.
15
16
17
18
19
20
21
22
2000 3000 4000 5000 6000 7000
Zn
load
ing
(g/l)
Total organic REE & Fe concentration (mg/l)
Synthetic PLS Plant PLS
Figure 16: Effect of total REE concentration on zinc loading
At 3000 mg/l REE and Fe, plant PLS loaded 21.4 g/l Zn onto the organic phase, while the synthetic
PLS only loaded 19.9 g/l Zn. The synthetic PLS contained 30 g/l Zn (0.46 mol/l) while the plant PLS
contained 32 g/l Zn (0.49 mol/l) at the time of sampling. Consider the Zn extraction reaction again:
ZnSO4 + 2RH ↔ R2Zn + H2SO4 [Equation 6]
The organic phase used contained 40 wt% D2EHPA, which presents 2 mol/l D2EHPA (indicated by
RH in the equation). D2EHPA was therefore in excess while zinc was the limiting reactant, explaining
why the plant PLS achieved a higher zinc loading on the organic phase. Based on the equilibrium
constant, an increase in D2EHPA concentration would drive the extraction reaction forward.
However, the D2EHPA concentration used in these experiments was the same for extraction with
plant- and synthetic PLS, therefore the zinc concentration is the only variable.
Stellenbosch University http://scholar.sun.ac.za

40
When synthetic PLS was used, zinc loading reduced with an increase in rare earth concentration.
Plant PLS also followed a decreasing trend for the first two REE concentrations tested, but this was
not supported by the third point. The tests with plant PLS should be repeated to verify the trend.
Converting mass concentrations to molar concentrations, 3000 mg/l REE would present 0.03 mol/l
rare earth elements on the extractant and 6000 mg/l REE would present 0.07 mol/l rare earths.
Considering the stoichiometry in equation 11, 0.2 mol/l D2EHPA would be consumed at 3000 mg/l
REE and 0.4 mol/l D2EHPA at 6000 mg/l REE if a theoretical 100% conversion is considered
D2EHPA would therefore still be in excess. However, as the rare earth concentration increases it has
the potential to start competing with Zn for D2EHPA. Based on the stoichiometry, it is not expected
that Zn loading will increase at higher REE and iron concentrations, indicating that the third point on
Figure 16 for plant PLS is an outlier. The available results for synthetic PLS give sufficient indication
of the negative effect of the REE concentration on zinc loading to motivate removal of the rare earths.
Figure 17 aims to compare the results obtained in the lab when using synthetic organic, with clean
organic and zinc-stripped organic from the solvent extraction plant. The zinc-stripped plant organic
produced results similar to the synthetic organic phase, but the pure organic phase extracted only
11.6 g/l Zn. The poorer zinc loading of the ”clean” organic in Figure 17 can possibly be attributed to a
lower extent of hydrogen bonding to improve the ease of metal loading, since the ”clean” organic did
not have previous exposure to acid such as the other organic phases used for this test work.
10
12
14
16
18
20
22
Low REE Medium REE High REE Clean Organic Plant Organic
Zn
load
ing
(g/l)
Figure 17: Maximum zinc loading after two extraction stages
Stellenbosch University http://scholar.sun.ac.za

41
5.4 Organic phase viscosity
Viscosity was measured after the second extraction stage. For organic loading with synthetic PLS,
the organic phase viscosity increased linearly with an increase in the rare earth and iron concentration
(see Figure 18). Since the most common complex formed in rare earth extraction is (YR3.3HR)org
compared to R2Zn that is formed during zinc extraction, it was expected that the viscosity would
increase due to the bulkier complex as rare earth co-extraction increased at higher rare earth
concentrations.
After extraction from plant PLS, the organic viscosity also showed an increase of viscosity with REE
and Fe concentration. The first two points show good comparison between the results obtained for
synthetic and for plant pregnant leach solution. Since the third point was considered an outlier in
Figure 16, it might have a higher viscosity due to combined high Zn and REE and Fe loadings, and
would therefore also be considered an outlier on Figure 18.
Plant PLS contained additional elements such as Mn, Mg, Ca and Al not present in the synthetic PLS.
However, of these, only Mn and Mg were present in significant concentrations in the PLS and do not
extract onto D2EHPA. The co-extractable elements such as Cu, Cd, Ni and Ca were present in
approximately the same concentrations in the synthetic and plant PLS. Chloride and fluoride as well
as suspended solids were also present in the plant PLS, but were of low extractable concentration.
From visual observations during the experiments it was also noted that at higher viscosity air and
aqueous could be seen to be entrained in the organic phase, as would be expected.
Stellenbosch University http://scholar.sun.ac.za

42
0
20
40
60
80
100
2000 3000 4000 5000 6000 7000
Vis
cosi
ty (
mP
a.s)
Total organic REE & Fe concentration (mg/l)
Synthetic PLS Plant PLS
Figure 18: Viscosity vs organic phase rare earth concentration
Viscosity was found to be a linear function of organic phase density (see Figure 19). The increase in
density is very small, but more than the 0.0005 g/cm3 accuracy error that the viscometer is expected
to contribute. The increase in density as the rare earth loading increases was expected since the
(YR3.3HR)org complex bonds twice the amount of organic that Zn does in R2Zn. The small increase in
density was possibly due to the low concentration of rare earths complexes.
The viscosity is influenced by the type of bonding between the metal element and the extractant.
When the metal ion is extracted, it reacts on the liquid-liquid interface to form the MR2(HR) complex,
(where M is the metal ion and R the D2EHPA anion). The additional HR carries the complex into the
bulk organic phase. At low metal loading conditions, MR2(HR) break up to release the carrier
molecule and form MR2 in the bulk phase, decreasing viscosity as MR2 have a similar size to the
D2EHPA dimer, HR-RH, existing in the organic bulk phase.
However, at high metal loading conditions, the carrier complex, MR2(HR) will aggregate in the bulk
phase to form M2R4 and release the carrier molecule for extraction (Kolarik and Grimm, 1976 and
Kumar and Tulasi, 2005). Since the rare earths utilise more D2EHPA per mole of metal than zinc, it
increases the possibility of “high loading” conditions for the rest of the D2EHPA. Aggregation would
significantly increase viscosity and explains why the viscosity increased in Figures 18 and 19 as the
rare earth loading increased.
Stellenbosch University http://scholar.sun.ac.za

43
0
10
20
30
40
50
0.8895 0.8900 0.8905 0.8910 0.8915 0.8920
Density (g/cm 3)
Vis
cosi
ty (m
Pa.
s)
Figure 19: Relationship between organic phase viscosity and density
5.5 Phase disengagement time
The effect that the rare earth element concentration has on the phase disengagement time of the
organic phase was determined when zinc was extracted from plant and synthetic pregnant leach
solution onto organic. Synthetic organic containing different concentrations of rare earths and iron
were used (as indicated in Table 6). The time needed for the organic and aqueous phases to
completely separate after the first extraction stage was measured. Phase disengagement time
measurement was repeatable to within 5 seconds.
The disengagement profiles for extraction from synthetic PLS are shown in Figure 20. The samples
for “low” and “medium” rare earths, as well as the “clean organic” and “plant organic” samples in
Figures 20 and 21 show typical separation profiles, with initial slow separation, followed by faster
separation and slow separation at the end; this observation is in agreement with results published by
Musadaidzwa and Tshiningayamwe (2009). Initial disengagement is slow as the interfacial surface
area where interfacial tension has to be overcome is large, slowing coalescence (Hoh et al., 1986).
As the interfacial surface area reduces coalescence becomes easier and the greater areas of bulk
phase allow the effect of density difference to separate the phases. Disengagement rate decrease at
the end since the drive for density difference is less as the emulsion height is small, with diffusion
ensuring that the last droplets are coalesced. As the rare earth and iron concentration increased the
Stellenbosch University http://scholar.sun.ac.za

44
phase disengagement profile was stretched as the viscosity increased and a more stable emulsion
formed. This resulted in a phase separation time of 15 minutes which would be problematic for mixer-
settler operation.
0
10
20
30
40
50
60
70
80
90
0 100 200 300 400 500 600 700
Time (s)
Em
ulsi
on h
eigh
t (m
m)
Low REE Medium REE Medium-High REE High REE
Figure 20: Phase disengagement times for organic after first zinc loading with synthetic
pregnant leach solution
The phase disengagement profiles for extraction from plant PLS are shown in Figure 21 and are
similar to that for the synthetic PLS with the phase disengagement time increasing with an increase in
the organic phase rare earth concentration. Disengagement times were faster when using synthetic
PLS than when plant PLS was used. Plant PLS also contained chlorides and fluorides which might
form chloro-complexes with the organic phase; however, this is not expected to occur in major
concentrations.
Stellenbosch University http://scholar.sun.ac.za

45
010
2030
4050
6070
8090
0 100 200 300 400 500 600 700 800 900 1000
Time (s)
Em
ulsi
on h
eigh
t (m
m)
Low REE Medium REE High REE Clean organic Plant organic
Figure 21: Phase disengagement times for organic after first zinc loading with plant pregnant
leach solution
Figure 22 plots the phase disengagement time after the first loading and second loading stages. For
the first stage, phase disengagement time increased as the rare earth and iron concentration
increased. After the second stage, phase disengagement time was high at low rare earth
concentrations, decreased for medium concentrations and then increased again for high rare earth
concentrations. At high rare earth concentrations or high zinc loading (at low rare earth
concentrations) it was expected that aggregation would occur, viscosity would increase and phase
disengagement time should increase. However, according to Figures 23 and 24, the viscosity was low
at low organic rare earth and iron concentrations. This low viscosity was not expected at the high zinc
loading conditions where non-ideal behaviour would occur in the organic phase (Bart et al., 1992 and
Kumar and Tulasi, 2005).
Stellenbosch University http://scholar.sun.ac.za

46
0
200
400
600
800
1000
1200
2000 3000 4000 5000 6000 7000
Total REE & Fe concentration (mg/l)
Pha
se d
isen
gage
men
t tim
e (s
)
PD time 1st loading PD time 2nd loading
Figure 22: Phase disengagement time after 1 st and 2 nd zinc loadings
Figure 23 shows that that the plant zinc-stripped organic had a similar phase disengagement time as
the synthetic organic phase containing ”medium” concentrations of rare earths. The clean organic
phase had the lowest viscosity and phase disengagement time as would be expected due to the low
zinc loading on the clean organic phase.
0
20
40
60
80
100
Low REE Medium REE High REE CleanOrganic
Plant Organic
Vis
cosi
ty (m
Pa.
s)
0
200
400
600
800
1000
1200
1400
Pha
se d
isen
gage
men
t tim
e (s
)
Viscosity PD time
Figure 23: Viscosity and phase disengagement times after first Zn loading for different organic phases
Stellenbosch University http://scholar.sun.ac.za

47
0
200
400
600
800
1000
1200
1400
0 20 40 60 80 100
Viscosity (mPa.s)
Pha
se d
isen
gage
men
t tim
e 2n
d lo
adin
g (s
)
Synthetic PLS Plant PLS
Figure 24: Phase disengagement time against viscosity
5.6 Conclusions
Based on the results discussed above for the organic health test work, it can be concluded that the
rare earth loading reduces the organic phase zinc loading and competes with Zn for D2EHPA so that
“high loading” conditions arise, causing aggregation of the Zn-D2EHPA complex formed. Increased
aggregation results in increased organic phase viscosity and increased phase disengagement time.
As the rare earth loading doubled from a total of 3100 mg/l to 6250 mg/l, the organic phase viscosity
after the second loading stage doubled and the phase disengagement time increased from 100 to 700
seconds. The zinc loading after two extraction stages with synthetic PLS decreased from 19.9 to
17.2 g/l. The zinc loading for plant PLS also decreased from 21.4 g/l to 20.1 g/l as the organic REE
and Fe concentration increased from 3200 to 4600 mg/l. Higher rare earth element concentrations in
the organic phase therefore have a detrimental effect on the organic phase characteristics and should
be removed.
Stellenbosch University http://scholar.sun.ac.za

48
Chapter 6: Stripping rare earth elements from the organic phase
6.1 Introduction Based on the negative effect of rare earths on the organic phase discussed in the previous chapter, a
process for stripping rare earths from the organic phase was investigated. The laboratory test work
first considered removal of rare earths from a synthetically manufactured organic phase where after
the same experiments were attempted with zinc-stripped organic from the Skorpion Zinc solvent
extraction plant.
6.2 Rare earth and iron stripping from synthetic organic
Stripping was first tested with an organic phase that had been prepared in the laboratory by loading
industrially pure D2EHPA and kerosene with Y, Yb, Er, Sc and Fe. Experimental results can be found
in Appendix B.
6.2.1 Stripping agent type and concentration
Figures 25 – 28 show the effect of different concentrations of stripping agents on the stripping of
yttrium, erbium and ytterbium from organic.
Stellenbosch University http://scholar.sun.ac.za

49
0
20
40
60
80
100
0 1 2 3 4 5 6
Acid Concentration (M)
% S
tripp
ing
HCl - Y HCl - Er HCl - YbHNO3 - Y HNO3 - Er HNO3 - YbH2SO4 - Y H2SO4 - Er H2SO4 - Yb
O:A 1:2T = 50°C
Figure 25: Rare earth stripping from synthetic organic at O:A 1:2 and T = 50°C for different acid concentrations
0
20
40
60
80
100
0 1 2 3 4 5 6
Acid Concentration (M)
%S
tripp
ing
HCl - Y HCl - Er HCl - YbHNO3 - Y HNO3 - Er HNO3 - YbH2SO4 - Y H2SO4 - Er H2SO4 - Yb
O:A 2:1T = 50°C
Figure 26: Rare earth stripping from synthetic organic at O:A 2:1 and T = 50°C for different
acid concentrations
Stellenbosch University http://scholar.sun.ac.za

50
0
20
40
60
80
100
0 1 2 3 4 5 6
Acid Concentration (M)
%S
trip
ping
H2SO4 - Y H2SO4 - Er H2SO4 - YbHCl - Y HCl - Er HCl - YbHNO3 - Y HNO3 - Er HNO3 - Yb
O:A 1:2T = 30°C
Figure 27: Rare earth stripping from synthetic organic at O:A 1:2 and T = 30°C for different acid concentrations
0
20
40
60
80
100
0 1 2 3 4 5 6
Acid Concentration (M)
% S
tripp
ing
HCl - Y HCl - Er HCl - YbHNO3 - Y HNO3 - Er HNO3 - YbH2SO4 - Y H2SO4 - Er H2SO4 - Yb
O:A 2:1T = 30°C
Figure 28: Rare earth stripping from synthetic organic at O:A 2:1 and T = 30°C for different acid concentrations
Stellenbosch University http://scholar.sun.ac.za

51
From the plots it can be seen that the best stripping was achieved with H2SO4, followed by HCl and
then HNO3. This order correlates to the results found by Weiwei et al. (2006) for Cyanex 923 and Lee
et al. (2002). Sulphuric acid achieved stripping percentages of 97% for Y and Er at 5 M and 78% for
Yb. Hydrochloric acid achieved 91% stripping for Y, 89% for Er and 45% for Yb at 5 M while nitric
acid could only strip 79% of the loaded Y, 76% of the Er and 33% of Yb. The percentage stripping of
all three of yttrium, erbium and ytterbium from organic increased with increasing concentration of
stripping agent.
The rare earth stripping reaction was considered again to determine the stoichiometric constraints in
the system:
YR3.3RH + 3H+ ↔ Y3+ + 3R2H2 [Equation 15]
Converting mass to molar concentrations, it was calculated that 0.023 mol/l of YR3.3RH were
available in the system to be converted and this would require 0.07 mol/l of H+. Based on the
stoichiometric requirement, the hydrogen ion concentration was in excess and the acid concentration
should not have limited stripping. However, based on the equilibrium constant for the stripping
reaction (refer back to equation 13), which is inversely proportional to [H+]3, it was expected that an
increase in acid concentration would drive the stripping reaction forward. Better stripping by sulphuric
acid can be explained by the potential of H2SO4 to supply two hydrogen ions, compared to HCl and
HNO3 which can only supply one hydrogen ion each.
Yttrium and erbium were stripped easily at high acid concentrations, while ytterbium showed lower
stripping performance. Based on the distribution ratio trend with atomic number found by Hirashima
et al. (1978) it could be expected that ytterbium would not strip as easy as yttrium and erbium.
Figure 29 plots percentage iron stripping against acid concentration and differs from the plots for Y, Er
and Yb in that hydrochloric acid is the best stripping agent. Similar to the above plots, iron was
increasingly stripped from organic as the acid concentration was increased.
Stellenbosch University http://scholar.sun.ac.za

52
0
20
40
60
80
100
0 1 2 3 4 5 6
%S
trip
ping
- Ir
on
Acid Concentration (M)
HCl HNO3 H2SO4
O:A 1:2 T = 50°C
Figure 29: Iron stripping from synthetic organic vs acid concentration, at O:A ratio of 1:2 and
a temperature of 50 °°°°C
Based on Figure 30 no conclusive statement can be given on the relationship between stripping agent
concentration and scandium stripping from organic. All the tests showed that HCl achieved the lowest
stripping of scandium. However, there is no clear indication of which of the other two acids performed
the best and the highest stripping obtained was 17.5%, which is very low.
A possible contributor to poorer scandium stripping is that it is present on the organic in lower
concentrations than the other elements discussed and that it therefore competes with the Y, Yb and
Er ions. However, even at high acid concentrations where most of the other elements are stripped off,
Sc still only achieved 8 % stripping at best. Scandium therefore did not behave similar to Y, Yb and
Er and further investigation into a process for scandium stripping is required. As it is not present in
very high concentrations, it was decided to only consider the other elements for the rest of the project.
Stellenbosch University http://scholar.sun.ac.za

53
0
4
8
12
16
20
0 1 2 3 4 5 6
%S
trip
ping
- S
cand
ium
Acid Concentration (M)
HCl HNO3 H2SO4
O:A 1:2 T = 50°C
Figure 30: Scandium stripping from synthetic organic vs acid concentration
99% of the zinc present on the organic was stripped off with all three acids at all three concentrations.
This could possibly be attributed to the lower oxidation state of zinc, which forms Zn2+ ions relative to
the other elements such as Y, Er and Fe on the synthetic organic which have oxidation states of
three.
When NaOH was used as the stripping agent, it was noticed that the organic phase turned into a dark
brown-red gel. No solids were observed in solution. It is suspected that an ester is formed according
to the following reaction:
NaOH + RH ↔ RNa + H2O [Equation 16]
To recover the organic phase, the RNa has to be hydrolysed by aqueous sulphuric acid (Gupta and
Krishnamurthy, 2005). On average, 80% rare earth stripping was obtained before hydrolysis and 65%
when the organic had been restored. It is suspected that some of the rare earths remained in the
aqueous phase entrained in the gel-like structure which then recombined with the D2EHPA molecules
once it were hydrolysed. However, although this process is possible, it was decided to reject NaOH
as a candidate stripping agent since the gel-like substance poses practical difficulties for handling in
the plant. Organic health might also be negatively affected.
Stellenbosch University http://scholar.sun.ac.za

54
6.2.2 Experimental results verification
Repeatability of experiments
Three experiments were repeated at the same concentration and conditions for H2SO4 and two for
HNO3 and HCl each. The results below show good repeatability. The three repeated experiments for
H2SO4 had an average standard deviation of 0.5 and a sample variance of 0.4 for yttrium, erbium and
ytterbium stripping. It was therefore assumed that the results obtained for the rest of the experiments
were repeatable within a 5 % accuracy range.
Table 9: Repeatability of experiments
Stripping agent
%Sc
stripping
Std
dev Var
%Y
stripping
Std
dev Var
%Er
stripping
Std
dev Var
%Yb
stripping
Std
dev Var
%Fe
stripping
Std
dev Var
HCL 2.5 73.5 68.7 17.0 74.9
HCL 7.5 74.2 68.7 20.7 74.9
HNO3 8.75 49.8 46.1 10.4 3.6
HNO3 6.25 49.9 44.3 9.6 4.0
H2SO4 3.75 94.3 92.8 52.4 29.4
H2SO4 6.25 94.8 93.4 54.3 31.4
H2SO4 5 94.7 93.4 53.9 29.7
1.6
3.1
1.3
1.8
0.10.3
0.00.1
0.10.4
1.51.2
12.53.5
1.11.1
0.10.2
1.01.0
0.30.5
0.00.00.30.5 0.00.06.92.6
Effect of rare earth concentration on stripping Synthetic organic phases with different concentrations of rare earths were stripped to determine the
effect of the amount of rare earths on the stripping percentage that can be achieved. The high REE,
medium REE and low REE organic phases contained 2000 mg/l, 1250 mg/l and 1000 mg/l yttrium and
175 mg/l, 115 mg/l and 108 mg/l erbium, respectively.
Based on equation 12, the stoichiometric amount of acid required for Y stripping at a concentration of
1000 mg/l Y is 0.034 M, indicating that YR3.3RH was the limiting reagent. However, from Table 10 it
is seen that the same degree of stripping was achieved for the same conditions (O:A ratio,
temperature and acid concentration), irrespective of the concentration of rare earths on the organic.
The standard deviations between the stripping percentages for the three rare earth concentrations
tested at each set of conditions were low for Y and Er and acceptable for Yb if a standard deviation of
5% is taken as acceptable experimental error and not indicating an effect. Although the stoichiometry
acid requirement for the reaction was met, a significantly higher acid concentration is required to drive
the reaction forward since the equilibrium constant is inversely proportional to [H+]3.
Stellenbosch University http://scholar.sun.ac.za

55
Table 10: Stripping % for different rare earth concentrations
Std dev Std dev Std dev
% Y strip % Er strip % Yb strip
High 62.2 58.6 11.2
Medium 66.6 61.7 18.0
Low 62.6 57.4 9.6
High 93.0 92.0 45.8
Medium 94.8 93.4 54.3
Low 93.9 93.9 47.4
High 86.7 84.5 28.1
Medium 88.1 84.9 36.7
Low 86.5 84.7 32.2
High 98.1 100.0 75.3
Medium 96.9 96.7 78.1
Low 98.5 99.8 77.6
1.00.9
4.52.22.5
1.51.90.8
4.30.20.9
4.5
50 50.5H2SO4
H2SO4 0.5 50 3
550
H2SO4 2 50
2H2SO4
3
% Yb
Stripping
% Er
Stripping
% Y
StrippingCTO:AStripping
agentRare earth
concentration
Agitation rate
It was found that the agitation rate from 400 to 600 rpm did not significantly influence the stripping
percentages achieved (see Figure 31) when all other conditions were kept constant. It can therefore
be concluded that, for the equipment used in the experiments under discussion, sufficient agitation
was provided if the agitation speed was above 400 rpm so that mass transfer limitations did not occur.
01020304050
60708090
100
350 400 450 500 550 600 650
Agitation rate (rpm)
% S
tripp
ing
Y Er Yb Fe
Figure 31: Stripping percentages for 5 M H 2SO4 at 45 °°°°C and an O:A ratio of 2:1 at different agitation rates
Stellenbosch University http://scholar.sun.ac.za

56
Equilibrium time
Figure 32 plots the stripping percentages achieved when the stripping reaction was allowed different
amounts of time, at a constant sulphuric acid concentration of 5 M, O:A ratio of 2:1 and a temperature
of 45°C. It can be seen that the curves for yttrium and erbium flatten out from nine minutes onwards,
with only a 0.5% increase in stripping percentage from 9 to 12 minutes. For the purpose of this test
work it can therefore be assumed that the yttrium and erbium stripping reactions had reached
equilibrium at 12 minutes.
The ytterbium curve also flattens off, with a change of 1.6% in the last three minutes. Comparing this
with a change of 6.1% between six and nine minutes, it can be said that equilibrium was not yet
attained, but no more than a 1% change will happen for reaction times greater than 12 minutes. The
iron stripping reaction with H2SO4 was not close to equilibrium after 12 minutes. However, the plant
already has an existing regeneration circuit that uses HCl for iron removal from the organic phase and
therefore the iron results were only necessary for comparison. It can be concluded that the
equilibrium time for H2SO4 stripping of Y, Er and Yb was sufficient for the reactions to reach
equilibrium or be close enough to equilibrium that equilibrium could be assumed for the experimental
work.
0
20
40
60
80
100
2 4 6 8 10 12
Time (minutes)
% S
tripp
ing
Y Er Yb Fe
Figure 32: Stripping rare earths and iron from synthetic organic with H 2SO4 plotted against reaction time
Stellenbosch University http://scholar.sun.ac.za

57
6.2.3 O:A ratio and stripping
Figures 33 and 34 below compare the effect of O:A ratio on the stripping achieved with 5 M H2SO4 at
30 and 50°C. Rare earth stripping increased when the O:A ratio was reduced. This was expected,
since a reduction in O:A ratio increases the amount of aqueous relative to the organic phase, which
increases interfacial contact between the organic molecule containing the rare earth ion and the H+
ion in the aqueous phase. H+ ions drive forward the stripping reaction 12. The results also correlate
to the trend found by Desouky et al. (2009).
Figures 33 and 34 show the effect that the O:A ratio had on stripping rare earths off synthetic organic
with sulphuric acid, at a constant concentration of 5 M.
0
20
40
60
80
100
0 1 2 3 4 5 6O:A ratio
% S
tripp
ing
Y 30°C Er 30°C Yb 30°C Y 50°C Er 50°C Yb 50°C
Figure 33: Stripping Y, Er and Yb from synthetic organic with 5M H 2SO4 at different O:A ratios
Stellenbosch University http://scholar.sun.ac.za

58
0
20
40
60
80
100
0 1 2 3 4 5
O:A ratio
% S
tripp
ing
Fe 30°C Fe 50°C
Figure 34: Stripping Fe from synthetic organic with 5M H 2SO4 at different O:A ratios Figures 33 and 34 indicate that stripping decreased significantly with increasing O:A ratio. For yttrium
and erbium stripping, stripping performance decreased slower at low O:A ratios and decreased more
rapidly at O:A ratios of 4:1 to 6:1. Ytterbium stripping, on the other hand, decreased rapidly with
increasing O:A ratio at low O:A ratios and tend to steady out at O:A ratios of 5:1 and 6:1. Iron
stripping showed the same trend as ytterbium, however, the points were more scattered. For Y and
Er the availability of aqueous at high O:A ratios seem to be a limiting factor, which decreases as the
O:A ratio decreases. Ytterbium and iron stripping seem to be limited by the available aqueous even
at low O:A ratios.
Figures 35 and 36 show the effect of O:A ratio when HCl is used instead of H2SO4.
Stellenbosch University http://scholar.sun.ac.za

59
0
20
40
60
80
100
0 1 2 3 4 5
O:A ratio
% S
tripp
ing
Y 30°C Y 50°C Er 30°C Er 50°C Yb 30°C Yb 50°C
Figure 35: Stripping Y, Er and Yb from synthetic organic with 5M HCl at different O:A ratios
0
20
40
60
80
100
0 1 2 3 4 5
O:A ratio
% S
tripp
ing
Fe 30°C Fe 50°C
Figure 36: Stripping Fe from synthetic organic with 5M HCl at different O:A ratios
Stellenbosch University http://scholar.sun.ac.za
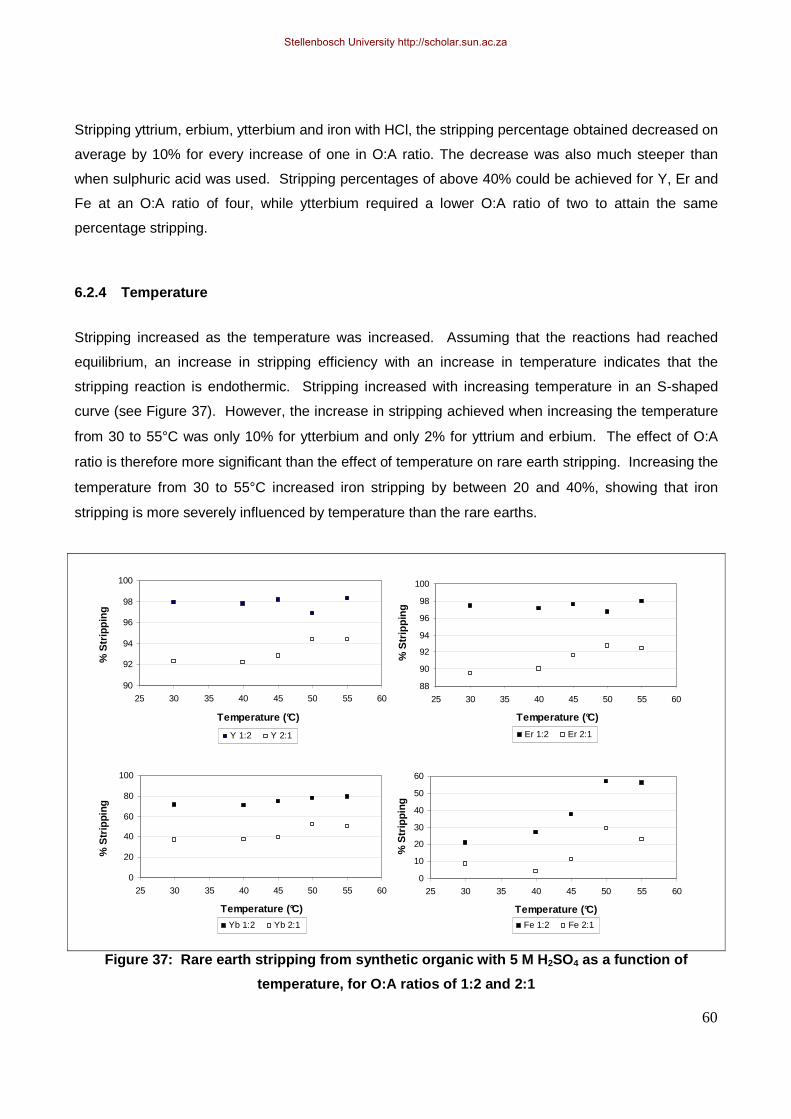
60
Stripping yttrium, erbium, ytterbium and iron with HCl, the stripping percentage obtained decreased on
average by 10% for every increase of one in O:A ratio. The decrease was also much steeper than
when sulphuric acid was used. Stripping percentages of above 40% could be achieved for Y, Er and
Fe at an O:A ratio of four, while ytterbium required a lower O:A ratio of two to attain the same
percentage stripping.
6.2.4 Temperature
Stripping increased as the temperature was increased. Assuming that the reactions had reached
equilibrium, an increase in stripping efficiency with an increase in temperature indicates that the
stripping reaction is endothermic. Stripping increased with increasing temperature in an S-shaped
curve (see Figure 37). However, the increase in stripping achieved when increasing the temperature
from 30 to 55°C was only 10% for ytterbium and only 2% for yttrium and erbium. The effect of O:A
ratio is therefore more significant than the effect of temperature on rare earth stripping. Increasing the
temperature from 30 to 55°C increased iron stripping by between 20 and 40%, showing that iron
stripping is more severely influenced by temperature than the rare earths.
90
92
94
96
98
100
25 30 35 40 45 50 55 60
Temperature (°C)
% S
trip
ping
Y 1:2 Y 2:1
88
90
92
94
96
98
100
25 30 35 40 45 50 55 60
Temperature (°C)
% S
trip
ping
Er 1:2 Er 2:1
0
20
40
60
80
100
25 30 35 40 45 50 55 60
Temperature (°C)
% S
trip
ping
Yb 1:2 Yb 2:1
0
10
20
30
40
50
60
25 30 35 40 45 50 55 60
Temperature (°C)
% S
trip
ping
Fe 1:2 Fe 2:1
Figure 37: Rare earth stripping from synthetic organic with 5 M H 2SO4 as a function of
temperature, for O:A ratios of 1:2 and 2:1
Stellenbosch University http://scholar.sun.ac.za

61
6.2.5 Interaction effects in rare earth stripping
Regression was performed on the results to determine which variables had the greatest influence on
stripping. The ANOVA tables can be found in Appendix C and are discussed in Chapter 6.4. C
indicates acid concentration, OA the O:A ratio and T temperature, with OAC, OAT and TC as the
interaction terms between the different variables.
When sulphuric acid was used as the stripping agent, C and C2 were found to be the most important
variables for yttrium and erbium stripping, while C2, TC and OAC were the most influential in ytterbium
stripping. When hydrochloric acid was used as stripping agent, C and OAC were the most important
for yttrium and erbium stripping and OA, C2, TC and OAC for ytterbium. The significant variables in
iron stripping with H2SO4 were OA, C, C2, OAT, OAC and TC and for iron stripping with HCl, C2 and
OAC.
It was therefore seen that stripping for all the elements tested was greatly influenced by the stripping
agent concentration. The interaction term O:A ratio-concentration (OAC) was also important. Since
the stripping reaction takes place on the interface of the organic and aqueous droplets it was
expected that the interaction between the O:A ratio and acid concentration would play a role. It also
means that during plant operation, it is important to not only control the O:A ratio or the acid
concentration, but to have both at the desired set points so that the interaction effect will also
positively influence the reaction. Iron and ytterbium stripping further also showed the temperature-
concentration (TC) interaction term to be significant.
6.3 Rare earth and iron stripping from plant organic
6.3.1 Stripping agent concentration: sulphuric acid
Figures 38 and 39 show the effect of different concentrations of sulphuric acid on the stripping of the
different elements from Skorpion Zinc plant zinc-stripped organic. At 30 °C, the plots for yttrium an d
erbium are S-curves with initial slow increase in stripping at low acid concentrations, a steeper
increase from 3 to 5 M then stripping percentage flattens off from 5 to 7 M H2SO4. The total YR3.3HR
concentration in the plant organic was calculated to be 0.04 mol/l. Based on the stoichiometry in
equation 12, 0.11 mol/l hydrogen ions would be required to strip off all the rare earth elements.
Similar to what was seen for the synthetic organic, stripping of the plant organic was also not
Stellenbosch University http://scholar.sun.ac.za

62
stoichiometrically limited by the hydrogen ion concentration but the hydrogen ion concentration
affected equilibrium.
At 50 °C, the slow increase in stripping percentage from 1 to 3 M acid seen at a temperature of 30 °C
was not observed, indicating that, for these low acid concentrations, the reaction equilibrium was
limited by both the acid concentration as well as the temperature or energy supplied.
The curves are therefore very similar to that obtained for synthetic organic as was seen in Figures 25
– 28. The synthetic organic phase was only stripped with acid concentrations up to 5 M. The tests
with plant organic have indicated that only 3 – 5 % increase in stripping percentage was obtained for
an increase in acid concentration from 5 to 7 M. Taking the cost of sulphuric acid into account, it is
therefore satisfactory to design the rare earth stripping unit to operate at 5 M.
Ytterbium stripping shows a slow increase in stripping at low acid concentrations and a faster increase
from 3 M to 7 M. The optimum acid concentration for Yb stripping is therefore greater than 7 M.
Therefore any process constructed for Yb stripping will cost significantly more than for Y and Er
stripping, due to the high acid concentrations that will be required.
0
20
40
60
80
100
120
0 1 2 3 4 5 6 7 8
H2SO4 Concentration (M)
% S
tripp
ing
Y - O:A 1:2 30°C Er - O:A 1:2 30°C Yb - O:A 1:2 30°CY - O:A 1:2 50°C Er - O:A 1:2 50°C Yb - O:A 1:2 50°C
Figure 38: Stripping rare earths from plant organic with H 2SO4 at O:A 1:2
Stellenbosch University http://scholar.sun.ac.za

63
0
20
40
60
80
100
120
0 1 2 3 4 5 6 7 8
H2SO4 Concentration (M)
% S
tripp
ing
Y - O:A 2:1 30°C Er - O:A 2:1 30°C Yb - O:A 2:1 30°C
Y - O:A 2:1 50°C Er - O:A 2:1 50°C Yb - O:A 2:1 50°C
Figure 39: Stripping rare earths from plant organic with H 2SO4 at O:A 2:1
Significantly lower stripping percentages was achieved for removing iron (see Figure 40) from the
organic phase with sulphuric acid than for the rare earths. Higher O:A ratios and a lower temperature
reduced iron removal from the organic.
Stellenbosch University http://scholar.sun.ac.za

64
0
10
20
30
40
50
60
0 1 2 3 4 5 6 7 8
H2SO4 Concentration (M)
% S
tripp
ing
Fe - O:A 2:1 50°C Fe - O:A 1:2 50°CFe - O:A 2:1 30°C Fe - O:A 1:2 30°C
Figure 40: Stripping iron from plant organic with H 2SO4
6.3.2 Stripping agent concentration: hydrochloric acid
Figures 41 and 42 show the effect of different concentrations of hydrochloric acid on the stripping of
the different elements from Skorpion Zinc plant zinc-stripped organic. The plots for yttrium and
erbium show a steeper increase in stripping percentage with increase in acid concentration from 3 M
to 5 M HCl, but flattens off towards 7 M for O:A equal to 1:2. Stripping percentages of 80% were
obtained at 7 M acid concentration for an O:A ratio of 2:1 while more than 90% were achieved for an
O:A ratio of 1:2. It can be concluded that equilibrium was reached quicker when the mixture was
more aqueous, possibly as a result of the reaction mainly occurring on the phase boundary.
Ytterbium stripping showed low stripping percentages from 1 – 3 M and thereafter increased as the
acid concentration was increased to 7 M. Yb stripping doubled when the O:A ratio was reduced from
2:1 to 1:2 and it is expected that the stripping percentages will be even higher at a lower O:A ratio.
Stellenbosch University http://scholar.sun.ac.za

65
0
20
40
60
80
100
0 1 2 3 4 5 6 7 8
HCl Concentration (M)
% S
tripp
ing
Y - O:A 2:1 30°C Er - O:A 2:1 30°C Yb - O:A 2:1 30°C
Y - O:A 2:1 50°C Er - O:A 2:1 50°C Yb - O:A 2:1 50°C
Figure 41: Stripping rare earths from plant organic with HCl at O:A 2:1
0
20
40
60
80
100
0 1 2 3 4 5 6 7 8
HCl Concentration (M)
% S
tripp
ing
Y - O:A 1:2 30°C Er - O:A 1:2 30°C Yb - O:A 1:2 30°C
Y - O:A 1:2 50°C Er - O:A 1:2 50°C Yb - O:A 1:2 50°C
Figure 42: Stripping rare earths from plant organic with HCl at O:A 1:2
Stellenbosch University http://scholar.sun.ac.za
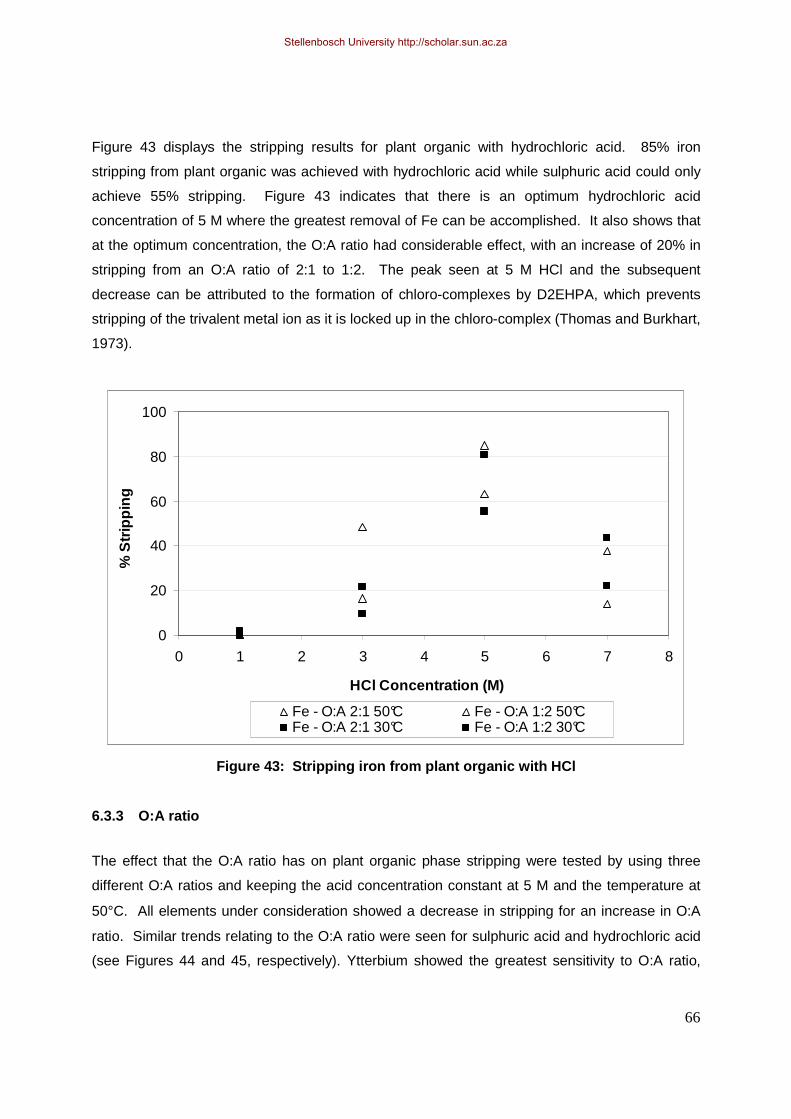
66
Figure 43 displays the stripping results for plant organic with hydrochloric acid. 85% iron
stripping from plant organic was achieved with hydrochloric acid while sulphuric acid could only
achieve 55% stripping. Figure 43 indicates that there is an optimum hydrochloric acid
concentration of 5 M where the greatest removal of Fe can be accomplished. It also shows that
at the optimum concentration, the O:A ratio had considerable effect, with an increase of 20% in
stripping from an O:A ratio of 2:1 to 1:2. The peak seen at 5 M HCl and the subsequent
decrease can be attributed to the formation of chloro-complexes by D2EHPA, which prevents
stripping of the trivalent metal ion as it is locked up in the chloro-complex (Thomas and Burkhart,
1973).
0
20
40
60
80
100
0 1 2 3 4 5 6 7 8
HCl Concentration (M)
% S
tripp
ing
Fe - O:A 2:1 50°C Fe - O:A 1:2 50°CFe - O:A 2:1 30°C Fe - O:A 1:2 30°C
Figure 43: Stripping iron from plant organic with HCl
6.3.3 O:A ratio
The effect that the O:A ratio has on plant organic phase stripping were tested by using three
different O:A ratios and keeping the acid concentration constant at 5 M and the temperature at
50°C. All elements under consideration showed a decrease in stripping for an increase in O:A
ratio. Similar trends relating to the O:A ratio were seen for sulphuric acid and hydrochloric acid
(see Figures 44 and 45, respectively). Ytterbium showed the greatest sensitivity to O:A ratio,
Stellenbosch University http://scholar.sun.ac.za

67
with a reduction in stripping of 30% for an increase in O:A ratio from 1:2 to 2:1. Yttrium and
erbium showed a 20% reduction in stripping with an increase in O:A ratio from 1:2 to 4:1 when
sulphuric acid was used for stripping, but a much higher reduction of 40% when hydrochloric
acid was used. The effect of O:A ratio on iron stripping was similar to Y and Er, only with the
absolute stripping percentages being lower for sulphuric acid. The results showed that a
stripping operation would require an O:A ratio of less than 1:2.
0
20
40
60
80
100
0 1 2 3 4 5
O:A ratio
% S
tripp
ing
Y Er Yb Fe
Figure 44: Stripping plant organic with 5 M H 2SO4 at T = 50°C
Stellenbosch University http://scholar.sun.ac.za
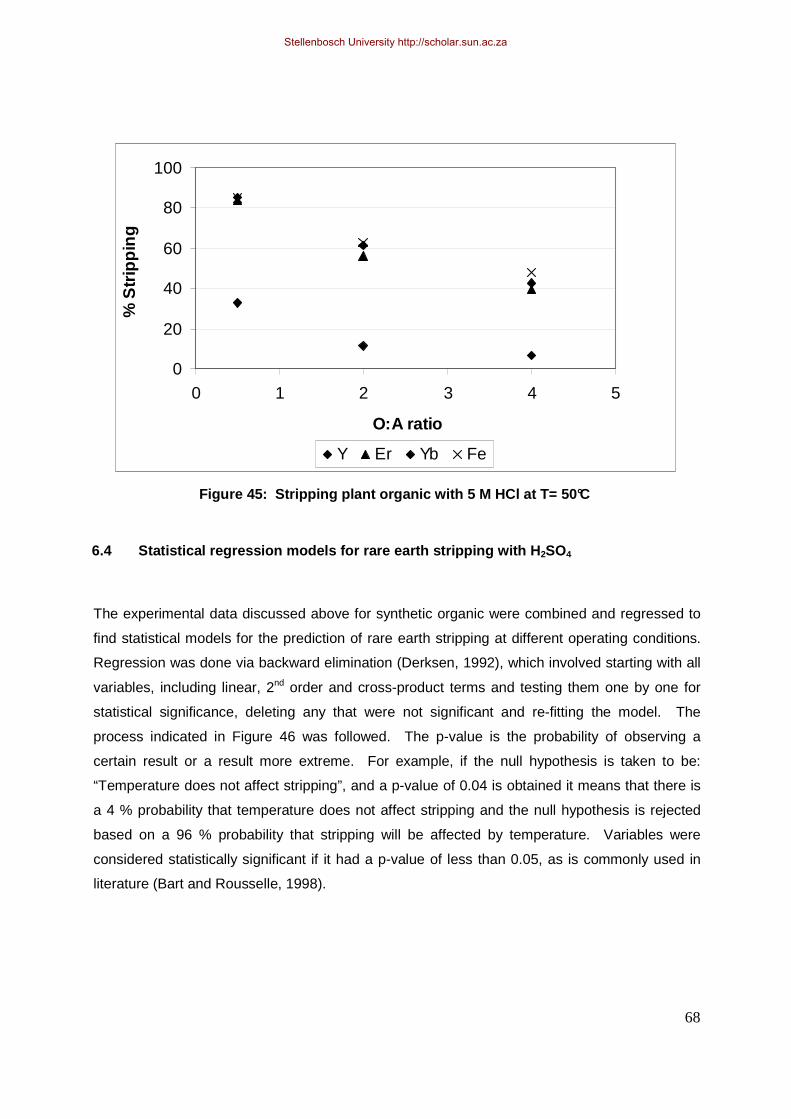
68
0
20
40
60
80
100
0 1 2 3 4 5
O:A ratio
% S
tripp
ing
Y Er Yb Fe
Figure 45: Stripping plant organic with 5 M HCl at T= 50°C
6.4 Statistical regression models for rare earth stripping with H 2SO4
The experimental data discussed above for synthetic organic were combined and regressed to
find statistical models for the prediction of rare earth stripping at different operating conditions.
Regression was done via backward elimination (Derksen, 1992), which involved starting with all
variables, including linear, 2nd order and cross-product terms and testing them one by one for
statistical significance, deleting any that were not significant and re-fitting the model. The
process indicated in Figure 46 was followed. The p-value is the probability of observing a
certain result or a result more extreme. For example, if the null hypothesis is taken to be:
“Temperature does not affect stripping”, and a p-value of 0.04 is obtained it means that there is
a 4 % probability that temperature does not affect stripping and the null hypothesis is rejected
based on a 96 % probability that stripping will be affected by temperature. Variables were
considered statistically significant if it had a p-value of less than 0.05, as is commonly used in
literature (Bart and Rousselle, 1998).
Stellenbosch University http://scholar.sun.ac.za

69
START: Fit model to all variables (incl.
linear, 2nd order and cross-product terms)
STEP 1: Delete all terms with
p < 0.05
STEP 2: Re-fit model to
significant terms
p < 0.05?
no
yes
FINAL MODEL
p < 0.05? no yes
Figure 46: Backward elimination regression process
The ANOVA results for the first fit and for the final model are displayed in Appendix C. After
refining the following models were obtained for stripping yttrium, erbium, ytterbium and iron from
D2EHPA with sulphuric acid:
09.17COA54.2C71.4OA59.0C97.45T11.0OA89.14)SOH(Ystrip% 2242 −×+−−++−= [Equation 17]
31.16COA56.2C03.4OA71.0C13.42T14.0OA71.15)SOH(Erstrip% 2242 −×+−−++−= [Equation 18]
24.7COA24.4CT1.0C35.2OA08.2OA39.5)SOH(Ybstrip% 2242 −×−×+++−= [Equation 19]
78.4COA29.3CT30.0TOA54.0T01.0OA88.2C75.4OA76.15)SOH(Festrip% 2242 −×−×+×−++−=
[Equation 20]
Stellenbosch University http://scholar.sun.ac.za

70
The symbols used are defined as: C for concentration, OA for O:A ratio and T for temperature,
OAT the interaction term of O:A ratio and temperature, OAC the interaction term of O:A ratio and
concentration and TC the interaction between temperature and concentration. Note that the p-
value of the parameter T was greater than 0.05. However, it was included in the model since the
plant data (discussed below) showed a stronger dependence on temperature than when
synthetic organic was used and the models were to be used to model plant data.
The models show that O:A ratio and concentration are more important parameters for stripping
than temperature. Interaction effects between O:A ratio and concentration are also present in all
of the models. Since stripping is an interfacial reaction that is both chemically and diffusion
controlled, the observed importance of O:A ratio and acid concentration is expected as this will
influence the reaction rate on the liquid-liquid interface (Xiong et al., 2004) Table 11 compares
stripping values predicted by the models to experimental results achieved when experiments
similar to those discussed above were performed on Skorpion Zinc plant zinc-stripped organic.
Stellenbosch University http://scholar.sun.ac.za

71
Table 11: Experimental results compared to predicte d percentage stripping with H 2SO4 for 17 tests
Test no.
O:A ratio
Temp-erature
(°°°°C)
H2SO4
Conc. (M)
%Y
strip
exp.
%Y
strip
pred.
Delta
(%)
%Er
strip
exp.
%Er
strip
pred.
Delta
(%)
%Yb
strip
exp.
%Yb
strip
pred.
Delta
(%)
%Fe
strip
exp.
%Fe
strip
pred.
Delta
(%)
1 2 30 1 0 0 0 1 -3 -4 3 2 -1 0.6 9 9
2 2 30 3 22 65 43 16 59 43 2 9 7 1.5 5 4
3 2 30 5 85 92 6 81 89 8 23 36 13 1.2 1 0
4 2 30 7 97 81 -16 97 87 -10 59 82 23 5.5 -4 -9
5 0.5 30 1 6 21 15 5 19 14 4 8 4 5.8 4 -1
6 0.5 30 3 41 78 37 35 74 39 8 29 21 -0.3 10 10
7 0.5 30 5 96 97 1 96 96 0 52 68 16 0.6 16 15
8 0.5 30 7 99 78 -21 100 86 -14 85 126 41 9.8 21 11
9 2 50 1 12 3 -10 12 0 -12 8 4 -5 8.3 5 -4
10 2 50 3 58 67 9 51 62 11 14 15 2 13.5 12 -1
11 2 50 5 92 94 2 90 92 2 40 46 7 22.0 20 -2
12 4 50 5 84 82 -2 80 78 -3 25 18 -7 15.3 -1 -16
13 2 50 7 98 83 -15 98 90 -8 72 96 23 28.1 28 0
14 0.5 50 1 20 23 3 18 22 4 9 10 2 10.4 16 6
15 0.5 50 3 78 80 2 74 77 3 24 35 11 11.0 34 23
16 0.5 50 5 98 99 1 97 99 2 74 78 4 36.4 51 15
17 0.5 50 7 99 81 -19 99 89 -10 91 140 49 55.0 69 14
Stellenbosch University http://scholar.sun.ac.za

72
Statistical models were fitted to data from synthetic organic and then used to predict plant
experimental data. The differences between the experimental results and the stripping
percentages predicted by the models are plotted in Figure 47. For a temperature of 50°C,
concentrations in the range of 1 – 5 M H2SO4 and O:A ratios of 4:1 to 1:2, the plant experimental
data could be most accurately predicted by the model. These are the tests for which differences
of less than 10% are displayed in Figure 47. Predictions at low temperatures (tests 1 to 8) were
not reliable, as can be seen by the large differences displayed on the left-hand side of the graph.
For ytterbium, and to a lesser extent, for yttrium and erbium, predictions at high concentrations
of 7 M (tests 4, 8, 13 and 17) were inaccurate, since the models were based on data obtained in
the range of 1 – 5 M acid only. The model for Fe predicted the results for experiments with plant
organic with a smaller error than the models for Y, Yb and Er.
-30
-20
-10
0
10
20
30
40
50
1 2 3 4 5 6 7 8 9 10 11 12 13 14 15 16 17
Test number
Del
ta (p
red.
% -
exp.
%)
Y Er Yb Fe
Figure 47: Difference between plant experimental results for H 2SO4 and model
predictions for model fitted to synthetic organic data
Although it has been shown that the plant data can be predicted to within 15% accuracy by the
models compiled for synthetic organic, regression was used to fit statistical models to the
experimental data for stripping rare earths from Skorpion Zinc plant organic with sulphuric acid.
These would be more accurate for the specific (aged) organic phase at Skorpion Zinc mine,
while the models given above are valid for 40 % D2EHPA – 60 % kerosene phases in general.
Terms with a p-value less than 0.05 were considered statistically significant for the plant
experimental data. The ANOVA tables after refining the models can be found in Appendix C.
Stellenbosch University http://scholar.sun.ac.za

73
1622131442 1065.1C48.2T1010.1TC23.0C94.44T1079.8OA70.5)SOH(Ystrip% ×−−×−−+×+−=
[Equation 21]
65.69C80.1TC16.0C66.36T34.1OA02.5)SOH(Erstrip% 242 −−−++−= [Equation 22]
46.26OAC56.2C39.1C56.4T64.0OA70.1)SOH(Ybstrip% 2
42 −−+++= [Equation 23]
52.6OAC98.0C56.0TC25.0C15.10)SOH(Festrip% 242 ++++= [Equation 24]
T2 was eliminated from some of the models although it had a low p-value indicating that it is a
significant parameter, because it caused instability in the predicted values by showing positive
bias at high temperatures. Further, the models indicate that C and C2 are important parameters,
occurring in all the models. One or both of the interaction terms OAC and OAT are also present
in the models.
6.5 Statistical regression models for rare earth stripping with HCl
The following statistical models (backward elimination with p-values less than 0.05) were
obtained for rare earth stripping from synthetically manufactured organic with hydrochloric acid:
80.24COA38.2C20.1OA62.1C61.28T29.0OA41.8)HCl(Ystrip% 22 −×−−+++−= [Equation 25]
56.25COA76.2C64.0OA05.2C26.25T35.0OA93.8)HCl(Erstrip% 22 −×−−+++−= [Equation 26]
87.2COA73.4CT15.0TOA17.0C71.1OA01.3C06.4OA82.5)HCl(Ybstrip% 22 −×−×+×−++−=
[Equation 27]
40.22COA81.2C89.2OA53.1C27.5T55.0OA51.4)HCl(Festrip% 22 −×−++++−= [Equation 28]
Similarly to the models for sulphuric acid, the hydrochloric acid models indicate that stripping is
dependent on acid concentration and O:A ratio as well as interaction effects between the two.
The ANOVA tables after refining the models can be found in Appendix C. Table 12 compares
stripping values predicted by the models to experimental results achieved when the experiments
discussed above were performed on Skorpion Zinc plant zinc-stripped organic.
Stellenbosch University http://scholar.sun.ac.za

74
Table 12 : Experimental results compared to predicted percentage stripping with HCl for 17 tests
Test no.
O:A ratio
Temp-erature
(°°°°C)
HCl Conc.
(M)
%Y
strip
exp.
%Y
strip
pred.
Delta
(%)
%Er
strip
exp.
%Er
strip
pred.
Delta
(%)
%Yb
strip
exp.
%Yb
strip
pred.
Delta
(%)
%Fe
strip
exp.
%Fe
strip
pred.
Delta
(%)
1 2 30 1 2.0 -4 -6 -0.9 -6 -5 0.7 3 3 0.0 -6 -62 2 30 3 25.6 34 9 20.9 29 8 0.9 -1 -2 7.9 16 83 2 30 5 63.2 63 0 58.3 58 0 8.5 9 1 62.7 62 -14 2 50 1 2.9 2 -1 1.7 1 -1 0.0 0 0 2.3 5 25 2 50 3 35.7 40 4 32.2 35 3 4.8 2 -3 27.1 27 06 2 50 5 73.5 69 -5 68.7 65 -4 17.0 18 1 74.9 73 -27 0.5 30 1 6.1 6 0 3.5 4 1 0.0 -2 -2 3.0 -1 -48 0.5 30 3 56.1 52 -5 50.4 47 -4 7.0 8 1 23.8 30 69 0.5 30 5 87.3 87 0 84.3 84 0 31.3 32 1 86.1 84 -2
10 0.5 50 1 6.0 12 6 6.1 11 5 0.0 0 0 1.7 10 811 0.5 50 3 66.1 57 -9 60.9 54 -7 12.6 16 3 54.8 41 -1412 0.5 50 5 91.3 93 2 89.3 91 2 44.6 46 1 91.1 95 413 0.25 30 5 91.6 92 0 89.7 89 0 38.0 37 -1 90.4 88 -2
14 4 30 5 40.2 42 1 35.7 37 1 0.0 -1 -1 40.9 43 2
15 0.25 50 5 94.3 98 4 93.0 96 3 55.0 52 -3 94.4 99 5
16 4 50 5 48.9 47 -2 45.2 44 -1 0.0 1 1 56.1 54 -2
Stellenbosch University http://scholar.sun.ac.za

75
The difference between the experimental results for HCl and the stripping percentages predicted
by the models are plotted in Figure 48. The models predicted the experimental results with plant
organic within 5 – 10% accuracy, which is more accurate than the H2SO4 models.
-15
-10
-5
0
5
10
15
1 2 3 4 5 6 7 8 9 10 11 12 13 14 15 16
Test number
Del
ta (
pred
. % -
exp
. %)
Y Er Yb Fe
Figure 48 : Difference between plant experimental results for HCl and model predictions
for model fitted to synthetic organic data
Similar to the processing of the data for sulphuric acid as stripping agent, regression (with p-
values less than 0.05 considered significant) was used to fit statistical models to the
experimental data for stripping rare earths from Skorpion Zinc plant organic with hydrochloric
acid. The models are given below and the ANOVA tables after refining the models can be found
in Appendix C.
39.21C97.0C20.22T30.0OA38.10)HCl(Ystrip% 2 −−++−= [Equation 29]
38.21C77.0C14.20T37.0OA90.10)HCl(Erstrip% 2 −−++−= [Equation 30]
83.1OA05.2OAC06.3TC07.0C73.0)HCl(Ybstrip% 22 −+−+= [Equation 31]
T2 was again eliminated from the models although it had a low p-value indicating that it is a
significant variable, because it caused instability in the predicted values, for instance showing
positive bias at high temperatures. Similarly to the models for sulphuric acid, the models for HCl
also indicate that C and C2 are important variables, occurring in all the models.
Stellenbosch University http://scholar.sun.ac.za

76
In Figure 43 it was seen that iron shows a distinct optimum when stripped with HCl. The data
was therefore modeled in two sections, namely for HCl concentrations of 1 – 5 M and 5 – 7 M.
The following models were obtained, with their corresponding curves:
11.16OAC94.3C77.3OA62.1T39.0)M51:HCl(Festrip% 22 −−++=− [Equation 32]
54.198C87.20OA77.2OA32.22T03.0)M75:HCl(Festrip% 2 +−+−−=− [Equation 33]
6.6 Conclusions
The experimental results showed that rare earths can be removed from a synthetically prepared
organic phase by stripping with hydrochloric-, sulphuric- or nitric acid. For yttrium, erbium and
ytterbium, the best stripping agent was H2SO4, followed by HCl and then HNO3. Sulphuric acid
achieved stripping percentages of 97% for Y and Er at 5 M and 78% for Yb and hydrochloric
acid achieved 91% stripping for Y, 89% for Er and 45% for Yb at 5 M. The experiments were
repeated using zinc-stripped organic from the plant and similar results were obtained, with the
stripping curve flattening off at acid concentrations above 5 M giving 5 M as the optimum
operating strength. The behaviour of iron differed from the behaviour of the rare earths in that
iron was preferentially stripped off by hydrochloric acid and not H2SO4.
The results showed good repeatability, and were not limited by the rare earth concentration,
agitation rate or equilibrium time in the range of set points used in the experiments.
Although the relationship between O:A ratio and rare earth concentration was not the same for
all of Y, Yb, Er and Fe, stripping of all elements increased as the O:A ratio decreased. Stripping
percentages above 90% could be achieved for Y at O:A less than 3 and for Er at O:A less than 2
with sulphuric acid. More than 80% stripping could be attained for Yb with O:A less than 0.5.
The O:A ratio trend was the same for sulphuric acid and hydrochloric acid, only with the stripping
percentages being higher for the rare earths with H2SO4 and for iron with HCl.
Stripping increased with increasing temperature in an S-shaped curve, flattening off at 50°C.
However, the increase in stripping achieved when increasing the temperature from 30 to 55°C
was only 10% for ytterbium and only 2% for yttrium and erbium, indicating that the reaction is
Stellenbosch University http://scholar.sun.ac.za
77
only slightly endothermic. Increasing the temperature will also reduce the viscosity
(Musadaidzwa and Tshiningayamwe, 2009), which would be beneficial for stripping. The effect
of O:A ratio is therefore more significant than the effect of temperature on rare earth stripping.
After stripping, oxalic acid could be used to recover a REE oxalate precipitate from HCl.
Lastly, statistical models were compiled to fit the experimental data obtained for Y, Yb, Er and
Fe when stripped with sulphuric and hydrochloric acid respectively. The models were compiled
by elimination of variables based on p-values after regression. All models showed dependence
on the acid concentration, squared-concentration and the O:A ratio-concentration product
variables. T2 was eliminated from most of the models since it biased the predicted values. The
models were compiled for the experimental data obtained from stripping synthetically prepared
organic and then tested on results obtained when stripping the plant organic phase. The
statistical models have the value that, for the ranges tested, the stripping percentage for each of
the elements can be predicted for different values of O:A ratio, temperature and acid
concentration, also accounting for interaction effects.
Stellenbosch University http://scholar.sun.ac.za

78
Chapter 7: Process solutions
7.1 Process solutions considered
From the experimental work it was firstly determined that high concentrations of Y, Er, Yb and
Sc have a detrimental effect on the organic phase viscosity, phase separation and zinc loading
during solvent extraction and that it influence the current efficiency during zinc electroplating
negatively. The experimental work also showed that it is possible to remove the rare earth
elements from the organic phase used in solvent extraction effectively by means of sulphuric or
hydrochloric acid as stripping agents. Sulphuric acid yielded the best results, but hydrochloric
acid also yielded stripping percentages of above 80% on a laboratory scale. The detrimental
effect of REE on solvent extraction and electroplating of zinc therefore justifies the
implementation of a REE removal process. This chapter discusses a number of removal
process options which can be implemented on a plant scale and selects the best preliminary
practical and financial process.
The following three processes were considered as options to remove rare earths and iron from
the organic phase in the Skorpion Zinc solvent extraction plant:
7.1.1 Sulphuric acid stripping mixer-settler
A sulphuric acid mixer-settler section would use sulphuric acid in the conventional mixer-settler
set-up to strip off rare earths from the organic phase, since the experimental work showed that
the best stripping percentages are achieved with H2SO4. The process (see Figure 49) involves a
mixer box where between 20 and 40 m3/h of organic is mixed with 5 M sulphuric acid in a ratio of
2:1. After mixing the emulsion is agitated to increase residence time for the stripping reaction
where after phases are allowed to separate in a settler. An after-settler would also be required
to ensure that the waste sulphuric acid stream is free of organic and can be pumped to the
leaching section. The ”dirty” sulphuric acid stream can either be bled directly to the leaching
process upstream, or can be treated with oxalic acid to remove the rare earths as a solid oxalate
product.
Stellenbosch University http://scholar.sun.ac.za

79
mixer mixer
settler
mixerppt tank
filter
Organic
storage
tank
organic
aq
Oxalic acid
Oxalate
slurry
RE oxalate
productaq
Aqueous
overflow
aqueous
Bleed
to leach
5M H2SO4
Figure 49: Schematic of sulphuric acid mixer-settler process
Instead of a conventional mixer-settler setup as discussed above, a stripping column (see
Figure 50) can also be used for the rare earth stripping process. The zinc-stripped organic will
be moving counter-currently to the aqueous sulphuric acid phase through the column and each
stage of the column will provide contact between the two phases so that the organic phase will
be stripped of rare earths when exiting the top of the column.
Different column designs are available for the process, of which pulsed columns appear to be
the most popular (Bateman, 2010). However, solvent extraction columns for metals processing
are a relatively new technology and mass transfer characteristics have to be determined for the
specific system on a pilot scale to ensure success of the plant-scale project. After the stripping
column, the downstream process will be the same as for the conventional mixer-settler, either
ending as a bleed stream to the leach plant or going through oxalic acid precipitation.
Stellenbosch University http://scholar.sun.ac.za

80
mixer
Ppt
vessel
filter
5 M H2SO4
organic
aqueous
Oxalic acid
Oxalate
slurry
RE oxalate
productSolid oxalate
aqueous
Bleed
to leachcolumn
Organic storage
tank
Figure 50: Schematic of sulphuric acid stripping column process
Advantages
1. Since Skorpion Zinc mine has a sulphuric acid plant with high capacity as part of its
process, strong sulphuric acid is available.
2. Experimental tests on a bench scale showed sulphuric acid to be the best stripping agent
for removing rare earths from the D2EHPA-kerosene organic phase, giving stripping
percentages of up to 90%.
3. The waste sulphuric acid stream containing the stripped off rare earth elements can be
used in the leaching section for zinc leaching provided that the rare earths will precipitate
out during the neutralisation process. From the plant samples analysed it seems that the
rare earths do precipitate during the neutralisation process with limestone.
4. A less-viscous organic phase with a higher capacity for zinc loading will be produced with a
lower concentration of rare earths and this can be sustained in the long term.
Disadvantages
1. High capital expenditure will be necessary to build a new sulphuric acid stripping section.
Stellenbosch University http://scholar.sun.ac.za

81
2. The mixer-settler process will require a large amount of ground space which is not
available in the current established process.
3. Columns for solvent extraction and stripping are a relatively new technology and have not
been used for processing small streams to strip rare earths off organic, although they have
found application in nickel treatment (Bateman, 2010).
4. Pilot plant tests are required for pulsed columns to establish that the planned design will
provide sufficient mass transfer for a plant-scale process to work. Pilot plant tests involve
extra capital expenditure and time.
From the discussion above a sulphuric acid mixer settler section will remove rare earths and the
associated problems from the organic, although it would be at a significant capital cost.
However, a mixer-settler is practically not feasible due to limited available ground space. A
sulphuric acid stripping column will overcome the practical problem of limited ground space, but
the technology is relatively new for this specific application and pilot plant tests will be necessary
before designing a plant-scale process, which will involve additional capital expenditure. Based
on the time and expenditure necessary to do the pilot plant construction and test work, a
stripping column is also not a feasible option.
7.1.2 Expand/improve available HCl stripping section
Iron is currently removed from the zinc-stripped organic phase at Skorpion Zinc with the use of
HCl in a conventional mixer-settler process (see Figure 51). In this way, 280 m3 per day of the
total organic inventory of 3000 m3 can be treated. An HCl regeneration plant is available to
recover the spent HCl and produce clean HCl of the desired strength. The regeneration process
works as follows: the chlorides in the spent HCl is replenished with the addition of salt (NaCl),
where after the spent HCl is mixed with sulphuric acid at 120°C to produce HCl gas. The Fe in
spent HCl is precipitated as sulphates in the reactor and is sent to the leach plant via a bleed
stream. The gaseous HCl is absorbed in water to give 5 M HCl that can be used to strip iron
and rare earths from the organic phase (in the mixer-settler, MS011). However, the HCl plant
and stripping process is not functioning at optimum, achieving only 20% stripping of iron on
average and approximately 3% stripping of rare earth elements.
The experimental results have shown that HCl of a concentration of 183 g/l (5 M) at a low O:A
ratio is necessary to achieve optimum stripping of iron and rare earths such as yttrium, erbium
Stellenbosch University http://scholar.sun.ac.za

82
and ytterbium. The HCl plant therefore has to produce aqueous HCl of the correct strength, as
well as operate at sufficient capacity to deliver high enough HCl flow rates so that the stripping
section can be operated at a low O:A ratio.
HCl plant performance is very sensitive to plant down-time. Whenever equipment fails, the
volume of organic regenerated per day is reduced and the plant takes upwards of 12 hours to
stabilise after start-up.
Reactor
Circulation tank
Absorption
tower
Cooler
H2SO4
Spent HCl
air
Bleed
to leach
HCl + water vapour
Recirculating
HCl
Recovered
HCl storage
HCl to
Regeneration
Mixer-settler
Figure 51: Simplified schematic of HCl regeneration plant Advantages
1. The HCl plant already exists on site and is running.
2. By focusing on detecting leaks and equipment failures before final failure, the down-time
on the HCl regeneration plant can be reduced, which will ensure that the maximum
possible organic flow is treated in a day.
3. A precipitation section can be added to the HCl plant where rare earths can be precipitated
by oxalic acid and the solids collected for sale.
Stellenbosch University http://scholar.sun.ac.za

83
Disadvantages
1. Due to the high corrosivity of HCl, the plant is no longer able to perform as at
commissioning.
2. Capital expenditure will be required to upgrade the HCl plant to handle higher capacities so
that a larger volume of organic can be treated daily.
3. Although HCl gives very good Fe stripping, sulphuric acid achieves better rare earth
stripping and the regeneration unit with HCl cannot be converted to a sulphuric acid unit
since it would not strip off Fe efficiently.
7.1.3 Replace organic inventory
The high concentration of rare earths has accumulated on the organic over four years. If the
organic inventory could be fully or partially replaced with fresh organic, the solvent extraction
plant will again be able to run for three to four years without rare-earth related problems.
Table 13 gives a cost summary for replacement of the organic inventory.
Table 13: Organic inventory replacement costs
Days required: 5 daysOrganic volume replaced: 1415 m3
Guaranteed solution time 7 months
COST
D2EHPA concentration required 39% 40% 41% 42%Kerosene tankers required: 4.7 4.7 4.6 4.5 per dayIsotainers D2EHPA required: 110 113 116 119 per dayCost of tankers (N$) 1,353,987 1,331,790 1,309,594 1,287,397 per dayCost of D2EHPA (N$) 3,425,223 3,513,049 3,600,875 3,688,701 per dayTotal cost of tankers (N$) 6,769,934 6,658,951 6,547,969 6,436,986Total cost of D2EHPA (N$) 17,126,113 17,565,244 18,004,375 18,443,506TOTAL COST (N$) 23,896,047 24,224,195 24,552,344 24,880,492
Advantages
1. After replacement the problem will immediately be solved.
2. No changes in the process or additional equipment are required.
Stellenbosch University http://scholar.sun.ac.za

84
Disadvantages
1. Very high expenditure required.
2. Only a short term solution which cannot be justified for the high cost since the rare earth
element concentration will be at the current levels again within four years and the improved
performance of the fresh organic phase will not increase zinc production to the effect of
N$24 million over four years.
7.2 Feasible process solutions
7.2.1 Expand/improve available HCl stripping section
As mentioned, the HCl plant is currently not performing as it should, and is only able to operate
at 60% of the design capacity. In order to ensure that the plant capacity can be increased, the
following equipment will be necessary: spare reactor piping and instrumentation, one 14-block
cooling tower, one 7-block heater, one larger bleed to leach pump and the absorption column
packing has to be inspected and replaced if necessary. This additional equipment will ensure
that the plant can run at 100% of its design capacity and treat 960 m3 of organic per day to
remove Fe and REE.
The HCl plant refurbishment project is estimated to cost N$ 2 500 434 (see Table 14). This
includes installation of a second 14-block cooling tower, 7-block heater and instrumentation and
piping costs needed to get the second HCl reactor operational. It also includes replacement of
one of the bleed to leach pumps with a larger pump. Note that prices were obtained from
current suppliers and contractors of Skorpion Zinc.
Stellenbosch University http://scholar.sun.ac.za

85
Table 14: Cost summary
ReactorCooling tower
Heat exchanger
Fe-salts bleed pump
Lead time 3 months 12 months 12 months 1 month
Unit parts - 840 125.00 309 589.00 97 500.00
Piping 187 083.46 136 596.16 53 652.54 -
Instrumentation 333 000.00 99 000.00 99 000.00 -
Sub-total 520 083.46 1 075 721.16 462 241.54 97 500.00
Construction (1%) 5200.83 10757.21 4622.42 975.00
Contingency (15 %) 78012.52 161358.17 69336.23 14625.00
Total per unit 603 296.82 1 247 836.55 536 200.19 113 100.00
TOTAL 2 500 433.55
The benefits of increasing the HCl plant capacity are that rare earth and iron concentrations on
the organic in SX will be decreased, reducing organic phase viscosity, phase disengagement
times and zinc transfer, thereby increasing extraction efficiency and process stability.
7.2.2 Replace organic inventory
Replacing the organic inventory is a practically feasible option but it is not financially feasible at
a cost of more than N$ 24 000 000.
7.3 Proposed process solution
Refurbishment of the HCl plant will provide a long term solution, eliminating the need to replace
the organic inventory to reduce the rare earth concentration, which was estimated to cost
N$ 24 880 000. With increased focus, HCl plant run time can also be improved to sustain
continuous rare earth and iron stripping. It is therefore recommended that the HCl plant is
refurbished and optimized to improve rare earth stripping.
7.4 Conclusions
It can be concluded that the current process that uses HCl to strip off iron and rare earths is the
best practically and financially feasible process at the moment. Value can be gained from the
Stellenbosch University http://scholar.sun.ac.za

86
rare earths if a financially feasible precipitation section can be established. To determine the
feasibility of the precipitation process, the following is therefore recommended:
1. Precipitate rare earths with oxalic acid on a laboratory scale and determine the quality of
product that can be produced.
2. Find a buyer for the product and negotiate the selling price of the product.
3. Do a detailed cost evaluation for construction and commissioning of a precipitation section.
4. Find a supplier for oxalic acid and negotiate the oxalic acid price.
5. Determine whether the process will be financially feasible.
6. Determine what the effect of excess oxalic acid remaining in the bleed to leach stream will
be on the zinc leaching process.
Stellenbosch University http://scholar.sun.ac.za

87
Chapter 8: Conclusions and recommendations
8.1 Conclusions
Firstly, the effect of the rare earths on zinc electrowinning was investigated. An increase of
100 mg/l Y in the electrolyte was found to decrease the current efficiency by 6%. The elemental
order of decreasing current efficiency was found to be: Y > Yb > Er > Sc. However, the
mechanism by which REE reduces current efficiency is not known.
Secondly, the effect of the rare earth concentration on zinc solvent extraction was determined.
The organic viscosity increased from 20 mPa.s to 40 mPa.s for synthetic PLS and from
20 mPa.s to 80 mPa.s for plant PLS for an increase from 3100 to 6250 mg/l in the total organic
rare earth and iron concentration. For the same increase in REE and Fe, the phase
disengagement time increased by 600 seconds and zinc loading decreased by 1 – 3 g/l. Phase
disengagement was affected by the zinc loading at low viscosities and by the REE loading at
high viscosity.
High REE concentrations therefore negatively affect zinc solvent extraction and electrowinning
operations, therefore justifying the need to develop a REE removal process. The stripping of
low concentrations of rare earth elements from 40% D2EHPA diluted in kerosene to produce a
clean organic for zinc extraction was investigated. Bench-scale experiments were used to
determine the optimum stripping agent, stripping agent concentration, organic-aqueous ratio and
temperature.
For the rare earths, the best stripping agent was found to be H2SO4, followed by HCl and then
HNO3, while iron was preferentially stripped by HCl. The stripping curve for Y and Er increased
steeply initially and then flattened out from at acid concentrations from 5 to 7 M, possibly
indicating that the hydrogen ion concentration is the limiting factor below 5 M and that sufficient
hydrogen ions are available at high acid concentrations. More than 80% stripping of yttrium and
erbium could be achieved with an optimum hydrochloric acid concentration of 5 M and more
than 90% REE (specifically Y, Er, Yb) stripping from the organic phase with 5 M sulphuric acid
Stellenbosch University http://scholar.sun.ac.za

88
with one stripping stage. Iron stripping with HCl showed an optimum at 5 M acid, which may be
explained by the formation of organic chloro-complexes at higher chloride concentrations.
Rare earth and iron stripping were improved by reducing the organic-to-aqueous ratio to as low
as 0.5 and increasing the temperature. Stripping increased with increasing temperature in an S-
shaped curve, flattening off at 50°C. The effect of O:A ratio on rare earth stripping is more
significant than the effect of temperature. The interfacial reaction kinetics for stripping supports
the findings that O:A ratio are significant. The results showed good repeatability, and were not
limited by the rare earth concentration, agitation rate (for the equipment used) or equilibrium time
in the range of set points used in the experiments.
Statistical models were compiled to fit the experimental data obtained for Y, Yb, Er and Fe when
stripped with sulphuric and hydrochloric acid, respectively. The models were compiled by
elimination of variables based on p-values after regression. All models showed dependence on
C, C2 and OAC. Interaction effects between the O:A ratio and temperature and stripping agent
concentration were therefore seen to be significant. The models were compiled for the
experimental data obtained from stripping synthetically prepared organic and then tested on
results obtained when stripping the plant organic phase. The statistical models have the value
that, for the ranges tested, the stripping percentage for each of the elements can be predicted
for different values of O:A ratio, temperature and acid concentration, also accounting for
interaction effects.
The test work showed that REE can be stripped from the plant organic and that optimum
conditions would be at 5 M H2SO4 at an O:A ratio of 1:2 and a temeprature of 50°C. The
following three process solutions were discussed for implementation on a plant scale for the
removal of rare earths from the organic phase during zinc solvent extraction: sulphuric acid
stripping mixer settler or stripping column, improvement of available HCl stripping section and
replacement of the organic inventory. A process to possibly obtain value from the rare earths as
by-product was also referred to.
It is concluded that the current process that uses HCl to strip off iron and rare earths is the best
practically and financially feasible process. Value can be gained from the rare earths if a
financially feasible precipitation section can be established. To determine the feasibility of the
process, it is recommended that the quality of precipitate that can be produced is determined
Stellenbosch University http://scholar.sun.ac.za

89
and a buyer found. The capital cost required can then be estimated and an oxalic acid supplier
established. A financial feasibility calculation should then be done. The effect that residual
oxalic acid in the HCl bleed to leach will have on the leach process should also be investigated.
8.2 Recommendations
Considering the accumulating rare earth concentrations at Skorpion Zinc mine, it is
recommended that the available HCl plant is used to strip the rare earths from the organic
phase. Focus should be placed on increasing the HCl plant runtime and improving the plant
equipment to achieve and sustain maximum capacity.
The possibility of implementing a process for the precipitation of the rare earths stripped from the
organic as oxalates or oxides should be further investigated. The following is recommended:
1. Precipitate rare earths with oxalic acid on a lab scale and determine the quality of
product that can be produced.
2. Find a buyer for the product and negotiate the selling price of the product.
3. Do a detailed cost evaluation for construction and commissioning of a precipitation
section.
4. Find a supplier for oxalic acid and negotiate the oxalic acid price.
5. Determine whether the process will be financially feasible.
6. Determine what the effect of excess oxalic acid remaining in the bleed to leach stream
will be on the zinc leaching process, especially focusing on the effect that the organic
molecule of oxalic acid will have on leach efficiencies and total suspended solids in
solution.
From a research perspective it is recommended that the following aspects in zinc plating,
extraction and rare earth stripping are further investigated:
Firstly, it would be useful to know what reaction mechanism causes rare earths to reduce zinc
current efficiency. It is proposed that cathodic zinc is firstly analysed for the lanthanides to
determine whether any co-plating takes place. Then it would also be necessary to study
Pourbaix diagrams for zinc electrolyte including rare earth elements. The mechanism and effect
Stellenbosch University http://scholar.sun.ac.za

90
of rare earth hydride formation might also warrant investigation. Cyclic voltammetry will provide
better insight into the reaction peaks and how the reaction peaks differ when zinc is plated from
pure electrolyte or when it is plated from electrolyte containing rare earth elements.
Secondly, it would be valuable to know exactly where the cut-off concentration is where zinc
loading is considered to be “high loading” and results in complex aggregation. This could be
done by measuring the viscosity of the organic phase with different zinc loadings and plotting a
graph of viscosity against zinc loading. A large range of zinc concentrations as well as a
sufficient number of data points would be necessary to determine the transition point. The
contribution of rare earths to complex aggregation should also be investigated. Once the
transition point has been determined with zinc loading from rare earth-free leach liquor, different
rare earth concentrations can be added to zinc concentrations below the transition point and the
viscosity measured to determine whether the rare earth elements shift the transition point.
Thirdly, further research is required to determine exactly why a difference in stripping is seen
between different acids, apart from the difference in hydrogen ion contribution. Specifically of
interest here is the difference between HCl and HNO3 and also why HCl produces the best
results for iron but not for the rare earths. This will require analysis of the kinetics by
establishing the mechanisms and rate equation for each system. The mechanisms might
explain the differences between the chloride, nitrate and sulphate systems better. If no
conclusions can be derived from the mechanisms, analysis of the ionic bonding on a molecular
level will be required.
Stellenbosch University http://scholar.sun.ac.za

91
References
Anticó, E., Masana, A., Hidalgo, M., Salvadó, V., Iglesias, M. and Valiente, M., 1996. Solvent
extraction of yttrium from chloride media by di(2-ethylhexyl)phosphoric acid in kerosene.
Speciation studies and gel formation. Analytica Chimica Acta 327 pp 267 – 276.
Bart, H.J., Marr, R., Scheks, J. and Koncar, M., 1992. Modelling of solvent extraction equilibria
of Zn(II) from sulfate solutions with bis-(2-ethylhexyl)-phosphoric acid. Hydrometallurgy 31
pp 13 – 28.
Bart, H.J. and Rousselle, H.P., 1998. Microkinetics and reaction equilibria in the system
ZnSO4/D2EHPA/isododecane, Hydrometallurgy 51 pp 285 – 298.
Bateman, 2010, Bateman pulsed columns, www.bateman-litwin.com [1 August 2010]
Chi, R. and Xu, Z., 1999. A solution chemistry approach to the study of rare earth elements
precipitation by oxalic acid. Metallurgy Material Transaction B 30, pp 189.
Cole, P.M., Sole, K.C. and Feather, A.M., 2006. Solvent Extraction Developments in Southern
Africa. Tsinghua Science and Technology 11 pp 153 – 159.
Derksen, S., 1992. Backward, forward and stepwise automated subset selection algorithms:
frequency of obtaining authentic and noise variables. British Journal of Mathematical and
Statistical Psychology 45 pp 265 – 282.
Desouky, O.A., Daher, A.M., Abdel-Monem, Y.K. and Galhoum, A.A., 2009. Liquid-liquid
extraction of yttrium using primene-JMT from acidic sulfate solutions. Hydrometallurgy 96 pp
313 – 317.
Dewalens, J., Head of Technical Services and Production Manager at ZincOx, Personal
Communication, February 2011 [confidential].
Stellenbosch University http://scholar.sun.ac.za

92
Diaz, G., Director of Proprietary Technology Development at Tecnicas Reunidas, Personal
Communication, August 2011 [confidential].
Doyle, F.M., Choi, H., Anticó, E., Valiente, M. and Lee, J, 1993. Influence of organic phase
speciation on the characteristics of yttria precursor powders precipitated from yttrium-loaded
D2EHPA solutions. The Minerals, Metals & Materials Society pp 545 – 548.
Flett, D.S., 2005. Solvent extraction in hydrometallurgy: the role of organophosphorus
extractants. Journal of Organometallic Chemistry 620 pp 2426 – 2438.
Geist, A., Nitsch, W. and Kim, J., 1999. On the kinetics of rare-earth extraction into D2EHPA.
Chemical Engineering Science 54 pp 1903 – 1907.
Gnoinski, J., 2007. Skorpion Zinc: Optimisation and Innovation, Southern African Institute of
Mining and Metallurgy, Fourth South African Conference on Base Metals, pp 329 – 342.
Gupta, C.K. and Krishnamurthy, N., 2005. Extractive metallurgy of rare earths, pp 171. CRC
Press, USA.
Hirashima, Y., Yamamoto, Y., Takagi, S., Amano, T. and Shiokawa, J., 1978. Extraction of
lanthanoids for hydrochloric and nitric acid solutions by di(2-ethylhexyl)phosphoric acid. Bulletin
of the Chemical Society of Japan 51(10) pp 2890 – 2893.
Hoh, Y., Chuang, W. and Wang, W., 1986. Interfacial tension studies on the extraction of
Lanthanum by D2EHPA. Hydrometallurgy 15 pp 381 – 390.
Hurst, C., 2010. China’s rare earth elements industry: What can the West learn? Institute for
the Analysis of Global Security. Available at www.iags.org [1 May 2010].
Kolarik, Z. and Grimm, R., 1976. Acidic organophosphorus extractants – XXIV: The
polymerization behaviour of Cu(II), Cd(II), Zn(II) and Co(II) complexes of di(2-ethylhexyl)
phosphoric acid in fully loaded organic phases. Journal of Inorganic Nuclear Chemistry 38 pp
1721 – 1727.
Stellenbosch University http://scholar.sun.ac.za

93
Konishi, Y., Noda, Y. and Asai, S., 1998. Precipitation stripping of yttrium oxalate powders from
yttrium-loaded carboxylate solutions with aqueous oxalic acid solutions. Ind. Eng. Chem. Res.
37 pp 2093 – 2098.
Kumar, S., Tulasi, W.L., 2005. Aggregation vs breakup of the organic phase complex.
Hydrometallurgy 78 pp 79 – 91.
Lee, M.S., Ahn, J.G. and Lee, E.C., 2002. Solvent extraction separation of indium and gallium
from sulphate solutions using D2EHPA. Hydrometallurgy 63 pp 269– 276.
Mahmoud, G.M., El Hazek, N.T., Farag, A.M. and El Hussaini, O.M., 2008. Separation of rare
earth elements from sulfate leach liquor by heterocyclic nitrogen compound. Journal of Rare
Earths 26-4, pp 544 – 551.
Mansur, M.B., Slater, M.J. and Biscaia, E.C., 2001. Kinetic analysis of the reactive liquid-liquid
test system ZnSO4/D2EHPA/n-heptane, Hydrometallurgy 63 pp 107 – 116.
Martín, D., Díaz, G., García, M. A. and Sánchez, F., 2002. “Extending zinc production
possibilities through solvent extraction,” Proceedings of the International Solvent Extraction
Conference, ISEC 2002, 2, pp 1045 – 1051. Sole, K. C., Cole, P. M., Preston, J. S. and
Robinson, D. J., Eds., Johannesburg: South African Institute of Mining and Metallurgy.
Musadaidzwa, J.M. and Tshiningayamwe, E.I., 2009. Skorpion Zinc solvent extraction: the
upset conditions, The Journal of the Southern African Institute of Mining and Metallurgy, 109 pp
691 – 695.
Nicol, M., Professor in Extractive Metallurgy at Murdoch University, Personal Communication, 4
August 2011.
Ohto, K., Inoue, K. Goto, M., Nakashio, F. and Kago, T., 2005. Extraction equilibrium of trivalent
erbium, yttrium and holmium with dioleyl- and dioctylphosphoric acids. Reports of the Faculty of
Science and Engineering 34(1).
Stellenbosch University http://scholar.sun.ac.za

94
O’Keefe, T.J., Srinivasan, V. and Cuzmar, J.S., 1990. The effects of lead on the electrochemical
and adhesion behaviour of zinc elecetrodeposits. Metallurgical Transactions B 21 pp 81 – 86.
Radhika, S., Nagaphani Kumara, B.N., Lakshmi Kantama, M. and Ramachandra Reddya, B.,
2010. Liquid–liquid extraction and separation possibilities of heavy and light rare-earths from
phosphoric acid solutions with acidic organophosphorus reagents. Purification and Separation
Technology 75, pp 295 - 302
Ramachandra Rao, S., 2006. Resource recovery and recycling from metallurgical wastes, pp
255 – 256. Elsevier, The Netherlands.
Rhodia technical data sheet, 2010. Skorpion Zinc reagent library [internal communication].
Skorpion Zinc Solvent Extraction Operational Manual, 2003. Skorpion Zinc Project Joint Venture
documentation [confidential internal communication].
Sole, K.C., 2010. Analyses of Skorpion Zinc solvent-extraction crud and gel phases: December
2010, Anglo Research Report D201004494 [confidential].
Sole, K.C., 2011. Analyses of Skorpion Zinc solvent-extraction organic and gel samples: January
2011, Anglo Research Report D201104577 [confidential].
Thomas, N.E. and Burkhart, L.E., 1973. The extraction equilibria of lutetium, ytterbium and
thulium between di-(-2-ethylhexyl) phosphoric acid in Amsco and aqueous hydrochloric acid
solutions, Journal of Inorganic Nuclear Chemistry, 36, pp 1369 – 1376.
Tse, P., 2011. China’s rare-earth industry: U.S. Geological Survey Open-File Report 2011–1042
Umicore Engineering Process and Operation manual, 2001. Skorpion Project Joint Venture
documentation [confidential internal communication].
Wall, F., Head of CSM and Associate Professor in Applied Mineralogy Camborne School of
Mines, Personal Communication, 7 April 2011.
Stellenbosch University http://scholar.sun.ac.za

95
Wang, X., Meng, S. and Li, D., 2010. Extraction kinetics of ytterbium(III) by 2-
ethylhexylphosphonic acid mono-(2-ethylhexyl) ester in the presence of isooctanol using a
constant interfacial cell with laminar flow. Separation and Purification Technology 71, pp 50 –
55.
Weiwei, W., Xianglan, W., Shulan, M., Hongfei, L. and Dequian, L., 2006. Extraction and
stripping of ytterbium (III) from H2SO4 medium by Cyanex 923. Journal of Rare Earths 24, pp
685 – 689.
Wu, D., Wang, X. and Li, D., 2007. Extraction kinetics of Sc(III), Y(III), La(III) and Gd(III) from
chloride medium by Cyanex 302 in heptane using the constant interfacial cell with laminar flow.
Chemical Engineering and Processing 46, pp 17 – 24.
Xiong, Y., Wang, Y.g. and Li, D.Q., 2004. Kinetics of Extraction and Stripping of Y(III) by
Cyanaex 272 as an Acidic Extractant using a Constant Interfacial cell with laminar flow, Solvent
Extraction and Ion Exchange, 22, pp 833 – 851.
Stellenbosch University http://scholar.sun.ac.za

96
Appendix A: Experimental design
Test REE concentration Temperature1 -1 -12 -1 +13 0 -14 0 +15 +1 -16 +1 +1
Synthetic organic preparation factorial design
Stellenbosch University http://scholar.sun.ac.za

97
A: Optimum stripping agent type and concentration with O:A and temperature interactions
TestStripping
agent O:A T (°°°°C) C (mol/l) TestStripping
agent O:A T (°°°°C) C (mol/l)1 HCl 2:1 30 1 25 H2SO4 2:1 30 1 Constants:
2 HCl 2:1 30 3 26 H2SO4 2:1 30 3 Equilibrium time = 12 min
3 HCl 2:1 30 5 27 H2SO4 2:1 30 5 No stripping steps = 1
4 HCl 2:1 50 1 28 H2SO4 2:1 50 1
5 HCl 2:1 50 3 29 H2SO4 2:1 50 3
6 HCl 2:1 50 5 30 H2SO4 2:1 50 5
7 HCl 1:2 30 1 31 H2SO4 1:2 30 1
8 HCl 1:2 30 3 32 H2SO4 1:2 30 3
9 HCl 1:2 30 5 33 H2SO4 1:2 30 5
10 HCl 1:2 50 1 34 H2SO4 1:2 50 1
11 HCl 1:2 50 3 35 H2SO4 1:2 50 3
12 HCl 1:2 50 5 36 H2SO4 1:2 50 5
13 HNO3 2:1 30 1 37 NaOH 2:1 30 20%
14 HNO3 2:1 30 3 38 NaOH 2:1 30 25%
15 HNO3 2:1 30 5 39 NaOH 2:1 30 30%
16 HNO3 2:1 50 1 40 NaOH 2:1 50 20%
17 HNO3 2:1 50 3 41 NaOH 2:1 50 25%
18 HNO3 2:1 50 5 42 NaOH 2:1 50 30%
19 HNO3 1:2 30 1 43 NaOH 1:2 30 20%
20 HNO3 1:2 30 3 44 NaOH 1:2 30 25%
21 HNO3 1:2 30 5 45 NaOH 1:2 30 30%
22 HNO3 1:2 50 1 46 NaOH 1:2 50 20%
23 HNO3 1:2 50 3 47 NaOH 1:2 50 25%
24 HNO3 1:2 50 5 48 NaOH 1:2 50 30%
Organic: synthetic solution of 60% kerosene, 40% D2EPHA and spiked with 1100 mg/l Y, 450 mg/l Yb, 110 mg/l Er, 300 mg/l Fe (avg) 1000 mg/l Zn, 65 mg/l Sc
Stellenbosch University http://scholar.sun.ac.za

98
B: Optimum stripping agent concentration
Test
Synthetic organic
compositionStripping
agent Stripping agent concentration O:A T (°°°°C)
1 1 M 2:1 30 Constants:2 3 M 2:1 30 Equilibrium time = 12 min3 5 M 2:1 30 Agitation rate = 500 rpm4 7 M 2:1 305 1 M 1:2 306 3 M 1:2 307 5 M 1:2 308 7 M 1:2 309 1 M 2:1 50
10 3 M 2:1 5011 5 M 2:1 5012 5 M 4:1 5013 7 M 2:1 5014 1 M 1:2 5015 3 M 1:2 5016 5 M 1:2 5017 7 M 1:2 5017 1 M 2:1 3018 3 M 2:1 3019 5 M 2:1 3020 7 M 2:1 3021 1 M 1:2 3022 3 M 1:2 3023 5 M 1:2 3024 7 M 1:2 3025 1 M 2:1 5026 3 M 2:1 5027 5 M 2:1 5028 5 M 4:1 5029 7 M 2:1 5030 1 M 1:2 5031 3 M 1:2 5032 5 M 1:2 5033 7 M 1:2 50
Plant zinc-stripped organic
HCl
Plant zinc-stripped organic
H2SO4
Stellenbosch University http://scholar.sun.ac.za

99
C: Results validation: Agitation rate and equilibrium time
TestAgitation rate (rpm)
Equilibrium time (min)
1 400 12 Constants:2 500 12 Stripping agent = H2SO4
3 600 12 Acid concentration = 5M4 500 3 Organic composition = avg REE5 500 6 O:A ratio = 2:16 500 9 Temperature = 45 °C
Results validation: Effect of rare earth concentration
Test
H2SO4
concentration O:A
1 2 M 2:1 Constants:
2 4 M 2:1 Equilibrium time = 12 min
3 6 M 2:1 Agitation rate = 500 rpm
4 7 M 2:1 Temperature = 50 °C
5 3 M 2:1
6 5 M 2:1
7 3 M 1:2
8 5 M 1:2
9 3 M 2:1
10 5 M 2:1
11 3 M 1:2
12 5 M 1:2
REE low:
700 mg/l Y, 300 mg/l Yb, 80 mg/l Er, 200
mg/l Fe, 1000 mg/l Zn, 65
mg/l Sc
Synthetic organic composition
REE avg:
1100 mg/l Y, 450 mg/l Yb, 110 mg/l Er, 300 mg/l Fe,
1000 mg/l Zn, 65 mg/l Sc
REE high:
1500 mg/l Y, 600 mg/l Yb, 140 mg/l Er, 400 mg/l Fe,
1000 mg/l Zn, 65 mg/l Sc
Stellenbosch University http://scholar.sun.ac.za

100
D: Optimum O:A and temperature
TestStripping
agent
Synthetic organic
composition O:A T (°°°°C)
1 1:4 30 Constants:2 1:3 30 Equilibrium time = 12 min3 1:2 30 Acid concentration = 5 M4 1:1 305 2:1 306 3:1 307 4:1 308 6:1 309 1:4 50
10 1:3 5011 1:2 5012 1:1 5013 2:1 5014 3:1 5015 4:1 5016 6:1 5017 1:4 3018 1:2 3019 2:1 3020 4:1 3021 1:4 5022 1:2 5023 2:1 5024 4:1 5025 1:2 3026 1:2 4027 1:2 4528 1:2 5029 1:2 5530 2:1 3031 2:1 4032 2:1 4533 2:1 5034 2:1 55
5M H2SO4
5M HCl
5M H2SO4
REE avg: 1100 mg/l Y, 450 mg/l Yb, 110 mg/l Er, 300 mg/l Fe
(avg) 1000 mg/l Zn,
65 mg/l Sc
REE avg: 1100 mg/l Y, 450 mg/l Yb, 110 mg/l Er, 300 mg/l Fe
(avg) 1000 mg/l Zn,
65 mg/l Sc
REE avg: 1100 mg/l Y, 450 mg/l Yb, 110 mg/l Er, 300 mg/l Fe
(avg) 1000 mg/l Zn, 65 mg/l Sc
Stellenbosch University http://scholar.sun.ac.za

101
Appendix B: Experimental results
Mini-cell tests
Cell Y conc V (start) V(end) Current Time Mass CEA h g %
1 0 3.01 2.95 0.05 28.8 1.69 96.12 400 2.97 2.94 0.05 28.8 1.27 72.2
3 0 2.96 2.95 0.05 28.8 1.69 96.14 800 3.03 2.92 0.05 28.8 0.92 52.3
Cell Y conc V (start) V(end) Current Time Mass CEA h g %
1 0 2.91 2.89 0.05 26.1 1.53 96.2
2 100 2.91 2.92 0.05 26.1 1.44 90.5
3 0 2.96 3.05 0.05 26.1 1.55 97.4
4 200 2.94 2.94 0.05 26.1 1.28 80.55 300 2.94 2.98 0.05 26.1 1.25 78.6
CellElement spiked V (start) V(end) Current Time Mass CE
A h g %
1 Blank 3.05 2.95 0.05 25.6 1.52 97.3
2 Y 3.01 2.92 0.05 25.6 1.33 85.2
3 Sc 3.03 2.97 0.05 25.6 0.93 59.6
4 Er 2.98 2.96 0.05 25.6 1.15 73.65 Yb 3.01 2.94 0.05 25.6 1.27 81.3
Stellenbosch University http://scholar.sun.ac.za

102
O:A ratio and temperature – synthetic organic
Sample Sc Stripping Fe Stripping Y Stripping Er Stripping Yb Stripping
id O:A T mg/l % mg/l % mg/l % mg/l % mg/l %
A0 80 303 1256 115 540
C1 H2SO4 0.25 30 84 -5 237 22 13.7 98.9 1.72 98.5 109 79.8
C2 H2SO4 0.33 30 83 -3.75 256 16 19 98.5 2.38 97.9 133 75.4
A33 H2SO4 0.50 30 76 5 239 21 26 97.9 2.97 97.4 156 71.1
C3 H2SO4 1 30 89 -11.25 294 3 61 95.1 7.21 93.7 289 46.5
A27 H2SO4 2 30 66 17.5 277 9 97 92.3 12 89.6 339 37.2
C4 H2SO4 3 30 88 -10 319 -5 167 86.7 20 82.6 434 19.6
C5 H2SO4 4 30 87 -8.75 318 -5 222 82.3 25.5 77.8 471 12.8
C6 H2SO4 0.25 50 89 -11.25 105 65 10 99.2 1.14 99.0 68 87.4
C7 H2SO4 0.33 50 88 -10 113 63 14 98.9 1.52 98.7 87 83.9
A36 H2SO4 0.5 50 80 0 131 57 39 96.9 3.84 96.7 118 78.1
C8 H2SO4 1 50 89 -11.25 204 33 42 96.7 4.9 95.7 208 61.5
A30 H2SO4 2 50 77 3.75 214 29 71 94.3 8.3 92.8 257 52.4
C9 H2SO4 3 50 89 -11.25 289 5 134 89.3 15.5 86.5 390 27.8
C10 H2SO4 4 50 85 -6.25 299 1 208 83.4 24.5 78.7 433 19.8
C11 H2SO4 6 50 84 -5 317 -5 443 64.7 50 56.5 520 3.7
C12 HCl 0.25 30 89 -11.25 29 90 106 91.6 11.8 89.7 335 38.0
A9 HCl 0.5 30 76 5 42 86 160 87.3 18 84.3 371 31.3
A3 HCl 2 30 77 3.75 113 63 462 63.2 48 58.3 494 8.5
C13 HCl 4 30 89 -11.25 179 41 751 40.2 74 35.7 571 -5.7
C14 HCl 0.25 50 90 -12.5 17 94 72 94.3 8 93.0 243 55.0
A12 HCl 0.5 50 78 2.5 27 91 109 91.3 12.3 89.3 299 44.6
A6 HCl 2 50 78 2.5 76 75 333 73.5 36 68.7 448 17.0
C15 HCl 4 50 85 -6.25 133 56 642 48.9 63 45.2 548 -1.5
A33 H2SO4 0.5 30 76 5 239 21 26 97.9 2.97 97.4 156 71.1
C16 H2SO4 0.5 40 88 -10 221 27 28 97.8 3.3 97.1 159 70.6
C17 H2SO4 0.5 45 85 -6.25 189 38 23 98.2 2.78 97.6 137 74.6
A36 H2SO4 0.5 50 80 0 131 57 39 96.9 3.84 96.7 118 78.1
C18 H2SO4 0.5 55 87 -8.75 133 56 21 98.3 2.34 98.0 113 79.1
A27 H2SO4 2 30 66 17.5 277 9 97 92.3 12 89.6 339 37.2
C19 H2SO4 2 40 88 -10 291 4 98 92.2 11.5 90.0 338 37.4
C20 H2SO4 2 45 87 -8.75 269 11 90 92.8 9.6 91.7 325 39.8
A30 H2SO4 2 50 77 3.75 214 29 71 94.3 8.3 92.8 257 52.4
C21 H2SO4 2 55 87 -8.75 234 23 71 94.3 8.7 92.4 269 50.2
Sc Fe Y Er Yb
Stripping agent
Stellenbosch University http://scholar.sun.ac.za

103
Agitation rate and equilibrium time
Fe Y Er Yb
mg/l mg/l mg/l mg/l
B0 blank 327 2075 220 854
D1 2:1 45 400 12 312 4.6 245 88.2 29.6 86.5 606 29.0
D2 2:1 45 500 12 307 6.1 229 89.0 28.6 87.0 604 29.3
D3 2:1 45 600 12 301 8.0 233 88.8 28 87.3 609 28.7
D4 2:1 45 500 3 330 -0.9 674 67.5 84 61.8 733 14.2
D5 2:1 45 500 6 331 -1.2 288 86.1 38 82.7 670 21.5
D6 2:1 45 500 9 316 3.4 239 88.5 30 86.4 618 27.6
Sample ID TempAgitation rate (rpm)O:A
%
Stripping
%
Stripping
Eq time (min)
%
Stripping
%
Stripping
Plant organic stripped with H 2SO4
Sample ID
Stripping agent O:A T C Fe %Fe strip Y %Y strip Er %Er strip Yb %Yb strip
mg/l mg/l mg/l mg/l
BO1 blank 327 2075 220 854
B1 H2SO4 2 30 1 325 0.6 2075 0.0 217 1.4 831 2.7
B2 H2SO4 2 30 3 322 1.5 1619 22.0 184 16.4 835 2.2
B3 H2SO4 2 30 5 323 1.2 301 85.5 41 81.4 660 22.7
B4 H2SO4 2 30 7 309 5.5 65 96.9 7.16 96.7 350 59.0
B5 H2SO4 0.5 30 1 308 5.8 1945 6.3 209 5.0 818 4.2
B6 H2SO4 0.5 30 3 328 -0.3 1224 41.0 144 34.5 786 8.0
B7 H2SO4 0.5 30 5 325 0.6 80 96.1 9.16 95.8 411 51.9
B8 H2SO4 0.5 30 7 295 9.8 15.9 99.2 0.05 100.0 128 85.0
B9 H2SO4 2 50 1 300 8.3 1816 12.5 194 11.8 782 8.4
B10 H2SO4 2 50 3 283 13.5 879 57.6 108 50.9 737 13.7
B11 H2SO4 2 50 5 255 22.0 175 91.6 22.8 89.6 516 39.6
B12 H2SO4 4 50 5 277 15.3 329 84.1 43 80.5 640 25.1
B13 H2SO4 2 50 7 235 28.1 42 98.0 5.4 97.5 236 72.4
B14 H2SO4 0.5 50 1 293 10.4 1654 20.3 181 17.7 781 8.5
B15 H2SO4 0.5 50 3 291 11.0 450 78.3 57 74.1 650 23.9
B16 H2SO4 0.5 50 5 208 36.4 44 97.9 5.81 97.4 221 74.1
B17 H2SO4 0.5 50 7 147 55.0 10.5 99.5 1.22 99.4 76 91.1
Fe Y Er Yb
Stellenbosch University http://scholar.sun.ac.za

104
Plant organic stripped with HCl
Sample ID
Stripping agent O:A T C Fe Y Er Yb
mg/l mg/l mg/l mg/l
BO1 327 2075 1750 220 183 854 750
B17 HCl 2 30 1 327 0.0 2049 1.3 220 0.0 854 0.0
B18 HCl 2 30 3 296 9.5 1761 15.1 191 13.2 793 7.1
B19 HCl 2 30 5 146 55.4 1046 49.6 121 45.0 810 5.2
B20 HCl 2 30 7 255 22.0 551 73.4 71 67.7 718 15.9
B21 HCl 0.5 30 1 322 1.5 2071 0.2 219 0.5 863 -1.1
B22 HCl 0.5 30 3 256 21.7 1322 36.3 150 31.8 803 6.0
B23 HCl 0.5 30 5 63 80.7 446 78.5 54 75.5 686 19.7
B24 HCl 0.5 30 7 185 43.4 182 91.2 22.4 89.8 524 38.6
B25 HCl 2 50 1 327 0.0 2077 -0.1 219 0.5 814 4.7
B26 HCl 2 50 3 274 16.2 1657 20.1 178 19.1 820 4.0
B27 HCl 2 50 5 121 63.0 801 61.4 96 56.4 757 11.4
B28 HCl 4 50 5 171 47.7 1190 42.7 133 39.5 798 6.6
B29 HCl 2 50 7 282 13.8 449 78.4 55 75.0 664 22.2
B30 HCl 0.5 50 1 329 -0.6 2044 1.5 214 2.7 840 1.6
B31 HCl 0.5 50 3 169 48.3 1019 50.9 114 48.2 767 10.2
B32 HCl 0.5 50 5 50 84.7 301 85.5 35 84.1 575 32.7
B33 HCl 0.5 50 7 204 37.6 145 93.0 17.3 92.1 432 49.4
Fe Y Er Yb
% Yb
Stripping
% Er
Stripping
% Fe
Stripping
% Y
Stripping
Stellenbosch University http://scholar.sun.ac.za
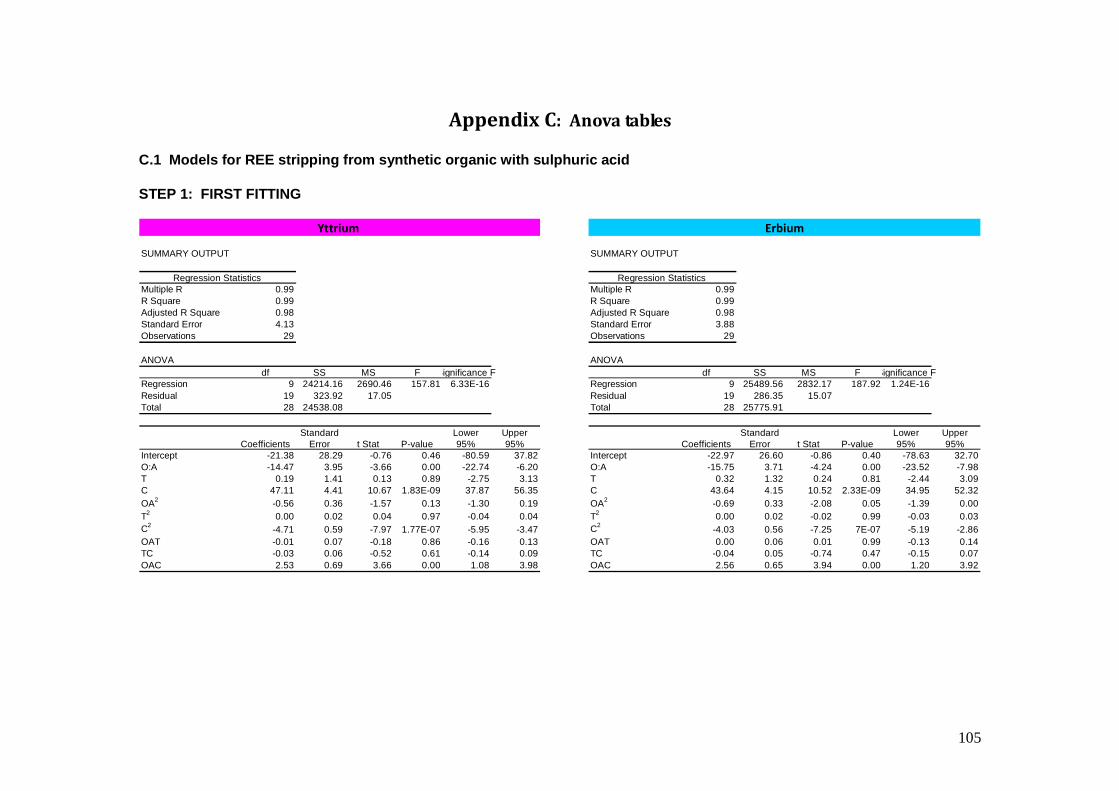
105
Appendix C: Anova tables
C.1 Models for REE stripping from synthetic organic with sulphuric acid STEP 1: FIRST FITTING
SUMMARY OUTPUT SUMMARY OUTPUT
Regression Statistics Regression StatisticsMultiple R 0.99 Multiple R 0.99R Square 0.99 R Square 0.99Adjusted R Square 0.98 Adjusted R Square 0.98Standard Error 4.13 Standard Error 3.88Observations 29 Observations 29
ANOVA ANOVAdf SS MS F Significance F df SS MS F Significance F
Regression 9 24214.16 2690.46 157.81 6.33E-16 Regression 9 25489.56 2832.17 187.92 1.24E-16Residual 19 323.92 17.05 Residual 19 286.35 15.07Total 28 24538.08 Total 28 25775.91
CoefficientsStandard
Error t Stat P-valueLower 95%
Upper 95% Coefficients
Standard Error t Stat P-value
Lower 95%
Upper 95%
Intercept -21.38 28.29 -0.76 0.46 -80.59 37.82 Intercept -22.97 26.60 -0.86 0.40 -78.63 32.70O:A -14.47 3.95 -3.66 0.00 -22.74 -6.20 O:A -15.75 3.71 -4.24 0.00 -23.52 -7.98T 0.19 1.41 0.13 0.89 -2.75 3.13 T 0.32 1.32 0.24 0.81 -2.44 3.09C 47.11 4.41 10.67 1.83E-09 37.87 56.35 C 43.64 4.15 10.52 2.33E-09 34.95 52.32OA2 -0.56 0.36 -1.57 0.13 -1.30 0.19 OA2 -0.69 0.33 -2.08 0.05 -1.39 0.00T2 0.00 0.02 0.04 0.97 -0.04 0.04 T2 0.00 0.02 -0.02 0.99 -0.03 0.03C2
-4.71 0.59 -7.97 1.77E-07 -5.95 -3.47 C2-4.03 0.56 -7.25 7E-07 -5.19 -2.86
OAT -0.01 0.07 -0.18 0.86 -0.16 0.13 OAT 0.00 0.06 0.01 0.99 -0.13 0.14TC -0.03 0.06 -0.52 0.61 -0.14 0.09 TC -0.04 0.05 -0.74 0.47 -0.15 0.07OAC 2.53 0.69 3.66 0.00 1.08 3.98 OAC 2.56 0.65 3.94 0.00 1.20 3.92
Yttrium Erbium
Stellenbosch University http://scholar.sun.ac.za

106
SUMMARY OUTPUT SUMMARY OUTPUT
Regression Statistics Regression StatisticsMultiple R 0.99 Multiple R 0.97R Square 0.98 R Square 0.94Adjusted R Square 0.98 Adjusted R Square 0.91Standard Error 4.31 Standard Error 6.01Observations 29 Observations 29
ANOVA ANOVAdf SS MS F Significance F df SS MS F Significance F
Regression 9 22855.75 2539.53 136.60 2.43E-15 Regression 9 10078.33 1119.81 31.01 1.68E-09Residual 19 353.24 18.59 Residual 19 686.21 36.12Total 28 23208.99 Total 28 10764.54
CoefficientsStandard
Error t Stat P-valueLower 95%
Upper 95% Coefficients
Standard Error t Stat P-value
Lower 95%
Upper 95%
Intercept 28.73 29.54 0.97 0.34 -33.09 90.56 Intercept 19.93 41.17 0.48 0.63 -66.24 106.10O:A -3.84 4.13 -0.93 0.36 -12.48 4.79 O:A 15.48 5.75 2.69 0.01 3.45 27.52T -1.23 1.47 -0.84 0.41 -4.30 1.84 T -1.08 2.05 -0.53 0.60 -5.37 3.20C 0.03 4.61 0.01 1.00 -9.62 9.68 C -8.23 6.42 -1.28 0.22 -21.68 5.21OA2 2.17 0.37 5.84 1.27E-05 1.39 2.94 OA2 2.85 0.52 5.50 2.61E-05 1.76 3.93T2 0.02 0.02 0.92 0.37 -0.02 0.05 T2 0.02 0.03 0.79 0.44 -0.03 0.07
C2 2.43 0.62 3.95 8.66E-04 1.14 3.73 C2 0.57 0.86 0.67 0.51 -1.23 2.37OAT -0.05 0.07 -0.64 0.53 -0.20 0.10 OAT -0.54 0.10 -5.36 3.58E-05 -0.74 -0.33TC 0.09 0.06 1.49 0.15 -0.03 0.21 TC 0.30 0.08 3.77 0.00 0.13 0.47OAC -4.23 0.72 -5.86 1.2E-05 -5.75 -2.72 OAC -3.29 1.01 -3.27 0.00 -5.39 -1.18
Ytterbium Iron
Stellenbosch University http://scholar.sun.ac.za
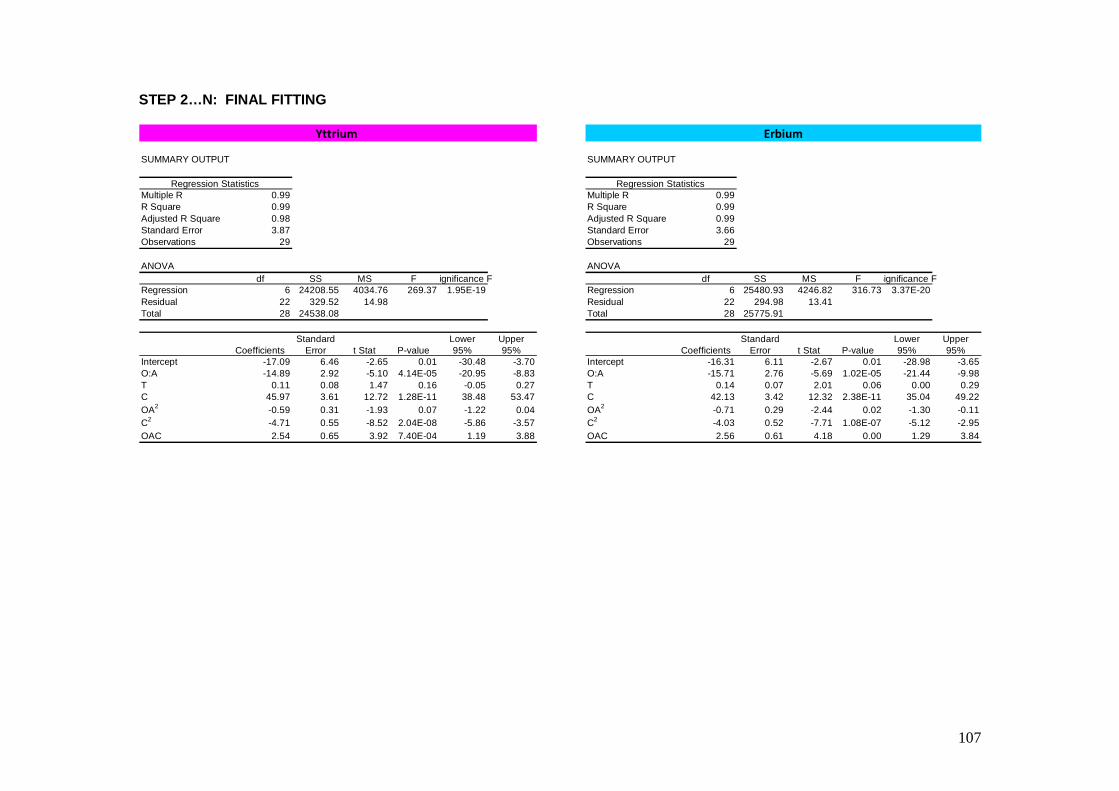
107
STEP 2…N: FINAL FITTING
SUMMARY OUTPUT SUMMARY OUTPUT
Regression Statistics Regression StatisticsMultiple R 0.99 Multiple R 0.99R Square 0.99 R Square 0.99Adjusted R Square 0.98 Adjusted R Square 0.99Standard Error 3.87 Standard Error 3.66Observations 29 Observations 29
ANOVA ANOVAdf SS MS F Significance F df SS MS F Significance F
Regression 6 24208.55 4034.76 269.37 1.95E-19 Regression 6 25480.93 4246.82 316.73 3.37E-20Residual 22 329.52 14.98 Residual 22 294.98 13.41Total 28 24538.08 Total 28 25775.91
CoefficientsStandard
Error t Stat P-valueLower 95%
Upper 95% Coefficients
Standard Error t Stat P-value
Lower 95%
Upper 95%
Intercept -17.09 6.46 -2.65 0.01 -30.48 -3.70 Intercept -16.31 6.11 -2.67 0.01 -28.98 -3.65O:A -14.89 2.92 -5.10 4.14E-05 -20.95 -8.83 O:A -15.71 2.76 -5.69 1.02E-05 -21.44 -9.98T 0.11 0.08 1.47 0.16 -0.05 0.27 T 0.14 0.07 2.01 0.06 0.00 0.29C 45.97 3.61 12.72 1.28E-11 38.48 53.47 C 42.13 3.42 12.32 2.38E-11 35.04 49.22OA2 -0.59 0.31 -1.93 0.07 -1.22 0.04 OA2 -0.71 0.29 -2.44 0.02 -1.30 -0.11C2 -4.71 0.55 -8.52 2.04E-08 -5.86 -3.57 C2 -4.03 0.52 -7.71 1.08E-07 -5.12 -2.95OAC 2.54 0.65 3.92 7.40E-04 1.19 3.88 OAC 2.56 0.61 4.18 0.00 1.29 3.84
Yttrium Erbium
Stellenbosch University http://scholar.sun.ac.za

108
SUMMARY OUTPUT SUMMARY OUTPUT
Regression Statistics Regression StatisticsMultiple R 0.99 Multiple R 0.97R Square 0.98 R Square 0.93Adjusted R Square 0.98 Adjusted R Square 0.91Standard Error 4.06 Standard Error 5.82Observations 29 Observations 29
ANOVA ANOVAdf SS MS F Significance F df SS MS F Significance F
Regression 5 22829.28 4565.86 276.56 9.62E-20 Regression 7 10053.02 1436.15 42.39 5.52E-11Residual 23 379.72 16.51 Residual 21 711.52 33.88Total 28 23208.99 Total 28 10764.54
CoefficientsStandard
Error t Stat P-valueLower 95%
Upper 95% Coefficients
Standard Error t Stat P-value
Lower 95%
Upper 95%
Intercept 7.24 3.49 2.07 0.05 0.02 14.47 Intercept -4.78 9.71 -0.49 0.63 -24.98 15.42O:A -5.39 3.02 -1.79 0.09 -11.63 0.85 O:A 15.76 5.55 2.84 0.01 4.21 27.30OA2 2.08 0.32 6.52 1.2E-06 1.42 2.73 C -4.75 3.48 -1.36 0.19 -11.98 2.49C2 2.35 0.19 12.27 1.43E-11 1.95 2.75 OA2 2.88 0.50 5.76 1.01E-05 1.84 3.92TC 0.10 0.02 5.59 1.08E-05 0.06 0.14 T2 0.01 0.00 1.56 0.13 0.00 0.02OAC -4.24 0.66 -6.40 1.57E-06 -5.61 -2.87 OAT -0.54 0.10 -5.67 1.24E-05 -0.74 -0.34
TC 0.30 0.08 3.92 0.00 0.14 0.47OAC -3.29 0.97 -3.38 0.00 -5.32 -1.26
Ytterbium Iron
Stellenbosch University http://scholar.sun.ac.za
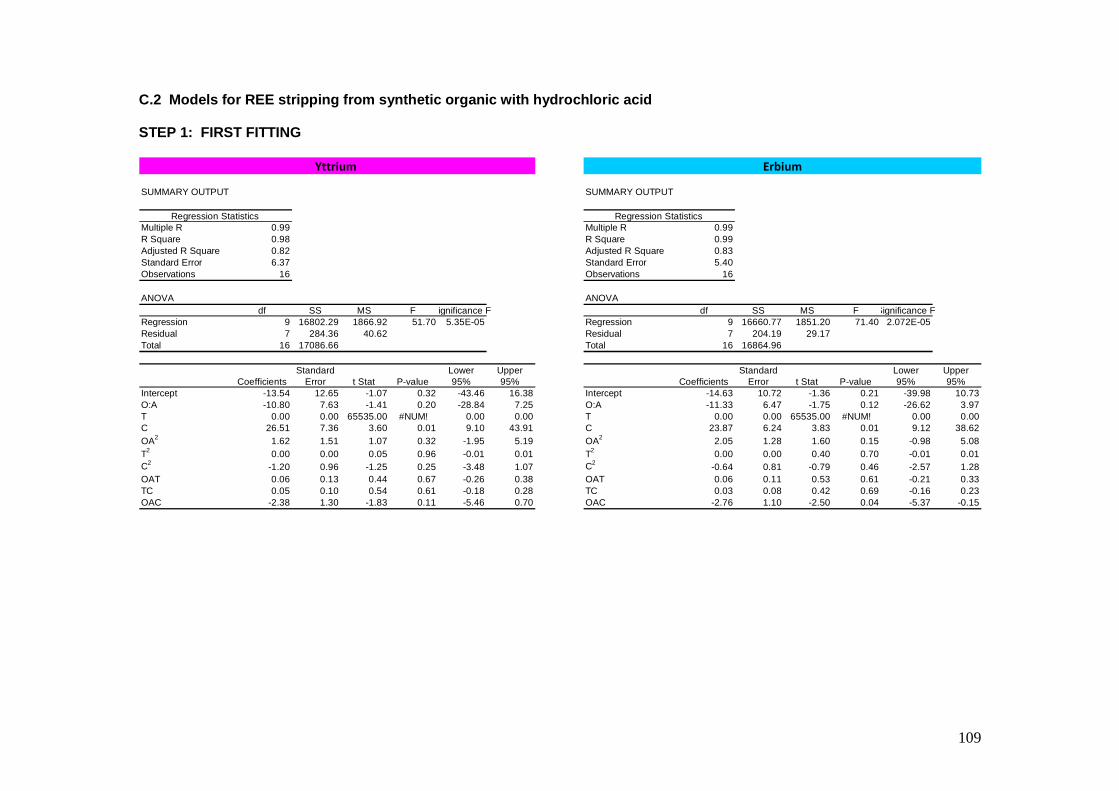
109
C.2 Models for REE stripping from synthetic organic with hydrochloric acid STEP 1: FIRST FITTING
SUMMARY OUTPUT SUMMARY OUTPUT
Regression Statistics Regression StatisticsMultiple R 0.99 Multiple R 0.99R Square 0.98 R Square 0.99Adjusted R Square 0.82 Adjusted R Square 0.83Standard Error 6.37 Standard Error 5.40Observations 16 Observations 16
ANOVA ANOVAdf SS MS F Significance F df SS MS F Significance F
Regression 9 16802.29 1866.92 51.70 5.35E-05 Regression 9 16660.77 1851.20 71.40 2.072E-05Residual 7 284.36 40.62 Residual 7 204.19 29.17Total 16 17086.66 Total 16 16864.96
CoefficientsStandard
Error t Stat P-valueLower 95%
Upper 95% Coefficients
Standard Error t Stat P-value
Lower 95%
Upper 95%
Intercept -13.54 12.65 -1.07 0.32 -43.46 16.38 Intercept -14.63 10.72 -1.36 0.21 -39.98 10.73O:A -10.80 7.63 -1.41 0.20 -28.84 7.25 O:A -11.33 6.47 -1.75 0.12 -26.62 3.97T 0.00 0.00 65535.00 #NUM! 0.00 0.00 T 0.00 0.00 65535.00 #NUM! 0.00 0.00C 26.51 7.36 3.60 0.01 9.10 43.91 C 23.87 6.24 3.83 0.01 9.12 38.62OA2 1.62 1.51 1.07 0.32 -1.95 5.19 OA2 2.05 1.28 1.60 0.15 -0.98 5.08T2 0.00 0.00 0.05 0.96 -0.01 0.01 T2 0.00 0.00 0.40 0.70 -0.01 0.01C2 -1.20 0.96 -1.25 0.25 -3.48 1.07 C2 -0.64 0.81 -0.79 0.46 -2.57 1.28OAT 0.06 0.13 0.44 0.67 -0.26 0.38 OAT 0.06 0.11 0.53 0.61 -0.21 0.33TC 0.05 0.10 0.54 0.61 -0.18 0.28 TC 0.03 0.08 0.42 0.69 -0.16 0.23OAC -2.38 1.30 -1.83 0.11 -5.46 0.70 OAC -2.76 1.10 -2.50 0.04 -5.37 -0.15
Yttrium Erbium
Stellenbosch University http://scholar.sun.ac.za

110
SUMMARY OUTPUT SUMMARY OUTPUT
Regression Statistics Regression StatisticsMultiple R 1.00 Multiple R 0.99R Square 0.99 R Square 0.98Adjusted R Square 0.84 Adjusted R Square 0.81Standard Error 2.64 Standard Error 8.15Observations 16 Observations 16
ANOVA ANOVAdf SS MS F Significance F df SS MS F Significance F
Regression 9 4943.96 549.33 88.83 1.09E-05 Regression 9 18938.82 2104.31 35.61 0.000159Residual 7 48.70 6.96 Residual 7 465.42 66.49Total 16 4992.66 Total 16 19404.25
CoefficientsStandard
Error t Stat P-valueLower 95%
Upper 95% Coefficients
Standard Error t Stat P-value
Lower 95%
Upper 95%
Intercept -3.74 5.24 -0.71 0.50 -16.12 8.64 Intercept -6.15 16.19 -0.38 0.72 -44.43 32.13O:A 6.01 3.16 1.90 0.10 -1.45 13.48 O:A -7.12 9.76 -0.73 0.49 -30.21 15.96T 0.00 0.00 65535.00 #NUM! 0.00 0.00 T 0.00 0.00 65535.00 #NUM! 0.00 0.00C -3.75 3.05 -1.23 0.26 -10.95 3.46 C 3.13 9.42 0.33 0.75 -19.14 25.40OA2 3.01 0.63 4.81 0.00 1.53 4.48 OA2 1.53 1.93 0.79 0.45 -3.04 6.10T2 0.00 0.00 0.25 0.81 0.00 0.01 T2 0.00 0.01 0.52 0.62 -0.01 0.02C2
1.71 0.40 4.31 0.00 0.77 2.66 C22.89 1.23 2.35 0.05 -0.01 5.80
OAT -0.18 0.06 -3.16 0.02 -0.31 -0.04 OAT 0.07 0.17 0.38 0.71 -0.34 0.47TC 0.15 0.04 3.65 0.01 0.05 0.24 TC 0.05 0.12 0.43 0.68 -0.24 0.35OAC -4.73 0.54 -8.77 0.00 -6.00 -3.45 OAC -2.81 1.67 -1.69 0.14 -6.75 1.13
Ytterbium Iron
Stellenbosch University http://scholar.sun.ac.za

111
STEP 2…N: FINAL FITTING
SUMMARY OUTPUT SUMMARY OUTPUT
Regression Statistics Regression StatisticsMultiple R 0.99 Multiple R 0.99R Square 0.98 R Square 0.99Adjusted R Square 0.97 Adjusted R Square 0.98Standard Error 5.85 Standard Error 4.94Observations 16 Observations 16
ANOVA ANOVAdf SS MS F Significance F df SS MS F Significance F
Regression 6 16778.56 2796.43 81.69 2.46E-07 Regression 6 16644.93 2774.15 113.47 5.79E-08Residual 9 308.09 34.23 Residual 9 220.03 24.45Total 15 17086.66 Total 15 16864.96
CoefficientsStandard
Error t Stat P-valueLower 95%
Upper 95% Coefficients
Standard Error t Stat P-value
Lower 95%
Upper 95%
Intercept -24.80 10.43 -2.38 0.04 -48.40 -1.19 Intercept -25.56 8.82 -2.90 0.02 -45.51 -5.62O:A -8.41 4.97 -1.69 0.12 -19.66 2.83 O:A -8.93 4.20 -2.12 0.06 -18.43 0.58T 0.29 0.15 2.00 0.08 -0.04 0.62 T 0.35 0.12 2.79 0.02 0.07 0.62C 28.61 5.73 4.99 0.00 15.64 41.58 C 25.26 4.84 5.21 0.00 14.30 36.22OA2 1.62 1.39 1.17 0.27 -1.52 4.76 OA2 2.05 1.17 1.75 0.11 -0.60 4.70C2 -1.20 0.88 -1.36 0.21 -3.20 0.79 C2 -0.64 0.75 -0.86 0.41 -2.33 1.04OAC -2.38 1.20 -1.99 0.08 -5.09 0.32 OAC -2.76 1.01 -2.73 0.02 -5.05 -0.48
Yttrium Erbium
Stellenbosch University http://scholar.sun.ac.za

112
SUMMARY OUTPUT SUMMARY OUTPUT
Regression Statistics Regression StatisticsMultiple R 1.00 Multiple R 0.99R Square 0.99 R Square 0.97Adjusted R Square 0.98 Adjusted R Square 0.96Standard Error 2.48 Standard Error 7.39Observations 16 Observations 16
ANOVA ANOVAdf SS MS F Significance F df SS MS F Significance F
Regression 7 4943.53 706.22 115.00 2.16E-07 Regression 6 18912.76 3152.13 57.72 1.12E-06Residual 8 49.13 6.14 Residual 9 491.48 54.61Total 15 4992.66 Total 15 19404.25
CoefficientsStandard
Error t Stat P-valueLower 95%
Upper 95% Coefficients
Standard Error t Stat P-value
Lower 95%
Upper 95%
Intercept -2.87 3.66 -0.79 0.45 -11.31 5.56 Intercept -22.40 13.18 -1.70 0.12 -52.21 7.41O:A 5.82 2.87 2.02 0.08 -0.81 12.44 O:A -4.51 6.28 -0.72 0.49 -18.71 9.70C -4.06 2.61 -1.55 0.16 -10.08 1.96 T 0.55 0.18 2.96 0.02 0.13 0.96OA2 3.01 0.59 5.12 0.00 1.65 4.36 C 5.27 7.24 0.73 0.49 -11.12 21.65C2 1.71 0.37 4.59 0.00 0.85 2.58 OA2 1.53 1.75 0.88 0.40 -2.43 5.50OAT -0.17 0.05 -3.49 0.01 -0.28 -0.06 C2 2.89 1.11 2.60 0.03 0.37 5.41TC 0.15 0.02 6.46 0.00 0.10 0.21 OAC -2.81 1.51 -1.86 0.10 -6.23 0.61OAC -4.73 0.51 -9.34 0.00 -5.90 -3.56
Ytterbium Iron
Stellenbosch University http://scholar.sun.ac.za

113
C.3 Models for REE stripping from plant organic with sulphuric acid STEP 1: FIRST FITTING
SUMMARY OUTPUT SUMMARY OUTPUT
Regression Statistics Regression StatisticsMultiple R 0.99 Multiple R 0.98R Square 0.97 R Square 0.96Adjusted R Square 0.94 Adjusted R Square 0.92Standard Error 9.67 Standard Error 11.08Observations 17 Observations 17
ANOVA ANOVAdf SS MS F Significance F df SS MS F Significance F
Regression 9 22424.55 2491.62 26.67 0.000132 Regression 9 22839.36 2537.71 20.68 0.000306Residual 7 653.90 93.41 Residual 7 859.08 122.73Total 16 23078.45 Total 16 23698.44
CoefficientsStandard
Error t Stat P-valueLower 95%
Upper 95% Coefficients
Standard Error t Stat P-value
Lower 95%
Upper 95%
Intercept -3.43E+16 1.76E+16 -1.94 0.09 -7.6E+16 7.42E+15 Intercept -3.96E+16 2.02E+16 -1.96 0.09 -8.74E+16 8.24E+15O:A -30.12 15.75 -1.91 0.10 -67.36 7.12 O:A -31.93 18.05 -1.77 0.12 -74.61 10.76T 1.83E+15 9.41E+14 1.94 0.09 -3.96E+14 4.05E+15 T 2.11E+15 1.08E+15 1.96 0.09 -4.39E+14 4.66E+15C 46.48 7.95 5.85 0.00 27.69 65.27 C 44.72 9.11 4.91 0.00 23.19 66.26OAT 0.28 0.35 0.80 0.45 -0.55 1.11 OAT 0.31 0.40 0.78 0.46 -0.64 1.26TC -0.29 0.12 -2.37 0.05 -0.59 0.00 TC -0.30 0.14 -2.13 0.07 -0.64 0.03OAC 2.48 1.66 1.50 0.18 -1.44 6.39 OAC 2.37 1.90 1.25 0.25 -2.12 6.86OA2 0.04 2.46 0.02 0.99 -5.78 5.86 OA2 0.15 2.82 0.05 0.96 -6.52 6.82T2 -2.29E+13 1.18E+13 -1.94 0.09 -5.07E+13 4.95E+12 T2 -2.64E+13 1.35E+13 -1.96 0.09 -5.83E+13 5.49E+12C2
-2.64 0.66 -4.03 0.00 -4.19 -1.09 C2-2.30 0.75 -3.06 0.02 -4.08 -0.52
Yttrium Erbium
Stellenbosch University http://scholar.sun.ac.za

114
SUMMARY OUTPUT SUMMARY OUTPUT
Regression Statistics Regression StatisticsMultiple R 0.98 Multiple R 0.98R Square 0.97 R Square 0.96Adjusted R Square 0.93 Adjusted R Square 0.91Standard Error 8.48 Standard Error 4.40Observations 17 Observations 17
ANOVA ANOVAdf SS MS F Significance F df SS MS F Significance F
Regression 9 14982.60 1664.73 23.13 0.0002115 Regression 9 3400.40 377.82 19.54 0.0003676Residual 7 503.80 71.97 Residual 7 135.32 19.33Total 16 15486.40 Total 16 3535.72
Coefficients Standard Error t Stat P-valueLower 95%
Upper 95% Coefficients
Standard Error t Stat P-value
Lower 95%
Upper 95%
Intercept -1.27E+16 1.55E+16 -0.82 0.44 -4.93E+16 2.39E+16 Intercept 1.63E+16 8.02E+15 2.03 0.08 -2.70E+15 3.53E+16O:A -9.69 13.82 -0.70 0.51 -42.37 23.00 O:A 17.31 7.16 2.42 0.05 0.37 34.25T 6.77E+14 8.26E+14 0.82 0.44 -1.28E+15 2.63E+15 T -8.68E+14 4.28E+14 -2.03 0.08 -1.88E+15 1.44E+14C 5.12 6.97 0.73 0.49 -11.38 21.61 C -13.43 3.61 -3.72 0.01 -21.98 -4.89OAT 0.09 0.31 0.29 0.78 -0.64 0.81 OAT -0.41 0.16 -2.57 0.04 -0.78 -0.03TC 0.01 0.11 0.05 0.96 -0.25 0.26 TC 0.31 0.06 5.43 0.00 0.17 0.44OAC -2.36 1.45 -1.63 0.15 -5.80 1.07 OAC -2.25 0.75 -2.98 0.02 -4.03 -0.47OA2 1.65 2.16 0.77 0.47 -3.45 6.76 OA2 2.11 1.12 1.88 0.10 -0.54 4.76T2 -8.47E+12 1.03E+13 -0.82 0.44 -3.29E+13 1.59E+13 T2 1.08E+13 5.35E+12 2.03 0.08 -1.80E+12 2.35E+13C2
1.31 0.58 2.27 0.06 -0.06 2.67 C20.82 0.30 2.76 0.03 0.12 1.53
Ytterbium Iron
Stellenbosch University http://scholar.sun.ac.za

115
STEP 2…N: FINAL FITTING
SUMMARY OUTPUT SUMMARY OUTPUT
Regression Statistics Regression StatisticsMultiple R 0.98 Multiple R 0.97R Square 0.96 R Square 0.94Adjusted R Square 0.93 Adjusted R Square 0.91Standard Error 9.80 Standard Error 11.25Observations 17 Observations 17.00
ANOVA ANOVAdf SS MS F Significance F df SS MS F Significance F
Regression 6 22117.10 3686.18 38.34 2.454E-06 Regression 5 22306.81 4461.36 35.26 2.06E-06Residual 10 961.36 96.14 Residual 11 1391.63 126.51Total 16 23078.45 Total 16 23698.44
CoefficientsStandard
Error t Stat P-valueLower 95%
Upper 95% Coefficients
Standard Error t Stat P-value
Lower 95%
Upper 95%
Intercept -1.65E+16 1.44E+16 -1.14 0.28 -4.86E+16 1.57E+16 Intercept -69.65 25.00 -2.79 0.02 -124.67 -14.64O:A -5.70 2.63 -2.17 0.06 -11.56 0.17 O:A -5.02 2.88 -1.74 0.11 -11.37 1.32T 8.79E+14 7.69E+14 1.14 0.28 -8.36E+14 2.59E+15 T 1.34 0.58 2.33 0.04 0.07 2.61C 44.94 7.90 5.69 0.00 27.34 62.53 C 36.66 7.62 4.81 0.00 19.89 53.43TC -0.23 0.12 -1.89 0.09 -0.49 0.04 TC -0.16 0.13 -1.28 0.23 -0.44 0.12T2
-1.10E+13 9.62E+12 -1.14 0.28 -3.24E+13 1.04E+13 C2-1.80 0.69 -2.60 0.02 -3.33 -0.28
C2-2.48 0.64 -3.85 0.00 -3.91 -1.04
Yttrium Erbium
Stellenbosch University http://scholar.sun.ac.za

116
SUMMARY OUTPUT SUMMARY OUTPUT
Regression Statistics Regression StatisticsMultiple R 0.98 Multiple R 0.96R Square 0.96 R Square 0.91Adjusted R Square 0.94 Adjusted R Square 0.89Standard Error 7.76 Standard Error 5.03Observations 17 Observations 17
ANOVA ANOVAdf SS MS F Significance F df SS MS F Significance F
Regression 5 14823.68 2964.74 49.21 3.7E-07 Regression 4 3232.44 808.11 31.97 2.58E-06Residual 11 662.72 60.25 Residual 12 303.28 25.27Total 16 15486.40 Total 16 3535.72
CoefficientsStandard
Error t Stat P-valueLower 95%
Upper 95% Coefficients
Standard Error t Stat P-value
Lower 95%
Upper 95%
Intercept -26.46 11.92 -2.22 0.05 -52.70 -0.23 Intercept 6.52 4.28 1.52 0.15 -2.80 15.83O:A 1.70 5.29 0.32 0.75 -9.95 13.34 C2 0.56 0.31 1.80 0.10 -0.12 1.23T 0.64 0.19 3.35 0.01 0.22 1.06 OAC -0.98 0.27 -3.62 0.00 -1.57 -0.39C2 1.39 0.48 2.91 0.01 0.34 2.44 C -10.15 2.84 -3.58 0.00 -16.33 -3.97OAC -2.56 1.11 -2.30 0.04 -5.01 -0.11 TC 0.25 0.03 9.38 7.13E-07 0.19 0.31C 4.56 4.22 1.08 0.30 -4.73 13.84
Ytterbium Iron
Stellenbosch University http://scholar.sun.ac.za

117
C.4 Models for REE stripping from plant organic with hydrochloric acid STEP 1: FIRST FITTING
SUMMARY OUTPUT SUMMARY OUTPUT
Regression Statistics Regression StatisticsMultiple R 0.99 Multiple R 0.99R Square 0.98 R Square 0.98Adjusted R Square 0.95 Adjusted R Square 0.95Standard Error 7.54 Standard Error 7.26Observations 17 Observations 17
ANOVA ANOVAdf SS MS F Significance F df SS MS F Significance F
Regression 9 18472.10 2052.46 36.08 4.801E-05 Regression 9 17507.08 1945.23 36.92 0.00Residual 7 398.25 56.89 Residual 7 368.80 52.69Total 16 18870.35 Total 16 17875.88
CoefficientsStandard
Error t Stat P-value Lower 95% Upper 95% CoefficientsStandard
Error t Stat P-value Lower 95% Upper 95%Intercept -2.74E+16 1.38E+16 -1.99 0.09 -6.00E+16 5.14E+15 Intercept -2.42E+16 1.32E+16 -1.82 0.11 -5.55E+16 7.16E+15O:A -21.92 12.29 -1.78 0.12 -50.98 7.14 O:A -20.64 11.83 -1.75 0.12 -48.60 7.33T 1.46E+15 7.34E+14 1.99 0.09 -2.74E+14 3.20E+15 T 1.29E+15 7.07E+14 1.82 0.11 -3.82E+14 2.96E+15C 29.12 6.20 4.70 0.00 14.46 4.38E+01 C 26.68 5.97 4.47 0.00 12.57 40.79OAT 0.18 0.27 0.65 0.54 -0.47 0.82 OAT 0.15 0.26 0.56 0.59 -0.47 0.77TC -0.07 0.10 -0.74 0.49 -0.30 0.16 TC -0.06 0.09 -0.65 0.53 -0.28 0.16OAC -0.35 1.29 -0.27 0.79 -3.41 2.71 OAC -0.88 1.24 -0.71 0.50 -3.82 2.06OA2 1.06 1.92 0.55 0.60 -3.48 5.60 OA2 1.62 1.85 0.88 0.41 -2.75 5.99T2 -1.83E+13 9.18E+12 -1.99 0.09 -4.00E+13 3.42E+12 T2 -1.61E+13 8.83E+12 -1.82 0.11 -3.70E+13 4.77E+12C2
-1.31 5.12E-01 -2.56 0.04 -2.52 -0.10 C2-1.05 0.49 -2.13 0.07 -2.22 0.11
Yttrium Erbium
Stellenbosch University http://scholar.sun.ac.za

118
SUMMARY OUTPUT SUMMARY OUTPUT
Regression Statistics Regression StatisticsMultiple R 1.00 Multiple R 0.89R Square 0.99 R Square 0.79Adjusted R Square 0.98 Adjusted R Square 0.52Standard Error 2.17 Standard Error 19.38Observations 17 Observations 17
ANOVA ANOVAdf SS MS F Significance F df SS MS F Significance F
Regression 9 3279.17 364.35 77.58 3.532E-06 Regression 9 10001.01 1111.22 2.96 0.0832832Residual 7 32.87 4.70 Residual 7 2628.40 375.49Total 16 3312.04 Total 16 12629.40
CoefficientsStandard
Error t Stat P-valueLower 95%
Upper 95% Coefficients
Standard Error t Stat P-value
Lower 95%
Upper 95%
Intercept 1.01E+16 3.96E+15 2.56 0.04 7.80E+14 1.95E+16 Intercept -3.22E+16 3.20E+16 -1.01 0.35 -1.08E+17 4.34E+16O:A 9.02 3.53 2.56 0.04 0.67 17.37 C 39.30 14.82 2.65 0.03 4.27 74.34T -5.40E+14 2.11E+14 -2.56 0.04 -1.04E+15 -4.16E+13 O:A 0.33 27.67 0.01 0.99 -65.11 65.77C -0.46 1.78 -0.26 0.81 -4.67 3.76 T 1.72E+15 1.70E+15 1.01 0.35 -2.31E+15 5.75E+15OAT -0.21 0.08 -2.65 0.03 -0.39 -0.02 TC 0.05 0.25 0.20 0.85 -0.54 0.64TC 0.10 0.03 3.53 0.01 0.03 0.16 OAC -3.88 3.32 -1.17 0.28 -11.73 3.97OAC -3.62886138 0.371357 -9.77 0.00 -4.506982 -2.750741 OAT -0.42 0.70 -0.60 0.57 -2.08 1.24OA2 2.91 0.55 5.28 0.00 1.61 4.22 OA2 7.05 5.30 1.33 0.22 -5.47 19.58T2 6.76E+12 2.64E+12 2.56 0.04 5.20E+11 1.30E+13 T2 -2.15E+13 2.13E+13 -1.01 0.35 -7.18E+13 2.89E+13C2
0.72 0.15 4.87 0.00 0.37 1.06 C2-3.57 1.31 -2.71 0.03 -6.67 -0.46
Ytterbium Iron
Stellenbosch University http://scholar.sun.ac.za

119
STEP 2…N: FINAL FITTING
SUMMARY OUTPUT SUMMARY OUTPUT
Regression Statistics Regression StatisticsMultiple R 0.98 Multiple R 0.98R Square 0.96 R Square 0.96Adjusted R Square 0.95 Adjusted R Square 0.94Standard Error 8.03 Standard Error 8.03Observations 17 Observations 17
ANOVA ANOVAdf SS MS F Significance F df SS MS F Significance F
Regression 4 18096.61 4524.15 70.17 3.21E-08 Regression 4 17102.41 4275.60 66.33 4.42E-08Residual 12 773.74 64.48 Residual 12 773.47 64.46Total 16 18870.35 Total 16 17875.88
CoefficientsStandard
Error t Stat P-valueLower 95%
Upper 95% Coefficients
Standard Error t Stat P-value
Lower 95%
Upper 95%
Intercept -21.39 10.16 -2.10 0.06 -43.53 0.75 Intercept -21.38 10.16 -2.10 0.06 -43.51 0.76O:A -10.38 2.05 -5.06 0.00 -14.86 -5.91 O:A -10.90 2.05 -5.31 0.00 -15.37 -6.43T 0.30 0.20 1.54 0.15 -0.13 0.74 T 0.37 0.20 1.87 0.09 -0.06 0.80C 22.20 4.04 5.49 0.00 13.39 31.00 C 20.14 4.04 4.99 0.00 11.34 28.95C2
-0.97 0.49 -1.96 0.07 -2.05 0.11 C2-0.77 0.49 -1.57 0.14 -1.85 0.30
Yttrium Erbium
Stellenbosch University http://scholar.sun.ac.za

120
SUMMARY OUTPUT
Regression StatisticsMultiple R 0.99R Square 0.97Adjusted R Square 0.96Standard Error 2.71Observations 17
ANOVAdf SS MS F Significance F
Regression 4 3223.88 805.97 109.70 0.00Residual 12 88.16 7.35Total 16 3312.04
CoefficientsStandard
Error t Stat P-valueLower 95%
Upper 95%
Intercept -1.83 1.36 -1.35 0.20 -4.79 1.13OA2 2.05 0.43 4.71 0.00 1.10 2.99C2 0.73 0.09 8.32 0.00 0.54 0.92OAC -3.06 0.34 -9.07 0.00 -3.80 -2.33TC 0.07 0.01 5.49 0.00 0.04 0.10
Ytterbium
Stellenbosch University http://scholar.sun.ac.za

121
SUMMARY OUTPUT SUMMARY OUTPUT
Regression Statistics Regression StatisticsMultiple R 0.98 Multiple R 0.99R Square 0.97 R Square 0.98Adjusted R Square 0.95 Adjusted R Square 0.96Standard Error 7.16 Standard Error 4.68Observations 13 Observations 9
ANOVA ANOVAdf SS MS F Significance F df SS MS F Significance F
Regression 4 11612.44 2903.11 56.61 6.6E-06 Regression 4 4556.89 1139.22 51.92 0.001058Residual 8 410.28 51.28 Residual 4 87.77 21.94Total 12 12022.72 Total 8 4644.66
CoefficientsStandard
Error t Stat P-valueLower 95%
Upper 95% Coefficients
Standard Error t Stat P-value
Lower 95%
Upper 95%
Intercept -16.11 8.64 -1.87 0.10 -36.03 3.81 Intercept 198.54 12.52 15.86 0.00 163.77 233.31T 0.39 0.21 1.89 0.10 -0.09 0.86 C -20.87 1.66 -12.60 0.00 -25.47 -16.27C2 3.77 0.36 10.33 0.00 2.92 4.61 O:A -22.32 4.80 -4.65 0.01 -35.64 -9.00OAC -3.94 1.55 -2.54 0.03 -7.51 -0.37 T -0.03 0.17 -0.18 0.86 -0.49 0.43OA2 1.62 1.67 0.97 0.36 -2.24 5.48 OA2 2.77 1.17 2.37 0.08 -0.48 6.02
Iron (for HCl concentrations of 5 - 7 M)Iron (for HCl concentrations of 1 - 5 M)
Stellenbosch University http://scholar.sun.ac.za


