Some contributions to the creation of a ground motion map
for deep Vrancea Earthquakes
by Klaus-Peter Bonjer
and the CRC461-B3- and NIEP groups
Geophysical Institute, University of Karlsruhe, Germany
National Institute for Earth Physics, Bucharest
Trieste, November 30, 2004

Motivation: Why Vrancea ?
European Seismicity: 1975-1997
Vrancea March 4. 1977
intensity distribution
• high seismic activity
• small seismogenic area
• long historical record
• competent partners
➪

The K2 - Network
The Network consists of 42 Kinemetrics K2 accelerograph Systems for strong and weakground motion.
Standard configuration:six channels with 19 bits sample rate: 200 Hz per chch 1-3: 3-comp. Episensor 2g ch 4-6: 3-comp. velocity
transducerGPS-time unit
Inventory of accelerogramms�

JHD of the 1999 Calixto-Data and the K2- and Telemetry-Data of the time period 1997 – 2003
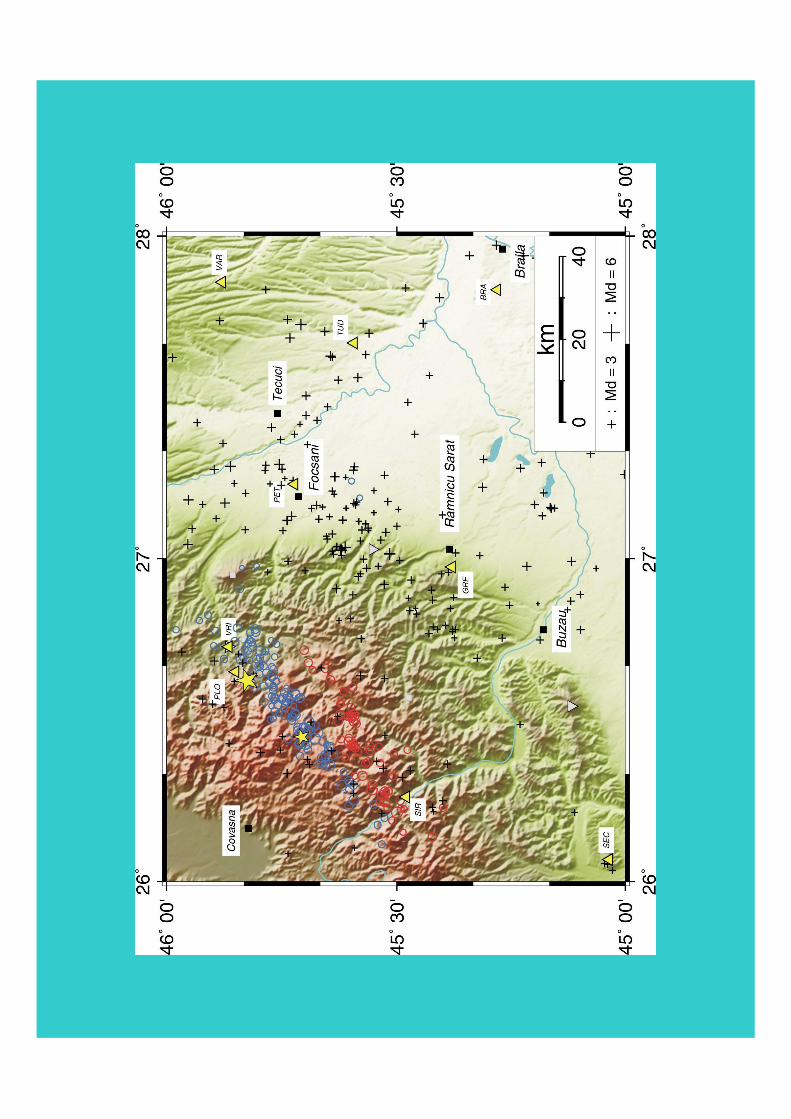
The Vrancea Source Zone

Geometry of the Seismogenic AreaJoint Hypocenter Determinations
(Jan. 01, 1997 – Dec. 31, 2003 )
Oncescu, 1984
N30W
➲
N60E
➲
The Vrancea Source Zone
big events: e.g. 1986 ���
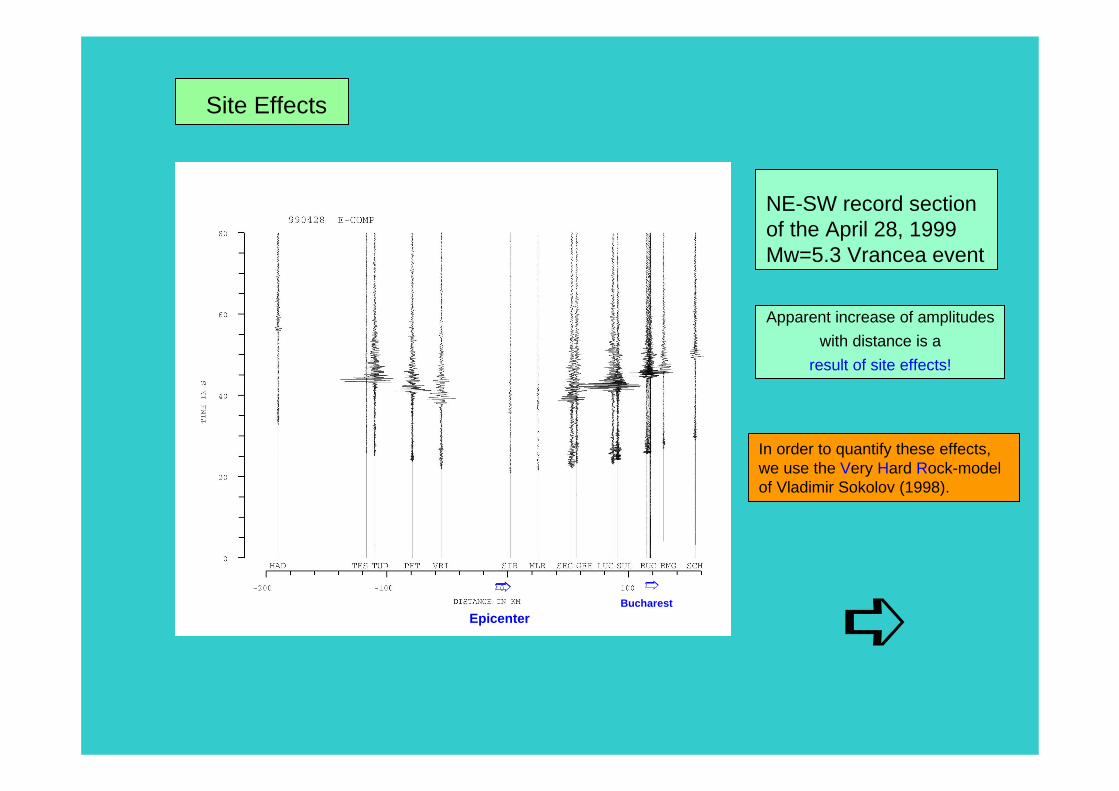
Site Effects
NE-SW record sectionof the April 28, 1999Mw=5.3 Vrancea event
Epicenter
Apparent increase of amplitudes
with distance is a
result of site effects!
In order to quantify these effects, we use the Very Hard Rock-model of Vladimir Sokolov (1998).
Bucharest
➱
➪➱

The general model for the Fourier acceleration Spectrum Aat a frequency f is given by:
)(),()()2()( 2 fIfRDfSCffA ⋅⋅⋅⋅= π
scaling factor
source spectrum
attenuationfunction
frequency-dependent
site response
We used several hundred records of the K2-network from more than 120 small magnitude (M = 3.5 -5.5) earthquakes, which occurred at depths between 70 and160 km in 1996 -2002, and a few tens records written by
SMA-1 systems during four large (M 7.4, 7.2, 6.9 and 6.3) earthquakes.
Site EffectsVHR-Model
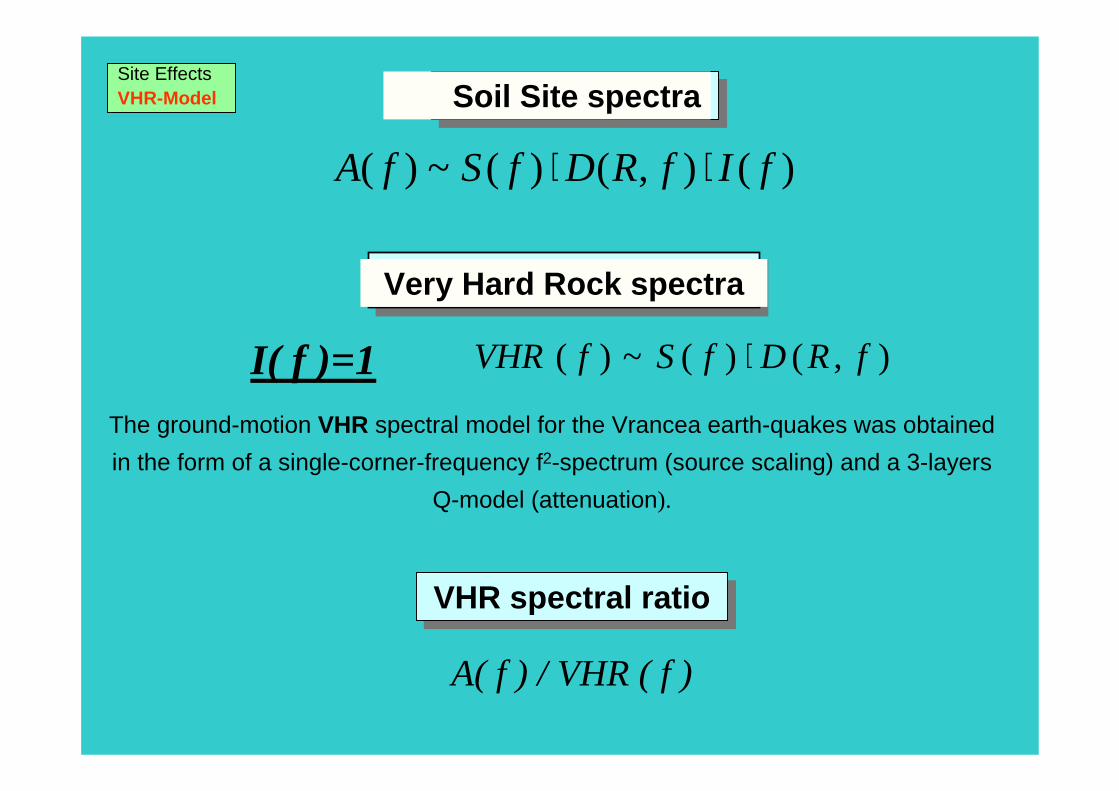
)(),()(~)( fIfRDfSfA ⋅⋅
Soil Site spectra
VHR spectral ratio
A( f ) / VHR ( f )
Very Hard Rock spectra
),()(~)( fRDfSfVHR ⋅I( f )=1The ground-motion VHR spectral model for the Vrancea earth-quakes was obtained
in the form of a single-corner-frequency f2-spectrum (source scaling) and a 3-layers
Q-model (attenuation).
Site EffectsVHR-Model
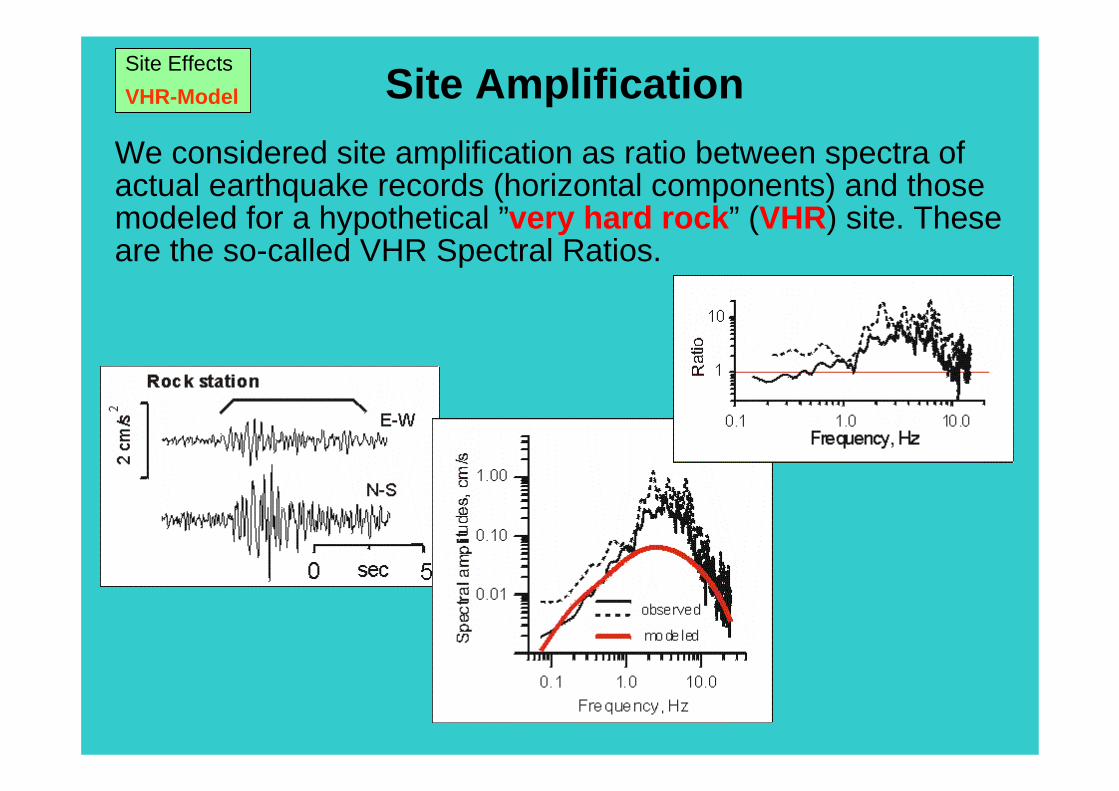
Site Amplification
We considered site amplification as ratio between spectra of actual earthquake records (horizontal components) and those modeled for a hypothetical ”very hard rock” (VHR) site. These are the so-called VHR Spectral Ratios.
Site Effects
VHR-Model

Rock sites
Soil sites
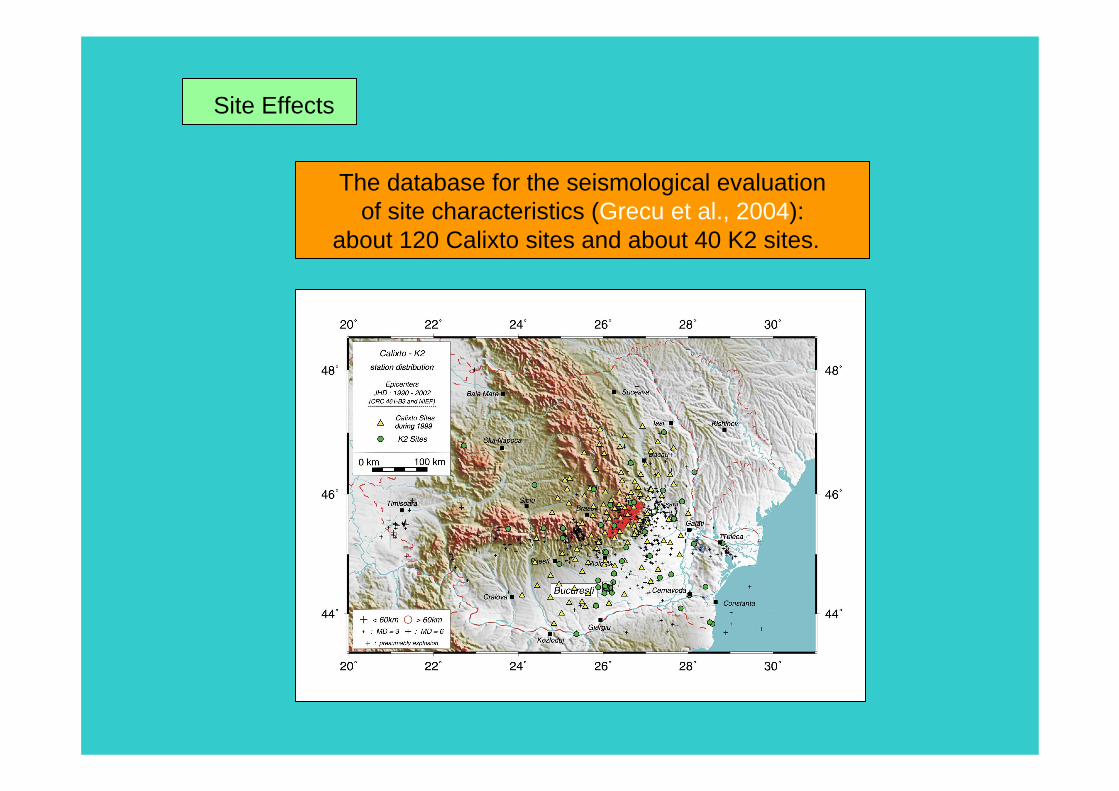
Site Effects
The database for the seismological evaluation of site characteristics (Grecu et al., 2004):
about 120 Calixto sites and about 40 K2 sites.

Site Effects
PGA – Shakemap of August 30, 1986 (Mw=7.2)
PGA – Shakemap of June 29, 1999 (Mw=4.2)
Average low-frequency soil-amplification
Average high-frequency soil-amplification
Results:
Ground motion is controlled by source and site effects.
Areas of strongest ground motion are up to 100km away from the epicenter.
Only small amplification in the Carpathians, in both frequency ranges.
Maximum amplification in the Foredeeps is up to 5/15 times greater compared to reference.
The Craiova area shows per-sistently high amplification.
High-frequency events will be amplified strongest in the eastern part of the Foredeeps.
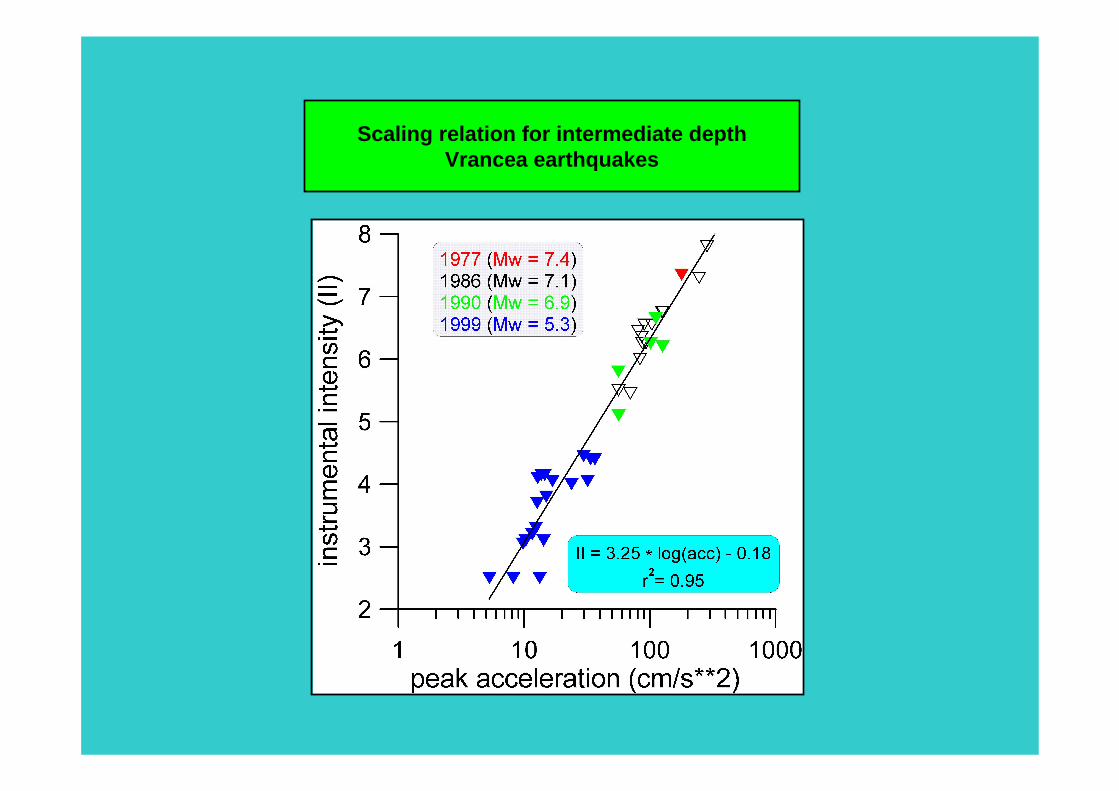
Scaling relation for intermediate depth Vrancea earthquakes
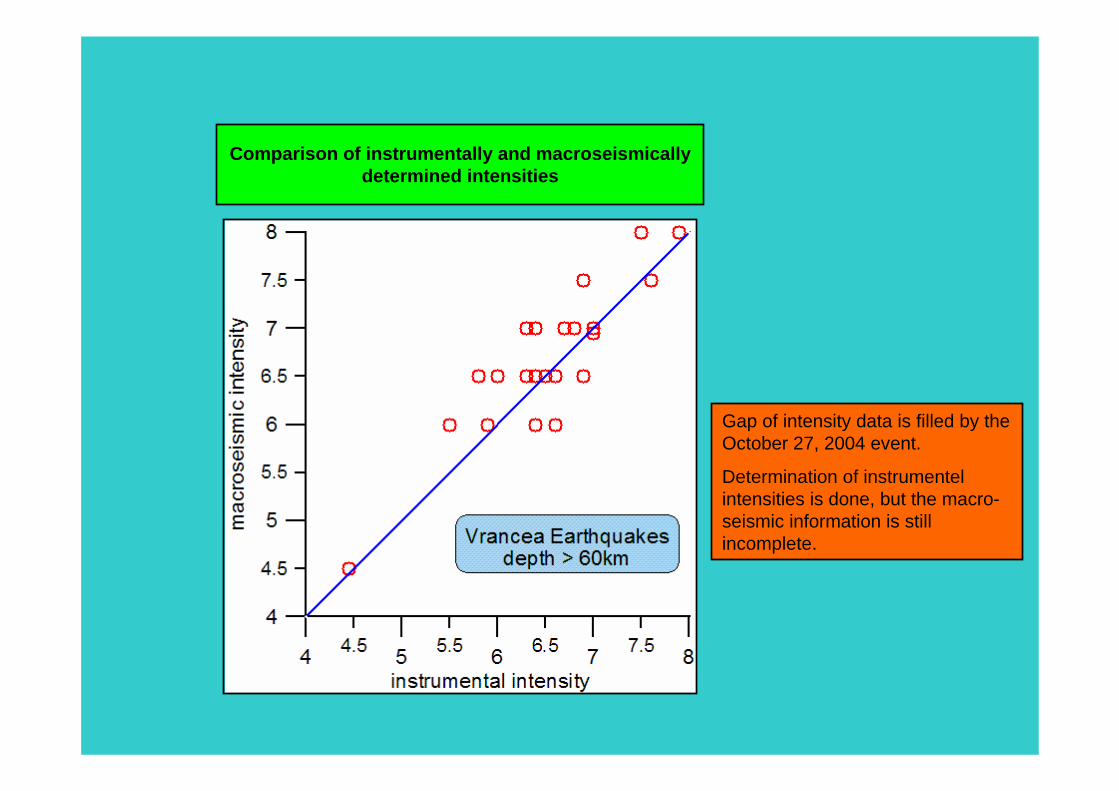
Comparison of instrumentally and macroseismically determined intensities
Gap of intensity data is filled by the October 27, 2004 event.
Determination of instrumentel intensities is done, but the macro-seismic information is still incomplete.

PGA - map of the Vrancea earthquake of October 27, 2004depth = 100 km, Mw = 5.9
Similarities with the 1977 Mw=7.4 event:
nearly same hypocenter, depth, faultplane solution;
same area of strongest ground shaking about 50-100km apart from the hypocenter.
However, the 2004 event was a `simple` event, whereas the 1977 event has been considered by various authors as a multiple event propagating pre-dominantly southwest wards.
Problem: source complexity versus variation of deep structure ??????

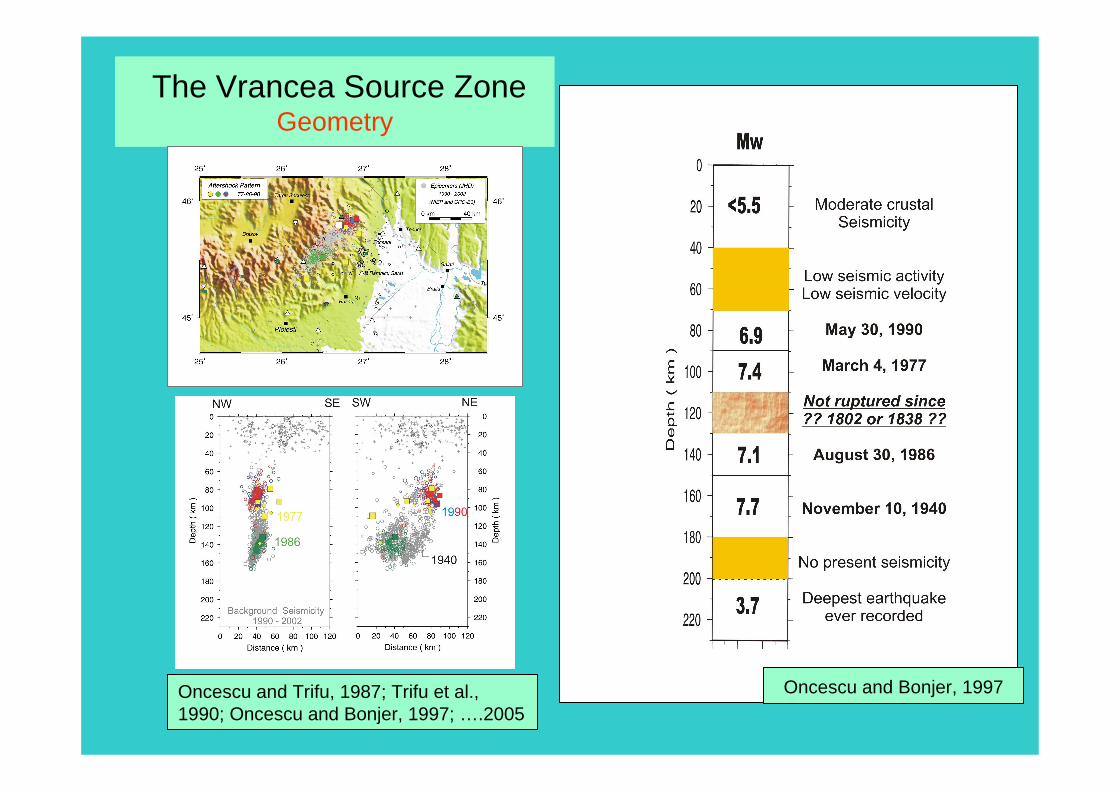
The Vrancea Source Zone Geometry
Oncescu and Bonjer, 1997Oncescu and Trifu, 1987; Trifu et al., 1990; Oncescu and Bonjer, 1997; ….2005
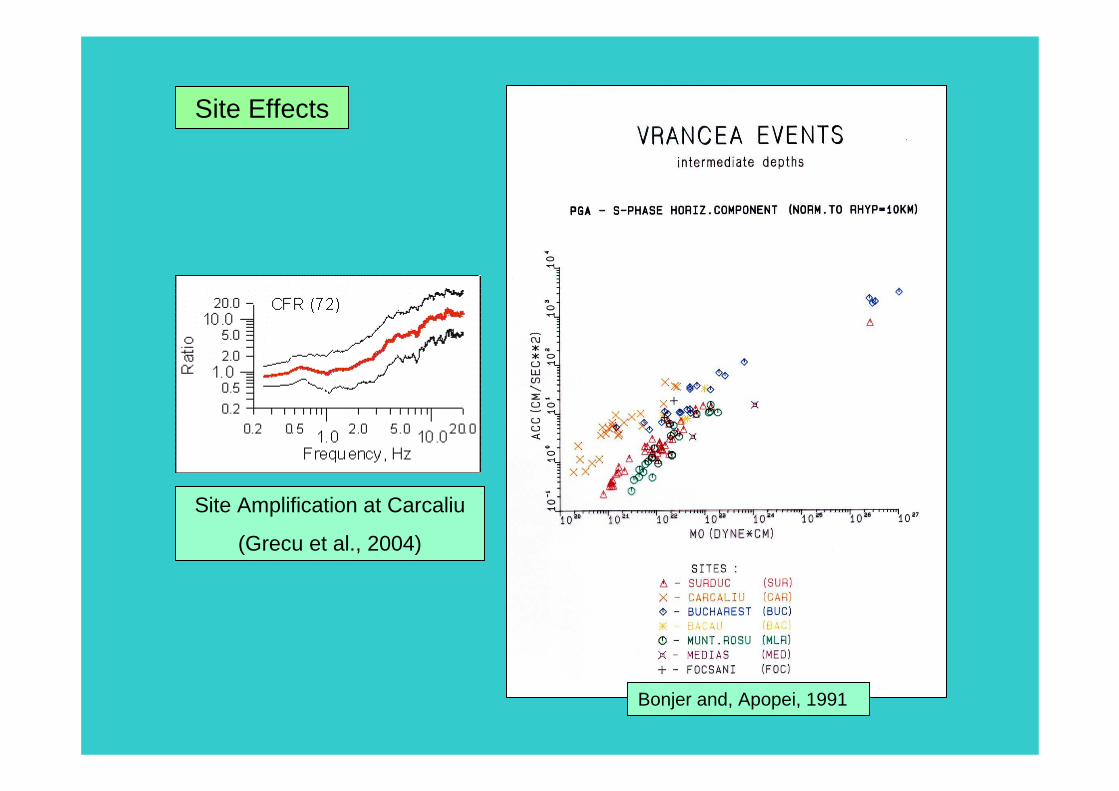
Site Effects
Site Amplification at Carcaliu
(Grecu et al., 2004)
Bonjer and, Apopei, 1991
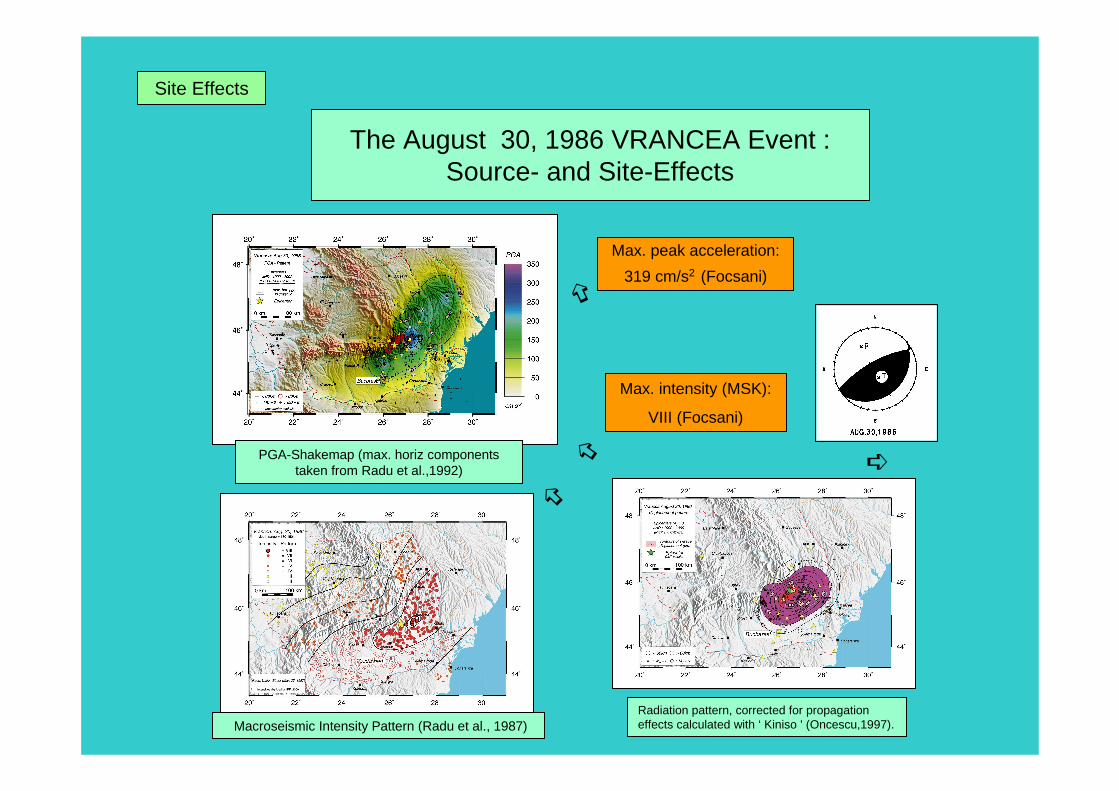
The August 30, 1986 VRANCEA Event : Source- and Site-Effects
PGA-Shakemap (max. horiz components taken from Radu et al.,1992)
Macroseismic Intensity Pattern (Radu et al., 1987)Radiation pattern, corrected for propagation effects calculated with ‘ Kiniso ' (Oncescu,1997).
➪
Max. peak acceleration:
319 cm/s2 (Focsani)
➪
Max. intensity (MSK):
VIII (Focsani)
➪
➪
Site Effects

Does the VHR ratio properly reflect the site response during strong
earthquakes, when it is evaluated from records of small earthquakes?
Where ever possible, we compared the site amplification
characteristics obtained from both, small and large earthquakes
Rock stations: mean amplitude amplification(black lines - small events; red lines - large events)

PGA - map of the Vrancea earthquake of October 27, 2004depth = 100 km, Mw = 5.9


