
Some pages of this thesis may have been removed for copyright restrictions.
If you have discovered material in Aston Research Explorer which is unlawful e.g. breaches copyright, (either yours or that of a third party) or any other law, including but not limited to those relating to patent, trademark, confidentiality, data protection, obscenity, defamation, libel, then please read our Takedown policy and contact the service immediately ([email protected])

[1]
Doctor of Philosophy
Aston University
Employee Social Responsibility:
Development of an ESR Measure and a Multi-Level Investigation
of Antecedent and Boundary Conditions
Nishat A Babu
September
2015
Nishat Babu asserts her moral right to be identified as the author of this thesis.
This copy of the thesis has been supplied on the condition that anyone who consults it is
understood to recognise that its copyright rests with its author and that no quotation from the
thesis, and no information derived from it, may be published without proper
acknowledgement.
Copyright © Nishat Babu, 2015

[2]
Aston University
|Doctor of Philosophy|
Employee Social Responsibility:
Development of an ESR Measure and a Multi-Level Investigation of Antecedent and
Boundary Conditions
Nishat A Babu
2015
Thesis Summary
The following thesis instigates the discussion on corporate social responsibility (CSR)
through a review of literature on the conceptualisation, determinants, and remunerations of
organisational CSR engagement. The case is made for the need to draw attention to the
micro-levels of CSR, and consequently focus on employee social responsibility at multiple
levels of analysis. In order to further research efforts in this area, the prerequisite of an
employee social responsibility behavioural measurement tool is acknowledged. Accordingly,
the subsequent chapters outline the process of scale development and validation, resulting in
a robust, reliable and valid employee social responsibility scale. This scale is then put to use
in a field study, and the noteworthy roles of the antecedent and boundary conditions of
transformational leadership, assigned CSR priority, and CSR climate are confirmed at the
group and individual level. Directionality of these relationships is subsequently alluded to in
a time-lagged investigation, set within a simulated business environment. The thesis collates
and discusses the contributions of the findings from the research series, which highlight a
consistent three-way interaction effect of transformational leadership, assigned CSR priority
and CSR climate. Specifically, efforts are made to outline various avenues for future
research, given the infancy of the micro-level study of employee social responsibility.
Keywords: Corporate social responsibility, micro-level, transformational leadership,
assigned priority, CSR climate
[3]
Acknowledgements
All praise and gratitude is for the Lord.
First and foremost, I would like to thank my supervisor Yves Guillaume for encouraging me
to embark upon this journey in the first instance, and secondly for his unfailing support
throughout these past few years. He has not only taught me the significance of conducting
rigorous research, but has also versed me on the importance of possessing integrity within my
work. I am forever grateful to him, for this thesis would not have materialised at a standard
that I am content with, without his help. I am also acutely aware that he has made efforts to
employ the various leadership and motivation theories with me in order to squeeze out my
full potential! Secondly, I would also like to thank my associate supervisor Geoff Thomas for
his words of wisdom along the way. I would additionally like to extend my gratitude towards
Claudia Sacramento and Paul Bocij, for their invaluable help during the Business Game
study. Furthermore, I would like to thank Steve Woods for his pragmatic advice when I
called upon it, and Joanne Lyubovnikova for reassuring me that this journey was both
possible and worthwhile. I would additionally like to thank Jenny, Vicki, and Zabin who have
always endeavoured to answer any queries I may have had, and have never objected to
providing whatever help they could. I am aware that there are various other individuals who
have helped me throughout my doctoral studies, in whatever way they could, and I would like
to thank them all for their input. A general thank you also to all those in the Work and
Organisational Psychology group who have truly created a positive and open learning
environment. A number of people have endured this tumultuous journey with me and have
helped to make it a positive experience. Without producing a long list of names, I would like
to thank all those doctoral students that I have had the pleasure of getting to know and have
shared many good times and conversations with. I would especially like to single out those
within the SW8005 office, whom I have had the joy of spending a considerable amount of
time with whilst working on this thesis: Fran, Alison, Manjusha, Safa, and Kristin. Thank you
for the many academic and non-academic conversations that have made working in a shared
office environment enjoyable. A special mention goes to Kristin who has endured the highs
and lows of the past four years with me, and with whom I have shared many memorable
moments. Likewise, I would like to thank all my friends outside of Aston University who
have supported me and have provided me with welcome distractions, as well as patiently
enduring my rants. These acknowledgements would be nowhere near complete without a
special reference to my family for their constant words of encouragement, humour, and
support, not only during the past few years of working on this thesis, but throughout my
academic career; you believed in me even when at times I doubted myself. Sabah do not
worry, this should be the last of it (wink)! Finally, I would like to thank my best friend, my
husband Furqan Aziz, for being my pillar of support, and in helping me to cross the
especially stressful last few hurdles.
Finally, I dedicate this thesis to my father, Mohammed Babu. Thank you for supporting me in
all my ventures in life, and for always instilling in me the importance of doing my best,
regardless of the consequent results. Accept this as a very small token for my appreciation for
all that you do, not only for me but for all of us.
[4]
Table of Contents
1. Chapter 1: Introduction to thesis ............................................................................. 16
1.1.Introduction ................................................................................................................. 16
1.2.Research objectives ..................................................................................................... 20
1.3.Summary of research series ......................................................................................... 21
1.4.Structure of thesis ........................................................................................................ 22
1.5.Chapter summary......................................................................................................... 23
2. Chapter 2: Literature Review .................................................................................. 24
2.1.Introduction ................................................................................................................. 24
2.2.Defining CSR .............................................................................................................. 24
2.3.Why CSR? ................................................................................................................... 26
2.3.1. Determinants of CSR ..................................................................................... 27
2.3.2. Financial benefits of CSR .............................................................................. 28
2.3.3. Market benefits of CSR ................................................................................. 29
2.3.4. Employee benefits of CSR ............................................................................ 30
2.4.Micro-level CSR .......................................................................................................... 31
2.4.1. Employee involvement in CSR ..................................................................... 32
2.4.2. Employee and group social responsibility (ESR) .......................................... 35
2.5.Predictors of ESR ........................................................................................................ 45
2.6.Leadership and ESR .................................................................................................... 47
2.6.1. Leadership and individual level outcomes .................................................... 48
2.6.2. Authentic leadership ...................................................................................... 49
2.6.3. Servant leadership ......................................................................................... 50
2.6.4. Ethical leadership .......................................................................................... 51
2.6.5. Responsible leadership .................................................................................. 52
2.6.6. Transformational leadership .......................................................................... 52

[5]
2.7.Mechanisms of leadership effectiveness ..................................................................... 55
2.7.1. Social exchange theory .................................................................................. 55
2.7.2. Social identity theory ..................................................................................... 56
2.7.3. Social learning theory .................................................................................... 58
2.7.4. Value congruence .......................................................................................... 59
2.7.5. Self-determination theory .............................................................................. 59
2.7.6. Regulatory focus theory ................................................................................ 60
2.7.7. Goal setting theory ........................................................................................ 62
2.8.Assigned CSR priority ................................................................................................. 64
2.9.CSR climate ................................................................................................................. 67
2.10.Summary .................................................................................................................. 70
3. Chapter 3: Model development ................................................................................ 71
3.1.Introduction ................................................................................................................. 71
3.2.Theory and hypotheses development .......................................................................... 73
3.2.1. Antecedents of ESR ...................................................................................... 73
3.2.2. Transformational leadership and ESR ........................................................... 74
3.2.3. Moderating role of assigned CSR priority ..................................................... 78
3.2.4. Moderating role of CSR climate .................................................................... 83
3.2.5. Interactive effects on ESR behaviours .......................................................... 86
3.3.Summary...................................................................................................................... 88
4. Chapter 4: Methodology and samples ..................................................................... 89
4.1.Introduction ................................................................................................................. 89
4.2.Philosophical and methodological approach ............................................................... 89
4.3.Levels of analysis ........................................................................................................ 92
4.4.Summary of research series ......................................................................................... 96
4.5.Study one: Scale development and validation ............................................................. 97
4.5.1. Research design ............................................................................................ 97

[6]
4.5.2. Sample .......................................................................................................... 98
4.5.3. Measures ....................................................................................................... 98
4.5.4. Ethics .......................................................................................................... 103
4.6.Study two: Field study (Company sample) ............................................................... 104
4.6.1. Research design .......................................................................................... 104
4.6.2. Sample ........................................................................................................ 104
4.6.3. Sample characteristics ................................................................................ 105
4.6.4. Procedure .................................................................................................... 105
4.6.5. Measures ..................................................................................................... 106
4.6.6. Data preparation ......................................................................................... 109
4.6.7. Dawson’s selection rate .............................................................................. 110
4.6.8. Ethics .......................................................................................................... 110
4.7.Study three: Time-lagged study (Business Game sample) ........................................ 111
4.7.1. Research design .......................................................................................... 111
4.7.2. Sample ........................................................................................................ 111
4.7.3. Sample characteristics ................................................................................ 114
4.7.4. Procedure .................................................................................................... 115
4.7.5. Measures ..................................................................................................... 117
4.7.6. Data preparation ......................................................................................... 119
4.7.7. Dawson’s selection rate .............................................................................. 121
4.7.8. Ethics .......................................................................................................... 121
4.8.Intervention study ...................................................................................................... 122
4.8.1. Research design .......................................................................................... 122
4.8.2. Procedure .................................................................................................... 124
4.8.3. Intervention design ..................................................................................... 125
4.8.4. CSR intervention ........................................................................................ 129
4.8.5. Virtual booster sessions .............................................................................. 130

[7]
4.9.Summary.................................................................................................................... 132
5. Chapter 5: Scale development and validation ...................................................... 133
5.1.Introduction ............................................................................................................... 133
5.1.1. Dimensional nature of ESR ........................................................................ 135
5.2.Semi-structured interviews ........................................................................................ 138
5.3.Scale development method ........................................................................................ 144
5.3.1. Item generation ........................................................................................... 144
5.3.2. Item reduction ............................................................................................. 146
5.4.Scale refinement and validation: Company sample .................................................. 150
5.4.1. Exploratory factor analysis ......................................................................... 150
5.4.2. Confirmatory factor analysis ...................................................................... 161
5.4.2.1. Assessing model fit ...................................................................... 162
5.4.2.2. Confirmatory factor analysis results ............................................ 164
5.4.3. Reliability analysis ...................................................................................... 170
5.4.4. Inter-factor correlations .............................................................................. 170
5.5.Scale validation: Business Game sample .................................................................. 172
5.5.1. Exploratory factor analysis: Leader-ratings ............................................... 172
5.5.2. Exploratory factor analysis: Team-member ratings ................................... 175
5.5.3. Confirmatory factor analysis ...................................................................... 179
5.5.4. Reliability analysis ..................................................................................... 181
5.5.5. Psychometric properties ............................................................................. 184
5.5.5.1. Inter-factor correlations ................................................................ 184
5.5.5.2. Convergent and discriminant validity .......................................... 187
5.5.5.3. Criterion validity .......................................................................... 194
5.6.Inter-item correlations .............................................................................................. 202
5.7.Aggregating to the group level .................................................................................. 203
5.8.Summary.................................................................................................................... 208

[8]
6. Chapter 6: Field study............................................................................................. 209
6.1.Introduction ............................................................................................................... 209
6.2.Measures .................................................................................................................... 211
6.3.Analytical strategy ..................................................................................................... 213
6.3.1. Group level analysis ................................................................................... 215
6.3.2. Individual level analysis ............................................................................. 219
6.3.2.1. Preliminary individual level analysis ........................................... 221
6.4.Results ....................................................................................................................... 223
6.4.1. Group level ................................................................................................. 223
6.4.2. Individual level ........................................................................................... 227
6.5.Discussion.................................................................................................................. 230
6.5.1. Summary of findings .................................................................................. 230
6.5.2. Theoretical contributions ............................................................................ 231
6.5.3. Limitations .................................................................................................. 235
6.5.4. Implications for practice ............................................................................. 237
6.6.Summary.................................................................................................................... 238
7. Chapter 7: Time-lagged study ................................................................................ 239
7.1.Introduction ............................................................................................................... 239
7.2.Hypotheses development ........................................................................................... 240
7.3.Procedure ................................................................................................................... 247
7.4.Analytical strategy ..................................................................................................... 249
7.4.1. Group level analysis ................................................................................... 251
7.4.2. Individual level analysis ............................................................................. 251
7.4.2.1. Preliminary individual level analysis ........................................... 252
7.5.Results ....................................................................................................................... 256
7.5.1. Group level ................................................................................................. 256
7.5.1.1. Controlling for time 1 ESR .......................................................... 262

[9]
7.5.2. Individual level ........................................................................................... 265
7.5.2.1. Leader-rated ESR as outcome ...................................................... 267
7.5.2.2. Peer 360° ratings of ESR as outcome ........................................... 269
7.5.2.3. Controlling for time 1 ESR .......................................................... 273
7.6.Discussion.................................................................................................................. 278
7.6.1. Summary of findings .................................................................................. 278
7.6.2. Theoretical contributions ............................................................................ 279
7.6.3. Limitations .................................................................................................. 283
7.6.4. Implications for practice ............................................................................. 284
7.7.Summary.................................................................................................................... 285
8. Chapter 8: Discussion.............................................................................................. 286
8.1.Introduction ............................................................................................................... 286
8.2.Overview of findings ................................................................................................. 286
8.3.Theoretical contributions ........................................................................................... 289
8.3.1. Scale development ...................................................................................... 289
8.3.2. Antecedent and boundary conditions ......................................................... 291
8.3.3. Time-lagged investigation .......................................................................... 295
8.3.4. Goal-setting theory ..................................................................................... 299
8.4.Limitations ................................................................................................................. 301
8.4.1. Sample size ................................................................................................. 301
8.4.2. Causality ..................................................................................................... 302
8.4.3. Nature of sample ......................................................................................... 303
8.4.4. Rescaling predictors ................................................................................... 305
8.5.Implications for practice ............................................................................................ 305
8.6.Future research directions.......................................................................................... 308
8.6.1. Mechanisms of ESR ................................................................................... 309
8.6.2. Real versus pseudo-teams ........................................................................... 311

[10]
8.6.3. Outcomes of ESR ....................................................................................... 312
8.6.4. Specifying time lags ................................................................................... 313
8.6.5. Individual differences ................................................................................. 313
8.6.6. Dark side of ESR ........................................................................................ 315
8.7.Summary.................................................................................................................... 317
9. Chapter 9: Conclusion ............................................................................................ 318
10. References ................................................................................................................ 320
11. Appendices ............................................................................................................... 365

[11]
List of Figures
Figure 3.01: Proposed conceptual model ............................................................................. 78
Figure 5.01: Final five factor model: Company sample – leader ratings .......................... 168
Figure 5.02: Final five factor model: Company sample – team member self-ratings ...... 169
Figure 6.01: Proposed conceptual model ........................................................................... 209
Figure 6.02: Statistical model for Hypothesis 1a: Field study ........................................... 216
Figure 6.03: Statistical model for Hypothesis 2a: Field study ........................................... 217
Figure 6.04: Statistical model for Hypothesis 3a: Field study ........................................... 218
Figure 6.05: Three-way interaction effect at the group level ............................................ 226
Figure 6.06: Individual level: Moderating effect of assigned CSR priority ...................... 229
Figure 7.01: Proposed time-lagged conceptual model....................................................... 243
Figure 7.02: Moderating effect of CSR climate on group ESR at time 2 .......................... 258
Figure 7.03: Moderating effect of CSR climate on group ESR at time 3 .......................... 259
Figure 7.04: Three-way interaction effect on group ESR at time 2 ................................... 260
Figure 7.05: Three-way interaction effect on group ESR at time 2 (time 1 ESR controlled)
........................................................................................................................................... 263
Figure 7.06: Moderating effect of CSR climate on time 2 individual ESR ....................... 269
Figure 7.07: Moderating effect of CSR climate on time 3 individual ESR ....................... 270
Figure 7.08: Three-way interaction effect on time 2 individual ESR ................................ 271
Figure 7.09: Three-way interaction effect on time 2 individual ESR (time 1 individual ESR
controlled) .......................................................................................................................... 277
Figure 8.01: The MCC curve ............................................................................................. 298
Figure A8.01: Instructions to subject-matter experts ......................................................... 394
Figure A8.02: Example of a completed form by a subject-matter expert .......................... 395
Figure A9.01: CFA model for leader-ratings – Time 1 ..................................................... 396
Figure A9.02: CFA model for leader-ratings – Time 2 ..................................................... 397
Figure A9.03: CFA model for leader-ratings – Time 3 ..................................................... 398
Figure A9.04: CFA model for team member ratings – Time 1 ......................................... 399
Figure A9.05: CFA model for team member ratings – Time 2 ......................................... 400
Figure A9.06: CFA model for team member ratings – Time 3 ......................................... 401

[12]
List of Tables
Table 2.01: Existing measures of ESR ................................................................................ 41
Table 4.01: Team effectiveness: Time 1 EFA ................................................................... 101
Table 4.02: Team effectiveness: Time 2 EFA ................................................................... 101
Table 4.03: Team effectiveness: Time 3 EFA ................................................................... 102
Table 4.04: Reliability: Team effectiveness scale ............................................................. 103
Table 4.05: Measurement schedule: Field study ............................................................... 106
Table 4.06: Measurement schedule: Time-lagged study ................................................... 116
Table 4.07: Structure of switching-replication intervention design .................................. 124
Table 4.08: Workshop schedule......................................................................................... 127
Table 5.01: Interviewee sample characteristics ................................................................. 139
Table 5.02: Preliminary scale items and item codes .......................................................... 148
Table 5.03: EFA results: Company sample with leader ratings at stage 1 (initial 32 item
scale) .................................................................................................................................. 154
Table 5.04: EFA results: Company sample with leader ratings at stage 2 (reduced 15-item
scale) .................................................................................................................................. 156
Table 5.05: EFA results: Company sample with team-member self-ratings at stage 1 (initial
32 item scale) ..................................................................................................................... 158
Table 5.06: EFA results: Company sample with team member self-ratings at stage 2
(reduced 15 item scale) ...................................................................................................... 160
Table 5.07: Final ESR scale ............................................................................................... 165
Table 5.08: CFA results for company sample: Leader and team-member ratings ............ 167
Table 5.09: Reliability and Pearson correlation coefficients: Company sample ............... 170
Table 5.10: Inter-factor correlations: Company sample (leader-ratings) .......................... 171
Table 5.11: Inter-factor correlations: Company sample (team member self-ratings) ........ 171
Table 5.12: EFA results: BG sample with leader ratings (Time 1) ................................... 173
Table 5.13: EFA results: BG sample with leader ratings (Time 2) ................................... 174
Table 5.14: EFA results: BG sample with leader ratings (Time 3) ................................... 175
Table 5.15: EFA results: BG sample with team member ratings (Time 1) ....................... 176
Table 5.16: EFA results: BG sample with team member ratings (Time 2) ....................... 177
Table 5.17: EFA results: BG sample with team member ratings (Time 3) ....................... 178
Table 5.18: CFA results: BG sample with leader ratings .................................................. 180

[13]
Table 5.19: CFA results: BG sample with team member ratings ...................................... 182
Table 5.20: Reliability and Pearson correlation coefficients: BG sample ......................... 183
Table 5.21: Inter-factor correlations: BG sample with leader ratings .............................. 185
Table 5.22: Inter-factor correlations: BG sample with team-member ratings .................. 186
Table 5.23: Convergent and discriminant validity: BG sample with leader ratings of ESR
(Time 1) ............................................................................................................................ 190
Table 5.24: Convergent and discriminant validity: BG sample with leader ratings of ESR
(Time 3) ............................................................................................................................ 191
Table 5.25: Convergent and discriminant validity: BG sample with team-member ratings of
ESR(Time 1) ..................................................................................................................... 192
Table 5.26: Convergent and discriminant validity: BG sample with team-member ratings of
ESR(Time 3) ..................................................................................................................... 193
Table 5.27: Concurrent validity: BG sample – leader rated ESR (Time 1) ....................... 195
Table 5.28: Concurrent validity: BG sample – leader rated ESR (Time 3) ....................... 195
Table 5.29: Concurrent validity: BG sample – team member rated ESR (Time 1) ........... 196
Table 5.30: Concurrent validity: BG sample – team member rated ESR (Time 3) ........... 196
Table 5.31: Predictive validity: BG sample – leader rated ESR ........................................ 198
Table 5.32: Predictive validity: BG sample – team member rated ESR ............................ 199
Table 5.33: Predictive validity: BG sample – leader rated ESR (group level) .................. 200
Table 5.34: Predictive validity: BG sample – team member rated ESR (group level) ...... 201
Table 5.35: Inter-rater reliability coefficients and intra-class correlations for the company
sample – Leader ratings of ESR ........................................................................................ 204
Table 5.36: Inter-rater reliability coefficients and intra-class correlations for the company
sample – Team member self-ratings of ESR ..................................................................... 205
Table 5.37: Inter-rater reliability coefficients and intra-class correlations for the BG sample
– Leader ratings of ESR ..................................................................................................... 206
Table 5.38: Inter-rater reliability coefficients and intra-class correlations for the BG sample
– Team member ratings of ESR ......................................................................................... 207
Table 6.01: Outline of hypotheses: Field study ................................................................. 210
Table 6.02: Inter-rater reliability statistics and intra-class correlations: Field study......... 214
Table 6.03: Group level analysis: Means, standard deviations, and bivariate correlations
.......................................................................................................................................... .223
Table 6.04: Group level hypotheses testing: Leader-rated ESR ........................................ 224
Table 6.05: Simple slope analysis for the three-way interaction at the group level .......... 225
Table 6.06: Individual level analysis: Means, standard deviations, and bivariate correlations
........................................................................................................................................... 227

[14]
Table 6.07: Individual level hypotheses testing: Leader-rated ESR .................................. 228
Table 7.01: Inter-rater reliability coefficients and intra-class correlations: Time-lagged
study ................................................................................................................................... 250
Table 7.02: Comparing model fit of null and unconditional models: Time-lagged study
......................................................................................................................................... ..253
Table 7.03: Comparing model fit of TF at random models for leader-ratings .................. 254
Table 7.04: Group level analysis: Means, standard deviations, and bivariate correlations
.......................................................................................................................................... .257
Table 7.05: Group level hypotheses testing with leader-ratings of ESR ........................... 261
Table 7.06: Simple slope analysis for the three-way interaction – Time 2 group ESR ..... 262
Table 7.07: Group level hypotheses testing: Leader-rated ESR (Time 1 ESR controlled)
.......................................................................................................................................... .264
Table 7.08: Simple slope analysis for the three-way interaction – Time 2 group ESR (Time
1 group ESR controlled) .................................................................................................... 265
Table 7.09: Individual level analysis: Means, standard deviations, and bivariate correlations
........................................................................................................................................... 266
Table 7.10: Cross-level hypotheses testing with leader ratings of ESR ............................ 268
Table 7.11: Cross-level hypotheses testing with 360° peer ratings of ESR ...................... 272
Table 7.12: Simple slope analysis for the three-way interaction – Time 2 individual ESR
(Peer-rated) ........................................................................................................................ 273
Table 7.13: Cross-level hypotheses testing with leader ratings of ESR (Time 1 ESR
controlled) .......................................................................................................................... 274
Table 7.14: Cross-level hypotheses testing with peer 360° ratings of ESR (Time 1 ESR
controlled) .......................................................................................................................... 276
Table 7.15: Simple slope analysis for the three-way interaction – Time 2 individual ESR
(Peer-rated: Time 1 ESR controlled) ................................................................................. 277
Table 8.01: Summary of findings ...................................................................................... 288
Table A7.01: Initial item pool............................................................................................ 391
Table A10.01: Inter-item correlations for company sample-leader ratings ....................... 402
Table A10.02: Inter-item correlations for company sample-team member self-ratings.... 403
Table A10.03: Inter-item correlations for BG sample-leader ratings Time 1 ................... 404
Table A10.04: Inter-item correlations for BG sample-leader ratings Time 2 ................... 405
Table A10.05: Inter-item correlations for BG sample-leader ratings Time 3 ................... 406
Table A10.06: Inter-item correlations for BG sample-team member ratings Time 1 ....... 407
Table A10.07: Inter-item correlations for BG sample-team member ratings Time 2 ....... 408
Table A10.08: Inter-item correlations for BG sample-team member ratings Time 3 ....... 409

[15]
Appendices
Appendix 1: Company sample: Leader questionnaire ....................................................... 365
Appendix 2: Company sample: Team member questionnaire ........................................... 369
Appendix 3: Business Game sample: Tutor questionnaire ................................................ 374
Appendix 4: Business Game sample: Leader (i.e. Managing Director) questionnaire ...... 375
Appendix 5: Business Game sample: Team member questionnaire .................................. 381
Appendix 6: Interview script ............................................................................................. 386
Appendix 7: Initial item pool ............................................................................................. 391
Appendix 8: Subject-matter expert ratings: Excel template .............................................. 394
Appendix 9: CFA models: BG sample .............................................................................. 396
Appendix 10: Inter-item correlations ................................................................................. 402

[16]
Chapter 1: Introduction to Thesis
1.1.Introduction
Friedman’s initial statement in the New York Times Magazine in 1970 that “the social
responsibility of business is to increase its profits” is considered archaic in today’s 21st
century commercial environment. Instead, proclamations from prolific business leaders that
“businesses need to go beyond the interests of their companies to the communities they
serve” are holding more sway (Ratan Tata; the Tata group). This act of placing focus on the
communities affected by an organisation’s operations forms part of what is now commonly
referred to as corporate social responsibility (CSR); defined as “context-specific
organisational actions and policies that take into account stakeholders’ expectations and the
triple bottom line of economic, social, and environmental performance” (Aguinis, 2011, pg.
855). However engaging in corporate social responsibility (CSR) is not merely a futile
exercise into the squandering of valuable organisational resources, rather organisations are
also set to benefit from the various strategic and financial outcomes that arise from CSR
engagement. Indeed, in his recent book, ‘Screw Business as Usual’, Richard Branson argued
that the time now is ripe “…to explore this great new frontier where the boundaries between
work and purpose are merging into one, where doing good, really is [italics in original] good
for business” (2013; pg. 1).
For instance, research on CSR has shown that CSR can significantly and positively impact
upon an organisation’s financial health (Rodgers, Choy, and Guiral, 2013). More specifically,
such benefits are greater when an organisation’s CSR activities are strategically aligned,
consequently leading to superior financial performance (Michelon, Boesso, and Kumar,
2013). Organisational engagement in effective CSR can further have knock-on effects on
perceived corporate reputation, consumer purchase likelihood, and consumer long-term
loyalty (e.g. Du, Bhattacharya, and Sen, 2007).
Not only this, but an organisation’s CSR efforts additionally have demonstrably positive
effects on their employees. An organisation that is active in CSR can lead to positive
employee outcomes such as, but not limited to, increased employee commitment and
identification (Ali, Ur Rehman, Ali, Yousaf, and Zia, 2010; Glavas and Godwin, 2013; Kim,
Lee, Lee, and Kim, 2010), satisfaction and well-being (Bauman and Skitka, 2013),

[17]
organisational citizenship behaviours, reduced counterproductive behaviours (Evans,
Goodman, and Davis, 2010), and reduced turnover (Hansen, Dunford, Boss, and Boss, 2011).
Given the above, it therefore makes good sense for today’s organisation’s to be active
participants in CSR.
What research however has neglected to attend to is the way in which employees themselves
can enact social responsibility through their work activities. Indeed, Rupp and Mallory (2015)
consider this to be surprising given that employees “…plan for, participate in, and witness
CSR” (pg. 212). Similarly, Collier and Esteban (2007) state that, “the effective delivery of
corporate social and environmental responsibility initiatives is dependent on employee
responsiveness”. Aguinis and Glavas (2012) corroborated this deficiency in noting that at the
time of their review, only 4% of the research on CSR had concentrated on CSR at the micro-
level. More recently, Gond, El Akremi, Swaen, and Babu (working paper) have shown that
since 2011, 117 papers have been published in micro-CSR, compared to only 58 published
from 1991 to 2010. As a result, whilst the tide may be changing and greater focus is being
placed on micro-level CSR, there is great distance yet to be traversed before we can develop
a comprehensive understanding of micro-level CSR, specifically employee engagement in
CSR; what this thesis terms employee social responsibility (ESR) behaviours.
Encouraging ESR is beneficial, especially as a form of social capital which can further serve
to benefit the company through building business-community relations (Muthuri, Matten, and
Moon, 2009). Not only can employee volunteering efforts, considered a type of employee
social responsibility behaviour, lead to positive public perceptions of the organisation as well
as good community relations; effective volunteering placements can enhance work-related
skills, increase employee engagement at work, and increase the likelihood of further
volunteering efforts (Booth, Won Park, and Glomb, 2009; Caligiuri, Mencin, and Jiang,
2013). Other ESR behaviours, such as charitable giving, can further foster employee
commitment by triggering pro-social sense-making (Grant, Dutton, and Rosso, 2008).
Despite these benefits, surprisingly little is known about how ESR can be harnessed. Indeed,
research has evidenced that employees within the organisation tend to be little aware of its
CSR efforts (Bhattacharya, Korschun, and Sen, 2009), and even when cognizant of them, few
employees are actively involved in such efforts (Stancu, Grigore, and Rosca, 2011). Apart
from the small research contribution in ESR, through for example the focus on narrow sub-
facets such as employee volunteering, given that employee social responsibility is of crucial

[18]
significance, there seems to be a contradictory dearth of research in the area. Some efforts
have been made to understand ways in which ESR can be fostered, although these primarily
tend to be in the form of theoretical literature, which for example speculate upon the possible
factors that could influence employee perceptions of organisational CSR, their reactions to
CSR, and how they themselves can engage in CSR (e.g. Unsworth, Dmitrieva, and Adriasola,
2013).
Employees are the active participants within the organisation, and they translate the
organisational strategy into action through their day to day activities (Rupp and Mallory,
2015). They can determine if they complete their work activities in an environmentally
friendly manner, participate in and/or organize charitable events, go out of their way to
support colleagues, and be engaged within their local community. Active employee
involvement seems therefore key in how organisations embed social responsibility within the
organisation, and pool the external efforts of the company with the internal functioning
(Aguinis and Glavas, 2013). Accordingly the question arises as to how we can encourage
both awareness of, and engagement within the organisation’s CSR efforts, thus supporting
and furthering an organisation’s social responsibility agenda. In doing so, we can start to
understand the way in which those individuals and teams that compose the organisations, can
become active participants of ESR in the workplace.
To understand the ways in which employees can incorporate CSR into their roles and how
this is initiated in their work activities, we need to elucidate a taxonomy which outlines how
ESR is behaviourally manifested. In order to do this, the following thesis draws upon the five
dimensions of social responsibility, namely social, philanthropy, stakeholder, environmental,
and economic; as identified by Dahlsrud (2008) and corroborated by Rupp and Mallory
(2015). Given this multi-dimensional nature of ESR behaviours, an important issue brought
to the forefront is the inherent conflicting nature of the behaviours within these various
dimensions (e.g. Aguilera, Rupp, Williams, and Ganapathi, 2007). For instance, on the one
hand, employees are required to be efficient in their work (economic), whilst on the other
hand they are requested to engage in voluntary behaviours (social and philanthropy).
The goal-setting theory (e.g. Locke and Latham, 2002) is stipulated as the guiding theoretical
framework in the proposed thesis. This theory proposes that effectively set goals have a
directive and energising effect on employees, engendering persistence as well as the arousal
of task-relevant knowledge and skills. Not only is it one of the most validated and reliable

[19]
theories of employee motivation available, but crucially, it takes into account the role of
possible conflict between goals, and how this can undermine performance. Given the inherent
conflict proposed within the multi-dimensional ESR construct, this theory proposes that
conducive contextual conditions need to be in place, in order to firstly set effective goals that
motivate employees’ goal-directed efforts towards these ESR behaviours, and secondly to
ameliorate the possible conflict that could arise between such goals. Here, the combinative
roles of leadership, assigned CSR priority and CSR climate are proposed, as a resolution for
this conundrum. By building upon goal-setting theory, it is suggested that these presumed
antecedent and boundary conditions of ESR, facilitate ESR by setting challenging goals that
place focus on the full ESR spectrum, motivating, inspiring and supporting employee goal-
directed efforts, and ensuring a high priority is assigned to CSR. Furthermore, they ensure
that the organisation makes CSR salient within its policies, procedures, and practices, so that
a consistent message of the value of CSR is reverberated throughout the organisation. As a
result, employees are aware of CSR in their day-to-day activities and the importance of the
various dimensions equivocally, as well as being sentient of the value of CSR to the
organisation, thus precluding goal-conflict.
An effective means to resolve such contradicting demands and successfully implementing
ESR at the individual and group level is argued to be leadership, in particularly
transformational leadership (TF) (Bass, 1990). TF has been linked to various positive
employee outcomes as evidenced by meta-analyses (e.g. Judge and Piccolo, 2004; Lowe,
Kroeck, and Sivasubramaniam, 1996). Additionally, TF has been highlighted to be effective
in balancing conflicting demands, especially in the safety literature where the concern is over
allying the demands of efficiency with the importance of safety (Zohar, 2010). It is reasoned
that TF will facilitate ESR by way of setting challenging and specific goals, and motivating
and supporting employee effort towards these goals (Locke and Latham, 2002).
However what is not apparent is how the value-free leadership behaviours of TF can direct
employees towards the values of social responsibility (Fu, Tsui, Liu, and Li, 2010). Here the
novel role of assigned CSR priority, modelled on Zohar’s (2002a) assigned safety priority, is
put forward. Zohar (2002a) evidenced the moderating function of assigned safety priority on
the effects of leadership behaviours on subsequent safety performance. Likewise, it is
expected that assigned CSR priority will wield its effects similarly, by providing a CSR focus
to leadership behaviours, which consequently exerts beneficial effects on ESR performance.

[20]
Finally, it is argued that TF with a high assigned CSR priority alone is not sufficient in
stifling behavioural conflict in employees. This is so, because if environmental conditions for
instance are not conducive to CSR, this could still engender conflict. As a result, the
necessary role of a CSR climate is introduced. Interactively, it is argued that TF, with a high
assigned CSR priority, operating under conditions of a positive CSR climate, provide optimal
conditions for ESR. They do this collectively by communicating a consistent message
regarding the importance of CSR, and thus minimizing the experience of goal conflict in
employees.
1.2.Research objectives
The present thesis endeavours to address the following research objectives:
1. Develop a definition and taxonomy of behaviours of employee social responsibility:
first and foremost, before we can begin to investigate the determinants of ESR, a fully
encompassing typology of ESR behaviours needs to be confirmed.
2. Develop and validate a scale of employee social responsibility: after having
developed the taxonomy of ESR behaviours, the next objective is to develop and
validate a scale to measure the various behaviours of ESR, which can then be used to
test for the antecedent and boundary conditions of ESR.
3. Develop a model of the antecedent and boundary conditions of employee social
responsibility: using theory, the thesis will attempt to develop a model centred on
ESR, specifically the predictors of ESR. Goal-setting theory will be used to identify
the utility of the antecedents of transformational leadership, and boundary conditions
of assigned CSR priority, and CSR climate of ESR at the group and individual levels,
in a multi-level model.
4. Provide a preliminary test for the model: the next objective is to provide a preliminary
test for the relationships proposed in the conceptual model. More specifically, to
elucidate the moderating roles of assigned CSR priority and CSR climate, individually
and in conjunction with one another, on the effects of TF on ESR, both at the group
and individual levels.
5. Ascertain the direction of relationships in a time-lagged study: finally, having
provided a preliminary test for the predictors of ESR in the field study, the next

[21]
objective is to examine the direction in which the relationships subsist. The
directionality of relationships will be determined by investigating the effects of time
one predictors, on time two and three ESR behaviours. Furthermore, ESR at time one
will be controlled, in order to assess if ESR behaviours increase positively over time.
1.3.Summary of research series
This thesis endeavours to test these research objectives through a research series combining
three studies:
Scale development and validation – before the factors that can facilitate ESR can be
examined; a scale to measure ESR is needed. The scale development and validation chapter
will outline this process of developing a five-faceted multi-dimensional ESR scale. Forty
qualitative interviews, with employed individuals from various occupational backgrounds,
will be conducted in order to develop the initial item pool for the scale, subsequently refined
through subject-matter expert ratings to ensure content validity. Following this, the scale will
be validated in two predominant samples. Firstly the scale will be validated in an
organisational sample with 32 teams, from the professional financial services sector and
commercial banking sector. It will then be again validated with a time-lagged simulated
Business Game sample consisting of 67 teams to further ensure robustness, confirm the ESR
scale’s factor structure, and explore its psychometric properties.
Field study – The field study, using a multilevel sample of team members nested within
teams, will provide a preliminary test for the proposed hypotheses in a cross-sectional design.
More specifically, the moderating effects of assigned CSR priority and CSR climate, both
interactively and individually, on the effects of TF on ESR will be investigated; both at the
group and individual levels.
Time lagged study – Finally, in order to explore the direction of effects of the proposed
relationships, as well as replicate the model in a larger multi-level sample; the time-lagged
study will be conducted. Here the same propositions will be tested in a multi-level sample set
within a simulated business game context, over a seven week period. The effects of predictors
at time one on subsequent ESR, measured at time two and three will be investigated.

[22]
Furthermore, in order to assess for a change in ESR behaviours over time, time 1 ESR will be
controlled, in order to establish if the relationships remain significant.
1.4.Structure of thesis
Given the above research objectives, the thesis will be structured in order to systematically
address these. After having introduced the research in this chapter (one), the following
chapter two will provide background knowledge on CSR, and briefly make the case for why
CSR makes good business sense. Following this, the review will specifically hone into micro-
level CSR and explore the research that has focused on employee outcomes of CSR, as well
as employee engagement in social responsibility, to date. The case will be made for why a
measurement tool is needed to measure employee social responsibility, as well as explore the
underlying theoretical framework and proposed predictors of ESR.
In chapter three, the predictive role of transformational leadership, and the moderating roles
of assigned CSR priority and CSR climate will be outlined. Using goal-setting theory, the
case will be made for why these predictors, especially when combined, facilitate ESR at the
group and individual level. Hypotheses will be developed accordingly. Subsequent to this
chapter, chapter four will outline the philosophical approach adopted in the current thesis, as
well as provide an overview of the three studies; the scale development and validation study,
the field study, and the time-lagged study. Furthermore, the research design, samples, and
procedures will be outlined for these studies. In due course, attention will also be paid to
levels of analysis issues, given that the thesis approaches ESR from a multi-level perspective.
Chapter five will provide an in-depth commentary on the development and validation
processes concerning the ESR scale. Specifically, the interviews leading up to item
generation will be outlined, followed by a test of content validity to refine the initial item
pool. The reduced scale will be validated in two samples, consequently confirming the scale’s
factor structure, finalising the resultant items in the scale, and establishing the scale’s
psychometric properties. Having developed the scale, this will be initially utilised in the field-
study in chapter six, in order to provide a preliminary test for the relationships put forward in
the conceptual model, concerning the effects of transformational leadership, assigned CSR
priority, and CSR climate on ESR. Here the analytical strategy will be described, and
discussion of findings will be presented.

[23]
An ancillary aim is to also establish the directionality of the proposed relationships, and this
will be done in chapter seven. The effects of time one predictors on subsequent ESR
measured at time two and three will be explored. Furthermore, by controlling for time one
ESR in additional analyses, changes in ESR over time will be determined. Subsequently, the
thesis will draw to a conclusion with a general discussion in chapter eight, which attempts to
collate the findings from the research series and attempts to develop a coherent commentary,
in which theoretical contributions, practical implications, future research directions, and
limitations of the research series are outlined. The thesis will end with a conclusive summary
in chapter nine.
1.5.Summary
This chapter has provided an introduction into CSR in general, and ESR more specifically.
Moreover, the postulated antecedents of ESR have been briefly mentioned. The research
objectives of this thesis have been outlined, and a summary is provided of the research series
forming the core of this thesis, which will endeavour to address the proposed hypotheses.
Finally the structure of the thesis is delineated in order to more effectively guide the reader in
navigating this thesis.

[24]
Chapter 2: Literature Review
2.1.Introduction
This chapter will introduce the reader to the research on corporate social responsibility
(CSR), at the more macro-levels briefly, and employee social responsibility (ESR); a term
coined to refer to micro-level social responsibility, more specifically. Firstly, the chapter will
acquaint the reader with the benefits of engaging in CSR and ESR, at the macro and micro
levels respectively. Current research in ESR will be outlined, and subsequently, the case will
be made for the necessity of an ESR behavioural measure. Finally, the proposed antecedents
of ESR will be explored, as well as the underlying theoretical framework underpinning them.
The ensuing dialogue will lay the groundwork on the current state of research in CSR, in
order to ease the reader into the next chapter (chapter three) in which the conceptual model is
developed concerning the antecedents and boundary conditions of ESR at the group and
individual levels.
2.2.Defining CSR
Traditionally, CSR is viewed through the lens of stakeholder theory (Freeman, 1984). This
theory outlines CSR as the fulfilment of an organisation’s obligations to various internal (e.g.
employees) and external (e.g. consumers) stakeholders. According to Freeman, stakeholders
are defined as “any group or individual who can affect or is affected by the achievement of
the organisation's objectives” (1984: pg. 46). In order to bring clarity to this somewhat
ambiguous definition, Mitchell, Agle, and Wood (1997) developed a theory of stakeholder
identification in which they proposed a typology of stakeholders consisting of the dimensions
of power, legitimacy, and urgency in order to more capably identify the most significant
stakeholders to a specific organisation. In most, if not all cases, the definitions surrounding
CSR focus on the way in which CSR attempts to meet the needs of various stakeholders.
Christensen, Mackey, and Whetten (2014) highlight the definitional issues surrounding CSR,
with many different attempts to conceptualise CSR existing in tandem. In order to address the
criticism that CSR is a concept that although widely discussed is very much abstract (Boal
and Peery, 1985); many have set out to more accurately conceptualise CSR. For example
McWilliams and Siegel (2001: pg. 117) define CSR as “actions that appear to further some
[25]
social good, beyond the interests of the firm and that which is required by law.” Comparable
to this, the World Business Council for Sustainable Development view CSR as “...the
continuing commitment by business to behave ethically and contribute to economic
development, while improving the quality of life of the workforce and their families as of the
local community at large” (Watts, Holme, and Tinto, 1998). Indeed, many also refer to CSR
as the triple bottom line of ‘people, planet, and profit’ (Elkington, 1999).
One of the most commonly adopted definitions of CSR is that proposed by Carroll (1979)
which states that “the social responsibility of business encompasses the economic, legal,
ethical and discretionary expectations that society has of organisations” (pg. 500).
Subsequently, Carroll (1991) outlined the facets of philanthropy (desired), ethicality
(expected), economic, and legal (both required). More recently, Carroll and Buchholtz (2014:
pg.32) defined CSR as the “economic, legal, ethical, and discretionary (philanthropic)
expectations that society has of organisations at a given time”. This focus on the multi-
faceted nature of CSR is echoed by additional authors such as Geva (2008), who discusses
the facets of philanthropy, ethical (‘good corporate citizen’), legal (‘obey law’), and
economic (‘make profit’) (see also Almeida and Sobral, 2010).
Nevertheless, there are a number of definitions, and they all take a differential focus as to
what CSR is. Christensen et al. (2014), in an attempt to typify the various definitions, suggest
either altruistic or instrumentally focused definitions. The instrumentally focused definitions
see CSR as providing a strategic benefit to the organisation (e.g. Porter and Kramer, 2006);
whilst the altruistic focused definitions define CSR as that which leads to some greater social
good (Waldman, Siegel, and Javidan, 2006). Nevertheless, it should be acknowledged that
CSR may be engaged in for both altruistic value, whilst expecting some instrumental gain for
the organisation (Christensen et al., 2014), therefore the focuses should not be seen as
mutually exclusive.
More conclusively, Dahlsrud (2008) reviewed the frequently cited CSR definitions and
concluded that the definitions tended to agree on a number of dimensions of CSR. These
included the environmental, social, stakeholder, economic, and voluntariness dimensions. He
defined the environmental dimension as behaviours targeting the protection of the natural
environment, whilst the stakeholder dimension was defined as the organisation’s actions
towards stakeholders and stakeholder groups, and the actions in the economic dimension
were those which defined CSR as a business operation. Finally the social dimension targeted

[26]
the relationship between the organisation and society, whilst the voluntariness dimension
consisted of actions not required by the law, which were ‘based on ethical values’, for
example (pg. 4).
What is noteworthy is that these CSR behaviours have to go beyond the legal jurisdiction of
the country. For instance, not discriminating against ethnic minorities in selection procedures
is abiding by the equal opportunity act (2010) in the EU, and not considered a socially
responsible act (McWilliams and Siegel, 2001). This argument therefore negates the ‘legal’
dimension originally proposed by Carroll (1991), and based on this valid argumentation, it is
thus also considered redundant within this thesis. Rupp and Mallory (2015) also advise that
these five dimensions be borne in mind when defining CSR, in order to reach a mutual
agreement on its conceptualisation.
Given the multitude of definitions of CSR available, in order to avoid confusion, in the
current research it is defined by Aguinis (2011; pg. 855) as “context-specific organisational
actions and policies that take into account stakeholders’ expectations and the triple bottom
line of economic, social, and environmental performance”. As can be seen from this
definition, the organisation’s CSR actions and policies are seen to address various
dimensions, namely economic, social, and environmental. Aguinis and Glavas (2012) clarify
that although actions and policies may be set at the organisational level, it is influenced by all
levels; institutional, organisational, and individual. This multi-dimensionality of CSR is
further reverberated across CSR scholars (Carroll, 1991; Okpara and Wynn, 2011). In the
present research context, the thesis builds upon this definition and integrates the findings of
Dahlsrud (2008), as well as the suggestion of Rupp and Mallory (2015), and accordingly
chooses to focus on the dimensions of social, philanthropic, stakeholder, economic, and
environmental, in reference to ESR. From here onwards, CSR is used to refer to more macro
(e.g. organisational) efforts, whilst employee social responsibility (ESR) will be used to
denote employees’ active involvement with such macro CSR efforts at the micro-level,
manifested as their individual behaviours whilst at work.
2.3.Why CSR?
Moving away from Friedman’s (1970) argument in the New York Times Magazine, that “the
social responsibility of business is to increase its profits”; CSR is becoming increasingly
important in organisations. Whilst the motives, either altruistic or instrumental (e.g.

[27]
competitiveness), for organisational engagement in CSR may be contested, it is evident from
past research that engaging in CSR makes good business sense (Garay and Font, 2012).
Before moving on to specifically focus on the micro-levels of CSR, that is ESR, briefly the
determinants of organisational CSR, as well as the benefits arising from organisational CSR
engagement, will be explored.
2.3.1. Determinants of CSR
There are many reasons as to why organisations engage in CSR, such as institutional and
stakeholder pressure (e.g. shareholders, local community), organisation’s instrumental and
normative motives, mission and value, and corporate governance (Aguinis and Glavas, 2012).
The authors, Aguinis and Glavas (2012), note that the outcomes of this CSR engagement can
vary from financial performance, consumer loyalty, stakeholder relations, firm capabilities, to
employee outcomes such as attraction to the organisation as potential employees, in addition
to increased identification and commitment. For instance, even by simply adopting the
relevant environmental standards, organisations can expect to see increased productivity
compared to those who do not (Delmas and Pekovic, 2013).
Buehler and Shetty (1976) noted that social and governmental pressures mean more than half
of the responding organisations had initiatives in place in order to address CSR issues.
Organisational responses were determined by relevancy of the issues to the organisation and
the available resources at hand. In addition to this, Greening and Gray (1994) also revealed
that institutional forces and resource dependencies affect the ways in which organisations
consolidate themselves in order to respond to the social and political issues present. With
regards to institutional forces, pressure from interest groups and crises were noteworthy,
whilst size of the organisation and top management commitment were important, in reference
to resource dependencies. Similarly, Griffin, Bryant and Koerber (2014) highlighted the
positive relationship between institutional pressures (such as high capital intensity) and
industry differentiation with an organisation’s voluntary activities.
Codes of conduct implementation, top-management ethical norms, and community focused
ethical climate all positively impact upon ‘purchasing social responsibility’ within the supply
chain (Blome and Paulraj, 2013). Additionally, company size and performance positively
predicted corporate giving/ philanthropy (Galaskiewicz, 1997). Values are also important in
determining responses to CSR issues. For example, Bansal (2003) showed that individual

[28]
concerns and organisational values which were congruent with the environmental issue were
important in determining an organisational response to such issues (see also Bansal and Roth,
2000).
Maignan, Ferrell, and Hult (1999) underscored the positive influence of market-oriented and
humanistic organisational cultures on corporate citizenship, defined as “…activities and
organisational processes adopted by businesses to meet their social responsibilities” (pg.
456). Corporate citizenship in turn had beneficial effects upon employee commitment,
customer loyalty, and business performance; the latter defined as return on assets, return on
investments, profit growth and sales growth. Finally, CSR could be altruistically driven, and
this organisational motive is seen as desirable in helping to avoid green washing, which is
defined as the organisation’s CSR engagement for the reasons of benefiting the organisation
itself as opposed to the wider stakeholders (e.g. Chen and Chang, 2013).
2.3.2. Financial benefits of CSR
The financial benefits of CSR are commonly noted (e.g. Jo and Harjoto, 2012). For example,
those organisations that prioritise their CSR activities based upon strategic concerns tend to
have superior financial performance compared to those organisations which do not
strategically align their CSR activities (Michelon, Boesso, and Kumar, 2013). Ramchander,
Schwebach, and Staking (2012) further note the beneficial impact of effective stakeholder
management on share price and general competitiveness. Garay and Font (2012) suggest that
whilst CSR may be pursued for altruistic reasons, the CSR to corporate social performance
(CSP) link is stronger when CSR is implemented for other reasons, such as to enhance the
competitiveness of the organisation. However there are findings to the contrary, with some
studies reporting null or negative findings of CSR engagement on financial performance
(Peloza, 2009).
In an attempt to reconcile the misalignment between the various studies investigating the
effects of CSR on financial performance, Orlitzky, Schmidt, and Rynes (2003) conducted a
meta-analysis. Their findings showed that corporate social performance and corporate
financial performance positively impact upon one another in a cyclical fashion, with
reputation of the organisation mediating this relationship. They concluded that the previous
inconsistency in findings to be an artefact of stakeholder mismatching, sampling error, as
well as measurement error. Scholtens (2008) further analysed this interaction between

[29]
corporate social and financial performance, and surmised that the direction of causation most
often runs from financial performance to social performance, although findings can vary
depending on the different aspects of CSR. Thus suggesting that enhanced financial
performance provides the organisation with greater financial resources in order to invest more
readily in its social performance activities. More recently Rodgers, Choy, and Guiral (2013)
concluded that overall CSR does significantly affect a firm’s financial health, having defined
financial health more broadly than previous research by using market and accounting based
performance measures; the latter being composed of profitability (net income, sales/assets),
liquidity (quick ratio, cash ratio) and leverage (debt/assets, debt/equity).
2.3.3. Market benefits of CSR
Porter and Kramer (2006) advocate that organisational CSR be aligned with the strategy of
the organisation in order to reap the benefits of competitive advantage. Falkenberg and
Brunsael (2011) advise that through the lens of a resource based view; CSR activities can
provide a strategic benefit, as long as they are not imitable by other organisations. Falkenberg
and Brunsael (2011) also point out that if the CSR activity the organisation engages in is
unique, then this can lead to strategic advantages. Finally, there is also evidence that
shareholders react more positively to environmental initiatives and negatively to harmful eco-
behaviour (Flammer, 2013). The author highlights that the greater the institutional norms to
be positively engaged in CSR, the greater the negative repercussions for not doing so, such as
negative organisational perceptions.
In addition, CSR can benefit an organisation’s market value through its positive effects on
customer satisfaction (Luo and Bhattacharya, 2006). Interestingly, Walker and Kent (2013)
explored the roles of organisational credibility and consumer social consciousness on the
corporate philanthropy-consumer behaviour link. They provided some support for the
mediating effect of perceived organisational credibility between corporate philanthropy and
consumer advocacy and financial sacrificial behaviours, such as paying more for a product.
Consumer social consciousness was found to moderate the relationship between corporate
philanthropy and perceived organisational credibility, and between this credibility and the
outcomes.
Furthermore, CSR engagement can positively impact upon the corporate reputation of the
organisation (Melo and Garrido-Morgado, 2012). More specifically, Brammer and Pavelin

[30]
(2006) put forward the importance of fit between corporate social and financial performance.
The authors suggest that for social performance to have a positive impact upon corporate
reputation; there must be a fit between the activity itself and the stakeholder environment,
such as the nature of the stakeholders’ biggest concerns regarding the organisation. Du et al.
(2007) also show how positive consumer perceptions of an organisation’s CSR activities can
positively affect their purchase likelihood, as well as their long-term loyalty. Curras-Perez,
Bigne-Alcaniz, and Alvarado-Herrera (2009) demonstrate that the positive effects of CSR on
consumers positive brand attitudes and purchase intention may be due to its effects on greater
consumer identification with the organisation. Furthermore organisations’ increased CSR
engagement can have the upshot of facilitating positive word-of-mouth in consumers
(Romani, Grappi, and Bagozzi, 2013).
2.3.4. Employee benefits of CSR
Although many authors consider CSR from a macro perspective (Galbreath, 2010;
Tenbrunsel and Smith-Crowe, 2011), to date a nominal amount of studies have looked at the
relationship between CSR and employee outcomes (Aguilera, Rupp, Williams, and
Ganapathi, 2007). The research that subsists, has consistently noted the positive impact of
organisational CSR on employees (e.g. Gond, El Akremi, Igalens, and Swaen, 2010; Hansen,
Dunford, Boss, Boss, and Angermeier, 2011; Rupp, Ganapathi, Aguilera, and Williams,
2006); as well as highlighting possible underlying mechanisms, such as employee
identification, which can help explain the positive effects of CSR on employees (e.g. Glavas
and Godwin, 2013). For example, Berger, Cunningham, and Drumwright (2006) evidence
how an organisation’s participation in CSR can positively impact upon employee
identification with the organisation, whilst others demonstrate the positive association of CSR
with favourable employee outcomes such as employee commitment; which in turn can lead to
enhanced organisational functioning, for example (Ali, Ur Rehman, Ali, Yousaf, and Zia,
2010; Ellemers, Kingma, van de Burgt, and Barreto, 2011; Turker, 2009). Furthermore,
employee-focused CSR can also lead to greater employee motivation (Kim and Scullion,
2013).
When employees perceive that their organisation is active within CSR, there can be knock-on
benefits for employees’ commitment to the organisation, job satisfaction and identification
with the company (Brammer, Millington, and Rayton, 2007; De Roeck, Marique,

[31]
Stinglhamber, and Swaen, 2014; Farooq, Payaud, Merunka, and Valette-Florence, 2014;
Kim, Lee, Lee, and Kim, 2010; Zhang, Fan, and Zhu, 2014). It is argued that CSR reflects
both first party justice and third party justice, the latter of which consist of both internal
stakeholders, primarily employees, and external stakeholders (Rupp, Skarlicki, and Shao,
2013). As such, Rupp et al. (2013) argue that employees will thus respond positively when
their organisation displays third party justice through their engagement in CSR, and
negatively when it neglects to, and acts irresponsibly.
Brockner, Senior, and Welch (2014) further reinforce the beneficial effects of CSR
engagement on organisations by demonstrating the positive relationship between corporate
volunteerism (corporate-sponsored activities) and organisational commitment in employees.
It is not necessarily the actual activities of the organisation which are significant here, but
also the role of employees’ perceived CSR which can lead to greater affective commitment
with the organisation (Mueller, Hattrup, Spiess, and Lin-Hi, 2013).Those such as Bauman
and Skitka (2013) additionally explore the various means by which organisational CSR can
lead to employee satisfaction through meeting their psychological needs of security, self-
esteem, belongingness, and a meaningful existence.
Moreover, organisations that are more active within CSR are shown to be more attractive to
prospective employees, compared to those organisations which are not as active (Greening
and Turban, 2000; Zhang and Gowan, 2012). For instance, recruitment messages which
highlighted social and environmental responsibility were related to greater job pursuit
intentions in those that wanted to make a social impact in their work (Gully, Phillips,
Castellano, Han, and Kim, 2013).
2.4.Micro-level CSR
From the overview of macro-CSR above, we can conclude that there are various determinants
of organisational engagement in CSR, as well as the advantages that arise from this
engagement. These advantages, it has been noted, range from financial benefits of CSR to
positive knock-on effects on employee outcomes. What we are however little aware of is,
how employee involvement within organisational CSR, in the form of ESR, can be facilitated
at the group and individual levels. Whilst employees are considered a significant stakeholder,
and are positively impacted by their organisation’s CSR engagement, research has tended to
neglect their active role in CSR. Rupp and Mallory (2015) highlight the irony of this, given

[32]
that employees are very relevant to the purpose of CSR, and that employees of all levels
within an organisation, “plan for, participate in, and witness CSR” (pg. 212).
Nevertheless, provided that merely a few years ago, Aguinis and Glavas (2012) highlighted
only 4% of articles within the domain of CSR focused on micro-level CSR, the direction
seems to have shifted, and research has increasingly started to address this deficiency. The
following section will attempt to hone into ESR behaviours; the focus of the current thesis,
before exploring possible antecedents. To begin with, the findings of past research with
regards to employee involvement in their organisation’s CSR activities will be noted, before
narrowing into the focus of this thesis, which seeks to explicate the possible antecedents of
ESR.
2.4.1. Employee involvement in CSR
Those such as managers and practitioners that are interested in facilitating ESR, need
information on their predictors, which as Christensen et al. (2014) put it, “naturally involves
investigating CSR from the individual level of analysis” (p.165). Aguinis (2011) underscores
the need for organisational behaviour (OB) researchers to draw CSR into their domain of
study. Whilst previous efforts to focus on ESR have been few and far apart, the tide is slowly
changing, and consequently micro level CSR is receiving increasing interest due to recent
publications calling for action (e.g. Aguinis and Glavas, 2012; Rupp and Mallory, 2015), as
well as special issues dedicated to the area (e.g. Personnel Psychology, 2013).
The role of OB researchers is significant not only by looking at multiple levels of analysis
with regards to ESR enactment, but rather also by investigating the underlying mechanism by
which ESR activity within an organisation can be encouraged, maintained, and bolstered, as
well as the relevant measurement issues concerning ESR (Aguinis and Glavas, 2012;
Morgeson, Aguinis, Waldman, and Siegel, 2013). This further relates to the proposition by
Aguinis and Glavas (2013), that for CSR to be effective, it needs to be embedded within the
organisation. As is apparent from the OB literature, employees are responsible for translating
the company’s strategy into action through their daily activities, and can therefore be the
active guardians of embedding social responsibility (Schneider, 1987).
Collier and Esteban (2007) state that, “the effective delivery of corporate social and
environmental responsibility initiatives is dependent on employee responsiveness”.
[33]
Furthermore, Davies and Crane (2010) underscore the necessity of employee buy-in to, and
engagement in CSR, when looking at organisational involvement in CSR, especially in small-
to-medium enterprises (SMEs); employing those with values congruent with the
organisations values may therefore be an ideal solution. It is widely noted that the ‘people
make the place’ (Schneider, 1987); consequently whilst an organisation may strive for CSR,
if the employees do not commit to the same values and mission, then it can be argued that the
organisation is not truly a socially responsible organisation, and/or the organisation’s CSR
efforts will not be optimally effective.
Stancu, Grigore, and Rosca (2011) highlighted that although the majority of employees may
be aware of the company’s CSR efforts, only very few are involved in them, whilst others
such as Bhattacharya, Sen, and Korschun (2008), point out that employee awareness of the
organisation’s CSR efforts can be limited. Similarly Calabrese and Lancioni (2008) note that
this lack of awareness at the employee level can be in contrast to the high level of
commitment to CSR at the corporate level, and this could manifest as a bottle neck. This
becomes important, they continue, as employees are the link between the company and
customers, thus possibly compromising the effectiveness of organisational CSR efforts.
There are many benefits to be gleaned from encouraging employee participation in CSR. For
example, through this participation, the employee-company identification link can be
strengthened (Kim et al., 2010). Additionally, employee perceptions of the organisation’s
CSR activities affects their commitment to, and identification with the organisation, which
subsequently impacts upon their propensity to engage in citizenship behaviours, as well as
socially responsible behaviours (termed personal social action by the authors; Alfaro-
Barrentes, 2012). Furthermore, initiatives such as employee volunteering, can lead to the
generation of social capital and can benefit the organisation through building and maintaining
business-community relations.
What is more, by making employees aware of the organisation’s CSR efforts and getting
them involved, positive efforts are made to both attract and retain indispensable talent
(Bhattacharya et al., 2008). Given conditions of autonomy and empowerment, employees can
additionally become ‘tempered radicals’ and initiate change in order to influence the socially
responsible business functioning of their company (Nord and Fuller, 2009). Moreover, when
employees value a company’s socially responsible behaviour, they have a reduced propensity
for counterproductive work behaviours (Viswesvaran, Deshpande, and Milman, 1998).

[34]
Therefore an organisation that is an active CSR participant, can induce favourable employee
outcomes, ultimately feeding back to benefit the organisation.
The benefits of engagement in CSR activities, such as volunteering, are not merely a
contribution in helping to maintain a positive image of the organisation in public. Booth,
Won Park, and Glomb (2009) also note that as well as being related to an increased number
of hours of volunteering, employer supported volunteering may be beneficial in reducing
training costs for the employer, as a result of skill acquisition through volunteering. Indeed
research has shown that organisations can glean benefits from their employees when they
return to work after having volunteered, such as through increased engagement at work
(Caligiuri et al., 2013). The authors also demonstrated that if the volunteer had effectively
utilised their skills, this could also lead to sustainable impact for the non-governmental
organisation, as well as developing employee capability, if the volunteer project was
meaningful to the employee.
Employee volunteering is also beneficial in leading to the generation of social capital
(Muthuri et al., 2009), whilst others such as Grant (2012) have pointed out that volunteering
may indeed be a compensatory mechanism, allowing employees with poor job enrichment to
contribute to their organisation. In support of this, Rodell (2013) correspondingly revealed
that volunteering was related to volunteer and work meaningfulness, and indirectly to job
performance.
Bolton, Kim and O’Gorman (2011) note that whilst employee involvement may be limited in
the initiation stages of CSR development within the organisation, as it progresses and
matures, not only does their involvement increase, but it is a key factor in the success of CSR.
This can help to overcome ‘greenwashing’, the phenomenon whereby companies overtly
ascribe themselves as a highly socially responsible organisation, more so than is justified
(Ramus and Montiel, 2005). Instead, in addition to the philanthropic endeavours of the
organisation such as funding a charity; involving employees and making them visible in the
company’s CSR efforts, through volunteering for example, can reinforce a positive company
image as a socially responsible organisation, and can do so without the company having to
expend as much financial effort (Peterson, 2004).
Similarly, Maclagan (1999) suggest that employees should be involved in formulating CSR
policies. Doing so could possibly result in congruency between organisational and employee
values, consequently having beneficial effects on performance, as well as motivating

[35]
employee engagement in CSR, when an organisation is also actively engaged in CSR. Certain
employee demographical characteristics also make employee engagement in CSR more
likely, such as level of education and professional category (Celma, Martínez-Garcia, and
Coenders, 2014).
Nevertheless there is limited research on the influence of an organisation’s CSR activities on
subsequent ESR outcomes. Links have been drawn between organisational CSR and
employee extra-role behaviours, specifically organisational citizenship behaviours (Mueller
et al., 2012; Rupp et al., 2013) and environmentally focused behaviours (Manika, Wells, and
Gregory-Smith, and Gentry, 2015). This provides credence to the assumption that
organisational CSR could lead to further types of extra-role behaviours, namely those
possessing an element of social responsibility.
Ferreira and De Oliveira (2014) demonstrated the positive impact of internal CSR, that which
is focused on the working environment of employees, on employee engagement; the latter
defined as vigour, dedication, and absorption. Bissing-Olson, Iyer, Fielding, and Zacher
(2013) note the positive effects of a pro-environmental attitude. More specifically, employee
pro-environmental attitudes were seen to be positively related to both task-related and
proactive pro-environmental behaviours. Furthermore, environmental strategy itself was also
shown to be positively associated with employee environmental involvement (Chen, Tang,
Jin, Li, and Paillé, 2014). The findings of Eberhardt-Toth and Wasieleski (2013) highlight the
role of perceived moral intensity of environmental issues in explaining the intent to act in a
sustainable manner. Additionally, employee engagement in CSR activities such as
volunteering can have a compensatory effect for employee work which provides low task,
social, and/or knowledge enrichment.
2.4.2. Employee and group social responsibility
What is important to note is that employees are the main drivers of implementing socially
responsible policies and practises in their roles; as a result, ensuring their commitment and
motivation to the organisation’s efforts in this regard is essential (Collier and Esteban, 2007).
Accordingly, it can be surmised that the effectiveness of an organisation’s CSR programs,
depends a fair amount on employee engagement with these programs. For instance, an
organisation’s efforts to develop a program in which funds are devoted to building
orphanages in countries like India, as is commonplace in organisations nowadays; will only

[36]
be successful if the employees of the organisation give up their time and their creature
comforts, to go and volunteer in, and fulfil these projects. Following calls from authors such
as Aguilera et al. (2007) to address the enactment of CSR at an employee level and how such
conflicting demands between the various socially responsible behaviours can be balanced,
given that at the present moment there is a scarcity of research on employee involvement in
CSR, efforts have been made to conceptualise CSR at an employee level.
When referring to the subsistence of CSR at the group and individual level, they are termed
ESR behaviours, and these behaviours are proffered to be those that endeavour to primarily
benefit the stakeholders, which have been defined as “any group or individual who can affect
or is affected by the achievement of the firm’s objectives” (Freeman, 1984; pg.46). More
specifically, the proposed CSR definition at the organisational level as stated earlier by
Aguinis and Glavas (2012) is closely adhered to, and hence, ESR behaviours are stipulated as
those behaviours which are centred on benefiting the environment (e.g. recycling), social
(e.g. community support), philanthropy (e.g. fundraising/charity), stakeholder (e.g. proactive
peer and customer focused behaviours), and economic (fulfilling job role duties) dimensions.
This thesis will thus help to more accurately conceptualise these behaviours, and highlight the
means by which they can be encouraged.
What makes ESR distinct from other behavioural outcomes that have been persistently
researched is the nature of its focus, which is the stakeholder, as well as its multifaceted
conceptualisation. As noted above, in this context, ESR is proposed to encompass the social,
economic, philanthropic, environmental, and stakeholder facets (Dahlsrud, 2008). It can be
argued that these behaviours can be approximated through other existing outcomes to a
certain extent. For example stakeholder focused behaviours could be to a certain extent
tapped into through the measurement of altruism/ helping behaviours (e.g. Podsakoff,
Mackenzie, Moorman, and Fetter, 1990), and economic behaviours through in-role
behaviours (Williams and Anderson, 1991). Nevertheless, the argument is that, given they
compose an overarching construct of ESR, the behaviours from the various dimensions need
to be studied collectively, and also within an occupational setting.
Currently, there are a number of examples of attempts made by researchers to scrutinise ESR.
For example, in the study by Vlachos, Panagopoulos, and Rapp (2014), CSR-specific
performance was measured by way of distinguishing between in-role and extra-role CSR
specific performance. In-role behaviours were pitched as employee behaviours that equate to

[37]
completing “CSR-related responsibilities” in a general sense. Furthermore, extra-role
behaviours were conceptualised as ‘embracing’ new CSR programs, and contributing ideas to
improve existing CSR programs. Thus in both cases CSR behaviours were defined in a
summative fashion, for example as CSR responsibilities, consequently providing a limited
focus. The consequent issue is that when employee CSR behaviours become defined in a very
general sense, the multi-dimensional essence of CSR which has been reverberated in the CSR
domain, as well as specificity, is lost (Carroll, 1991).
Similarly, Ellis (2008) coins the term ‘personal social action’ to capture CSR at an employee
level. These behaviours tend to centre on the philanthropic facet of CSR (e.g. Carroll, 1991),
and include actions such as charitable donations and volunteering. Whilst employees
engaging in activities such as charitable donating are positive outcomes in themselves, they
can also further increase organisational commitment through the triggering of pro-social
sense-making (Grant, Dutton, and Rosso, 2008). Nevertheless, by focusing on only subsets of
the full spectrum of ESR behaviours, and ignoring for example the behaviours falling within
the stakeholder, environmental, and economic facets; the richness and multi-dimensional
nature of ESR is lost.
This issue regarding measurement tends to be mirrored in other research focusing on micro-
level CSR, and hence limits the completeness of understanding of ESR. Indeed this further
attests to the issues of specificity concerning CSR as highlighted by Rupp and Mallory
(2015). The authors point out that CSR tends to be used as an umbrella term for a boundless
number of organisational activities, which could be argued, are distinct domains within
themselves (e.g. diversity), and thus neglecting the multifaceted nature of CSR identified by
many authors when conceptualising CSR (e.g. Dahlsrud, 2008).
However one such study by Chen and Hung-Basecke (2014) did attempt to formulate a multi-
dimensional measurement of ESR. They developed a list of behaviours, which fell into the
three categories of social and environment, stakeholder relationship building, and community
support (in-kind/ financial donations). Employees were asked to indicate the extent to which
they had engaged in these behaviours and anticipated engaging in, in the coming 12 months.
Whilst this study provides a more proximate reflection of the multi-dimensional nature of
ESR, it still neglects to account for the economic dimension, and does not make a clear
distinction between the social and philanthropy dimensions. Furthermore, it specifically asks
employees to merely note the activities they engage in, and is reflective of a more formative

[38]
scale. Finally, the list of socially responsible activities is context-specific, thus precluding its
use in other organisations. As a result, whilst it was a more commendable attempt to capture
the multi-faceted nature of ESR, the shortcomings are significant enough for it to be deemed
an unsuitable measurement of ESR.
Another failing is the inability to address calls to examine the conflicting nature of such
socially responsible behaviours (e.g. Aguilera et al., 2007). Aguilera et al. (2007), whilst
placing focus on organisational-level CSR, pay tribute to the possible inherent conflict
between different types of CSR activities. Specifically, they provide the example where
organisations might provide genetically modified seeds to aid underdeveloped countries’
agricultural development, what could be considered as a behaviour falling within the
philanthropy dimension of CSR; may conflict with objective of attaining long-term
environmental sustainability. A parallel argument can be drawn from their discussion on
macro-level CSR activities, to micro-level ESR behaviours. That is, employees may likewise
experience conflict between engaging in more social type behaviours such as volunteering in
the community, which may conflict with employees’ efficiency in their work tasks.
As such, ESR research efforts, such as those by Chen and Hung-Basecke (2014) and Vlachos
et al. (2014), as well as others (e.g. Bissing-Olson et al., 2013; Crilly, Schneider, and Zollo,
2011), fail to take account of this conflict. They either, like Chen and Hung-Basecke (2014),
focus on multi-dimensional ESR activities, but neglect to pay heed to possible conflict
between the various activities, or like Robertson and Barling (2013), they focus on a specific
facet of ESR, in their case environmental behaviours, and neglect to consider the multi-
dimensionality of ESR. As a result, they disregard the possible conflict between the various
dimensions of ESR.
What is more, although relatively scarce, the literature linking organisational CSR to
employees at the individual level subsists; to date however, there seems to be no evident
research which inspects either the impact of CSR on group outcomes, or the way in which
group engagement in CSR could be encouraged. Rupp and Mallory (2015) note that one of
the obstacles that remain with regards to CSR is the way it is operationalized at different
levels of analysis. It is becoming increasingly important to focus on the group level of
analysis also, given the proliferation of team working in organisations (Mathieu, Maynard,
Rapp and Gilson, 2008). In the present research therefore, such a niche will be addressed by
examining ESR at the group and individual level.
[39]
For instance, in the study by Crilly et al. (2011), the focus was on middle managers and how
their individual values affected the propensity to engage in socially responsible behaviours
(see also Mazereeuw-van der Duijn Schouten, Graafland, and Kaptein, 2014). When
examining employee pro-environmental behaviours, Robertson and Barling (2013) examined
leader-subordinate dyads, and the effect of the leader’s pro-environmental behaviours on
employee pro-environmental behaviours. Similarly, Bissing-Olson et al. (2013) also
investigated the role of affect on individual level employee environmental behaviours. Other
studies on individual level ESR outcomes, specifically targeting the environmental
dimensions include the likes of Graves, Sarkis, and Zhu (2013), Paille and Meija-Morelos
(2014), and Manika et al. (2015). More general to ESR, Vlachos et al. (2014) investigated the
cascading effects of managerial CSR-specific performance on employee CSR-specific
performance, whilst Chen and Hung-Basecke (2014) evidenced the role of leader modelling
on individual level employee CSR participation.
Kim, Kim, Han, Jackson, and Ployhart (in press) however did attempt to examine ESR from a
multi-level perspective, even though the focus was narrowly placed on the environmental
dimension of ESR. They were able to demonstrate the positive effects of group level leader
voluntary workplace green behaviour (VWGB), on individual level group member VWGB.
Furthermore, they also evidenced the effects of work green advocacy, defined as the group’s
influence in encouraging individuals to commit to environmental responsibility, on individual
group member VWGB. The current thesis proposes to examine both group and individual
level ESR, in order to address the scarcity of research which examines both the individual
and group level of ESR. It is argued that it is important to look at both the group and
individual levels, as inevitably individuals, in many cases compose teams within
organisations, especially significant given the rise of team working in organisations (West
and Lyubovnikova, 2012).
As can been from Table 2.01, there are currently a number of ESR measurement tools.
Nonetheless it is argued that whilst such scales are in rotation, they do not sufficiently capture
ESR and are thus debilitating the growth of research on ESR. The issue pertaining to existing
scales, as apparent from the table, is that they either focus narrowly on one facet of ESR, such
as the environmental facet (e.g. Robertson and Barling, 2003), or they take too broad a view
and thus do not capture specific ESR behaviours (e.g. Vlachos et al., 2014). Thus what is
crippling, in the current state of research on ESR, is the lack of an employee behavioural
measurement tool which captures the full spectrum of ESR behaviours. As a result, ESR is

[40]
not it provided full due, as a result of ignoring the conflicting nature between the various
dimensions. This table highlights the necessity for an ESR behavioural measurement tool,
and consequently, before the thesis can explore the antecedent and boundary conditions of
ESR, it will first seek to establish a valid and reliable ESR measurement scale (chapter five).
Accordingly, given that there is very little research on ESR, especially that which focuses on
ESR through a multi-level lens; the need to place greater focus on ESR and examine it at
multiple-levels of analysis, is crucial. This current thesis makes efforts to embrace this
notable task by exploring possible antecedents of ESR at the group and individual levels.

[41]
Table 2.01
Existing measures of ESR
Scale Example
Comments
Propensity to engage in socially responsible
behaviour
(Crilly et al., 2011)
Scenario-based; based on the
Multidimensional Ethics Scale developed by
Reidenbach and Robin (1990)
Examining the propensity to engage in ESR,
as opposed to actual socially responsible
behaviour
Workplace pro-environmental behaviour
(Robertson and Barling, 2013)
“I turn off lights when not in use”
“I print double-sided whenever possible”
Consideration is only paid to the
environmental dimension of ESR
Daily task-related pro-environmental
behaviour
(Bissing-Olson et al., 2013)
Items adapted from the in-role behaviour scale
by Williams and Anderson (1991)
“Today, I fulfilled responsibilities specified in
my job description in environmentally-
friendly ways”
Only measuring one (environmental), of the
five identified dimensions of ESR
Daily proactive pro-environmental behaviour
(Bissing-Olson et al., 2013)
Adapted from Frese, Fay, Hilburger, Leng,
and Tag (1997)
“Today, I took initiative to act in
environmentally-friendly ways at work”
Only the environmental dimension of ESR is
measured
The scale lacks specificity of the actual
environmental behaviours engaged in

[42]
Pro-environmental behaviours
(Graves, Sarkis, and Zhu, 2013)
“Find ways of working that are better for the
environment”
“Recycle and reuse material”
Only measuring one (environmental), of the
five identified dimensions of ESR
CSR Behaviour
(Mazereeuw-van der Duijn Schouten et al.,
2014)
“How often do you personally contribute more
than required by law within your organisation
with respect to each of the different items:
Safety and health of employees
Reduction of waste and/or pollution within
your own company”
Neglect of philanthropy and social dimensions
of ESR
Voluntary Workplace Green Behaviour
(Kim et al., in press)
Items centred on:
Avoiding unnecessary printing to save papers
Using stairs instead of elevators when going
from floor to floor in the building
Predominant focus on the environmental
dimension of ESR, and neglect of the other
four dimensions (economic, philanthropy,
social, and stakeholder)
Organisational citizenship behaviour for the
environment
(Boiral and Paillé, 2012)
“I encourage my colleagues to adopt more
environmentally conscious behaviour”
“I voluntarily carry out environmental actions
and initiatives in my daily work activities”
Focus is only on the environmental dimension
of ESR, without considering the full spectrum
of ESR
Behaviours measured are general and lack
specificity

[43]
Extra-role CSR specific performance
(Vlachos et al. 2014)
“I contribute many ideas for improving my
organisation’s CSR programs”
The scale is too broad and does not capture the
multi-dimensional and behavioural nature of
ESR
In-role CSR specific performance
(Vlachos et al., 2014: adapted from Williams
and Anderson, 1991)
“I perform the CSR-related tasks that are
expected as part of my job”
“I adequately complete my CSR-related
responsibilities”
The scale lacks specificity and does not
indicate what the ‘CSR-related’ tasks in fact
are
Green behaviours (i.e. recycling, energy
savings and printing reduction’)
(Manika et al., 2015)
“I switch off lights when not needed”
“I tend to print e-mails for ease of reference”
Focus is on ‘green’ environmental behaviours,
and as a result, neglects the behaviours within
the other four dimensions of ESR (social,
philanthropy, stakeholder, and economic)
Employee green behaviour
(Norton, Zacher, and Ashkanasy, 2014:
adapted from Bissing-Olson et al., 2013)
“I fulfil responsibilities specified in my job
description in environmentally friendly ways”
“I take initiative to act in environmentally
friendly ways at work”
Only the environmental dimension of ESR is
measured thus ignoring the multi-
dimensionality of ESR behaviours
Organisational citizenship behaviours
towards the environment
(Lamm, Tosti-Kharas, and Williams, 2013)
“I am a person who prints double-sided”
“I am a person who turns off my lights when
leaving my office for any reason”
Only looking at environmental behaviours, as
opposed to the full spectrum of ESR

[44]
Employees’ environmental involvement
(del Brío, Fernández, and Junquera, 2007)
“In our firm, environmental issues are
included in our tasks”
Focus is only on environmental behaviours,
thus barring consideration of the other
dimensions of ESR
Employee participation in CSR activities
(Chen and Hung-Basecke, 2014)
Not a behaviourally anchored scale; instead
participants selected their current and future
(next 12 months) participation in 23 CSR
activities.
Activities not listed in their paper, but were
organized into categories of: social and
environmental activities, stakeholder
relationship-building activities, and local
community support (e.g. donating)
The behaviours falling within the social and
philanthropy dimensions of ESR are not
distinguished from one another
Economic dimension of ESR is neglected
Indicative of a more formative measurement
tool

[45]
2.5.Predictors of ESR
Case studies have been conducted into organisations to showcase the way in which
employees can successfully engage in socially responsible behaviours, and thus contribute to
the organisations CSR activities. Recent research by Barkay (2012) has highlighted how an
active CSR organisation can encourage employees to get on board, and assist the organisation
in attaining the mission of becoming socially responsible. For example, in the ethnography
analysis of a Coca Cola franchise, Barkay (2012) demonstrated that through effective
communication to all employees consistently, management commitment at various levels,
and motivating employees; engendered employee acceptance and contribution to the CSR
project, through volunteering in the community projects.
As highlighted previously, when exploring ESR behaviours, the need to bear its multi-
dimensional nature in mind is important, given that there appears to be conflict inherent
between the different dimensions of ESR. Aguilera et al. (2007) notes, that the
multidimensionality of socially responsible behaviours carries with it the imposed conflicting
nature that is placed upon the incumbent. On the one hand, the employee is required to fulfil
his/her job duties, comply with environmental procedures, and generate a profit for the
company. Whilst conversely, they are also expected to dedicate their time to volunteering and
providing an exceptional level of service to customers, as well as assisting colleagues, which
can in many cases take a greater amount of time.
This conflict is an indicative example of role conflict. The role theory suggests that role
conflict arises when there are incompatible demands placed upon the incumbent in the work
setting (Katz and Kahn, 1978). As a result, in order to facilitate ESR, a combination of factors
are needed which are capable of balancing the conflict between the various ESR behaviours,
and thus evading employees’ experience of role conflict. Here the roles of TF, CSR climate,
and assigned CSR priority are highlighted as particularly useful, based on prior research
highlighting their utility in balancing conflict of demands, as will be explored in greater detail
below. Furthermore, the choice of these factors is additionally informed by the goal-setting
theory (e.g. Locke and Latham, 2002), on the basis of which it is argued that the combination
of TF, assigned CSR priority, and CSR climate, set challenging ESR goals for individual and
teams, motivate and support goal-directed efforts, and manage expectations of CSR, and
communicate the importance of CSR; thus providing a consistent message on the need to

[46]
engage in ESR behaviours holistically, more specifically, and reinforcing the salience of CSR
more generally.
Such a conundrum between conflicting behaviours that employees are encouraged to engage
in, mirrors that of behaviours such as innovation versus routine behaviours (e.g. West, 2002),
and between service quality and efficiency of customer transactions (e.g. Schneider,
Holcombe, and White, 1997). This issue has been even greatly resonated in the safety
behaviours domain where research has been striving to deduce how this conflict of safety
behaviours versus the need for efficiency can be allied and mutually enforced, without
compromising one for the other (e.g. Hofman, Morgeson, and Gerras, 2003; Wu, Chen, and
Li, 2008; Zohar, 2000, 2002a, 2002b, 2010). Here the roles of leadership and safety climate
have been significant. For example Kapp (2012) demonstrated the role of transformational
leadership in facilitating safety compliance, as moderated by the safety climate, with similar
findings reported by Zohar (2002a).
Zohar (2000) further noted that safety climate could predict the number of accidents,
highlighting the prominent role of supervisory action in helping to balance the conflicting
demands. Following this, he designed an intervention in which he was able to demonstrate
that through improving supervisory practices to help reduce role conflict, there was an
improvement in negative safety indicators such as injury rate, as well as in employees’
perceptions of the safety climate.
Consequently, a similar relationship can be inferred in the context of ESRs. It is suggested
that the role of leadership can assist in balancing the conflicting demands of the various
socially responsible behaviours for the employees. The focus specifically is on TF, which
research has shown to be consistently linked to many positive work outcomes, and is noted to
be helpful in balancing the conflict between various behaviours (e.g. see Judge and Piccolo,
2004 for a meta-analysis). Furthermore, the role of assigned CSR priority in providing a
CSR-specific focus to these TF behaviours is proposed to further assist in balancing the
conflict between the multi-dimensional ESR behaviours, by managing employee expectations
regarding ESR (see Zohar, 2002a). Finally, as with the safety domain, the role of a CSR
climate is considered imperative here in outlining the commitment of the group/ organisation
to CSR, and reinforcing the importance of such behaviours at the individual and group levels.
Indeed, the role of organisational and supervisory support is positively related to employees’

[47]
likelihood of developing and implementing ideas aimed at positively impacting upon their
environment (Ramus and Steger, 2000).
2.6.Leadership and ESR
Effective leadership is accepted as integral to ensuring many positive individual and
organisational outcomes, in addition to the deterrence of negative outcomes; with effective
leaders being considered key drives of positive behaviour (Ones and Dilchert, 2012). The
past leadership literature has encompassed a breadth of outcomes to demonstrate this, ranging
from project success, employee wellbeing, and firm performance, to fighting corruption
(Carmeli, Gelbard, and Gefen, 2010; Nielsen, Randall, Yarker, and Sten-Olof, 2008;
Prabhakar, 2005; Ruzindana, 1997).
Management commitment to ethics is noted as a key driver of corporate social performance
(Muller and Kolk, 2010). Hemingway and Maclagan (2004) also note the importance of
managerial values as an important factor in the implementation and facilitation of CSR
practices and policies. Snell (2000) pointed out that leaders’ moral development in
conjunction with norms and expectations of the industry, inform the organisational moral
ethos. This organisational moral ethos consequently engenders positive outcomes such as
integrity, equal opportunity and environmental protection.
Moreover, decision-making concerning CSR is influenced by the political ideology of the
chief executive officer (CEO) and whether he/she comes from a liberalism versus
conservatism ideology; the former being more positively associated with CSR (Chin,
Hambrick, and Treviño, 2013). Additionally, an open executive orientation in CEOs, which
the researcher defines as reflecting a liberal worldview, functional background, educational
background, and international experience; are all positively related to the initial adoption of
corporate social strategy (Mazutis, 2013). Tang, Qian, Chen and Shen (in press) also point
out that CEO hubris, defined as extreme self-confidence and pride, exhibits a negative
relationship with CSR, and a positive relationship with corporate social irresponsibility
(CSiR). Furthermore, Pearce and Manz (2011) clarified the role of a socialized power
orientation in deterring from CSiR, whilst the converse is expected with a personalized power
orientation. Moreover, personal values of CEOs, as well as when CEOs are faced with
governmental and stakeholder claims; make corporate charitable donations more likely
(Wang, Hodgkinson, Rousseau, and Flood, 2015).
[48]
In addition, Fabrizi, Mallin, and Michelon (2014) demonstrated the positive effects of non-
monetary incentives, and the negative effect of monetary incentives on CSR, since the latter
aligned the interests of the CEOs with that of the shareholders (see also Miska, Hilbe, &
Mayer, 2014). The authors further noted other characteristics pertaining to the CEO which
make CSR more likely; incoming CEOs, higher power and entrenchment, and lower career
concerns. More recently however, Jiraporn and Chintrakarn (2013) evidenced a curvilinear
relationship between CEO power and CSR engagement. They showed that when the CEO
moved from having weak power to greater power, they were more likely to engage in CSR.
However past a certain threshold, there was reduced engagement in CSR. Godos-Diez,
Fernández-Gago, and Martínez-Campillo (2011), having applied the Agency-Stewardship
approach (Davis, Schoorman, and Donaldson, 1997), were able to show that CEOs were
positively related to the development and implementation of CSR, both directly and
indirectly through the perceived importance of ethics and social responsibility. They were
also more likely to behave ethically and in a socially responsible manner, if this was
considered crucial for organisational effectiveness.
However Pedersen et al. (2011) put forward some abysmal findings on leader perceptions of
stakeholders. Pedersen noted that leaders tended to possess a narrow perspective of who their
primary stakeholders were, confining them to those that directly impact on the organisation’s
activities, such as the customers and employees, as opposed to the wider community for
example. Whilst this could be for a variety of reasons, such as focus on these stakeholders
being deemed to have a greater pay-off or to simplify processes, ultimately it represents a
significant barrier to an encompassing stakeholder view of CSR, and thus impacts upon CSR
implementation, which affects more than just these direct stakeholders. Nevertheless, having
identified the relation of more executive leadership with CSR, the focus will now specifically
be placed onto the role of leadership on individual level outcomes, especially those pertaining
to social responsibility.
2.6.1. Leadership and individual level outcomes
Stenmark and Mumford (2011) demonstrated that individuals are more likely to make
unethical decisions when they have a person in echelons above them which they can exploit
as an excuse for engaging in such behaviour; therefore, the involvement of a superior leads to
a diffusion of responsibility. This is somewhat similar to Milgram’s (e.g.1964) experiments,

[49]
where individuals engaged in unethical conduct through administration of ‘electric shocks’,
under the influence of perceived authority. However it is contested that, if the leader in
authority holds stakeholder needs and CSR paramount, employees will have no ‘scapegoat’
for abstention from following their good conduct and likewise prioritising social
responsibility, and are therefore instead encouraged to partake in ESR behaviours.
In discussing CSR leadership in their letter exchange, Waldman and Siegel (2008) point out
the dearth of research that looks at leadership ethics, with Siegel calling for an ethical and
moral leader. More recently, Metcalf and Benn (2013) highlighted the complexity of
sustainability issues and thus called for leaders which have extraordinary abilities. They
discuss the possible links between authentic, ethical, moral, and transformational leadership,
with CSR. Additionally, in relation to existing research in the area of social responsibility,
‘leader voluntary workplace green behaviours’ has had its links to subordinate green
behaviour advocacy both directly and indirectly noted, through work group green advocacy
(Kim et al., in press). Those such as Vlachos et al. (2014) further demonstrated the key role
leadership plays in prompting and encouraging employee CSR engagement. Whilst they
made the case for directive leadership behaviours, it is argued that TF may indeed be more
effective when considering employee engagement in CSR. Below, the various leadership
styles which could possibly be noteworthy in facilitating ESR are discussed, with a specific
focus on TF.
2.6.2. Authentic leadership
Authentic leaders are “individuals who are deeply aware of how they think and behave, and
are perceived by others as being aware of their own and others' values/moral perspective,
knowledge, and strengths; aware of the context in which they operate, and who are confident,
hopeful, optimistic, resilient, and high on moral character” (Avolio, Gardner, Walumbwa,
Luthans, and May, 2004, pg. 4). Authentic leadership is conceptualised as consisting of four
facets of self-awareness, internalised moral perspective, balanced processing of information,
and relational transparency.
Whilst authentic leadership (AL) has been shown to facilitate various positive outcomes such
as job performance and OCBs, it has been shown to possess little relationship with ethical
attitude (e.g. Friedrich, 2012; Walumbwa, Wang, Wang, and Schaubroeck, and Avolio,
2010). This is line with arguments from authors such as Shamir and Eliam (2005) and

[50]
Sparrowe (2005) who disrepute the fact that authentic leadership has a moral component;
instead they suggest this depends on the individual’s character.
However there is controversy in the literature since others argue for a moral component to
AL (e.g. Avolio et al., 2004; Gardner, Avolio, Luthans, May, and Walumbwa, 2005). For
example Walumbwa, Avolio, Gardner, Wernsing, and Peterson (2008) argued that AL
requires high levels of self-reflection which tends to coincide with high levels of moral
development. More recently, Hannah, Avolio, and Walumbwa (2011) did find a positive
relationship between AL, and ethical and prosocial behaviour. The findings are thus mixed,
and may be explained through social desirability bias and a positive climate fostering positive
ethical attitudes in followers.
As a result, it is argued that whilst AL can foster many positive individual and organisational
outcomes through its open and honest leading style, it is not necessarily related to the
employees’ ethical attitude (e.g. Friedrich, 2012), which could be considered a close
proximate to ESR. Therefore a leadership style, consistently fostering such positive ethical/
CSR attitudes of employees is needed in order to generate commitment to the organisation’s
CSR agenda, to translate this into ESR at the individual and group level, and one that is able
to motivate employees towards the various facets of ESR behaviours, by balancing the
conflict between them.
2.6.3. Servant leadership
Greenleaf (1996) described servant leadership as going beyond self-interest, to serve the
followers and cater for their needs. The servant leader is concerned with helping followers to
develop through the provision of learning opportunities, and in doing so they generate
commitment from followers as a result of their trust and reliability, which further garners a
positive environment for the followers.
Through this emphasis on creating a positive atmosphere, one in which development and
support of employee is core, one could argue that ESR could be encouraged (e.g. see van
Dierendonck, 2011). However it is argued that the ‘‘self-sacrificial servanthood’’ aspect of
servant leadership (Sendjaya, Sarros, and Santora, 2008, pg. 405) is chiefly motivated
towards the needs of the internal stakeholders; the followers within the organisation. Whilst
this may help to promote performance such as organisational citizenship behaviours of

[51]
employees (Ehrhart, 2004; Neubert, Kacmar, Carlson, Chonko, and Roberts, 2008), it is not
evident how this can motivate employee behaviours that are directed towards both internal
and external stakeholders, in referenced to ESR.
2.6.4. Ethical leadership
Ethical leadership (EL) is defined as “the demonstration of normatively appropriate conduct
through personal actions and interpersonal relationships, and the promotion of such conduct
to followers through two-way communication, reinforcement, and decision making” (Brown,
Trevino, and Harrison, 2005, pg. 120). Based on exploratory research by Trevino, Hartman,
and Brown (2000, 2003), ethical leaders have been identified in interviews as having a strong
concern for others, termed ‘other awareness’. Furthermore they are considered to be fair,
trustworthy, and show consideration for the society; thus characterising the facet of the leader
as a moral person. The moral manager aspect of ethical leadership is typified by the leader
actively managing the ethical conduct of employees through transactions and role modelling.
Much of the academic work has focused on EL which for the most part has been descriptive
(Brown and Trevino, 2006). To overcome this, an increasing number of studies have looked
at the antecedents and consequences of EL (e.g. Mayer, Aquino, Greenbaum, and Kuenzi,
2012). Research has noted the positive effects of EL on both job-related (e.g. job
performance) and ethics-related outcomes (e.g. whistle-blowing intentions) in employees
(e.g. Dadhich and Bhal, 2008; Den Hartog and De Hoogh, 2009; Johnson, Shelton, and
Yates, 2012; Ponnu and Tennakoon, 2009; Ruiz-Palomino, Ruiz-Amaya, and Martinez,
2011a, 2011b); and negative relationships with unethical behaviours, deviant behaviours and
relationship conflict (Avey, Wernsing, and Palanski, 2012; Mayer et al., 2012).
With reference to CSR, Wu, Kwan, Yim, Chiu, and He (in press) noted that CEO ethical
leadership was positively related to organisational-level CSR, through the mediating
influence of organisational ethical culture. Furthermore, Eisenbeiss & Brodbeck (2014)
demonstrated through interviews, that ethical leadership was seen as having a concern for
both the society and the environment.
Brown and Trevino (2006) posit that EL exerts its effects through the role modelling of
positive behaviours (Bandura, 1986). However, whilst this may lead to the adoption of the
behaviours modelled, it is unable to deal with conflicting demands that are placed upon

[52]
employees, and motivate them adequately with regards to the various facets of ESR
behaviours. As such, EL may be able to model for example ethical and prosocial behaviours,
but it does not necessarily communicate to the employees how they are to both commit to
prosocial behaviours whilst complying with their job requirements, as this is not something
that is accounted for by the theory.
2.6.5. Responsible leadership
Responsible leadership, a relatively emergent leadership style, is defined as ‘‘a relational and
ethical phenomenon, which occurs in social processes of interaction with those who affect or
are affected by leadership, and have a stake in the purpose and vision of the leadership
relationship” (Maak and Pless, 2006; pg.103). Thus at the core of responsible leadership is its
interaction with both internal and external stakeholders, as opposed to the traditional leader-
follower interaction. The aim of such leaders is accountability, trust, and moral decision
making, not motivated by the self-interests of the leader and/or the organisation (Pless and
Maak, 2011). Such leaders, it is put forward, can assist in the development of an ethical
culture, positively impact upon perceived importance of CSR within the organisation, as well
as encourage positive follower attitudes and cognitions (Voegtlin, Platzer, and Scherer,
2012). This leadership style has been shown to be positively related to job satisfaction and
negatively related to unethical behaviour (Voegtlin, 2011).
Research shows that whilst responsible leadership may be similar to EL and TF, it remains
distinct (Voegtlin, 2011). Pless and Maak (2011) argue that the distinguishing feature of
responsible leadership, as compared to EL, is the former’s focus on the leader-stakeholder
relationship. However as noted above, the same can be argued for EL, and indeed Brown and
Trevino (2006) do suggest EL takes stakeholder needs into account. Thus the real ‘need’ for
responsible leadership and its existence as a distinct conceptual entity from EL can be
brought into disrepute.
2.6.6. Transformational leadership
Transformational leadership (TF) has been outlined as consisting of the facets of idealised
influence, individualised consideration, inspirational motivation, and intellectual stimulation
(Bass, 1990; Bass, 1997). Transformational leaders “raise followers’ aspirations and activate

[53]
higher order values such that followers identify with the leader and his or her mission/vision,
feel better about their work, and work to perform beyond simple transactions and base
expectations” (Avolio, Walumbwa, & Weber, 2009; pg. 428). A significant amount of
research has yielded TF as favourable for many positive behavioural outcomes in employees
(e.g. Bycio, Hackett, and Allen, 1995; Druskat, 1994; Griffith, 2004; Mackenzie, Podsakoff,
and Rich, 2001; Mayfield and Mayfield, 2006, 2009; Podsakoff, Mackenzie, Moorman, and
Fetter, 1990). Meta-analyses have yielded TF leadership as the most effective (Judge and
Piccolo, 2004; Lowe et al., 1996).
The effects of TF at multi-levels of analyses have additionally been noted. For example, the
effects of TF on group outcomes such as effectiveness are consistently documented. For
instance, Braun, Peus, Weisweiler and Frey (2013) demonstrated the multilevel effects of TF
in positively impacting upon job satisfaction at the individual and team level, as well as on
objective team performance. Indeed its effectiveness has also been demarcated at the
organisational level of analysis, thus providing credence to its multi-level effects (Menges,
Walter, Vogel, and Bruch, 2011).
Furthermore, TF has been shown to have a moral/ethical component through its idealised
influence facet (Bass, 1997; Kark, Shamir, and Chen, 2003; Rowold, 2008; Ruiz-Palomino et
al., 2011b). Not only this, but leaders that are perceived to have a high level of integrity and
sophisticated moral reasoning, are often identified as TF by their followers (Parry and
Proctor-Thomson, 2002; Turner, Barling, and Epitropaki, 2002). Leaders with a TF style use
inspirational motivation to generate effort towards the collective good, whereas pseudo-TF do
so in order to maximise self-interest (e.g. Barling, Christie, and Turner, 2008). In addition,
Simola, Barling, and Turner (2010) identified an association between TF and an ethic of care.
Similarly, in formulating the Ethical Leadership Scale (ELS), Brown et al. (2005)
demonstrated TF as being distinct from EL; these two being considered to have the greatest
overlap. Toor and Ofori (2009) provide confirmatory evidence through the demonstration of
positive relationships between EL and TF, further reinforcing its moral component. Not only
this, but employee perceptions of charismatic leadership, which is considered akin to the
idealised influence facet of TF (Bass, 1990), is positively related to employees attributing the
organisation’s motives for CSR intrinsically (selfless, doing good), which in turn fosters
employee job satisfaction (Vlachos, Panagopoulos, and Rapp, 2013).

[54]
The behaviours falling under the subset of TF can all lead to socially responsible outcomes,
suggest Christensen et al. (2014). For instance, there is evidence that the intellectual
stimulation facet of TF in CEOs is related to strategic CSR activities of the organisation, thus
hinting at the influence of TF on CSR at the corporate level (Waldman et al., 2006). At the
technical level, sustainability focused TF leadership has also been shown to lead to
sustainable outcomes such as green product development (Chen and Chang, 2013). Du,
Swaen, Lindgreen and Sen (2013) demonstrated that greater TF leadership in an organisation
was positively related to greater CSR activities.
Whilst there is scant literature on TF and individual level social responsibility, Den Hartog
and Belschak (2012) evidence the positive relationship between TF and follower pro-activity,
through the effects of autonomy and self-efficacy. Moreover Zhu and Akhtar (2014)
highlighted the positive relationship between TF and employee pro-social/ helping
behaviours. Indeed it can be argued that socially responsible behaviours, such as
volunteering, are proactive behaviours, and thus could also be a resultant outcome of a TF
style of leading.
More specifically with regards to ESR, Robertson and Barling (2013) evidenced the positive
effects of environmentally specific TF on subsequent employee pro-environmental
behaviours; argued to be a sub-facet of ESR. Comparable to this, Graves et al. (2013)
demonstrated the beneficial effects of environmental TF behaviours on employee pro-
environmental behaviours; both directly and indirectly through engendering autonomous
motivation in employees. Furthermore, external motivation in employees was also related to
their pro-environmental behaviours, when environmental TF was high. Indeed, Chen and
Hung-Basecke (2014) provided evidence for certain leader behaviours, which they argue to
be parallel to some TF behaviours; in encouraging employee CSR participation in employees.
Namely these leadership behaviours were role modelling, which they argued to be akin to the
idealised influence dimension of TF, and advocacy behaviours, similar to the intellectual
stimulation dimension of TF.
This is partly reinforced by the fact that research has noted TF as being positively related to
employee stakeholder-focused CSR beliefs (Groves and LaRocca, 2011). Moreover, Groves
(2014) demonstrated that TF was positively associated with employee CSR stakeholder
values, whilst being negatively related to employee shareholder values. Thus employees
being led by a TF leader were more likely to engage in behaviours at work, whilst

[55]
maintaining stakeholder interests, as opposed to solely acting in the financial interests of
shareholders.
Zohar (2002b) suggested that such a style of leading helps to establish consistency in these
conflicting ESR behaviours, due to the various dimensions tapping into both in-role and
extra-role type behaviours, and creates shared group perceptions regarding the equivocal
importance of these behaviours. Such an argument is reinforced by Zohar (2000) who
demonstrated that the conflicting demands of pro-safety behaviours and efficiency can be
balanced through the appropriate supervisory action, with Zohar (2002a) further evidencing
that TF is useful for balancing such conflicting job/role demands employees face (e.g. Zohar,
2002a). Moreover, Clarke (2013) additionally showed that TF is useful in leading to
participation in safety behaviours, a behavioural category which has been noted to be in
conflict with efficiency-related behaviours (e.g. Zohar, 2010).
For these reasons, the current research focuses on the utility of TF in engendering ESR
amongst individuals and groups. Given that relationships between TF and ethical outcomes,
as well as more CSR specific outcomes have been highlighted, it is reasonable to assume that
it will be functional in aiding ESR behaviours, both at the group and individual levels. It is
proposed that TF specifically facilitates ESR by attempting to balance the conflict between
the various dimensions of ESR behaviours.
2.7.Mechanisms of leadership effectiveness
In the area of CSR, authors have utilised the stakeholder theory (Freeman, 1984) to explain
CSR actions as those which conform to stakeholder needs, expectations and requirements.
However, the purpose of the present study is to highlight the way in which TF leadership
leads to ESR at multiple levels, and therefore investigation into the explanatory mechanism
of employee behaviour, derived from the OB area, is necessary. For this purpose, a number of
theories can be examined which have attempted to examine CSR at the level of employees,
organisations, and/or related behaviours such as ethical and unethical conduct.
2.7.1. Social exchange theory
Blau (1964) defines two types of relationships, namely transactional and social exchange
relationships (see also Emerson, 1976). The former is concerned with reciprocal exchanges

[56]
such as employees fulfilling their job description and being paid accordingly by the
management. Blau (1964) defines social exchange in that it engenders “feelings of personal
obligation, gratitude and trust” (pg.94). In its application to TF leadership, this would mean
that in being treated fairly and supportively by these leaders, followers would subsequently
feel an obligation to also better themselves and attempt to go beyond their formal role
descriptions, and conduct themselves in a socially responsible fair manner; as they would do
in being pro-social.
It has been used by the likes of Herman, Huang, and Lam (2013) to explore the effects of TF
on employee turnover. In addition, Gond et al. (2010) used this framework to explain the link
between organisational CSR and employee level outcomes, such as OCBs and deviant
behaviours. More specific to ESR, Paillé and Mejía-Morelos (2014) discussed the positive
impact of perceived organisational support on employees’ pro-environmental behaviours;
through the explanatory framework of social exchange theory.
Whilst there is some research on the role of social exchange theory in reference to CSR, the
way in which they approach the social exchange process between leaders and followers,
excludes other relevant stakeholders which may be impacted by organisational CSR, through
this process (e.g. Willer, Flynn, and Zak, 2012). Additionally, there are very few research
efforts that apply the social exchange theory in relation to the study of TF (e.g. Tse et al.,
2013). The theory furthermore, does not seem to distinguish the means by which role conflict
can be overcome and employees subsequently directed to achieve, what may appear to be,
these conflicting ESR behavioural goals. An additional weakness is the theory’s disregard to
account for individual differences. More specifically, employees may vary in their strength of
exchange orientation, thus highly effective social exchange relationships may not lead to
extra-role behaviours per se, if the individual is low on exchange orientation (see Cropanzano
and Mitchell, 2005).
2.7.2. Social identity theory
The social identity theory proposes that the various group memberships of an individual, be
they formal or informal, such as organisational membership or affiliation with a particular
religious group, feed into the individual’s self-concept (Ashforth and Mael, 1989). In order to
enhance their self-concept, individuals seek to bolster the reputation of their group relative to
[57]
other groups. The theory proposes that employees want to be associated with organisations
with a positive image as this will enhance their self-concept (Maignan and Ferrell, 2001).
Research applying the social identity theory has shown that a positive external and internal
image of a company’s CSR helps to foster employee identification with the company, which
is further reinforced by CSR salience (Glavas and Godwin, 2013; Turker, 2009). This
enhanced employee identification can cultivate greater employee commitment to the
organisation (Kim et al., 2010). Research has further evidenced that job seekers are attracted
to organisations with higher corporate social performance ratings (Backhaus, Stone, and
Heiner, 2002). Organisational performance in terms of perceived social performance and
development is positively related to organisational identification, whilst perceptions of
corporate citizenship are related to greater commitment (Carmeli, Gilat, and Waldman, 2007;
Peterson, 2004).
Kark et al. (2003) noted the mediating effects of social identification between TF and
followers’ empowerment. In addition, De Roeck et al. (2014) demonstrated the mediating
influence of organisational identification, between perceived CSR and employee job
satisfaction. Similarly, Shen and Benson (in press) likewise evidenced the mediating effects
of organisational commitment between socially responsible human resource practices, and
task performance and extra-role behaviours. More specifically, in reference to ESR, Cha,
Chang, and Kim (2014) showed that employees are more likely to engage with pro-social
behaviours when they and/or their organisation had high pro-social identity.
On the basis of this, it is argued that TF may be helpful in facilitating ESR, by enhancing
employees’ identification with their organisation. As a result, employees will commit to the
organisation’s CSR agenda, and become active participants in it. However, whilst the theory
has been used widely to examine links between organisational CSR and employee
commitment and engagement for example (e.g. Collier and Esteban, 2007; Kim et al., 2010),
its application to the current research problem is problematic. To be more precise, it is able to
explain how employees may be encouraged to engage in ESR behaviours, but is unable to
elucidate how the conflict between the various behaviours can be effectively handled and
balanced, so that employees are able to engage in the various ESR behaviours without any
resultant negative repercussions. Furthermore it may be difficult to engender organisational
identification, leading to ESR, if employees themselves do not revere CSR (e.g. Rodrigo and
Arenas, 2008).

[58]
2.7.3. Social learning theory
Groves and LaRocca (2011) suggest that in order to explain the link between (TF) leadership
and attitudes towards CSR on part of followers, the use of social learning theory (SLT) can
be employed (Bandura, 1986). According to the SLT, when employees perceive the leaders
as credible role models, they seek to emulate their behaviour. In addition, the presence of a
reward/ punishment transactional relationship serves to further reinforce this. Vicarious
learning is also important, where followers observe their peers, for example being rewarded/
punished depending on their performance. The theory has been predominantly applied to the
EL literature, for instance in explaining the positive effects of EL on ethical employee
behaviours (Elmore, 2011). As well as demonstrating the connection between EL and
positive employee outcomes, it is also used to explore the influence of EL in deterring from
employee misconduct (Mayer, Kuenzi, and Greenbaum, 2010). More specific to the current
research, Chen and Hung-Basecke (2014) used the SLT to examine the effects of specific
leadership behaviours such as role modelling, considered akin to idealised influence in TF, on
ESR.
Whilst SLT has been used to commonly explain the effects of EL on ethical and unethical
conduct (e.g. Elmore, 2011; Mayer et al., 2010), it can be argued nonetheless that the utility
of SLT in explaining such effects is dependent upon the quality of the relationship between
the leader and follower, and the frequency of interaction for example (see Piccolo and
Colquitt, 2006; Piccolo, Greenbaum, Den Hartog, and Folger, 2010). Furthermore, it tends to
disregard the fact that human beings have free will at their disposal and can therefore choose
not to imitate the behaviour, however credible the model, especially if it goes against the
grain with regards to their own vested interests. Avolio (2007) states that “most leadership
research has considered the follower a passive or non-existent element when examining what
constitutes leadership” (p. 26). As a result it is suggested that rather than employees passively
imitating the socially responsible and ethical behaviours as modelled by their leaders, more
active processes are at work. Additionally individual differences are ignored; the behaviour
to be imitated by the individual may not be aligned with the values of the individual. Here
other theories which emphasis these values such as value congruence (see below) become
important.

[59]
2.7.4. Value-congruence
Value congruence builds upon the person-organisation fit theory, which suggests that a fit
between the values of the organisation and employees leads to beneficial outcomes such as
job satisfaction and organisational identification (Edwards and Cable, 2009). Value-
congruence is highlighted as a possible mechanism through which organisational CSR
impacts upon employees (Aguinis and Glavas, 2013). When there is congruency between
employee and organisational ethical values, ethical behaviour is propagated and unethical
behaviours are less likely to be tolerated (Burchard, 2011). Groves and La Rocca (2011) also
demonstrated how follower perceptions of shared stakeholder values with the leader, partially
mediated the relationship between TF and employee CSR attitudes and OCBs.
The value congruence theory proposes that TF primarily exerts its effects through
highlighting the congruency of follower values with leader/organisational values (e.g. Jung
and Avolio, 2000). As a result, followers internalise the goals of the organisation/ leader as
their own and thus commit extra effort towards them. The theory has been applied, for
instance, in order to understand the influence of TF on employees’ attitudes towards CSR and
their propensity for OCBs (Groves and LaRocca, 2011).
In attempting to apply this theory to TF leadership and ESR, one could argue that TF leaders
highlight the CSR values of an organisation and its policies, bring this to the followers’
attention, and attempt to underline how these are congruent with the followers’ values.
Followers thus feel that they and the company both have mutual objectives of being fair,
ethical and socially responsible; an objective which the employees can help to facilitate
through their enactment of ESR behaviours. Nevertheless, a shortcoming of such an approach
is that it is unable to explain how such congruency can facilitate ESR by balancing its
conflicting demands. Furthermore, it is difficult to ensure the functional value of this theory
as a motivational mechanism, if employees do not hold CSR dear to themselves.
2.7.5. Self-determination theory
The self-determination theory (Ryan and Deci, 2000) assumes that people are intrinsically
motivated to be responsible and perform at their best. However certain environmental
conditions are needed to foster this sense of intrinsic motivation. To cultivate constructive
social development, the core needs of competence, relatedness, and autonomy need to be
fulfilled. This can be met through high autonomy, feedback/communication to enhance

[60]
competence (relates to locus of causality; where individuals are more motivated when they
can see the success of their decisions and/or behaviours), and relatedness (identification and
attachment to organisation).
The theory further introduces concepts of internalisation and integration, where the individual
‘takes in’ the certain values, and then the values become part of the self-concept of the
individual respectively. This is important, in that after integration of the values with one’s
self-concept has taken place, any behaviours in favour of those values are not carried out as a
result of compliance or force, but rather because the individual wants to carry them out
(Gagne and Deci, 2005; Ryan and Deci, 2000). These integrated values can thus be
considered as an individual’s self-regulation process, the consequences of which can lead to
increased effort, wellbeing, and quality of decision making (e.g. Ryan, Kuhl, and Deci,
1997). Such a theory has been used, for instance, to understand the way in which individuals
are motivated towards environmentally focused behaviours (e.g. Pelletier, Tuson, Green-
Demers, Noels, and Beaton, 1998).
However one could argue that such socially responsible values, once internalised, may
impede job performance. The two can be considered contradictory in that more time is
needed to engage in the more extra-role ESR behaviours (e.g. social and philanthropy), which
can distract an individual from their core role duties (e.g. economic). Individuals may then
find themselves in dissonance as to whether to complete their role duties first, possibly
leaving little time for the extra-role ESR behaviours, or to prioritise certain behaviours over
others. More relevant to the proposed research, SDT focuses on attempting to elucidate
explanatory mechanisms as to why employees may engage in specific behaviours, as opposed
to the ways in which individuals can be motivated towards specific behavioural outcomes.
Therefore what is more relevant is to inspect the way in which employees regulate their
behaviour, and as such the regulatory focus theory (Kark and van Dijk, 2007), as discussed
next, may be particularly more suited.
2.7.6. Regulatory focus theory
Kark and van Dijk (2007) discuss the role of the promotion (PM) and prevention (PV)
regulatory foci; the former referring to employees being motivated to be eager, take risks, and
be creative, whereas the latter refers to a motivational focus where individuals are risk averse
and assiduous with regards to detail. The authors propose that TF and transactional

[61]
contingent-reward (CR) leaders prime PM and PV focuses respectively in followers, leading
to differential outcomes in employees. Such a theory has received empirical report from the
leadership literature (e.g. Hamstra, Van Yperen, Wisse, and Sassenberg, 2011; Moss, 2009;
Neubert et al., 2008; Stam, Knippenberg, and Wisse, 2010). For example, Neubert, Wu, and
Roberts (2013) demonstrated how a PM focus resulted in extra role voice behaviours, whilst
a PV focus led to compliance. Furthermore, Wallace, Butts, Johnson, Stevens, and Smith (in
press) evidenced the positive effects of an interaction between a PM focus and an innovation
climate in leading to greater innovation. To date, this framework has not yet been employed
in the context of CSR.
In its application to ESR, one could argue that the different facets of the ESR construct
require different motivational focuses. For example, the economic and environmental facets
require a PV focus, due to the necessary attention needed to following rules, regulations, and
procedures, whilst a PM focus may be more suitable for the social, stakeholder and
philanthropy facets; since these require individuals to go beyond their role and discover
creative and novel ways of working, in order to for example, to organise charitable initiatives.
The same leader, with their emphasis on TF and CR leader behaviours, could thus prime a PV
focus leading to fulfilment of role duties, and compliance with environmental and economic
policies and procedures, and a PM focus which would lead to engagement in philanthropy,
social and stakeholder focused behaviours; thus the same leader draws the followers’
attention to all the behaviours within the construct of ESR. There are of course other benefits.
For example, evidence suggests that a fit between leader and employee regulatory focus,
resulting from TF and CR behaviours, causes employees to feel valued by their leaders
(Hamstra, Sassenberg, Van Yperen, and Wisse, 2014).
This theory has also been employed in the safety literature. For instance, Wallace (2004)
showed that a PM focus positively predicted speed and negatively predicted safety (explained
by the risk-taking nature of the PM focus), and the PV focus negatively predicted speed and
positively predicted safety, thus attesting to the cautious and risk-averse nature of the PV
focus. Burtscher and Meyer (2014) also noted that at the group-level, regulatory focus
differentially impacted upon decision-making quality, as mediated by group information
processing.
Interestingly, Mitchell and Zhang (2004) examined conflicting goal demands in consumer
product choice. They showed that those in a PM focus were more likely to focus on higher

[62]
level goals as opposed to the lower level goals (i.e. ‘being healthy’ = apple versus ‘cooling
off’ = ice cream), whereas the opposite was true for those in a PV focus. This research can be
extrapolated to the field of ESR; here the facets of economy and environmental could reflect
lower level goals, whereas stakeholder, philanthropy, and social could be indicative of higher
level goals. Another important feature of such a theory is that takes into account contextual
influences as opposed to other theories, such as the SLT. The regulatory focus theory agrees
that contextual influences determine the internalisation and integration of values (e.g. Shamir,
House, and Arthur, 1993).
Nevertheless, to date, there has been limited evidence for the theory’s utility in the domain of
CSR, as well as for the clear role of prevention focus (e.g. Moss, 2009; Neubert et al., 2008).
One possible explanation could be that with regards to the latter, the argument that CR
engenders prevention focus in followers, consequently causing them to be cautious, diligent,
and risk-averse in their day-today work activities, does not hold much weight. Rather, CR
provides exchanges for satisfactory behaviour, and so instead should motivate followers’
work behaviour so that they can reap the according rewards. This brings into question the
suitability of the complete theory in relation to facilitating the various ESR behaviours.
2.7.7. Goal setting theory
Goal-setting theory, as proposed by Locke and Latham (1990), puts forward the motivational
influence of effective goal setting. Goals are said to guide performance through four
mechanisms (Locke and Latham, 2002). Firstly they direct attention towards goal relevant
activities. Secondly they energise individuals, and in doing so, lead to greater exertion of
efforts. Thirdly, goals cause individuals to be more persistent in their efforts to achieve them,
and finally, they activate goal-relevant knowledge and strategies that can aid in achievement
of the goal. It is argued that the effects of goal-setting are reliable enough that any findings
which find little support, usually are riddled with errors; for example, in not matching goals
to performance (Locke and Latham, 1990). So much so, that Locke and Latham (2002) stated
that “goal-setting theory is among the most valid and practical theories of employee
motivation in organisational psychology” (pg. 714). Furthermore, efforts are also made to
appreciate the goal-conflict that may occur when employees are presented with a number of
conflicting goals, which causes them to prioritise one set of behaviours over the other (Locke,
Smith, Erez, Chah, and Schaffer, 1994).

[63]
Related to the concept of goal-setting is self-efficacy, defined as the individual’s self-belief
that they are capable (Bandura, 1986). Individuals who are higher in self-efficacy are more
likely to set difficult goals, and are also more likely to commit to the goal, and employ the
relevant task skills and knowledge to achieve it (Locke and Latham, 1990). In addition,
commitment to goals is touted as a key moderator in the relationship between goal-setting
and performance (Locke and Latham, 2002). Here the role of leadership can be noteworthy in
engendering commitment to the goals, as well as enhancing individual’s self-efficacy (Bass,
1990; Locke and Latham, 2002).
In relation to CSR, Collier and Esteban (2007) make the argument that in order for employees
to respond to and deliver on an organisation’s CSR requirements, their motivation to do so, as
well as committing to attaining the goals of responsible behaviour, is important. They
highlight the utility of goal-setting in engendering motivation in employees. Moreover, when
looking at the role of employees in supporting sustainability initiatives, Morsing and Oswald
(2009) highlight the importance of communicating goals. It is even stated that, “having
sustainability goals and objectives encourages employees to incorporate sustainability into
their day-to-day activities” (Quinn and Dalton, 2009; pg. 30).
Galpin and Whittington (2012) point towards the prominent role of leadership in promoting
sustainability initiatives. The utility of goal-setting is consistently noted in the literature,
especially in conjunction with leadership. For example Colbert and Witt (2009) demonstrated
the positive effects of a leader who was goal-focused, that is, he/she clarified goals and
priorities. Whittington, Goodwin, and Murray (2004) further showcased the positive
moderating effect of goal setting between TF, and affective commitment and performance.
It is proposed that goal-setting provides a credible explanation for why TF should be effective
in engendering ESR. On the basis of the theory, it is put forward that TF exerts its positive
influence on ESR by setting challenging, motivating, and effective social responsibility-
related goals for employees. By setting these effective goals, employees attend to the goals
and are energised towards achieving their goals, they are more persistent in their efforts, and
they employ relevant knowledge and strategies, related to social responsibility practices
(Locke and Latham, 1990). The TF leader further supports employees’ goal-directed efforts
and enhances employee self-efficacy to achieve these goals; as well as their commitment to
these goals, and provides feedback in order that the employees can monitor their progress
towards goal-attainment (Bass, 1990). Furthermore, the TF leader ensures goals are focused

[64]
on ESR as a holistic outcome, without prioritising some dimensions over others; helping
therefore to balance the conflict between the various ESR behaviours.
At the group level, it is argued that TF causes the group to go beyond their individual interest
(Bass, 1990). It is suggested that the TF leader works in a homologous fashion at the group
level as at the individual level, and focuses on setting motivating and challenging effective
ESR goals for the team. In addition to inspiring and supporting the team in their goal-directed
efforts; the TF leader manages intra-group activities (Yukl, 1999). Moreover, TF leaders
should ensure that the goals of the individuals are consistent with their team level goal, of
engaging with the full range of ESR behaviours, thus avoiding conflict between the
individual and team level, which would also cause employees to prioritise between individual
and group level goals (DeShon, Kozlowski, Schmidt, Milner, and Weichmann, 2004). Doing
so, ensures that the team is energised to exert effort towards their ESR goals, to be persistent
in their efforts as a team, and draw upon the various skills and expertise present within the
team to ensure success in becoming socially responsible.
It is contested however that TF alone is not sufficient. Whilst TF may set effective goals and
motivate employee goal-attainment efforts, it needs to be ensured that TF leaders are drawing
employees’ focus towards CSR. In so doing, the noteworthy role of assigned CSR priority is
put forward, which gives TF a CSR focus for its behaviours, and which manages employee
expectations of CSR. Furthermore, TF in conjunction with this assigned CSR priority will not
be optimally effective, if it is operating under a context in which CSR is not made salient;
hence the crucial role of CSR climate is underscored. As noted previously, conflicting
behavioural goals can cause employees to experience goal conflict, which causes them to
prioritise one set of behaviours over the other (Locke et al., 1994). However assigned CSR
priority and CSR climate work together to avoid this, and do so by highlighting the
importance of ESR for employees, collectively working to circumvent employees
experiencing goal-conflict with regards to the various dimensions of ESR, and by
consistently placing focus on the full spectrum of ESR. The roles of assigned CSR priority
and CSR climate will be discussed below.
2.8.Assigned CSR priority
In facilitating ESR, the notable role of assigned CSR priority is put forward, modelled on the
original construct of assigned safety priority, proposed by Zohar (2002a). It is argued that this

[65]
assigned CSR priority provides the value free behaviours of TF, with a focus on CSR (Fu,
Tsui, Liu, and Li, 2010). In doing so, employee attentions are directed towards CSR. Leaders
prioritise CSR and thus manage employee expectations of the importance of CSR. As per the
goal-setting theory, TF in conjunction with this assigned CSR priority sets ESR-specific
goals for employees, and TF behaviours ensure employee commitment and motivation
towards these goals.
When examining how the multi-faceted ESR behaviours can be encouraged within groups
and individuals, attention needs to be paid to the apparent conflict within such behaviours
(Aguilera et al., 2007). On the one hand, you have the more in-role behaviours of ESR such
as the economic behaviours which expect employees to comply with the work standards that
are expected from them. On the other hand, you have the more extra-role behaviours such as
philanthropic behaviours which encourage employees to go beyond their formal day-to-day
work activities and engage in activities not part of their core duties, such as engaging with
charitable endeavours. In order to encourage employees to engage with the multiplicity of
ESR behaviours, this conflict between the various dimensions needs to be balanced.
Conflict has been defined as “a situation in which oppositely direct, simultaneous acting
forces, of approximate equal strength, work upon the individual” (Lewin, 1935; pg. 123).
Research has shown that when employees are faced with multiple goals targeting different
behaviours, they may prioritise one over the other (e.g. Schmidt, Kleinbeck, and Brockmann,
1984). For instance, when a conflict is imposed between a focus on quality standards as
opposed to production targets, then employees neglect one of the two (Locke et al., 1994).
One of the focuses of the current research is the way in which TF can be helpful in
encouraging social responsibility engagement, by balancing the conflict between these
behaviours. Leaders, who display TF behaviours, are said to motivate followers, inspire them,
challenge them, and support them (Bass, 1990). However as it stands, TF behaviours are
value free (e.g. Fu, Tsui, Liu, and Li, 2010). That is, they may do all of these things, however
the question becomes, towards what are these TF leaders motivating, inspiring, challenging
and supporting followers towards, and how can they encourage them to engage with ESR in a
holistic fashion?
Accordingly, efforts have been made by a few researchers in giving these TF behaviours a
focus, and measuring the effects of these focused TF behaviours on work outcomes. For
example, Morhart, Herzog, and Tomczak (2009) demonstrated the utility of brand-specific

[66]
TF in encouraging employee brand-building behaviours. Whilst in relation to safety research;
Barling, Loughlin, and Kelloway (2002) noted the positive effects of safety specific TF on
safety performance.
Morhart et al. (2009) and Barling et al. (2002) focused on the effects of TF-specific
behaviours on the according outcomes. Similar in nature, yet distinct in operationalization,
was the study conducted by Zohar (2002a). He addressed the value-free conundrum of TF
and made the case for ‘assigned safety priority’, which was demonstrated to moderate the
relationship between leadership and climate. This assigned safety priority was conceptualised
as the extent to which leadership prioritises safety, without neglecting it in favour of more
production-related behaviours.
In this respect, the novel role of assigned CSR priority is proposed in this research. This is
modelled on the assigned safety priority construct as developed by Zohar (2002a), and
examines the extent to which TF prioritises CSR, and helps to balance the conflict between
the various ESR dimensions, by managing CSR-related expectations of employees. More
precisely, assigned CSR priority is defined as the degree to which TF prioritises CSR and
focuses on CSR in their day-to-day interactions with employees, without providing
conflicting messages, and provides consistency of communication of the importance of CSR
engagement, in the form of ESR behaviours. It is proposed that this assigned CSR priority
will moderate the relationship between TF on group and individual ESR, by providing a CSR
value to TF behaviours, and overcoming the problematic focus-free nature of TF behaviours;
consequently helping to balance the experience of conflict within employees in regards to the
multi-faceted ESR behaviours. It ensures that employees do not prioritise some ESR
behaviours over others, rather they engage with the full five dimensions. This combination of
TF with a high assigned CSR priority is consequently crucial in evading goal-conflict, which
is imminent, given the conflicting nature of the ESR behaviours from within the different
ESR dimensions.
The original construct of assigned safety priority was examined at the group-level (Zohar,
2002a). Nevertheless, it is maintained that the effects operate similarly at the individual level.
As per the goal-setting theory, at the group level, the leaders set goals and direct their
attention towards ESR, by managing the team’s expectations of the importance of ESR. The
leader facilitates the dynamics within the team, and collectively motivates them towards goal
attainment. The team feels encouraged by the behaviours of their TF leader, and through a
[67]
high assigned priority to CSR, they understand the importance of actively engaging in ESR in
order to be a socially responsible unit. At the individual level, the leader attends to the
individual needs of the employees, sets ESR-related goals, taking into account their unique
skills and abilities, and relevantly supports their goal-directed efforts. The leaders assign a
high priority to CSR, and consequently makes lucid for the employees, the importance of
engaging with the full spectrum of ESR.
2.9. CSR Climate
As noted above, TF can only partially explain the effects on ESR. Instead, contextual factors
need to be accounted for, in order to understand how employees are motivated towards ESR-
specific behaviours, and how goal-conflict between the various ESR behaviours is shirked.
Contextual factors are important in informing individuals of the desired and non-desired
behaviours, thus shaping their subsequent actions (Nadelson, 2006). An important contextual
factor in doing this, in management research, is psychological climate. The psychological
climate of an organisation is often discussed as an individual’s perceptions, or groups of
employees, regarding the policies, procedures, and practices of the company (e.g. Schneider,
1990). From a multilevel perspective it is believed that policies and procedures are set at top
management/ organisational level, which are subsequently translated into practices at the
lower group/individual levels (e.g. Zohar, 2000).
When these perceptions are shared by a group or an organisation, they are referred to as
group or organisational climate (Neal and Griffin, 2006). Whilst psychological climate refers
to the general climate at the group/ organisational level, there can be specific types of
climates which reflect specific facets of the organisational/ group environment (Neal and
Griffin, 2006). For example, a safety climate would thus refer to specific
organisational/group policies, procedures, and practices relating to safety at work (e.g. Zohar,
2010). The effects of specific organisational/ group climates on work outcomes such as
ethical behaviours, safety behaviours, and organisational citizenship behaviours have been
widely documented (Appelbaum, Deguire, and Lay, 2005; Hofman et al., 2003; Peterson,
2002; Schneider and Snyder, 1975; Schneider and Reichers, 1983; Trevino, Butterfield, and
McCabe, 1998; Walumbwa et al., 2010). Specifically, in the current thesis the role of a CSR
climate will be honed into, as ensuring a consistent and salient focus on the full spectrum of
CSR in conjunction with assigned CSR priority, to preclude the experience of employee goal
[68]
conflict. Particularly, the moderating role of this CSR climate is postulated in that it
strengthens the effects of TF on ESR both at the group and individual levels, by providing a
conducive and supportive climate that reinforces the saliency and significance of CSR.
Research has noted the direct effects of climate on employee outcomes such as job
satisfaction and commitment (Fu and Deshpande, 2014). In many cases, research investigates
the indirect effects of a climate, by looking at both the mediating role of climate, as well as its
moderating effects. An effective climate has been shown to mediate the relationship between
leadership and group performance (e.g. Mayer et al., 2010; Wu et al., 2008; Zohar, 2002a).
Downey, van der Werff, Thomas, and Plaut (2014) also demonstrated the mediating role of a
climate for trust between the effects of diversity management practices on employee
engagement.
More specifically, the current study is interested in the moderating role of climate, and this
has been confirmed by numerous findings (e.g. Hofman et al., 2003; Kapp, 2012). For
example, the moderating role of psychological climate between leader-member exchange
(LMX) quality and role overload has been evidenced (Tordera, González-Romá, and Peiró,
2008). Jiang, Yu, Li, and Li (2010) have also demonstrated the positive effects of perceived
colleagues’ safety knowledge/ work behaviour on safety behaviours, under conditions of a
positive climate for safety. In conjunction with TF, a climate for innovation moderates the
relationship between perceptions of TF and employee adaptive performance (e.g.
Charbonnier-Voirin, El Akremi, and Vandenberghe, 2010). Similarly, a climate for initiative
facilitates the effects of TF on innovation implementation behaviour (Michaelis, Stegmaier,
and Sonntag, 2010). Analogous findings have also been evidenced at the group level
(Eisenbeiss, van Knippenberg, and Boerner, 2008).
In the present research however, the focus is on CSR, and so interest is directed towards a
CSR-specific climate. Previously, practical examples have been highlighted which
demonstrate the way in which organisational CSR policies can encourage employees to
suitably comply with and translate social responsibility to their level (Dutton and Dukerich,
1991). To date however, very little research has focused on conceptualising and testing the
role of a CSR-specific climate, or its closest proximate, on CSR related work outcomes (see
El Akremi, Gond, Swaen, De Roeck, and Igalens, in press). The little research that has
focused on CSR-related climate, has for instance, demonstrated the mediating effects of a
green work climate between employee perceptions of sustainability behaviours, with their

[69]
green work behaviours (Norton et al., 2014). In terms of the moderating effects of such a
climate, Yim and Fock (2013) showed that a social responsibility climate had a moderating
effect on the relationship between pride in volunteer work and volunteer work as a calling, on
subsequent employee perceptions of the meaningfulness of volunteer work.
Given the above research evidence, it is sensible to assume that a climate for CSR will
moderate the effects of TF on employee CSR outcomes. We define this CSR climate as the
shared perceptions amongst employees of the CSR policies, procedures and practices, both at
the group (see time-lagged study) and organisational level (see field study). A positive CSR
climate signifies a climate in which employees feel the organisation/ group places great
importance on CSR and supports employees to contribute to the group/ organisation’s CSR
efforts. We conceptualise this climate at the group and organisational level through a direct
consensus model (Chan, 1998).
As noted above, when employees are faced with conflicting behavioural goals, they will
resort to prioritising one over the other (Locke et al., 1994). It is suggested that when
however the CSR climate is positive, this reinforces the salience of CSR and provides a
consistent message that the organisation holds CSR dear. Furthermore, rather than for
example emphasising some facets, which are more rule-abiding in nature (e.g. economic), it
focuses on the full spectrum of social responsibility behaviours. Employees as a result do not
experience goal conflict, and do not have to resort to making the choice of which behaviours
to prioritise. Indeed the utility of a safety climate in marrying the seemingly conflicting
demands between safety behaviours and efficiency behaviours has been consistently verified,
and similar effects are subsequently expected in relation to this CSR climate (e.g. Zohar,
2002a).
This relationship again is expected to operate in a homologous manner at both the individual
and group levels. Research has evidenced the moderating role of climate on individual and
group level outcomes (e.g. Eisenbeiss et al., 2008; Liao and Chuang, 2007). At the group
level, consensus amongst team members regarding the presence of a positive climate for CSR
ensures that they feel supported to engage in the various ESR-related behavioural team goals,
as set by their TF leader. At the individual level, similarly individuals refer to the CSR
climate, and if this is positive, they feel motivated and supported to exert effort in achieving
their individual ESR goals. As per the goal-setting theory, this positive CSR climate
communicates a consistent message on the importance of CSR in general, and the full

[70]
spectrum of ESR specifically, thus ensuring individuals and teams do not experience conflict
regarding their various ESR behavioural goals (e.g. Locke et al., 1994). As a result, they will
seek to embrace the various ESR activities, in order to become more socially responsible.
2.10. Summary
In this chapter, efforts were made to explore the current state of affairs in the research on
CSR. Specifically, in introducing the review of past literature, the determinants and the
organisational benefits of actively engaging with CSR were briefly outlined. The spotlight
subsequently was placed on the research niche surrounding CSR, such that, the scarcity of
research on employee behavioural engagement with CSR at the micro-levels was noted. The
case was made for the requirement of a micro-level employee social responsibility
measurement tool, in helping to address this niche and furthering research efforts at the
micro-levels of CSR. The antecedents of ESR were explored, as well as possible underlying
frameworks. The next chapter (chapter three) outlines the conceptual development, and
provides a more specific discussion on the interactive relationships between the postulated
antecedents of TF, assigned CSR priority and CSR climate on ESR at the group and
individual levels.

[71]
Chapter 3: Model development
3.1.Introduction
The objective of the following chapter is to outline the conceptual model detailing the
antecedent and boundary conditions of employee social responsibility (ESR), that is
transformational leadership (TF), assigned CSR priority, and CSR climate, and the postulated
way in which they exert their effects, as underpinned by goal-setting theory (Locke and
Latham, 2002). Specifically, as outlined in the literature review (chapter two), the noteworthy
roles of TF, assigned CSR priority, and CSR climate are purported to provide optimal
conditions to encourage ESR in the workplace. Through the application of goal-setting theory
(Locke and Latham, 1990), it is consequently argued that TF, assigned CSR priority and CSR
climate facilitate ESR by way of setting challenging social responsibility related goals,
motivating and supporting employees’ goal-directed efforts to attain these, and ensuring that
the goal-conflict between the various facets of ESR is minimised.
As noted in chapter two, inherent in the nature of these ESR behaviours is the apparent
conflict between the various dimensions. On the one hand employees are expected to engage
in more in-role behaviours such as those falling within the economic dimensions, whilst also
being expected to engage in the more extra-role behaviours, such as those falling within the
social dimension of ESR (e.g. Aguilera et al., 2007). This conflict within ESR behaviours is
also resonated in other employee outcomes such as safety behaviours, where employees are
required to ally the demands of efficiency and safety consciousness in their day-to-day
activities (Zohar, 2010).
In balancing this conflict, the current research puts forward the noteworthy roles of TF,
assigned CSR priority and CSR climate, in providing the optimal conditions for employee
and group CSR engagement. The goal-setting theory (Locke and Latham, 2002) is used to
illustrate the ways in which TF can facilitate group and employee social responsibility by
setting challenging goals, and motivating, supporting, and inspiring employees to achieve
these goals. Assigned CSR priority underscores the ways in which leaders manage employee
expectations regarding these goals, thus helping to balance the inherent conflict within these
multi-dimensional ESR behaviours (Katz and Kahn, 1964). Finally, CSR climate outlines the
CSR policies and procedures, and ensures these are not contradictory to the former two, thus

[72]
preventing the experience of conflict upon incumbents with regards to these social
responsibility behaviours, through consistency of communication of the importance of ESR.
TF has been shown to be helpful in balancing conflicting demands of various employee
behaviours (Bass, 1990). For example, with regards to the safety literature, Kapp (2012)
highlighted the utility of TF in facilitating safety compliance. Nevertheless, it is proposed that
TF individually is not sufficient in garnering employee commitment to the various ESR
behaviours, primarily because TF in itself is value-free (Fu et al., 2010). Rather what is
needed is a CSR focus to TF, in the form of assigned CSR priority. Assigned CSR priority is
a novel construct introduced within this research, modelled on the construct of assigned
safety priority as proposed by Zohar (2002a). This assigned CSR priority manages employee
expectations of social responsibility and ensures that employees are made aware of the need
to engage with CSR holistically. As a result, the moderating role of assigned CSR priority on
the effects of TF on ESR behaviours is put forward, both at the group and individual levels.
Whilst TF may exist in tandem with a high assigned CSR priority, employees may still
experience conflict if wider organisational conditions are not conducive to ESR; for instance
minimal salience of CSR, and so here the role of a CSR climate is proposed. This outlines the
policies and procedures with regards to CSR at the organisational level, and communicates a
consistent message to employees of the importance of CSR. That is, in addition to their TF
leader assigning a high priority to CSR, their organisation also underscores the importance of
CSR through its policies and procedures, and so ensuring that employees are receiving a
consistent message. Collectively, TF, with a high assigned CSR priority, working under a
positive organisational CSR climate, provides ideal conditions for ESR. It is proposed
therefore that climate moderates the relationship between TF and ESR behaviours at the
group and individual level, both individually and interactively in conjunction with assigned
CSR priority.
The present study examines these factors in a multi-level model in order to investigate
determinants of group and individual ESR, and so addresses calls for a multi-level
perspective to be taken when studying the effects of TF (e.g. Avolio et al., 2009; Yukl, 1999).
The interactive effects of assigned CSR priority, TF, and CSR climate were examined at the
group level, as well as looking at assigned CRS priority and TF at the individual level, in
addition to the cross-level effects of CSR climate; thus also addressing the contextual
determinants of the effects of TF (Yukl, 1999).

[73]
3.2.Theory and hypotheses development
In chapter two, it was highlighted that a significant issue in studying CSR at the micro level,
especially with regards to employee involvement, is the way in which ESR is currently
conceptualised. For example, whilst research by Vlachos et al. (2014) examines the factors
affecting employee participation in CSR, they do so by conceptualising employee behaviours,
in the form of employee suggestions to improve the organisation’s current CSR activities;
hence lacking specificity. Consequently, in the current thesis, ESR was conceptualised as a
multi-dimensional construct, consisting of the social, philanthropy, stakeholder,
environmental and economic dimensions, as informed by previous research (Dahlsrud, 2008;
Rupp and Mallory, 2015). Social behaviours are behaviours employees engage in which are
directed towards the community, whilst philanthropic behaviours concern charitable
behaviours such as fundraising for specific causes. Stakeholder behaviours are behaviours
such as respect directed towards ones colleagues, whereas environmental behaviours concern
the environment at large and include recycling, and finally economic behaviours are those
which focus on being cost-efficient, which inevitably impact upon the bottom line.
However the concern then becomes as to how we can encourage these multi-dimensional
ESR behaviours simultaneously in employees. These ESR behaviours consist of behaviours
which are more voluntary and extra-role in nature, such as volunteering in community
projects (social), as well as more in-role behaviours which tap into core work duties such as
completing work to a sufficient standard (economic). This dichotomy has been noted in the
safety literature between efficiency and safety behaviours, and one of the key mechanisms to
help balance these conflicting demands placed on the incumbents is proposed to be
leadership, and in the present research, the case is made for the utility of TF (Zohar, 2010).
3.2.1. Antecedents of ESR
It is argued that TF can encourage ESR through setting challenging goals, and motivating
employees’ goal-directed efforts (Locke and Latham, 2002). Furthermore, they provide
employees with the relevant support, outline the organisation’s CSR vision, and inspire them
to attain their goals, and in doing so contribute to this vision (Bass, 1990).
These TF behaviours however are value-free and not sufficient alone to engender ESR (Fu et
al., 2010). So, whilst leaders may motivate employees, and inspire and support them, the
focus of these leader behaviours ultimately needs to be on CSR. With reference to the safety

[74]
literature, this safety-specific focus has been explored. Barling et al. (2002) looked at safety-
specific leadership behaviours in ensuring that efficiency is not prioritised at the expense of
safety-consciousness. Moreover, and more specific to the current research, Zohar (2002a)
examined the role of assigned safety priority; that is, the extent to which leaders manage
safety expectations. As a result, it is argued that along with TF leader behaviours, it is vital
that these leaders also assign a high priority to CSR, and manage CSR expectations in
individuals so that they understand what is expected from them.
Nevertheless, the role of TF in encouraging group and individual ESR is limited, even with
this CSR focus, without the presence of an environment conducive for ESR, in which
employees can be encouraged and supported to demonstrate these behaviours. An
environment conducive for ESR outlines CSR policies and procedures at the organisational
level and thus is consistent with CSR-focused TF. Whereas a climate that is unfavourable in
this regard, does not highlight organisational policies and procedures around CSR, and as a
result employees may feel that whilst their TF leader assigns priority to CSR, their
organisation does not, which hampers their motivation to engage in ESR behaviours.
Research has noted the positive effects of specific climates, such as a climate for innovation,
in encouraging innovative behaviours in individuals, in conjunction with TF (Charbonnier-
Voirin et al., 2010). Thus it is argued, that the existence of a novel climate for CSR is needed
to provide favourable conditions for encouraging ESR.
In the present thesis therefore, the interactive effects of TF, assigned CSR priority, and CSR
climate are investigated. It is argued that together, these three factors provide the most
favourable conditions for engendering ESR. They do so by setting ESR-specific goals, and
supporting and motivating employees towards these goals, and ensuring that through a high
assigned CSR priority, and CSR climate; CSR is made salient within the organisation at the
employee level, and a lucid and unswerving message is sent out regarding the importance of
CSR to the organisation, thus deterring from potential goal-conflict in employees.
3.2.2. Transformational leadership and ESR
Transformational leaders are defined as leaders that motivate and inspire their employees to
go over and beyond their daily duties (e.g. Bass, 1990). According to Bass (1990), TF
leadership consists of four facets, namely intellectual stimulation, inspirational motivation,
idealised influence, and individualised consideration. Intellectual stimulation is the extent to

[75]
which the leader engages with followers to consult with them, he/she challenges followers to
develop novel ways of working, and critically questions their way of doing things.
Inspirational motivation involves the leader developing a vision which is attractive to
followers, motivating them to work towards this vision, and instilling confidence in them.
Idealised influence reflects the moral leader that takes a stand for what he/she believes in, one
that garners respect from his/her followers, and communicates core values. And finally,
individualised consideration reflects the extent to which the leader attends to each
individual’s needs, focuses on developing them, and provides the necessary support, uniquely
tailored to each individual.
TF has had its impact on positive employee outcomes consistently established, with these
outcomes ranging from satisfaction with leader, job satisfaction, to organisational citizenship
behaviours and counterproductive work behaviours, to name but a few (e.g. Judge and
Piccolo, 2004; Lowe et al., 1996). By its definition, TF has been highlighted as having an
ethical/moral component (Bass, 1997; Rowold, 2008). Christensen et al. (2014) speculate that
the various behaviours of TF could be useful in encouraging ESR, further supported by
evidence which points to the relation between TF leadership in CEOs with strategic CSR
within the organisation (Du et al., 2013; Waldman et al., 2006).
Indeed, TF has been documented to foster greater CSR stakeholder-focused beliefs (Groves
and LaRocca, 2011).Whilst research linking TF to CSR-specific employee outcomes is
limited; Den Hartog and Belschak (2012) have shown that TF is helpful in encouraging
employee pro-activity in general. Despite the fact that organisations may comply with CSR to
a certain extent due to institutional regulations, social responsibility engagement at the
employee level is in its spirit, proactive. Thus we can draw parallels between research that
demonstrates the utility of TF in promoting positive outcomes such as employee pro-activity
and extra-role behaviours (e.g. Podsakoff et al., 1990), with the present research where the
role of TF in prompting the range of ESR behaviours is surmised. Whilst TF may therefore
not have been directly examined in relation to individual and group ESR behaviours, given
that it is seen as a key driver of positive employee work outcomes such as pro-active and
extra-role behaviours, and related to CSR engagement in general; for this reason it is also
speculated to be a positive precursor for social responsibility at work.
The means by which TF is thought to exert its effects on employees, leading to subsequent
positive outcomes, is through goal-setting (Locke and Latham, 2002). Goals have a well-

[76]
noted motivational effect (Locke and Latham, 1990). Consequently, TF serves to motivate
employees by setting challenging CSR-relevant goals and thus directing employees’ efforts
accordingly. Indeed, it is suggested that goal-setting can maximise a leaders positive effects
on performance (Ronan, Latham, and Kinne, 1973). Furthermore Locke and Latham (2002)
argue that leaders play a key role in facilitating goal-motivated efforts through enhancing
employee self-efficacy by expressing confidence in them to achieve the goals, acting as role
models, and ensuring that employees have the necessary skills and capabilities needed to
successfully attain their goals.
Thus it is argued that the four facets of TF in combination can promote ESR in individuals
and groups by means of enhancing their self-efficacy, so they come to believe that they have
the necessary capabilities to enact ESR behaviours in their roles. The idealised influence facet
denotes that the leader highlights the importance of CSR and communicates its role in the
daily activities of employees, as well as providing employees with a credible role model
which they can identify with, and use as a mechanism for engaging in observational learning
(Podsakoff et al., 1990). The inspirational motivation behaviours inspire and develop
confidence in employees to embrace the organisation’s CSR program and to involve it within
their work. Finally, behaviours within the intellectual stimulation facet challenge employees
to develop unique ways of integrating CSR concerns within their work, whilst the
individualised consideration behaviours support employees in their social responsibility
endeavours, and provide coaching to further enhance their efficacy of engagement.
Whilst much of the research has tended to focus on TF at the individual level, it can also be
conceptualised as a group level phenomenon (e.g. Korek, Felfe, and Zaepernick-Rothe, 2010;
Yammarino, Spangler, and Dubinsky, 1998). It is noted that interactions within the group
serve to reinforce similar perceptions of leadership between group members (e.g. Gavin and
Hofmann, 2002). Research has evidenced how group-level TF can be effective, in for
example, engendering affective commitment in groups, as well as enhancing performance
(Korek et al., 2010; Schaubroeck, Lam, and Cha, 2007). It is suggested that “leadership may
have its most important consequences for teams and thus a focus on the team level is also
important” (Lim & Ployhart, 2004, p. 610)
Indeed one of the propositions of TF theory is the leader influencing individuals to go beyond
their self-interests for the betterment of the group; thus leadership tends to involve behaviours
directed towards a group in general (Bass, 1990). Furthermore, Yukl (1999) notes the role of
[77]
TF leaders in co-ordinating intra-group activities. This leader accordingly sets goals of
enhancing involvement in ESR at the group level, and as a result, motivating goal-directed
behaviour within the group. In addition, TF can also aid greater performance in groups
through managing group processes such as social loafing (Kahai, Sosik, and Avolio, 2000).
Similarly, TF is also an individual level phenomenon and acts uniquely towards each of its
followers, in order to influence their attitudes and behaviours. There is evidence that TF is
related to outcomes at the individual level, with individual followers possessing a unique
view of their leaders as a result of individual differences (e.g. Yammarino and Dubinsky,
1994). Here Yammarino et al. (1998) support the individual level of analysis for TF by
making the case that individuals perceive their leaders in differential ways, and similarly
leaders also perceive each of their followers in unique ways. The authors state that due to
implicit theories of leadership, leaders and followers have their own perceptions of leaders
and leader behaviours, due to their individualised information processing. Indeed within the
conceptualisation of TF, whilst they cause followers to act towards the overall group goals
and interests, it also focuses on attending to individual needs, and supporting and motivating
them towards their own individual goals (Bass, 1990).
Thus in the current study, it is proposed that TF exerts its influence both at the group and
individual levels. At the group level, TF causes the group to identify with the overarching
goal of promoting group ESR behaviours, regardless of individual dispositions, motivations,
and abilities. The leader focuses on motivating the group to this collective goal, and in
facilitating positive within-group interactions. Whilst at the individual level, TF attends to the
needs of each individual, supports them in attaining relevant ESR behavioural goals, and
addresses their developmental needs. The TF leader at the individual level focuses on
motivating each follower based on their own unique interests and dispositions, and in doing
so differentially motivates them to achieve their individualised ESR behavioural goals.
However this idea of TF leadership encouraging CSR engagement in employees and groups
is not so straightforward. It is not a case of certain leadership behaviours, engendering
specific employee behaviours in an unwavering fashion, rather as Bass (1999) noted, ‘‘much
more explanation is needed about the workings of transformational leadership’’ (p. 24). The
need to specify the context within which TF operates has become increasingly important (e.g.
Avolio et al., 2009; Yukl, 1999). In the present thesis, the roles of assigned CSR priority and
CSR climate are held as importance contextual determinants which can help foster this

[78]
relationship between TF leadership and employee social responsibility, through their effects
on clarifying goals and priorities. Figure 3.01 depicts the proposed conceptual model.
Figure 3.01
Proposed conceptual model
Group Level
Individual Level
3.2.3. Moderating role of assigned CSR priority
The present research introduces the novel concept of assigned CSR priority, modelled on the
original construct of assigned safety priority developed by Zohar (2002a), as a means for
leaders to communicate expectations of employees achieving CSR-related goals. As Zohar
(2010) demonstrated, top management is responsible for highlighting the procedures and
policies at an organisational level, with the responsibility for implementing this throughout
the various levels of the organisation, resting with supervisors and middle/line managers.
Whilst it is speculated that TF may be helpful in striving for effective CSR, what we are not
sure of yet are the conditions under which TF can do this (Shahin and Zairi, 2007). As Bass
(1990) pointed out in his works, relationships between TF and performance outcomes may
Group TF Group ESR
Assigned CSR
Priority CSR Climate
Individual TF Individual
ESR
Assigned CSR
Priority

[79]
possibly be contingent on the external environment, in addition to the organisational
environment and leader characteristics themselves.
As noted above, a key mechanism of effective leadership is goal-setting, which when done
effectively, exerts a motivational effect on employees, resulting in enhanced employee
functioning (Locke and Latham, 1990). Indeed in his theory, House (1977) noted that
charismatic leadership, argued to be akin/similar to the idealised influence facet of TF (Bass,
1990), can lead to effective outcomes through its influence on setting challenging goals for
followers.
Research has however demonstrated that when individuals are instructed to enhance
performance on one of two tasks, the performance on the other task suffers (Schmidt et al.,
1984). Hence the resultant conflict between the two tasks is dealt with by prioritising one
goal to the detriment of the other. This issue can be considered reflective of the nature of
ESR, in that employees are expected to engage with both in-role and extra-role forms of ESR
behaviours. This goal conflict which arises between competing demands/tasks has also been
experimentally manipulated by Locke et al. (1994), through an imposed dichotomy between a
quality and a quantity focus in production, manipulated through managerial instructions. So,
on the one hand employees were told to emphasize quality of production, whereas on the
other they were given a quantitative target which they were urged to reach. This caused
individuals to neglect the goal of quantity for the goal of quality.
Lewin (1935) defined conflict as “a situation in which oppositely direct, simultaneous acting
forces, of approximate equal strength, work upon the individual” (pg. 123). Locke et al.
(1994) suggest that from this definition, it is implied that pressure to achieve incompatible
goals is the cause of this intra-individual conflict. This conflict can also be juxtaposed with
ESR behaviours where it can be argued that the in-role behaviours such as economic
behaviours may be jeopardised for the more extra-role social responsibility behaviours; such
as those within the social dimension (Pierce and Aguinis, in press). Nevertheless, further
research has evidenced that regardless of there being multiple goals, when there is
commitment, these goals can be achieved (Ivancevich, 1976). What may thus be of primary
importance is the way in which leadership attempts to balance the conflict between the
various ESR behaviours, and engendering commitment to the multiplicity of ESR.
Leadership here is crucial in engendering commitment to multiple behavioural goals from
employees, as well as balancing the inherent conflict between them. More recently,

[80]
researchers have attempted to hone into focused TF behaviours, which has been shown to be
helpful in balancing conflict between seemingly contrasting set of work behaviours (e.g.
Zohar, 2010). As a result whilst earlier research may have examined the role of TF on
employee work outcomes in a general sense, awareness has been drawn to the fact that TF
behaviours in themselves are value free (Fu et al., 2010). Cognizance of this point has led
some researchers to investigate TF with regards to specific focuses.
In marketing research Morhart et al. (2009) demonstrated the beneficial effects of brand-
specific TF leadership on such outcomes as extra-role behaviours as well as brand building
behaviours. They define this brand-specific style as “a leader’s approach to motivating his or
her followers to act on behalf of the corporate brand by appealing to their values and personal
convictions” (pg.123). Similarly in the domain of safety research, Barling et al. (2002) also
focused on domain-specific leadership and elucidated that it was safety-specific TF which
was associated with safety performance, through the mediating effects of a safety climate.
More closely aligned with ESR, Robertson and Barling (2013) demonstrated the positive
effects of environmentally specific TF and pro-environmental leader behaviours, on
subsequent employee pro-environmental behaviours.
Whilst research has focused on TF directed towards a specific focus, Zohar (2002a) examined
the role of assigned safety priority, in moderating the relationship between leadership and
safety climate. He asked participants to rate the extent to which they thought their superior
prioritised safety using items such as, ‘turned a blind eye to safety rules when there was a
tight schedule’. Through this, he found that TF was indirectly and negatively related to injury
rates under conditions of high assigned safety priority. This assigned safety priority ensured
that management directed attention to both efficiency and safety behaviours, thus detracting
away from the potential to send employees conflicting goals to focus on. That is employees
received a consistent message to try and achieve efficiency without neglecting safety, as
opposed to being informed to engage in safety behaviours, and subsequently being requested
to be as efficient as possible (see Locke et al., 1994). It is thus proposed in the current
research that the effective existence of an assigned CSR priority construct, parallel to the one
used by Zohar (2002a), is needed in order to provide value to these value-free TF leadership
behaviours, balance the inherent conflict between various ESR behaviours by dissuading goal
conflict, and thus facilitate ESR.

[81]
Assigned CSR priority in this context is defined as the extent to which leadership prioritises
and focuses on CSR in their day-to-day interactions with employees. Rather than it being a
focus on the communication of the importance of social responsibility, which employees may
or may not pay heed to given their individual interests in sustainability, be it being committed
to CSR, to being indifferent or dissident (Rodrigo and Arenas, 2008); it instead refers to
leaders communicating their expectations regarding employees acting in accordance with
social responsibility standards in their work activities, thus engendering employee
commitment to CSR. Much like how Zohar (2002a) defined assigned safety priority, such
behaviours include whether leaders expect employees to disregard social responsibility for
the benefit of efficiency, focus only on production-related issues, and displaying general
indifference to social responsibility.
More recent to the findings of Zohar (2002a), Katz-Navon, Naveh, and Stern (2005) further
confirmed the role of assigned safety priority. They illustrated that regardless of the presence
of safety procedures, it is incorrect to assume employees will comply, unless there is a high
priority attached with safety in their work unit. Indeed, their findings were more intricate in
showing that assigned safety priority had a somewhat compensatory effect for insufficient or
overly detailed safety procedures, ensuring fewer treatment errors. Similarly, it is argued that
regardless of CSR policies and procedures at the organisational level, a high assigned CSR
priority is needed in order to encourage employee commitment.
Therefore the role of TF in emphasising, encouraging, and managing expectations of social
responsibility practices, through a high assigned CSR priority, helps to build consistency and
reassures employees of the behaviours they need to fulfil, by not only focusing on in-role
performance but also highlighting attention towards extra-role social responsibility
performance (e.g. Zohar and Luria, 2004). By providing TF with the content for its
behaviours, the inspirational motivation aspect of TF now uses motivational rhetoric, for
instance, to communicate an appealing vision of the importance of CSR (e.g. Mayfield and
Mayfield, 2006, 2009). The intellectual stimulation facet encourages creativity and
innovation in generating novel means of contributing to CSR (Jung, Chow, and Wu, 2003),
and the individualised consideration facet provides a network of support for social
responsibility. Finally, the idealised influence facet sees the TF leader as providing an ethical
and moral role model (e.g. Rowold, 2008), that lives the CSR vision in his/her day-to-day
activities, and is consistent with regards to the importance (s)he places on CSR (Zohar,
2010). On a more technical level, this means the leader assigns priority to ESR, inspires

[82]
employees to commit to ESR goals, and motivates them to achieve these ESR goals through
their work activities, by directing their attention towards ESR unfailingly.
Whilst research has focused on assigned (safety) priority at the group level (Zohar, 2002a), it
has not yet looked at the role of assigned (safety) priority on individual level outcomes. The
closest proximate is the study of TF behaviours that are specifically focused. As noted above,
the likes of Morhart et al. (2009) demonstrated the effects of TF-specific behaviours on
positive employee outcomes at the individual level; brand building behaviours in this case.
Thus in the present study, the effects of assigned CSR priority are expected both at the group
and individual levels.
As noted above, TF is regarded as encouraging employees to transcend their own self-interest
for the betterment of the group. According to goal-setting theory, it can be argued that when
TF is coupled with this assigned CSR priority, the group is encouraged to disregard their own
individual interests, and act to achieve the group goal of becoming more socially responsible
as a collective entity. In so doing, the leader communicates their CSR expectations to the
group as a whole, and motivates the group towards this goal. The leader facilitates within
group processes to ensure the group remains cohesive, and engenders commitment from the
group to ESR behavioural goals. The role of TF leader is to furthermore provide groups with
feedback on their progress towards goal attainment so that they can accordingly refine their
strategies. Indeed, research by DeShon et al. (2004) showed that feedback given at the team-
level encourages team performance. Additionally, providing teams with feedback is also
related to the setting of team goals (Locke and Latham, 1990).
At the individual level, the TF leader attends to each employee’s individual differences. In
relation to the goal-setting theory, in order for goals to be most effective and possess the
required challenging element needed to motivate goal-directed efforts, the goals need to be
within the reach of the individual in terms of the resources which they have at hand, for
example. Undeniably, there may be differences in employee affinity towards CSR, and the
leader works to address this, and develops individual behavioural goals pertaining to ESR,
uniquely based on each individual’s needs and abilities. The leader supports employees in
achieving these goals, and identifies any developmental needs and seeks to address these.
Analogous to the group level, the leader provides individuals with feedback on their progress
towards goals so that they can accordingly adjust their behaviours if necessary (e.g. DeShon
et al., 2004). Based on the above rationale, the following hypotheses are proposed:

[83]
Hypothesis 1a: Group level assigned CSR priority moderates the effect of group level
transformational leadership on group level social responsibility; such that group level
transformational leadership will lead to greater group level social responsibility when there
is high as opposed to low group level assigned CSR priority.
Hypothesis 1b: Individual level assigned CSR priority moderates the effects of individual
level transformational leadership on individual level social responsibility; such that
individual level transformational leadership will lead to greater individual level social
responsibility when there is high as opposed to low individual level assigned CSR priority.
3.2.4. Moderating role of CSR climate
Whilst TF leadership, which communicates CSR expectations and goals, may be rife within
the organisation, if the environment within which employees are expected to engage in ESR
behaviours is not supportive, this will hinder employee engagement. Whereas assigned CSR
priority communicates leader expectations of ESR and ensures employees are not faced with
conflicting goals regarding these multi-dimensional behaviours, CSR climate captures the
organisational policies and practices regarding CSR. This CSR climate communicates to
employees that the organisation, in addition to the leader, holds CSR behaviours dear, and
thus encourages employees to commit to the organisation’s CSR efforts, and motivates them
to engage in ESR behaviours.
The climate of an organisation tends to emerge at the group level, relating to the shared
perceptions of employees of the organisation (e.g. Rentsch, 1990). Climate, whether it be a
safety, ethical or service climate; has been shown to lead to various positive outcomes such as
ethical, safety and citizenship behaviours (e.g. Appelbaum et al., 2005; Trevino et al., 1998;
Walumbwa et al., 2010). This research, more specifically is interested in the moderating
effects of climate and how this can facilitate positive work behaviours. For instance, the
moderating role of psychological climate has been evidenced between leader-member
exchange (LMX) quality and role overload (Tordera et al., 2008). With respect to LMX, a
positive safety climate strengthens the relationship between high quality LMX relationships,
and the extent to which employees believe safety citizenship behaviours are an integral part
of their roles (Hofmann et al., 2003). Jiang et al. (2010) further showed that when there is a
positive climate for safety, perceived colleagues’ safety knowledge/ behaviour has greater
effects on safety behaviour. The positive moderating effects of climate on behaviour have

[84]
been widely demonstrated by additional researchers (Hofman et al., 2003; Jiang et al., 2010;
Kapp, 2012; Tordera et al., 2008)
To date however, there has been a lack of focus on a prospective climate for CSR, up until
very recently (e.g. El Akremi et al., in press). When we discuss the possibility of a CSR
climate, we do not assume this arises from employees’ knowledge of their company’s actual
engagement within CSR, rather their perceptions of this. Indeed, “how employees perceive
the CSR of their employer may actually have more direct and stronger implications for
employees’ subsequent reactions than actual firm behaviours of which employees may or
may not be aware” (Rupp et al., 2013; pg. 897).
Research has found that within the same organisation, there can be different climates
operating within the various groups (e.g. Johnston, 1976). This could be because those within
the same group share the same leader, a similar work environment, as well as goals and
objectives (James and Jones, 1974). Consequently, in the current research, CSR climate is
defined at the group level as the perceptions of individuals that their group/ organisation
make efforts to conduct themselves in a socially responsible manner.
This CSR climate can assist in balancing the noted conflicts that may be experienced by
employees with regards to social responsibility behaviours, by communicating that in
addition to fulfilling mundane job duties, keeping the stakeholders in mind and holding social
responsibility as a priority, is paramount. Thus when individuals perceive a positive CSR
climate, they feel that their group/ organisation acknowledge the importance of CSR, and
encourage engagement within such activities. This helps to overcome the pressure arising
from the conflict between whether individuals should focus on in-role or more extra-role
behaviours of ESR. For instance, research by Zohar (e.g. 2000, 2002a, 2002b) has
demonstrated the way in which the traditionally understood misalignment between safety
focus and job performance and efficiency can be allied, through the cultivation of an effective
safety climate.
Climate has been shown to moderate the relationship between TF and work outcomes at the
micro-level in various studies. For instance, Charbonnier-Voirin et al., (2010) evidenced the
moderating effect of a climate for innovation between TF and adaptive performance in
individuals. Liao and Chuang (2007) demonstrated the way in which TF could promote
employee performance, as strengthened by a store climate for TF. Furthermore, a perceived
climate for initiative moderates the relationship between TF and innovation implementation
[85]
behaviour in employees (Michaelis et al., 2010). This provides support for the assumption
that the effectiveness of TF is dependent upon the wider context, in this case climate, which
either facilitates or hinders the effectiveness of TF.
Despite the fact that much of the research looks at the effects of a group or organisational
level climate on individual level relationships, fewer look at the effects of a group climate on
group level relationships. Here, scarce evidence such as that from Eisenbeiss et al. (2008),
confirm the way in which a climate for excellence can strengthen the relationship between TF
on team-innovation. Given these findings, it is sensible to assume that the proposed CSR
climate at the group level will moderate the relationship between TF and CSR behaviours
both at the group and employee level in a homologous manner.
At the group level, the climate reflects the degree of shared perceptions amongst employees
regarding the organisation’s CSR policies and practices. If the group perceives that this CSR
climate is positive, they feel supported to engage in ESR behaviours, and believe that their
socially responsible actions will be positively received and rewarded by the organisation.
Similarly, at the individual level, once employees receive the signal from their leaders to
engage in ESR behaviours, they look to the climate of the organisation to see if these ESR
behaviours are indeed desired by the organisation. A positive CSR climate communicates to
individuals that these ESR behaviours are highly desirable; the employees then possess the
impetus to increase their social responsibility efforts.
Through ensuring a positive climate for CSR, employees are made aware of the importance
the organisation assigns to CSR. Consequently, as their TF leader assigns them individual
and group level goals, they will be reminded by this positive CSR climate to contribute to the
organisation’s CSR agenda through their day-to-day individual and group activities. Through
the application of goal-setting theory, it can be argued that a positive climate for CSR
communicates a consistent message regarding the significance of CSR, as opposed to
providing conflicting messages, where in some instances the importance of CSR is reiterated,
and in other instances, the organisation communicates that it values efficiency and speed of
work. Because the latter situation is avoided through a positive climate for CSR, employees
do not experience goal conflict and are not faced with the problem of prioritising behaviours
such as efficiency over extra-role social responsibility behaviours (e.g. Locke et al., 1994).
They are instead motivated, inspired, and supported by their leaders to work towards the
[86]
organisation’s goals of ensuring social responsibility in the various organisational activities
the employees partake in.
Hypothesis 2a: Climate for CSR moderates the effects of group level transformational
leadership on group level social responsibility; such that group level transformational
leadership will lead to greater group social responsibility when there is a positive as opposed
to a weak climate for CSR.
Hypothesis 2b: Climate for CSR moderates the effects of individual level transformational
leadership on individual level social responsibility; such that individual level
transformational leadership will lead to greater individual level social responsibility when
there is a positive as opposed to a weak climate for CSR.
3.2.5. Interactive effects on ESR behaviours
As discussed earlier, when prompting employees to engage in behaviours which seemingly
appear contradictory, it is vital to ensure that conflicting messages are not being directed at
employees. For instance, the study by Locke et al. (1994) demonstrated the way in which
employees may initially be requested to conform to quality standards, but if they are then
informed by their supervisor that they need to achieve a certain production target, conflict
arises between prioritising quality standards versus quantity, and ultimately one suffers.
Similarly Zohar (e.g. 2010) in his various studies further showed that there needs to be a
consistency in what is communicated to employees regarding maintaining efficiency whilst
not being at the expense of safety behaviours; he put forward the key roles of leadership and
climate as being imperative here.
As previously highlighted TF behaviours are value free and so when we discuss the role of
TF in encouraging the multifaceted ESR behaviours, we focus instead on the leader’s
assigned CSR priority, and the TF behaviours are seen as a vehicle of communicating,
motivating, and role modelling, and supporting these behaviours. Whilst assigned CSR
priority communicates leader expectations regarding ESR, a CSR climate communicates the
organisation’s CSR-relevant policies and practices. In the case that leaders were to employ
TF behaviours and communicate a high assigned CSR priority, conflict would still be felt if
employees perceived that the climate was sending messages to the contrary, and possibly
highlighting certain facets of ESR behaviours, such as the more in-role economic behaviours

[87]
over the more extra-role behaviours, for example, philanthropic and social behaviours. Thus
what needs to exist is harmony between leaders using TF behaviours and communicating a
high CSR priority, under a climate which also promotes CSR.
The collective moderating influences of assigned priority and climate in the general sense
have not yet been unearthed by research, and such an interaction is proposed in the current
research by way of promoting optimal work conditions for ESR. As such, the effective TF
behaviours interact with assigned CSR priority and CSR climate to collectively provide ideal
conditions for social responsibility behaviours at the group and individual levels. Such that
when employees experience effective leadership, which also assigns high priority to CSR,
under conditions of a positive CSR climate, they perceive a clear message which encourages
them to engage in the various ESR behaviours equivocally. The conditions provide them with
the necessary support and encouragement, as opposed to receiving conflicting messages
which induce pressure and goal-conflict (Locke and Latham, 2002).
At the group level, when the group perceives their TF leader prioritising ESR, they are likely
to engage in ESR behaviours if they feel that the group/ organisation also holds ESR dear and
encourages it. Similarly at the individual level, employees are more likely to engage in ESR
behaviours if they can see that not only does their leader promote ESR, but also that ESR is
also promoted through a positive CSR climate, and hence there is congruency between
leaders assigning priority to ESR and ESR being encouraged via a positive CSR climate.
Hypothesis 3a: Climate for CSR moderates the interactive effect of group level assigned CSR
priority and group level transformational leadership on group level social responsibility.
When climate for CSR is positive and group level assigned CSR priority is high, group level
transformational leadership will lead to greater levels of group level social responsibility.
When climate for CSR is weak and group level assigned CSR priority is low, group level
transformational leadership will lead to lower levels of group level social responsibility
Hypothesis 3b: Climate for CSR moderates the interactive effect of individual level assigned
CSR priority and individual level transformational leadership on individual level social
responsibility. When climate for CSR is positive and individual level assigned CSR priority is
high, individual level transformational leadership will lead to greater levels of individual
level social responsibility. When climate for CSR is weak and individual level assigned CSR
priority is low, individual level transformational leadership will lead to lower levels of
individual level social responsibility.

[88]
3.3.Summary
This chapter has outlined the proposed conceptual model guiding the research series
presented within this thesis. Notably, the roles of transformational leadership, assigned CSR
priority, and CSR climate are assumed to precede employee social responsibility behaviours.
More specifically, it is postulated that assigned CSR priority and CSR climate moderate the
effects of transformational leadership on ESR at the group and individual levels, and that this
effect is strongest when both assigned CSR priority and CSR climate interact with
transformational leadership. Through goal-setting theory, it is argued this amalgamation
proves most effective because it sets challenging social responsibility goals for groups and
individuals, motivates goal-directed efforts, and consistently draws attention to the
importance of CSR. In so doing, the interactive effects ensures stability of the importance
placed on ESR, thus evading the experience of employee goal conflict between the various
multi-dimensional ESR behaviours.

[89]
Chapter 4: Methodology and Samples
4.1. Introduction
In this chapter, the philosophical underpinnings of the current research will be outlined.
Further to this, the methodological approach, as well as the details of the samples employed
will be discussed. The sample characteristics, design and procedures for each of the samples
will be outlined and the specifics of the measures used will be stated. The basis of this
chapter is to cover the technical details of the samples and methods, so that in subsequent
chapters spanning the research series, the reader has the basic knowledge in order to guide
understanding.
4.2.Philosophical and methodological approach
Epistemology is defined as a “general set of assumptions about the best ways of inquiring
into the nature of the world”, whilst ontology is defined as “assumptions that we make about
the nature of reality” (Easterby-Smith, Thorpe, and Lowe, 2004; pg. 31). This thesis
approaches research through the lens of a positivist epistemology which assumes reality to be
objective; one that can be studied in a scientific manner, and that the conclusions drawn from
the data collected, can subsequently be generalised. Related to this, an objective ontological
world view is adopted, believing that research methods and tools can be applied in order to
understand reality objectively and independent of the observer, in order to draw conclusions
about certain phenomenon, which can be subsequently generalised, so long as a sufficiently
representative sample is used (Ates, 2008). It is believed that whilst phenomenon may not be
directly observable in the social sciences, as is the case in the pure sciences, they can be
studied through the application of theory (Lee and Lings, 2008). For example, in the present
study we will be focusing on the conditions which may possibly facilitate employee social
responsibility (ESR). Whilst we cannot directly observe the factors of interest, such as CSR
climate, we can surmise that they exist through application of theory and logical conjecture,
and subsequently measure them accordingly using the relevant scales (e.g. Mueller et al.,
2012).
Such a viewpoint tends to commonly drive research through a ‘hypothetico-deductive’
methodology, involving pre-formulated hypotheses, and subjecting them to statistical
analyses in order to support or refute the stipulated relationships outlined within the

[90]
hypotheses (Ates, 2008). Since the positivist approach guides the conduct of research in a
scientific hypothetico-deductive manner, we are able to test our specified hypotheses using
statistical techniques to minimise error, to either disprove or provide support for them.
Ultimately this allows us to draw inferences about the relationships between the predictors
and ESR in the current thesis, and to make certain generalisations to the wider business
context, in the hope of contributing to effective business practice (e.g. Gelade, 2006).
Furthermore, not only should the epistemology and ontology be considered, when conducting
management research, Edmondson and McManus (2007) additionally highlight the crucial
role of methodological ‘fit’, defined as internal consistency between the different elements of
a piece of research, in promoting high quality field research. The authors argue that there
needs to be a fit between the theory and method used, as opposed to habitually using
comparable methods to address each research question, owing perhaps to familiarity with the
methods. The authors go onto further note that management theory runs on a continuum from
nascent to mature. They propose that the mature end of the continuum represents well
established models and constructs with broad agreement surrounding key tenets of theory,
whilst the nascent end of the continuum reflects a budding domain where answers to novel
questions remain tentative; with intermediate towing the middle path between the two. The
authors note that with regards to the latter, “intermediate theory research draws from prior
work- often from separate bodies of literature- to propose new constructs and/or provisional
theoretical relationships” (pg. 1165).
According to the authors’ discussion and the noted definition of the intermediate area, ESR
would be seen as falling towards the intermediate part of the continuum. When very little is
known about a specific domain, thus falling into the nascent area, the authors purport the use
of exploratory techniques to gain greater understanding. The reason the research series
presented within this thesis does not fall into the nascent area, but rather towards
intermediate, is that there is some knowledge present in the area of CSR, for instance
surrounding its multi-dimensional nature; rather what is lacking currently is the focus on
micro-CSR (Aguinis and Glavas, 2012). With this implying that the research focus of this
thesis lies towards the intermediate area, the authors advise on the use of mixed
methodologies, or in their words ‘hybrid’ methods, in order to test for relationship between
new and established constructs. This seems quite fitting with the current research which takes
the established construct of transformational leadership (TF), and loosely established

[91]
constructs of assigned CSR priority and CSR climate, and seeks to investigate their effects on
the novel construct of ESR.
As a result, given the positivist epistemological research paradigm as well as the more
intermediary nature of CSR/ESR, a mixed methods approach will be advocated in this thesis.
From a philosophical standpoint the purists argue that the quantitative and qualitative
methodologies cannot be mixed due to differing epistemological roots, and given that
positivism is concerned with objective measurements of phenomenon, this would preclude a
qualitative approach (e.g. Sale, Lohfeld, and Brazil, 2002; Smith and Heshusius, 1986).
However pragmatism dictates that they are mere techniques and not reflections of
epistemology, and thus are compatible at both the practice and philosophical level (Howe,
1988). This research aligns itself with the pragmatist view, believing that whilst a mixed
method approach is employed, it is done so with the intention to attain greater knowledge of
ESR in a systematic fashion, and apply this knowledge to the wider business context.
The choice of methodology is critical, as this will ultimately determine the type of
conclusions that can be drawn (e.g. Scandura and Williams, 2000). Whilst McGrath (1982)
points out that “all research strategies and methods are seriously flawed” (pg. 70), mixed
methods research has the advantage in that these flaws can be greatly minimised. Mixed
methods afford researchers the opportunity to be “more flexible, integrative, and holistic in
their investigative techniques, as they strive to address a range of complex research questions
that arise” (Powell, Mihalas, Onwuegbuzie, Suldo, Daley, 2008; pg. 306).
Harrison and Reilly (2011) suggest that quantitative methods are best for answering questions
regarding the relationships between variables, and the where, when, and how questions. The
qualitative approach allows an in-depth investigation of a specific phenomenon not well
understood and provides rich data (Barley, 1990). In contrast, the quantitative approach
permits the implementation of scientific analyses to determine associations between
variables, and to provide the necessary information to accept or refute the proposed
hypotheses (Lee and Lings, 2010). Furthermore, the quantitative approach has the capacity to
control for extraneous variables thus allowing relationships between variables to be
scrutinised under a higher degree of accuracy, and with a representative sample, the
quantitative approach will allow generalisations to be made to the wider business context.
Used collectively therefore, the mixed methodological approach has much to offer in terms of
richness and depth to the current research.

[92]
Accordingly interviews will be used in the current thesis in order to gain greater conceptual
clarity of ESR. More specifically telephone semi-structured interviews will be used which
commonly involve the development of a question itinerary prior to the interview, but still
maintain flexibility in terms of researcher involvement, unlike structured interviews. Since
this research is from a positivist standpoint, use of interviews may be considered ill-fitting
with such an epistemology. Nevertheless, as discussed above, this thesis builds upon the
assumption that a positivism epistemology does not necessarily imply quantitative
methodology in the rudimentary sense; rather it reflects the thought processes behind the
research conducted. Given that an objective of the research was to identify manifestations of
ESR, use of semi-structured interviews was considered sensible.
Conducting these semi-structured interviews will provide the initial step in the scale
development process by preliminarily validating the structure and definition of ESR, and
facilitating item generation. Having developed the ESR scale, in order to test the hypotheses
of the current research, a quantitative survey design will be employed; a common technique
in organisational behavioural (OB) research, which allows relationships between factors of
interest to be measured (Lee and Lings, 2008). Used together in a mixed-method approach,
the weaknesses in the individual methodologies can be counteracted. For example it
contributes to triangulation, allowing the concept of interest to be viewed from various angles
in order to check for convergence across methods, subsequently enhancing internal and
external validity (Jick, 1979). Mixed methods research also has been shown to have a greater
impact in research, with articles employing mixed methods receiving a greater number of
citations, as opposed to mono-method research (Molina-Azorin, 2012).
4.3.Levels of analysis
Kozlowski and Klein (2000) discuss that processes such as leadership work to modify
individual differences and perceptions, consequently leading to a similar understanding of a
higher-level phenomenon between individuals. The group level constructs in this research
such as leadership, assigned CSR priority, CSR climate, and group ESR behaviours are
examples of shared unit properties (Kozlowski and Klein, 2000). This is because, whilst these
constructs are derived at the individual level through individual factors such as perceptions,
cognition, values and behaviours, they converge to exist correspondingly at higher levels, as a
result of processes such as leadership and social interaction. Accordingly, the authors argue

[93]
that under these conditions, it is acceptable to aggregate individual perceptions to reflect a
group level construct; in the case of this research, leadership, assigned CSR priority and CSR
climate, in addition to group ESR.
Research has noted that TF can be conceptualised as a group level phenomenon (e.g. Korek
et al., 2010). Group TF consequently reflects the convergence of leadership perceptions
between team members through their repeated interactions (e.g. Gavin and Hofmann, 2002).
Furthermore, Yukl (1999) also notes the role of TF in co-ordinating intra-group activities.
Indeed, the way in which TF is conceptualised by Bass (1990) is in enabling individuals to go
beyond self-interest for the betterment of the group. Hence in the current research series,
group TF is the extent to which the leader encourages, motivates, and supports the team as a
whole, and manages within team processes in order to ensure effective functioning.
In the current research series, TF is not said to facilitate ESR in solitude, rather it needs to
assign a priority to CSR, and thus manage employee expectations regarding CSR,
consequently providing a CSR focus to TF behaviours. There is currently no previous
research on assigned CSR priority, given that it is a novel construct developed in this thesis.
Nevertheless, given that it is modelled on assigned safety priority which has been shown to
exert group level effects, with only the reference changed to CSR, assigned CSR priority is
also expected to function at the group level (Zohar, 2002a). Acknowledging that TF can be
considered at the group level, it is a logical presumption that assigned CSR priority can also
exist at the group level, given that it works in tandem with TF by providing a CSR focus for
TF behaviours. As a result, group assigned CSR priority involves TF managing the team’s
expectations of CSR and communicating the importance of CSR in the team’s work
activities. Moreover the subsistence of assigned CSR priority at the individual level is also
proposed. It is argued that this assigned CSR priority exists at the individual and group levels
in an analogous manner, and at the individual level, it is concerned with how TF assigns
importance to CSR to individuals, and manages expectations of CSR on an individual one-to-
one basis.
It is commonly assumed that climate relates to team member’s shared perceptions, hence it is
safe to assume that this also exists at the group level (e.g. Rentsch, 1990). Research has
further evidenced the effects of climate at the group level (Eisenbeiss et al., 2008). In the
current thesis, this climate is said to be CSR-specific and reflects the extent to which team

[94]
members possess shared perceptions regarding their group or organisation’s CSR policies,
procedures and practices.
Finally, ESR is a novel construct that is promoted within this thesis and one which is
expected to subsist at the individual and group level. At the individual level, it refers to an
individual’s engagement in socially responsible activities within their work role. It is
suggested that it may take the form of pro-active behaviours, such as individual employees
signing up to volunteer in the local community, as well as changing the focus of more in-role
behaviours. For instance, instead of disposing of paper in general waste management units,
employees actively recycle using the provided outlets. At the group level, ESR relates to the
consensus among individual level ESR, by means of direct consensus, and is consequently
seen as the extent to which the group is a socially responsible entity (Chan, 1998). It relates
to group efforts in striving to be socially responsible, and actively engaging with proactive
ESR behaviours, such as organising fundraising projects; as well as ensuring their day to day
activity is environmentally sustainable, for example, avoiding wasteful use of energy.
In the current thesis, the constructs of TF, assigned CSR priority, CSR climate, and ESR are
thus seen to be comparable at both the individual and group level. The difference being, that
at the group level, they are seen as reflecting the degree of consensus among individual
ratings within a team. Constructs that are isomorphic across different levels are referred to as
compositional (Kozlowski and Klein, 2000). Chan (1998) proposed a typology of
compositional models which refer to equivalent content, but content that exists in different
ways at different levels of analysis (e.g. individual, team, company). These models
essentially are founded upon principles of isomorphism, whereby they refer to similar content
at the individual level, which coalesce and congregate to the higher levels (Kozlowski and
Klein, 2000). Given that the group-level constructs in the current thesis are conceptualised in
tandem with this principle of isomorphism, compositional models are deemed applicable in
specifying the relationships between these constructs at the group and individual levels. Chan
(1998) discusses five compositional models, and how each one dictates the functional
relationship between different levels, as well as how a specific construct is operationalised at
a higher level.
The compositional model used in the present research is the direct consensus model, which
distinguishes individual level constructs from group level constructs, as being reflected by the
degree of consensus regarding the specific construct, at the individual level. This model

[95]
informs the aggregation of individual responses in order to represent the group level
construct. Chan (1998) suggests that the functional relationship here is to use the within-
group agreement at the individual level in order to justify the aggregation to the group level.
He suggests there are 2 components to the model, firstly to operationalise the construct at
both levels, and secondly the method of aggregating the individual level responses to the
group level, as well as the conditions under which this aggregation can be justified.
Accordingly in the current research, TF, assigned CSR priority, and CSR climate will be
conceptualised at the group level through the aggregation of individual level ratings, justified
through consensus between these individual level ratings. When discussing ESR specifically,
it being the newly developed construct; at the individual level, team member’s responses to
ESR will be used to operationalise how socially responsible an individual is, as well leader
ratings of an individual’s socially responsible activities, whilst the average of these will be
used to operationalise how socially responsible a group is. The method used to conceptualise
ESR at the group level will be to aggregate the individual responses of team members in
order to represent group ESR.
In order to justify aggregation to the group level from the individual level, inter-rater
reliability statistics (i.e. Rwg) and intra-class correlations (ICCs) will be computed. More
specifically, Rwg(j) will be used to determine within-group variance, and ICC(1) and ICC(2)
will be used to examine the between group variance (Kozlowski and Klein, 2000). Rwg(j) is a
within-group agreement index, and it is suggested that this needs to be above 0.70 in order to
justify aggregation (James, Demaree, and Wolf, 1984). Furthermore, ICC(1) and ICC(2)
examine how much of the variance in an individual construct can be attributed to group level
construct, and the reliability of the group means respectively (Bliese, 2000). With regards to
ICC(1), it is advocated that the F values, resulting from one-way ANOVAs, be significant,
whilst others argue that an F value greater than one is sufficient (James et al., 1984). Another
opinion, as put forward by Bliese (2000) is that the ICC(1) value should be greater than 0.05,
whilst the ICC(2) values should be greater than 0.50. The fulfilment of these criteria
collectively justifies subsequent aggregation of data to represent the group level constructs of
TF, assigned CSR priority, CSR climate, and ESR.

[96]
4.4.Summary of research series
Thus far, this chapter has outlined the positivist philosophical positioning of this thesis, the
mixed-method approach to suit the intermediate maturity level of research in CSR, and
explored levels of analysis issues, given that this thesis adopts a multi-level examination of
ESR. Below is a summary of the research series that this thesis will embark upon in order to
conceptualise ESR and test for its antecedents, and this is followed with a more detailed
outline of the samples, as well as the details pertaining to each study.
Scale development study
In chapter two, the discussion highlighted the lack of a measurement tool to measure ESR,
which takes into account the multi-dimensional nature of ESR, as well as providing a more
lucid reflection of employee manifestations of social responsibility. Of course, without the
presence of a valid and reliable ESR measurement tool, the ability to explore the factors that
encourage ESR, as well as further understanding on ESR, is greatly hampered. As a result,
the first and foremost objective of the thesis was to develop an ESR measurement tool. The
recommendations of DeVellis (2012) and Hinkin (1995) on scale development processes was
used to inform the scale development study. Firstly semi-structured telephone interviews
were conducted with employed individuals from various occupational backgrounds, in order
to confirm the multi-dimensional, five-faceted structure of ESR, as informed by prior
research (Dahlsrud, 2008; Rupp and Mallory, 2015). In addition, the majority of the interview
consisted of asking interviewees to discuss behavioural manifestations of ESR, which was
subsequently used to generate scale items. Following this, subject-matter expert ratings were
used to refine the number of scale items to those with the greatest content validity. The initial
32 item scale was then validated in a company sample and business game sample (see
below). Firstly, in the company sample, EFA and CFA were used in an iterative fashion to
finalise the scale to a ten-item scale (two items per dimension), as well as to confirm the
factor structure of ESR. Subsequently, this was replicated in the business game sample, and
furthermore, the psychometric properties of the scale were established.
Field study
After having developed the scale (chapter five), the next objective was to provide a
preliminary test for the conceptual model (outlined in chapter three), in the field study
(chapter six). This was done in a company sample, composed of teams from a commercial
banking organisation and a professional financial services organisation. A cross-sectional
survey design was used to test the hypotheses in order to test for the moderating effects of

[97]
assigned CSR priority and CSR climate, on the effects of TF on ESR; at the group and
individual levels.
Time-lagged study
Finally, attempts were made to replicate the findings resulting from the field-study in a larger
and more diverse sample, involving teams working within a simulated business game
environment. Moreover, an overarching objective of this study was to provide a preliminary
examination of the directionality of the relationships. In order to do this, a time lagged design
was utilised, whereby individuals completed measures at three time points, over a seven week
period. Hypotheses were then tested by examining the effects of predictors measured at time
1, on subsequent ESR, measured at time 2 and 3. Furthermore, in order to assess for an
increase in ESR behaviours, time 1 ESR was controlled for in subsequent analyses.
4.5.Study one: Scale development and validation
4.5.1. Research design
The recommendations for scale development provided by Hinkin (1995), and more recently
by DeVellis (2012), were followed. This involved the initial process of conducting qualitative
interviews with forty employed individuals with diverse occupational backgrounds and
demographical characteristics. These interviews focused on confirming the five-faceted
multi-dimensional nature of ESR, as well as asking interviewees to provide examples of
behavioural manifestations of ESR. These interviews then facilitated item generation, leading
to an initial item pool of 112 items. These were further refined, by subject matter-experts in a
content validity exercise, to 32 items. These 32 items were subject to validation processes in
two samples: the company sample and the business game sample. In the company sample,
exploratory factor analysis and confirmatory factor analysis were used to finalise the scale
items, as well as to confirm its factor structure, and establish preliminary reliability. The
resultant ten item scale with a five-faceted structure of ESR was further validated and
confirmed in the business game sample, and in this sample, its psychometric properties were
established.
[98]
4.5.2. Sample
Two samples were used for scale development and validation purposes. The first sample, the
company sample, consisted of 101 team members nested within 32 teams/ team leaders. The
second sample, the business game sample, was composed of 232 team members nested
within 67 teams/ team leaders; see below for a more detailed outline of each sample. The
sample sizes of these two samples fall short of the recommendations from Nunnally (1976)
who advised on a sample size of around 300 for scale development and validation purposes,
in order to eliminate subject variance, as well as safeguard internal consistency, with Rummel
(1970) recommending an item to response ratio of 1:4. An increased sample size is more
likely to reveal statistical significance in findings (Cohen, 1988). Commonly a sample size of
150 is considered sufficient as long as item inter-correlations are strong. From this it can be
surmised that the sample size, in the business game sample at least, was appropriate for its
purpose, whilst the company sample would still fall short of this recommendation.
Nevertheless determining the most appropriate sample size for precision and power in
analysis, for example factor analysis, is difficult as various other elements also exert an
influence, such as size of the model and missing data (Schmitt, 2011).
Furthermore, it may be argued that the qualitatively distinct nature of the business game
sample to the intended corporate/ business population may be problematic, and lead to an
atypical grouping of interrelated items emerging through factor analysis. That is, the scale
was validated on groups of participants studying at university, whereas the application is for
the working population (DeVellis, 2012). Nevertheless it is contended that due to the nature
of the construct, regardless of whether the setting is that of an educational one or an industrial
one, the nature of ESR behaviours remains intact. Furthermore, due to the generalised way in
which the items were framed, efforts were made to ensure non-context specificity. Finally,
because the scale was first validated in the company sample, and then confirmed in the
business game sample, this issue is accounted for.
4.5.3. Measures
In the time-lagged study (see below), along with the newly developed scale, existing
measures which represented comparable constructs to the five ESR dimensions; were
included. This was for the purposes of examining the ‘nomological network’ whereby the
relationships with existing measures are established as part of the scale development process

[99]
(Hinkin, 1998). Where necessary, items were adapted so as to reflect the academic context.
So for instance, employee(s) was replaced with student(s), and manager/leader with
‘managing director’. Below are the additional measures, added to the survey in the time-
lagged study, for scale development and validation purposes specifically. In addition to these,
the assigned CSR priority scale and the CSR climate scale measured in the time-lagged study
were also used. All the below scales, excluding team effectiveness, were measured in the BG
leader survey (see below). The team effectiveness scale was responded to by tutors and can
be found in Appendix 3. The other scales can be found in the BG leader questionnaire in
Appendix 4.
Deviant Behaviours: The Deviant Behaviour scale (Bennett and Robinson, 2000) was used.
The questionnaire was adapted and only 5 of the 12 items were included, which were deemed
more suitable for the sample. Example of an item includes “put little effort into their work”.
Leaders responded to the items on a five-point Likert scale (1 = Strongly disagree; 5 =
Strongly agree). This scale had a Cronbach’s alpha of 0.69, 0.81, and 0.90 for times 1, 2 and
3 respectively. Whilst at time 1, the reliability fell below the cut-off of 0.70 (Nunnally, 1976),
given that it was borderline, and later was acceptable, no amendments were made.
Task/ Job Performance: The seven-item in-role behaviour scale developed by Williams and
Anderson (1991) was utilised in order to measure task performance. An example of an item is
“completes assigned duties”. Here leaders indicated the extent of their agreement with the
statements on a five-point Likert scale (1 = Strongly disagree; 5 = Strongly agree). This scale
had reasonable reliability throughout the 3 time periods, with Cronbach’s alphas of 0.91,
0.89, and 0.91 for times 1, 2 and 3 respectively.
OCB Performance: This was measured using items from the scale developed by Podsakoff et
al. (1990). For efficiency purposes, one item was extracted from each dimension of the scale
resulting in a five-item measure (e.g. “is one of my most conscientious members in the
group”). Items were rated by leaders using a five-point Likert scale (1 = Strongly disagree; 5
= Strongly agree). Initially, the scale had Cronbach’s alphas of 0.57, 0.62, and 0.62 for times
1, 2 and 3 respectively. After further examination, the second item, which was reverse-
scored, proved problematic. After deleting this item from the scale to yield a four item scale,
the reliability was reasonable with the new Cronbach’s alphas of 0.75, 0.79, and 0.72 for
times, 1 2, and 3 respectively.

[100]
Co-Operation: Four items belonging to the sub-facet co-operation of the pro-social
behaviours scale (Bettencourt and Brown, 1997) was used in the current study. An example
of an item is “helps other students who have heavy workloads”. Leaders responded to these
items on a seven point Likert scale (1 = Strongly disagree; 7 = Strongly agree). The
Cronbach’s alphas across times 1, 2 and 3 were 0.92, 0.95, and 0.96 respectively.
Pro-environmental behaviours: Five items were adapted from the pro-environmental
behaviours scale (Whitmarsh and O’Neil, 2010). Example of an item is “turns off lights they
are not using”. Leaders provided their ratings on a four point Likert scale (0 = Not at all; 3 =
Always). Cronbach’s alphas for this scale were 0.65, 0.85, and 0.82 for times 1, 2 and 3
respectively. Again, given that the Cronbach’s alpha for the time 1was just below the cut-off
of 0.70 (Nunnally, 1976), which was not the case for either time 2 or 3, the scale was not
revised.
Team Effectiveness: The six item team productivity scale was used to measure team
effectiveness (Kirkman and Rosen, 1999). In addition to the six original items measuring
team effectiveness (e.g. “This group meets or exceeds its goals”), three items were added to
the scale which specifically sought to tap into team effectiveness regarding social
responsibility (e.g. “This group recycles”).
Given that three novel items were added to the original established scale, exploratory factor
analysis (EFA) was conducted in order to check the factor structure of the team effectiveness
scale. Specifically, principal axis factoring was used to extract the factors, with Varimax
rotation method. Factors were retained based on Eigenvalues greater than one, and factor
loadings below 0.40 were suppressed. The choice of these specific EFA criteria is discussed
in greater detail in the following chapter (chapter 5). EFA revealed that across times 1, 2 and
3, two factors were extracted with Eigenvalues greater than 1; accounting for 71.6%, 78.5%,
and 82.5% respectively. The Tables 4.01, 4.02, and 4.03 below depict the rotated factor
solution for each time point. As expected the six items from the original scale loaded on
factor 1, and the three additional ESR-specific items loaded on factor 2. At time 1, item 7 had
a loading smaller than .40, and was thus not displayed in the output.

[101]
Table 4.01
Team effectiveness: Time 1 EFA
Time 1
Item
Factor 1
(Team effectiveness-general)
Factor 2
(Team effectiveness-ESR)
TE-1 .822
TE-2 .761
TE-3 .817
TE-4 .853
TE-5 .820
TE-6 .830
TE-7 (ESR)
TE-8 (ESR) .763
TE-9 ESR) .785
Note: Extraction method = principal axis factoring; rotation method = Varimax; Eigenvalues
greater than 1 extracted, and factor loadings below 0.4 suppressed; TE= team effectiveness
Table 4.02
Team effectiveness: Time 2 EFA
Time 2
Item
Factor 1
(Team effectiveness-general)
Factor 2
(Team effectiveness-ESR)
TE-1 .901
TE-2 .801
TE-3 .726
TE-4 .853
TE-5 .921
TE-6 .799
TE-7 (ESR) .602
TE-8 (ESR) .854
TE-9 (ESR) .726
Note: Extraction method = principal axis factoring; rotation method = Varimax; Eigenvalues
greater than 1 extracted, and factor loadings below 0.4 suppressed; TE= team effectiveness

[102]
Table 4.03
Team effectiveness: Time 3 EFA
Time 3
Item
Factor 1
(Team effectiveness-general)
Factor 2
(Team effectiveness-ESR)
TE-1 .867
TE-2 .905
TE-3 .889
TE-4 .844
TE-5 .850
TE-6 .887
TE-7 (ESR) .508
TE-8 (ESR) .824
TE-9 (ESR) .927
Note: Extraction method = principal axis factoring; rotation method = Varimax; Eigenvalues
greater than 1 extracted, and factor loadings below 0.4 suppressed; TE= team effectiveness
Cronbach’s alphas for this scale are presented in Table 4.04, which lists the reliability values
for the full nine item scale (including the three additional ESR items), for the original six
item scale, and for the three item ESR-specific scale. The only instance in which the
Cronbach’s alpha fell below the cut-off of 0.70 was for the ESR specific part of the scale at
time 1. However given that at time 2 and time 3, the value met the cut-offs, all items were
retained. Tutors, responded to these items on a five point Likert scale (1 = Strongly disagree;
5 = Strongly agree).

[103]
Table 4.04
Reliability: Team effectiveness scale
Scale Time Cronbach’s alpha
Team effectiveness - Full
1
0.89
Team effectiveness - Original 0.94
Team effectiveness - ESR 0.57
Team effectiveness - Full
2
0.93
Team effectiveness - Original 0.95
Team effectiveness - ESR 0.80
Team effectiveness - Full
3
0.94
Team effectiveness - Original 0.97
Team effectiveness - ESR 0.81
Note: ‘Full’ includes all original 6 items of the team productivity scale, as well as the
additional 3 ESR-specific items added to the scale for the purposes of this research.
4.5.4. Ethics
Ethical approval for the research proposal for the qualitative interviews, drafted in
accordance with the University’s ethical guidelines for research, was attained from the Aston
University Research and Ethics Committee. Employed individuals were opportunistically
approached by the primary researcher to participate. Informed consent was obtained orally
from the interviewees, and they were reassured they were able to withdraw from the
interviews at any time, as well as reiterating confidentiality and anonymity procedures. For
instance no information that could potentially identify the individuals such as their name and
the organisation they worked for, was collected. After the interview, they were provided with
the primary researcher’s details, should they need to get in touch. The transcriptions were
stored in a secure folder, and will be destroyed after disseminating the research findings

[104]
4.6.Study two: Field Study (Company sample)
4.6.1. Research design
A preliminary test of the model was conducted in this field study within a duo-organisational
sample. It was a cross-sectional survey design, and as a result respondents completed the
questionnaire at one point in time. A cross-sectional survey design allows the testing of the
proposed relationship in hypotheses, and is able to demonstrate if the postulated constructs
are significantly related to one another. Team members provided ratings of TF, assigned CSR
priority, and CSR climate, as well as self-ratings of ESR, whilst team leaders rated team
members’ ESR.
4.6.2. Sample
The sample was comprised of thirty working teams from a financial services company
(Company X) and two teams from a banking institution (Company Y). Both companies that
were sampled were based in the United Kingdom. Within the rest of the thesis, the sample
will merely be referred to as the company sample.
Company X is a financial services company which is headquartered within the United
Kingdom and operates internationally. It is a member of the FTSE 100 and its overall funds
total just fewer than £500 billion. The sample itself was derived from various areas in the
company such as customer services, sales, marketing, and operations. The teams were
comprised of a team leader, and 2-5 team members, with a median of three team members.
Company Y is a banking organisation which operates within the United Kingdom. The two-
group sample was derived specifically from the commercial banking division of the
company. The two teams here were composed of a team leader and three team members.
Initially the total sample consisted of 32 team leaders and 118 team members. Providentially,
all 32 leaders completed the survey leading to no attrition and a 100% response rate. Of the
team members, only 101 responded to the survey thus resulting in a response rate of 85.6%.
Nevertheless, the attrition rate was relatively insignificant, and left all teams with at least 2
members that completed the survey.

[105]
4.6.3. Sample characteristics
Leader: Of the leaders, 59% were female and 41% male. The formal job roles varied for the
leaders, examples included Customer Services Manager, Key Supplier Account Manager,
Team Leader, and Head of Product and Propositions. On average the leaders had worked for
5.3 years in their current role (range 0-18 years) and were responsible for eight people on
average (range 0-15).
The leaders ranged in ages from 27-56 years, with a mean of 37.2 years. With regards to
ethnicity, 84% were British White, 9% were British Indian, 3% were Irish White, and 3%
were British Bangladeshi. Of these, 35% were educated to Bachelor Degree level, 22% to
Advanced Levels, and 16% to GCSE level. The rest had a Master’s degree, a Doctorate, a
professional degree, or unreported (6%, 3%, 6%, and 13% respectively).
Team Members: The sample consisted of 55% females, and 44% males (1% unreported). The
formal job roles varied widely for the team members, examples include Claims Handler,
Analyst, Customer Services Adviser, and Marketing Assistant. On average, team members
had worked in their current role for 4.8 years (range 0-37 years), and had worked for their
current leader on average for 15 months (range 1-84 months).
The ages of the team members ranged from 19-60 years, with an average age of 35.6 years.
The majority were of British White ethnicity (74%), with the rest being Irish White (2%),
British Indian (14%), British Pakistani (5%), Black/British Caribbean (2%), and Mixed (1%).
With regards to highest level of education, 22% were educated to GCSE level, 39% to
Advanced Levels, 24% had a Bachelor Degree, 5% had a Master’s degree, and 6% had a
professional degree (5% unreported).
4.6.4. Procedure
The design of the study was a cross-sectional survey design. The survey was hosted online
via Limesurvey on a web page specifically created to host this survey. A token system was
used whereby the study contacts were added, and they were e-mailed with a unique id to
participate in the survey. There were two surveys created, one specific to the leaders, and one
specific to the team members.
The team leaders provided information on the ESR behaviours of each of the team members
within their team. The team members provided information on assigned CSR priority, TF,

[106]
and CSR climate, in addition to self-ratings of ESR. Both sample groups provided
demographical information, and there were no differences in the surveys completed by those
in company X and those in company Y. See Table 4.05 for an outline of the measurement
structure.
Table 4.05
Measurement schedule: Field study
Scale Team Leader Team-member
Transformational Leadership
Assigned CSR Priority
CSR Climate
Leader-rated ESR
Self-rated ESR
Firstly, all team members received an automated e-mail invitation to participate in the survey.
They received two weeks to complete the survey and reminders were sent throughout this
period to ensure that as many individuals as possible completed the survey. Additionally the
team leaders were sent an automated e-mail invitation asking them to participate in the
survey. In a separate e-mail they were provided with the names of the employees and the
generic labels used in the survey to refer to them (e.g. ‘team member 1’); so that the leaders
were able to insert the ratings for each of their team members in the appropriate response
cells. Reminders were also sent to the team leaders to ensure maximum completion rates.
4.6.5. Measures
Below is a list of the measures that the respondents were asked to complete. These measures
were chosen due to their ability to sufficiently capture the relevant construct as well as due to
desirable psychometric properties. The full list of items per scale for the leader questionnaire
can be found in Appendix 1, and the full list for the team member questionnaire can be found
in Appendix 2.
[107]
Team Member Questionnaire
Transformational Leadership: Transformational leadership style was assessed using the
multi-factor leadership questionnaire (MLQ; Bass and Avolio, 1990). In order to use this, a
license was obtained from Mind Garden Inc. This questionnaire was used to assess the four
facets of transformational leadership, namely individualised consideration, intellectual
stimulation, inspirational motivation, and idealised influence. Team members responded to
the questions on a five point Likert scale (0 = Not at all/ 4 = Frequently if not always)
regarding the leadership behaviours of their team leader. An example of an item is: ‘Seeks
differing perspectives when solving problems’. The scale possessed a Cronbach’s alpha 0f
0.95 in the current study. In order to analyse leadership style at the group level, individual
ratings were aggregated to the group level through a direct consensus shift (Chan, 1998).
Assigned CSR Priority: The scale used by Zohar (2002a) to assess assigned safety priority
was used; here the referent was amended so that items tapped into assigned CSR priority
instead. The team members were asked to indicate the extent to which their team leader
conformed to each statement, on a five-point scale (1 = Not at all/ 5 = To a very large extent).
An example of an item is: ‘Expect you to cut corners and neglect social responsibility’.
Cronbach alpha for this scale, in the context of assigned safety priority, is noted to be 0.82
(Zohar, 2002a). When calculated, the Cronbach’s alpha of this CSR-adapted scale was 0.49.
On further scrutiny, it appeared that the fifth item, which happened to be the only non-reverse
scored item, was problematic. This item was therefore deleted, to yield a Cronbach’s alpha of
0.82, and the four-scale measure of assigned CSR priority (items 1-4) was henceforth used in
all subsequent analyses. In order to analyse assigned CSR priority at the group level,
individual ratings were aggregated to the group level through a direct consensus shift (Chan,
1998).
Climate for CSR: Climate was assessed using the G-CSR scale developed by Mueller et al.
(2012). This was a six item measure tapping into issues such as the company’s handling of
CSR in general, and initiatives towards protecting the environment more specifically; the
referent was the company. An example item includes: ‘My Company does enough towards
protecting the environment’. Team members responded to these items on a five point Likert
scale (1 = Strongly disagree/ 5 = Strongly agree). Cronbach’s alpha for this scale was noted
to be 0.88 in the current study. In order to analyse CSR climate at the group level, individual
ratings were aggregated to the group level through a direct consensus shift (Chan, 1998).
[108]
Employee Social Responsibility: These behaviours were assessed using the newly-developed
ten-item multi-dimensional ESR scale. The development and validation process for this scale
is outlined in chapter five. The scale consisted of five dimensions, namely social which taps
into behaviours benefiting, for example the community (‘assists in community projects’),
philanthropy which looks at charitable behaviours (‘raises money for charity’), and
stakeholder which examines behaviours towards others (‘treats others with respect’). There is
also the environmental dimension which taps into environmentally focused behaviours
(‘recycles’), and finally the economic dimension which looks at core work obligations
(‘completes work to a high standard’). Employees provided self-ratings of these behaviours
on a seven-point Likert scale (1 = Strongly disagree/ 7 = Strongly agree). This self-rated ESR
scale had a Cronbach’s alpha of 0.76 in the current study. This self-rated data was not used in
the hypothesis testing for the field study, but was used for scale validation purposes (see
chapter five).
Control Variables: The control variables of company, team size, and leader tenure were
controlled for throughout group-level and individual-level analysis. The variable company
was controlled for since the sample was derived from two different organisations, and thus to
control for any extraneous influences, resulting from unique characteristics of each company
(coded as: 1 = Company X; 0 = Company Y). Team size has been shown to affect for
example performance in teams, and so this was additionally controlled for (Haleblian and
Finkelstein, 1993). Finally, leader tenure was controlled since the leader’s experience with
their subordinates may affect the ratings of leadership style (Groves, 2005).
Leader Questionnaire
Employee Social Responsibility: These behaviours were assessed using the newly-developed
ten-item multi-dimensional ESR scale. The following chapter (chapter five) guides the reader
through the process of scale development and validation for this ESR scale. Leaders rated the
extent to which their team members engaged in these behaviours. The scale consisted of five
dimensions, namely social which taps into behaviours benefiting the community (‘assists in
community projects’), philanthropy which looks at charitable behaviours (‘raises money for
charity’), and stakeholder which examines behaviours towards others (‘treats others with
respect’). In addition, there is the environmental dimension, which taps into environmentally
focused behaviours (‘recycles’), and finally the economic dimension which looks at core

[109]
work obligations (‘completes work to a high standard’). They responded to the items on a
seven-point Likert scale (1 = Strongly disagree/ 7 = Strongly agree). Leader-rated ESR
behaviours had a Cronbach’s alpha of 0.82 in the current study. In order to analyse leader-
rated ESR behaviours at the group level, individual ratings were aggregated to the group level
through a direct consensus shift (Chan, 1998).
4.6.6. Data preparation
Means and descriptive statistics were checked for both the leader and team member data files
to ensure there were no values outside the normal range of responses for the scales;
specifically through examining the range of responses. There were no values falling outside
the response range, and no missing values in either the team member or the team leader data
files, which is in contrast to the business game (BG) sample (see below). This is due to the
fact that because the team member questionnaire had no 360º rated variables (as was the case
with the BG sample); the survey could be programmed in such a way that the participants
could not move onto the next section until they had responded to all the items in the current
section, and the responses were within the relevant response range for the particular item.
Additionally, whilst the leaders did have to provide ratings of ESR for their subordinates
which could not be programmed similarly, due to different leaders having a varying number
of employees; they nevertheless responded completely. In the minority of cases, when the
ESR scale was not completed, the leaders were emailed by the primary researcher
encouraging them to do so, and the issue was rectified. It could also be that due to the nature
of the sample, the leaders were more diligent in completing the survey, especially as this was
something that was reinforced by senior management who were co-operating with the
research. Leader rated ESR was subsequently restructured and this revised leader file was
then merged with the team files to create a multi-level data file. An additional group-level file
was created consisting of aggregated variables, for the ensuing group-level analysis. Data was
checked at random, by manually selecting certain teams throughout the data file, to ensure
that the ESR ratings had matched up correctly with the relevant team members. In the factor
analysis specific files, missing values were deleted listwise.

[110]
4.6.7. Dawson’s selection rate
Dawson’s selection rate (Dawson, 2003) was used in order to ensure there were a minimum
number of members responding per team in order to justify inclusion of the teams in
subsequent data analysis. The formula to do this is ([N-n]/Nn) where N is the team size, and n
is the number of individuals that responded per team. It is suggested that the cut-off be 0.32;
any teams falling above this should be considered as possible candidates for deletion as
response rate for the group is deemed inadequate.
The maximum number of members per team was five for the company sample. If there were
a maximum of five members per team, the selection rate suggested there be a minimum of
two members responding per team. For example, if two members responded, then the value
resulting from the calculation would be 0.3 which falls just short of the cut-off: ([5-2]/ [5x2])
=0.3. Similarly, in a team of four, if a minimum of two individuals responded, the consequent
value of 0.25 would fall below the cut-off and so the team would still be included. If for a
team of five or four, only one member responded; then the respective selection rates of 0.8
and 0.75 respectively, would mean the teams should possibly be excluded from further
analysis. In the company sample, across all teams there were two or more members that
responded and so all teams met the cut-off value, and did not pose any problems.
4.6.8. Ethics
Ethical approval for the research proposal for the field study, drafted in accordance with the
University’s ethical guidelines for research, was attained from the Aston University Research
and Ethics Committee. Subsequently, prospective organisations were contacted to participate
in this research, of which two agreed, one being a small division within a much larger
banking organisation. Meetings were arranged to discuss the research, and the senior
management within the organisations was provided a sample of questions upon request;
before finalising participation. The senior management within the organisation acted as an
intermediary between the researcher and the prospective participants, and any information
from the researcher to the participants was communicated via this channel.
Since the questionnaire was administered online, before starting the questionnaire, a covering
statement was provided which outlined the confidentiality agreement of the research, as well
as the participants’ right to withdraw (Appendix 1 and 2). Participants were advised that
commencing the questionnaire after reading this message would indicate their informed

[111]
consent of participation. They were provided with the primary researcher’s details, should
they need to get in touch. The data were stored in a secure folder, and will be destroyed after
disseminating the research findings.
4.7.Study Three: Time-lagged study (Business Game sample)
4.7.1. Research design
A time-lagged survey design spanning seven weeks was used in this study in order to assess
the influence of predictors at time one (week 1), on subsequent ESR at times two (week 4)
and three (week seven), at the group and individual levels. A time lagged design is useful in
helping to determine the directionality of hypothesised relationships, as well as providing an
exploration of the time at which predictor and outcomes occur (Mitchell and James, 2001).
Leaders and team-members completed questionnaires across the three time points. Leaders
rated individuals’ ESR on the newly developed scale (see chapter five), whilst team members
provide ratings of TF, assigned CSR priority, and CSR climate, as well as providing peer
360º ratings of ESR. By utilising both leader and individual ratings, efforts were made to
preclude common method biases (e.g. Podsakoff et al., 2003).
4.7.2. Sample
The sample was comprised of second-year undergraduates at a prestigious international
business school within the United Kingdom. In teams of four to six, they worked together on
a business simulation course, delivered over two terms. Participants were randomly and
systematically assigned to their teams on the basis of their demographical background, as
well as their degree programme and current academic performance. For instance, efforts were
made to ensure that each team had at least one high performing member, and that gender
balance was equivocal. This was to ensure a fair allocation as much as possible and this was
done by the administration staff of the university prior to the commencement of the academic
year.
The teams consisted of one team leader and three to four team members, with various roles
within their team. The team members assigned the roles between themselves, with the key
decision being appointing an individual to be the team leader, formally known as the

[112]
Managing Director within the team. The remaining team members took roles of Finance,
Operations, Human Resources, and Marketing Director. The initial sample consisted of 67
team leaders (i.e. Managing Directors) and 245 team members. The final number of
participants that completed the surveys was reduced due to natural attrition. For time 1 this
resulted in a total of 66 team leader (98.5% response rate) and 232 team members (94.7%
response rate). In total 5 team members and 1 team leader that completed the survey in time 1
did not do so in time 2 and/or 3, leading to a 2.2% and 1.5% attrition rate from time 1
respectively. The magnanimity of attrition was reduced greatly by providing an incentive of
extra module credits in the form of engagement with the module. However those who did not
wish to complete the surveys had other means accessible in order to earn these credits; this
was reiterated throughout the module.
Teams worked together in a simulated car manufacturing environment, hosted by the
EUROCAR© software (Orange, 2005). This software simulated the European car industry,
and groups were required to work on setting up and developing their car manufacturing
company in a time-restrictive and competitive environment. The groups were required to
make numerous strategic decisions together, such as the type of car they would produce,
which European markets they would sell to, how they would advertise and manufacture their
cars, as well as how they would handle human resource issues such as staffing and
motivation. Participants were provided instruction manuals which afforded them guidance on
the operation of the software, as well as receiving direction from their tutors, in order to assist
them in setting up their car-manufacturing plant, along with overseeing general team
functioning.
This was a double credit module and as a result, was run over two university calendar terms.
In the first term, groups attended an hourly tutorial every other week along with a maximum
of six other teams, where their tutor provided information on the simulation, on setting up
their business plan, and finally hosting a mock simulation session in week 10 (of term one).
The mock simulation session provided teams the opportunity to test their strategy and make
any necessary revisions before the simulation actually commenced in the second term. In the
first term, teams were required to deliver a business plan presentation to industry
professionals, as well as submit a written business plan. The simulation started in the second
term and was run over five hourly sessions on alternate weeks. The participants would attend
the simulations bi-weekly and a class session with their tutor on alternate weeks. Here the
tutors would provide them with the performance metrics from the previous simulation session

[113]
for each company, and teams would then be given time to strategize for the upcoming
simulation accordingly. In the second term, teams were required to submit a three-year
(fictional time in the simulation) company performance report, as well as an individual piece
of work. Alongside the formal timetabled sessions that the participants attended, they were
also required to meet outside of these times with their team to work on their academic-related
and simulation-related tasks.
Participants’ performance in the module was calculated based upon their group work (60%),
individual assignment (30%), and company performance in the simulation (10%). However
these were not used to assess participant performance in the current research, as the interest
of the research was not in their performance as typified by the above metrics, but rather in
ESR specifically. Whilst the team’s performance in the simulation was a valid contender for
assessing the effectiveness of teams in a general sense, due to it being calculated through
various objective metrics such as retained profit and loss in the simulation and share price;
due to some technical glitches with the software which affected some participating teams and
not others, this was considered a biased indicator and so initial plans to use these metrics
were rebuffed.
The study took place in the second term exclusively. In the first term, the participants had
newly formed their team and could be considered to be at the nascent stages of team working,
before actually reaching the performing stage (e.g. Tuckman, 1965). Therefore by conducting
the study in the second term, it was assumed the teams would have already progressed
through a full team development cycle, especially since two major group pieces of work, the
group presentation and business plan, were due in week ten, of term one. This would allow
stronger conclusions on the directionality of results. Additionally it should be noted that the
simulation also took place in the second term, and this is where the teams demonstrated their
ability to work together in a pressurised environment, competing against other teams.
The teams within this sample can be considered to be ‘real’ teams, as opposed to teams that
are merely co-located, and which work on related yet independent tasks (Katzenbach and
Smith, 1993; West and Lyubovnikova, 2012). West and Lyubovnikova (2012) define real
teams as those that meet the following six criteria of interdependence, reflexivity, shared
objectives, autonomy, boundedness, and specified roles. Interdependence can be thought of
as the dependency of team members upon one another in successful completion of tasks for
example (e.g. Campion, Medskar, and Higgs, 1993). Because the study took place in the

[114]
second half of the business game module, this had allowed the participants to have many
team meetings together and submit a group piece of work, as well as deliver a group
presentation. The majority of the marks for the module were dependent upon group work, and
so team members relied on the collective group effort to attain good marks. Accordingly, it
could be argued that these teams had high interdependence, both task/structural and social/
psychological (Wageman, 1995). Furthermore the teams possessed the shared objective of
achieving high performance in the simulation, as well as attaining good academic
performance, and demonstrated reflexivity; in the tutorials following each practical session
where they reflected on their performance and developed strategies for the coming simulation
session. They were bounded within an academic institution, all had specified roles within
their team, and had autonomy; not only in their academic exercises, but also in the operation
of their simulated company.
In order to enhance response rates, previously proven measures were adopted (Anseel,
Lievens, Schollaert, and Choragwicka, 2010). Firstly, advance notice was given to the
participants informing them of the study that was to take place, in one of their lectures a few
weeks prior to the research starting. Further to this, tutors were also requested to
communicate the upcoming study during tutorials in term one, and e-mails were sent to the
participants leading up to, and during the study. By giving advance notice, participants may
feel obliged in some way to ensure their participation (Allen, Schewe, and Wijk, 1980). If
participants had not completed the questionnaire on the first communication, a further
personalised reminder e-mail was sent informing them that they had yet to complete the
questionnaire if they still wanted to participate, thus instilling some form of remorse, and
hence encouraging completion (Paxson, 1995). Additionally, due to the salience of the topic
of research being directly relevant to their business game teams, it was also anticipated that
this would further enhance response rates (e.g. Edwards, Roberts, Clarke, DiGuiseppi, Pratap,
and Wentz et al., 2002).
4.7.3. Sample characteristics
Leaders: The team leaders ranged in age from 18-31 years, although predominantly most
were between the ages of 19-21 years (24%, 42%, and 18% respectively). The sample
consisted of 59% males and 41% females. Majority of the participants were ‘Home’
participants, that is they were residing within the United Kingdom (82%), and 15% were

[115]
from within the EU states, and 3% from overseas. With regards to ethnicity, the majority
were British White (21%), White Other (17%), British Indian (26%), British Bangladeshi
(8%), British Pakistani (12%), and Black British African (6%).
Additionally, on average the leaders had 24 months of work experience. This speaks to the
suitability of the sample for this study, and helps to minimize concerns over the
generalizability of results arising from the use of a student sample, to an occupational setting.
On average, team leaders reported they tended to meet with their team for approximately 20
hours in the academic term, outside of tutorials, practical sessions and lectures.
Team Members: Of the team members, 52% were male and 48% female. They ranged in age
from 18-42 years, with the majority being between 19-22 years old (28%, 37%, 17%, and
11% respectively). Home participants comprised 45% of the sample, with the rest being from
within the EU (16%), or international (38%). In terms of ethnicity, most were either British
White (20%), White Other (18%), British Indian (14%), Asian Other (11%), Black/ British
African (6%), and Chinese (17%).
On average team members had 11 months of work experience. Team members reported that
they roughly met with their teams for 21 hours on average in the academic term, outside of
tutorials, practical sessions and lectures, thus corroborating leader reports.
4.7.4. Procedure
Data was collected over a seven week period, in term two of the University calendar.
Baseline questionnaires were collected in week 14 (i.e. time 1/week 1), that is the first week
of term two, followed by a further 2 measurement points in weeks 17 (time 2/ week 4) and 20
(time 3/ week 7). Table 4.06 outlines the measurement schedule for this study, noting who
completed the various scales, and at which time points.

[116]
Table 4.06
Measurement schedule: Time-lagged study
Rater: Team Leaders Team Members
Construct Time
1
Time
2
Time
3
Time
1
Time
2
Time
3
Transformational Leadership
Assigned CSR Priority
CSR Climate
Leader-rated ESR
Peer-rated ESR
The design of the study was a time-lagged survey design. The survey was hosted online via
Limesurvey on a web page solely created to host this survey, similar to the field study. This
provided the participants with opportunities to complete the questionnaire as and when they
liked, as well as reducing costs (due to printing and mailing), ensuring ease of administration
for the researcher, and providing data in an electronic format thus avoiding manual input
errors (Anseel et al., 2010). A token system was used, accordingly allowing the researcher to
track which participants had completed the questionnaire as well as to invite participation and
send reminder e-mails.
There were two surveys created, one specific to the leaders, and one specific to the team
members. Through the use of a token system, team members and their leaders received an
individualised invitation via e-mail to complete the survey, with a unique link to the
questionnaire, which allowed tracing of the participant id. Reminders were sent throughout
the week to ensure maximum response rates. Participants were also reminded that they would
receive engagement credits, as specific to the module, for completing the questionnaires to
further boost response rates.
With regards to the outcomes, team members rated the performance of their fellow team
members in a 360° fashion. Team leaders provided ratings for the performance of individual
team members on social responsibility behaviours, in order to overcome mono-method/
mono-source concerns (Hinkin, 1998). For the 360° peer ratings, individual team members
were instructed to rate the other individuals in the teams barring themselves, which were

[117]
identified in the survey by their specific role within the team (e.g. ‘Marketing director’).
Nevertheless, for robustness, it was ensured in the data file that there were no self-ratings. For
analysis, these peer ratings were averaged across team-members to provide a mean-rating per
social responsibility item for a specific team-member. Similarly the leaders rated their
subordinates based on the roles they had within the team, and self-ratings were precluded.
4.7.5. Measures
The team leaders and their team members were requested to complete surveys at three time
points. A baseline measurement was taken in week 14 (week 1/time 1), with the subsequent
two surveys on week 17 (week 4/ time 2), and week 20 (week 7/ time 3) of term two. At all 3
time points, the team leaders provided ratings for various performance outcomes for their
team members, and the team members rated the social responsibility of the other members in
their team in a 360º fashion. As a result of this, it was anticipated that concerns of common
method variance/ same-source bias could be minimised greatly. Podsakoff and Todor (1985)
defined this bias and stated that it arises ‘‘…when self-report measures obtained from the
same sample are utilized in research’’ (pg. 65). This tendency to collate self-reports to
outcomes in addition to attitudinal and dispositional variables in research, are considered
problematic as it can lead to an inflation of correlations (Organ and Ryan, 1995). Method
variance ‘‘…produces a potential threat to the validity of empirical findings’’ (Bagozzi and
Yi., 1990; pg. 547). By collecting data at different time points in this study, as well as from
different raters; concerns over common method and common source variance can be
minimised (Podsakoff et al., 2003).
Listed below are the measures which were used in the surveys. Demographical information
was collected only at time 1. The full list of items per scale for the team leader questionnaire
can be found in Appendix 4, whilst the team member questionnaire scales can found in
Appendix 5.
Leader Questionnaire
Employee Social Responsibility: These behaviours were assessed using the newly-developed
ten-item multi-dimensional scale. The reader is referred to chapter five which provides an in-
depth consideration of the development and validation process for this scale. Leaders rated

[118]
the extent to which their team members engaged in these behaviours. The scale consisted of
five dimensions, namely social (‘assists in community projects’), philanthropy (‘raises money
for charity’), stakeholder (‘treats others with respect’), environmental (‘recycles’), and finally
economic (‘completes work to a high standard’). They responded to the items on a seven-
point Likert scale (1 = Strongly disagree/ 7 = Strongly agree). The Cronbach’s alphas for
leader-rated CSR at time 1, 2 and 3 were 0.82, 0.83, and 0.87 respectively. For group level
analysis, the individual ratings were aggregated to the group level through direct consensus
shift (Chan, 1998).
Team Member Questionnaire
Transformational Leadership: This was assessed using the multi-factor leadership
questionnaire (MLQ; Bass and Avolio, 1990). In order to use this, a license was obtained
from Mind Garden Inc. This questionnaire was used to assess the four facets of
transformational leadership, namely individualised consideration, intellectual stimulation,
inspirational motivation, and idealised influence. Subordinates responded to the questions on
a five point Likert scale (0 = Not at all/ 4 = Frequently if not always) regarding the leadership
behaviours of their team leader. An example of an item is: ‘Seeks differing perspectives when
solving problems’. The Cronbach’s alpha for this scale in the study was noted as 0.95. For
group level analysis, the individual ratings were aggregated to the group level through direct
consensus shift (Chan, 1998).
Assigned CSR Priority: The scale used by Zohar (2002a) to assess assigned safety priority
was used; here the items were amended, by changing the reference from safety to CSR, so
that they tapped into assigned CSR priority instead. The team members were asked to
indicate the extent to which their team leader conformed to each statement, on a five-point
scale (1 = Not at all/ 5 = To a very large extent). An example of an item is: ‘Expect you to cut
corners and neglect social responsibility’. When calculated, the Cronbach’s alpha of this
CSR-adapted scale was initially 0.66. On further scrutiny, it appeared that the fifth item,
which happened to be the only non-reverse scored item, was problematic; as was the case in
the company sample. This item was therefore deleted and the four-scale measure of assigned
CSR priority (items 1-4) was henceforth used in all subsequent analyses, with a final
Cronbach’s alpha of 0.84. For group level analysis, the individual ratings were aggregated to
the group level through direct consensus shift (Chan, 1998).

[119]
Climate for CSR: CSR climate was assessed using the G-CSR scale developed by Mueller et
al. (2012). This was a six item measure tapping into issues such as the organisation’s
handling of CSR in general, and initiatives towards protecting the environment more
specifically; the reference was adapted from the organisation to the group. An example item
includes: ‘My group does enough towards protecting the environment’. Team members
responded to these items on a five point Likert scale regarding the behaviours of their own
group (1 = Strongly disagree/ 5 = Strongly agree). Cronbach’s alpha for this scale in the study
was 0.86. For group level analysis, the individual ratings were aggregated to the group level
through direct consensus shift (Chan, 1998).
Employee Social Responsibility: These behaviours were assessed using the newly-developed
ten-item multi-dimensional scale; the reader is referred to chapter five for an in-depth
discussion on the scale development and validation process of this scale. Team members
were requested to rate the extent to which their peers engaged in such behaviours in a 360°
fashion, excluding self-ratings. The scale consisted of five dimensions, namely social (‘assists
in community projects’), philanthropy (‘raises money for charity’), stakeholder (‘treats others
with respect’), environmental (‘recycles’), and finally economic (‘completes work to a high
standard’). They responded to the items on a seven-point Likert scale (1 = Strongly disagree/
7 = Strongly agree). The Cronbach’s alphas for 360° peer-rated ESR were 0.89, 0.90, and
0.92 for time 1, 2 and 3 respectively. For group level analysis, the individual ratings were
aggregated to the group level through direct consensus shift (Chan, 1998).
Controls: The variables of team size and intervention were controlled throughout group and
individual level analysis. Team size was controlled since it has been demonstrated to impact
upon team performance (Haleblian and Finkelstein, 1993). And the intervention dummy
variables, both for the TF and CSR intervention session were included to control for any
effects the intervention may have had; see the below section on the intervention for why this
was the case. These were dummy coded so that ‘1’ was used to identify the teams whose
leaders had the intervention in time 1, and 0 for those who did not (i.e. had the intervention in
time 2), and this was done for both the TF intervention and the CSR booster session.
4.7.6. Data preparation
Standard procedures such as aggregation, restructuring and data merging were utilised in
order to develop a multi-level and a group data file. Data was checked at random throughout

[120]
to ensure that the data had been matched and merged correctly. In the factor analysis specific
files, missing values have been deleted listwise.
Descriptive statistics were scrutinised for both the leader and team member responses, across
the three time points in order to check for any values lying outside the response range for the
scales, specifically by scrutinising the range of responses. There were no such instances in all
but the 360º rated scale of team-member rated ESR, in the team-member questionnaire. This
issue also pertained to the scales of in-role behaviour (IRB), organisational citizenship
behaviours (OCBs), co-operation behaviours (Co-op), pro-environmental behaviours, (P-
ENV), and deviant behaviours (DB) in the team leader questionnaire; measured across the
three time points, for purposes of scale development (see section on scale development study
above). This was attributed to the nature of the online survey program Limesurvey, which
could allow the non-360º scales (TF, assigned CSR priority, and CSR climate; rated by team
members) to be programmed into the survey, so that respondents could only move on to the
next set of questions after completing all items of the scale in the current section, as well as
ensuring responses were within the response range for the specific scales. However it was not
possible for the above noted scales (i.e. team-rated ESR, OCB, P-ENV, Co-op, DB, IRB),
because not all parts of the scale were relevant to respondents from a particular team. That is,
because the teams had a varying number of team members, not all cells (where participants
imputed their responses) were pertinent. As a result, these scales were programmed so that
respondents could move onto the next section even if the scale was incompletely responded
to. This led rise to two main concerns. Firstly, because the respondents could move onto the
next section after incomplete responses to the scale, some respondents failed to complete all
relevant cells. Secondly, in some cases, respondents also incorrectly inserted a double figure
into a cell, which was not flagged due to the nature of how these scales were programmed. To
resolve the latter issue, these variables were re-coded into the same variable so that any value
above/below the Likert scale range was considered as missing.
With regards to the non-360º scales (TF, assigned CSR priority, and CSR climate), for the
team member responses at time 1, Missing Value Analysis indicated that there were no
missing values. For the team member time 2 responses, there was 1.3% of missing values
across all non-360º measures, and this was also the case for the team member time 3
responses. Upon further investigation, it was revealed that there were three team members
who completed the survey in time 1, but did not do so in time 2 or 3. In the leader files, for
time 1, there was 1.7% of missing values, and for time 2 and 3 this rose to 3.4%. When this

[121]
was further scrutinised, it was found that at time 1, the leader for one team did not complete
the survey across all time points. Additionally, for time 2 and 3, the leader from a second
team who had completed the survey for time 1, did not do so for time 2 or 3. The degree of
these missing responses can be considered trivial. With regards to the recoded 360º scales, for
both the team member and leader responses, the missing values were much larger due to the
reasons noted above; ranging from 4.7% to 17.2%.
4.7.7. Dawson’s selection rate
Dawson’s selection rate (Dawson, 2003) was used in order to ensure there were a minimum
number of members responding per team, in order to justify inclusion of the team in
subsequent data analysis. The formula to do this is ([N-n]/Nn) where N is the team size and n
are the number of individuals that responded per team. It is suggested that the cut-off be 0.32;
any teams falling above this should be considered as possible candidates for deletion, as
response rate for the team is deemed inadequate.
The maximum number of members per team was five for the BG sample. If there were a
maximum of five members per team, the selection rate suggested there be a minimum of two
members responding per team. For example, if two members responded, then the value would
0.3 which falls just short of the cut-off: ([5-2]/ [5x2] = 0.3). Similarly, in a team of four, if a
minimum of two individuals responded the value of 0.25 falls below the cut-off and so the
team would still be included. If for a team of five or four, only one member responded, then
the respective selection rates of 0.8 and 0.75 would mean the team should possibly be
excluded from further analysis. In the BG sample, across all three time points, there was only
a single team present whereby only one member responded to the surveys in time 1 and 2 (0
in time 3); this led to a selection rate of 0.75. However since this was the only team that could
possibly be excluded, the decision was made to not delete the group as any effects of it on
further analyses were considered very minute and as a result, negligible.
4.7.8. Ethics
A proposal of the research to be conducted within the business game sample was forwarded
to the Aston University Research and Ethics Committee, drafted according to the
University’s ethical guidelines for research. This outlined the intended sample, procedures,

[122]
and measures to be deployed. Once ethical approval was granted, discussions were had with
the module leader, and necessary arrangements were made to communicate the study to all
prospective participants, as well as to finalise the details of the research. In addition to this,
after liaising with the module leader, it was agreed that the research would provide an
incentive of module credits for engagement with the study. Participants were able to attain
such credits without engaging with the study, through other activities, and students were
made aware of this throughout the module.
Since the questionnaire was administered online, before starting the questionnaire, a covering
statement was provided which outlined the confidentiality agreement of the research, as well
as the right to withdraw (Appendix 4 and 5). Participants were advised that beginning the
questionnaire after reading this message would indicate their informed consent to
participation. They were provided with the primary researcher’s details, should they need to
get in touch. Efforts were made to ensure that participants were aware that participation was
voluntary, they could withdraw at any stage, and that their responses were to be treated
confidentially and anonymously. The subsequent data was stored in secure folders, and will
be destroyed after disseminating research findings.
4.8.Intervention study
4.8.1. Research design
Note that during this seven week period in the time-lagged study, an intervention was also
conducted to train TF behaviours in team leaders, as well as to develop a focus on CSR. The
design of the leadership intervention was such that the team leaders participated in a half-day
workshop, on a voluntary basis. Whilst previous research has conducted longer workshops
such as a full day (Barling, Weber, and Kelloway, 1996), or even over 3 days (Dvir, Eden,
Avolio, and Shamir, 2002), because of the nature of the sample, in addition to the constraints
of timetabling whereby the only time at which participants did not have lectures/ tutorials was
on a Wednesday afternoon after 1pm; it was decided that everything would be condensed and
delivered in a shorter period of time. In addition to this, team leaders also engaged with a
short informative vodcast on CSR, in their own time. For both the leadership and CSR
interventions, participants additionally completed a self-assessment, and on the basis of this
they developed actions plans which they then forwarded onto the primary researcher.

[123]
Subsequently the primary researcher provided each team leader with systematic yet
individualised feedback; mimicking a coaching session conducted virtually.
An experimental switching replication design (Cook, Campbell, and Peracchio, 1990;
Shannon, Robson, and Guastello, 1999) was utilised (see Table 4.07 below), to which team
leaders were randomly assigned; here the participant cohort was split into four groups. It was
an experimental design as opposed to quasi-experimental, because of the random assignment
of teams to the different conditions; this randomisation was done using excel, through its
random number generating function. Using an experimental study with computerised
randomisation provides the ideal case scenario in ensuring optimum internal validity, and
avoiding biases such as selection bias, whereby the groups assigned to the conditions are
different to one another in important ways (Shannon et al., 1999). Random assignment,
whilst difficult to achieve, is considered the ‘gold standard’ by allowing causal inferences to
be made between variables and excluding any effects of extraneous influences on these
relationships (Mackinnon, Coxe, and Baraldi, 2012).
The advantages of this design are that those who act as a control group also receive the
intervention (e.g. Shannon et al., 1999). This prevents the possibility arising where the
control group become resentful, due to the fact that they were not chosen to receive the
intervention, and adopting behaviours which could confound the intervention. Use of a
control or comparison group is always recommended in an intervention study in order to be
able to judge if any change following the intervention is due to the actual intervention, thus
not exhibited by the control group, as opposed to being a result of extraneous factors.
However when analysed, this intervention was not found to have successfully caused
improvements in leadership behaviours and subsequent ESR; and as a result, the intervention
was dismissed from any further consideration. It is possible that the student nature of the
sample, as well as the limited contact time for the intervention hampered effects. It is also
possible that because students previously learnt about effective leadership behaviours and
CSR as part of their degree programmes, as well as receiving lectures and BG module-
specific workshops on how to work effectively as teams; this interfered with the effectiveness
of the intervention. That is, it is feasible that team leaders were trying to adopt TF behaviours
in order to be effective and endeavour to be the team with the most successful simulation
company, regardless of having taken part in the intervention or not. It could also pertain to
issues surrounding transfer of training. Because team leaders received the intervention

[124]
independent of the groups, whilst they may have learnt to be able to display more TF
behaviours and focus on CSR, they may have had difficulty applying this to their groups.
This issue could have been exacerbated by the fact that the teams most likely had their
specific routine in place, given that the intervention took place in term two, and as a result,
they in all likelihood had developed norms of behaving within their teams, as well as norms
regarding what was expected from the team leader and how team members responded to him/
her. Nevertheless moving forward, to account for any influences the intervention may have
had on the time-lagged replication of the model, it was controlled for throughout individual
and group analysis through the use of dummy variables (see above). Below are greater details
on how the intervention was conducted.
4.8.2. Procedure
The leadership intervention was delivered through a half-day workshop which involved
theoretical components of the various TF leadership behaviours, testing knowledge taught
through various activities, and role modelling which allowed the team leaders to learn how
they can model the newly learned leadership behaviours within the context of their teams.
Table 4.07
Structure of switching-replication intervention design
Week: 14 15 16 17 18 19 20
1A Q1 TF|E-mail
& feedback
E-mail: CSR&
feedback Q2 Q3
1B Q1 TF|E-mail
& feedback Q2
E-mail: CSR|
feedback Q3
2A Q1 E-mail: CSR|
feedback Q2
TF|E-mail &
feedback Q3
2B Q1 Q2 TF|E-mail &
feedback
E-mail: CSR|
feedback Q3
Note: TF = leadership workshop, CSR = CSR vodcast. E-mail = action plan and/or CSR
vodcast emailed to students, and feedback = feedback given by researcher to leader after
completion of relevant action plan; Q1 = time 1 questionnaire, Q2 = time 2 questionnaire,
Q3= time 3 questionnaire.

[125]
As can be seen from Table 4.07, the first left-hand column denotes the splitting of the
participant cohort into four groups. Groups 1A and 1B received the leadership intervention in
week 15, which was followed by the team leaders having to develop a leadership action plan
to implement these new leadership behaviours within the team, and in response to this, they
received individualised feedback. Groups 2A and 2B received the leadership intervention in
week 18, and accordingly completed a leadership action plan immediately after this.
The ‘A’ groups received the CSR intervention in week 15, whereas the ‘B’ groups received
this in week 19. This entailed watching a short informational vodcast on CSR and its various
dimensions, as well as BG-specific examples of behaviours within each dimension. The team
leaders were then also requested to complete a CSR action plan after this, detailing how they
intended to encourage such behaviours within their teams.
Baseline questionnaires were collected in week 14 (time 1), followed by a further 2
measurement points in weeks 17 (time 2) and 20 (time 3). With regards to the performance
outcomes, team members rated the performance of their fellow team members in a 360°
fashion, as well as responding to various other measures as detailed above. Team leaders
provided ratings for the performance of individual team members on various outcome
measures. Tutors of the groups were asked to rate the effectiveness of the teams, using an
adjusted team effectiveness measure, outlined above. The tutors saw the teams on a weekly
basis, either within the tutorial or in the simulation practical sessions, and thus were best
placed to assess the teams from an objective standpoint as to how they worked in the
simulation, and how they worked at a personal level during class tutorial sessions.
4.8.3. Intervention design
In comparison to the vast interest in the study of effective leadership and its effects (e.g.
Avolio et al., 2009), the study of leadership training on subsequent performance outcomes in
an intervention design are few and far apart (e.g. Antonakis, Fenley, and Liechti, 2011;
Barling, Weber, and Kelloway, 1996; Dvir, Eden, Avolio, and Shamir, 2002; Frese, Beimerl,
and Schoenborn, 2003; Kelloway, Barling, and Helleur, 2000; Parry and Sinha, 2005; Zohar,
2002b). Moreover, very few have specifically focused on TF itself (e.g. Barling et al., 1996;
Dvir et al., 2002; Kelloway et al., 2000). These have generally tended to find that conducting
workshops to inform and train effective TF behaviours, as well as booster sessions (e.g. one-
to-one coaching/ feedback) does lead to adoption of the new behaviours as well as enhanced
[126]
subjective and objective performance. By reviewing these studies, the leadership intervention
that was developed in this current research, was modelled on the common practices followed
by the preceding research. The schedule of the workshop is detailed in Table 4.08.

[127]
Table 4.08
Workshop schedule
Order Activity Detail
1
Introduction and purpose
Workshop aims
Improving leadership behaviours
2
Leadership theory
Detailing effectiveness of leadership behaviours and
outlining what these behaviours are.
3
Leadership and
Performance
Group exercise 1 (sorting exercise) – leaders sort the
various behaviours into the categories to which they
belong (the 4 facets of transformational leadership).
Group exercise 2 – Brainstorming the way in which
transformational leadership can encourage positive
behaviours in groups.
4 Break (refreshments provided)
5
Learning leadership
behaviours
Role playing in groups of four. The acting leader in
each role play was rotated, and eventually all group
members acted as the leader within a role play.
6 Presentations: Trainer and
peer feedback
Participants presented solutions to role plays.
After each role play, a discussion on what was good
and/or what could be done differently according to
theory followed.
Trainer then demonstrated how each role play
should have been handled.
7
Summarise
Effective leader behaviours
Details on e-mail booster sessions

[128]
The leadership development disseminator was a senior lecturer from the university who also
had experience as a training consultant in leadership development and team working skills.
The same trainer was used for both workshops to ensure consistency and avoid bias. The
trainer was briefed by the primary researcher on conducting the workshop beforehand.
Materials were supplied, and the researcher provided the resolutions to the exercises,
including the role plays, so as to make sure that participants at both workshops received
comparable information. The primary researcher was present in both workshops as a
facilitator; that is, distributing relevant materials, and assisting the trainer with any questions
between exercises, as well as overseeing that both workshops were delivered equivalently.
The workshop commenced with an introduction to the purpose of the leadership development
training, which was to improve the leadership of their teams. Firstly, theory was provided on
the details of TF, which consequently would be the focus of the leadership development
programme. Subsequent to this, a breakdown of the different facets was given to provide a
more detailed understanding of each.
After this, a group exercise followed where, in groups of four, the students were required to
sort the different leadership behaviours into the according dimensions. This was done to
ensure the students were aware of the different leadership behaviours of TF and could
distinguish which dimensions the behaviours belonged to. The trainer then went through the
correct resolution after the exercise, thus reinforcing knowledge. This was followed by
further theory where the students were provided with research to support the effectiveness of
transformational leadership development, thus emphasizing the utility of what they were
doing and engendering commitment to the intervention programme.
After this, another group exercise followed where team leaders were required to generate
ways in which they could use the various dimensions of TF and the behaviours within the
various dimensions, and channel them into their teams to enhance effectiveness. Participants
reported back to the class in a brainstorming session and the role of the trainer was here to
stimulate idea generation and provide some examples they may have overlooked. After this,
there was a break of approximately 15-20 minutes.
After the break, everyone reconvened into the training room and the trainer briefed the
leaders on the role-play exercise. Again the students were split into groups of four and were
told to assign a different leader for each role play exercise, whilst the rest of the group acted
as the BG team members. There were a number of role playing exercises, developed by the

[129]
primary researcher, which were specific to the BG context. These role plays were designed so
as to tap into each of the leadership dimensions discussed, and to make them salient to the
BG context. Leaders were provided with the role plays in written format, which were also
read aloud by the trainer, and they were then asked to formulate and demonstrate the
resolution to the role play within their groups. They were informed that they would be asked
to role-play a specific scenario to the rest of the participants at random, who would then
provide feedback. They were not told which scenario they would have to role-play, thus
ensuring that each leader approached the scenario in which they were the acting leader, with
diligence.
After finishing role playing the different scenarios, the trainer used lots in order to randomly
deduce which group would have to role-play the scenario that was currently being discussed.
The specific scenario informed which leader from within that group would play the acting
leader. The relevant group would come forward and present their resolution to the scenario in
front of the rest of the participants, and the remaining groups were requested to watch
attentively and then provide feedback on what was good and what should have been done
differently by the leader; which they enthusiastically engaged with. This was further
supported by trainer suggestions. After the role play the researcher thanked everyone for their
participation. Details were then provided on the CSR vodcast, and the two e-mail booster
(leadership and CSR) sessions, and what the participants were required to do for these.
4.8.4. CSR intervention
The second, significantly smaller intervention was delivered as a short informative vodcast
on CSR. Here the primary researcher provided Microsoft PowerPoint overheads with
commentary. This provided team leaders with information on what CSR was, how companies
were increasingly looking to further their CSR efforts due to the many benefits, and how
performance was now classified as a multi-dimensional phenomenon. The vodcast then
detailed what this multi-dimensional CSR performance construct was, and examples of
behaviours that could exist within their BG team as per each dimension, was briefly
discussed. At the end of the vodcast, students were provided with details of the CSR-specific
booster session that was to follow.

[130]
4.8.5. Virtual booster sessions
As highlighted above, there were two e-mail booster sessions. Due to time constraints, the
booster sessions were not done face-to-face as may be the case in prior research, but rather
were done via e-mail (Barling et al., 1996) The booster sessions incorporated an action-plan,
which may otherwise be done within the workshop, but again, this was modelled within the
booster session in order to free up time within the workshop for the other activities. In a
similar vein, Antonakis et al. (2011) conducted their coaching session via telephone in which
the development plans and goals of the individuals were discussed.
As highlighted in Table 4.07 different groups received the two booster sessions, on
transformational leadership and CSR at different times. As part of the TF booster session,
students were required to complete a self-assessment which had been compiled on excel. This
was composed of questions assessing TF, measuring the facets of individualised
consideration, intellectual stimulation, idealised influence, and inspirational motivation. As
soon as the team leaders completed the excel survey in their own time, they were provided
with real time feedback which highlighted the scores they had on the various dimensions.
These were colour coded so if they fell below a certain value, they were classed as below
average (colour = red), and the participants were asked to change these behaviours now. If
they fell in the average range (amber), it was indicated that these should be improved; and if
above a certain score and ranked as above average (green), it was indicated that team leaders
should maintain these behaviours.
On the basis of this self-assessment, team leaders were asked to then complete an action plan
centred on their leadership behaviours. More specifically, they were requested to state which
leadership behaviours they needed to change, improve, or maintain, and how they would
demonstrate this within their BG teams; providing examples of behaviours from the various
dimensions as they did so. They were additionally requested to pinpoint any barriers they
may encounter which could prevent them from implementing said behaviours, and how they
plan on overcoming these.
The second booster session was on social responsibility. Team leaders were e-mailed
individually again and were asked to watch a short vodcast on CSR, devised by the primary
researcher, and complete a self-assessment and an action plan. In the self-assessment, they
completed the Zohar (2002a) assigned safety priority questionnaire, revised in order to be
specific to CSR. Similar to the leadership self-assessment, on the basis of their responses,
[131]
they received real-time feedback on their score, what range their score fell in, and what action
they needed to take (e.g. ‘below average: change now’). In the action plan, they were asked to
discuss the ways in which they would further prioritise social responsibility within their
teams, in order to encourage their team to be more socially responsible. They were asked to
indicate the ways in which they and their team would act socially responsible, as well as any
barriers they feel they may encounter, and how they plan on overcoming them. Finally, as
part of this booster session, they were asked to draft an e-mail to their team in which they
would communicate to their group the importance of acting socially responsible. They were
asked to send this e-mail to their team, and to copy the researcher into this e-mail, so that the
full completion of this activity could be documented.
With both booster sessions, team leaders completed their action plans and e-mailed them
back to the primary researcher. They were then provided with feedback from the researcher,
who afforded them with further recommendations, tips and means in order to motivate and
encourage them. Feedback was individualised based on the content of the action plan but
followed a certain protocol. For example with the TF action plan, if for a specific dimension
they did not cover a certain leadership behaviour, then the researcher would recommend this
behaviour specific to the BG context. With regards to the CSR booster, if they also excluded
certain socially responsible behaviours as measured by the newly developed scale, then the
researcher would endorse these. In both cases team leaders would be encouraged to maintain
consistency and to remain motivated.
There are certain threats which can hinder the treatment effect of a randomised intervention
design. These could range from ‘diffusion of treatment’ whereby the control group starts to
unintentionally adopt the treatment (e.g. Blumberg and Pringle, 1983; Shannon et al., 1999),
or when the treatment group deliberately pass on the new knowledge they have acquired to
the control group (Shannon et al., 1999). In order to deter from this, it was communicated to
the team leaders that they should not divulge information about the leadership and CSR
development programme outside of the programme itself, as the others would receive the
same training also. Furthermore, with material exchanged electronically, such as the CSR
vodcast, a PowerPoint slide was included at the end of the presentation warning (falsely) that
the exchange of the vodcast was being monitored and due to copyright issues, students were
not to forward it on to others.

[132]
4.9.Summary
The positivist philosophical perspective and mixed methodological approach of the current
thesis was discussed. The issue of levels of analysis was also explored, given that the thesis
adopts a multi-level perspective on ESR. The two samples, specifically the Company sample
and the Business Game sample, were described; noting the design, procedure, and sample
characteristics for each one, as well as the measured used. At this stage, the decision was
made to not exclude any teams from future analysis. The intervention that was initially
conducted as part of the research series, but which was later omitted due to it being
ineffective, was also alluded to. Before the thesis can begin to explore the determinants of
ESR, a measurement tool to capture ESR is needed. The following chapter (chapter five)
documents the process of developing such a tool.

[133]
Chapter 5: Scale Development
5.1.Introduction
In the following chapter, the process of developing and validating the new employee social
responsibility (ESR) scale will be outlined. Here the use of interviews to generate items,
subject-matter experts to test for content validity, as well as refine the items initially, and the
subsequent factor analysis to finalise the scale items, in addition to confirming the factor
structure, will be discussed. The psychometric properties of the scale will be scrutinised, and
the feasibility of the scale at multiple levels of analysis will be explored.
There is presently a lack of focus on employee involvement within an organisation’s CSR
activities (e.g. Aguinis and Glavas, 2012). The little research that exists has focused on the
positive impacts of CSR on individual level outcomes such as job performance, commitment,
and attractiveness of a company for prospective employees (e.g. Aguilera, et al., 2007;
Albinger and Freeman, 2000; Carmeli et al., 2007; Greening and Turban, 2000). Aside from
this, there is some further research which looks at employee engagement in CSR-related
activities, but nevertheless, they narrowly focus on acute forms of socially responsible
behaviours such as volunteering and donating (e.g. Muthuri et al., 2009). Such research lies
against the grain of current suggestions that CSR is most often defined as a multi-dimensional
construct, consisting of the dimensions of social, stakeholder, environmental, economic, and
voluntariness (i.e. philanthropy) (Dahlsrud, 2008). Rupp and Mallory (2015) in their recent
review, themselves advocated these five facets yielded by Dahlsrud (2008), and requested
researchers to also focus on an equivocal conceptualisation of CSR so that research,
especially at the micro-level, could evolve.
This unaddressed niche, that is micro-level CSR, may exist largely due to the absence of a
measure which taps into the richly faceted socially responsible behaviours at the micro-level.
As a result, the little research that attempts to consider ESR does so through looking at a
narrow form of socially responsible behaviours, such as volunteering and donating
behaviours, as noted above. It can be argued that there are existing outcomes which could be
approximated to represent social responsibility to some extent, for example, volunteering
(Peterson, 2004) could be seen to tap into both social and philanthropic aspects of social
responsibility, depending on their focus (e.g. volunteering in a charity/ volunteering at a

[134]
school in the locality). The economic facet could be tapped through the measurement of job
performance, and how well employees perform at work (e.g. Williams and Anderson, 1991);
whilst environmental behaviours could be assessed by noting how often individuals take
certain environmentally friendly initiatives (e.g. Robertson and Barling, 2013; Whitmarsh
and O’Neill, 2010). Moreover, stakeholder directed behaviours could be investigated through
scales such as customer service behaviours (Bettencourt and Brown, 1997), and helping
behaviours such as those within the organisational citizenship behaviours construct (e.g.
Podsakoff et al., 1990). Whilst there exist scales that attempt to measure multi-faceted ESR,
the measures are either context-specific or they are too general and thus do not adequately
capture ESR (e.g. Chen and Hung-Basecke, 2014; Vlachos et al., 2014).
The shortcoming of taking the approach of using existing scales is firstly that these scales
focus on single facets of ESR, and so do not sufficiently capture the multi-dimensional nature
of ESR. Additionally, this therefore neglects to account for the inherent conflict that is
implied within these behaviours (e.g. Aguilera et al., 2007). For example, employees may
constantly receive communication that they need to deal with customers quickly and
efficiently; however this at the same time may impede the quality of customer service
provided. In another instance, employees might possibly have tight deadlines to work
towards, which would then compromise their ability to partake in volunteering activities
during working hours, although they may well have an interest in doing so.
Furthermore, because these scales were in many cases not developed with the objective of
tapping into what constitutes socially responsible behaviours in their entirety within an
occupational setting, consequently content validity may be questionable (e.g. Podsakoff et al.,
1990). In addition, with comparable constructs, the focus sometimes differs in that an
individual’s disposition towards certain behaviours is assessed, as opposed to the enactment
of behaviours being solely in a work setting (e.g. Whitmarsh and O’Neill, 2010).
Finally, the present research argues for a more clear and nuanced depiction of each facet of
social responsibility. Such an issue for instance arises between social and philanthropic
behaviours, which whilst similar, are argued to have different foci. Therefore, measures to
elucidate the extent to which employees engage in social community-driven behaviours is
necessary, as well as that which looks at an employee’s propensity to act in the benefit of
charitable causes whilst at work. There is some research which looks at employee donating
behaviour to a specified charity at work, however these scales have not been rigorously

[135]
formulated, and their reliability and validity has not been meticulously ascertained (Raman
and Zboja, 2006). Moreover they suffer from the issue of being context-specific, thus
restricting their widespread use in various organisations.
Formerly, some efforts have been made to conceptualise CSR at an employee level. Vlachos
et al. (2014) for example coined the term extra-role CSR-specific performance, whereby
employees make a contribution to CSR outside of their formal role duties. However these
behaviours were measured through a newly developed scale consisting of three questions
which principally centred on employees identifying the extent to which they engaged in
behaviours that centred on ways in which existing CSR programs could be improved and
strengthened (e.g. ‘I contribute many ideas for improving my organisation’s CSR programs’).
Similarly, Ellis (2008) proposed ‘personal social action’ to capture CSR at an employee level.
These behaviours centred on the philanthropic facet of CSR (e.g. Carroll, 1991) and included
actions such as charitable donations and volunteering. Such studies neglect to consider the
multifaceted nature of CSR identified by a number of authors (e.g. Dahlsrud, 2008; Rupp and
Mallory, 2015).
Recently Chen and Hung-Basecke (2014) measured social responsibility in employees by
drawing on activities that could be considered as falling within the environmental, social,
philanthropic and stakeholder dimensions. They however developed a context-specific
measure, more typical of a formative measurement tool, which also precluded measurement
of the economic facet. The state of ESR research is such that it cannot sufficiently evolve at
the present moment, given that currently there is no measurement tool that taps into the full
multi-dimensional spectrum of ESR behaviours, one that is not context-specific, and one that
hones into specific social responsibility behaviours that may manifest in employees’ day-to-
day work activities.
5.1.1. Dimensional nature of ESR
Before we can begin to understand employee social responsibility, we need to explicate what
these behaviours are and what they entail. Using the definition proposed by Aguinis (2011),
employee social responsibility involves behaviours which take into account stakeholders’
expectations, in addition to contributing to the organisation’s social, economic, and
philanthropic performance. This definition in itself implies a multiplicity of various types of
behaviours directed at different performance outcomes within a business, and utilises the

[136]
more contemporary business performance metric of the ‘triple bottom line’ of people, planet
and profit (Elkington, 1999). The concern however is that given the innumerable definitions
surrounding CSR, the construct itself lacks clarity as to the actual behaviours it taps into.
Rupp and Mallory (2015) summed this issue up nicely in their review suggesting that “with
so many perspectives, definitions, and activities melded into the same construct, it may be
unsurprising that CSR remains in a state of construct cloudiness and outcome uncertainty”
(pg. 228). In order to make clear efforts in directing the future of ESR research, a mutual
definition needs to be agreed upon. In their attempt to do this, Rupp and Mallory (2015) fall
back on the efforts of Dahlsrud (2008). Dahlsrud (2008) collated the most commonly
occurring CSR definitions and identified the recurring themes within them. In so doing, five
dimensions of CSR were proposed, namely, social, stakeholder, environmental, economic,
and voluntariness (i.e. philanthropy). Given the rigour of this approach, in addition to making
efforts to unify the research literature regarding the definition of CSR as per Rupp and
Mallory’s (2015) recommendations, the present thesis also considers CSR as consisting of the
dimensions of social, economic, environmental, stakeholder, and philanthropy, each of which
will be further elucidated now. It should be noted here that whilst CSR refers to
organisational/ macro level CSR, indicated by the word ‘corporate’ itself, this thesis proposes
the micro-level concept of employee social responsibility/ ESR which subsists at the micro-
levels, and reflects employee engagement in the organisation’s CSR efforts. The objective
thus is to develop a scale to sufficiently measure this ESR construct.
The stakeholder dimension implies employee behaviours which take into account stakeholder
needs and expectations. These could be both internal and external stakeholders; for example
colleagues and customers respectively. Therefore, positive employee behaviours in this
domain for instance would be to behave amicably towards customers and/or colleagues, and
providing them with correct and honest information.
The social dimension refers to the community at large which may/ may not be directly
influenced by the company’s business activities. Nevertheless they are in some way held to
be related, for example by being in the vicinity of the company. Here, positive employee
behaviours entail engagement within the community, so as to make a positive impact on local
societal functioning. For instance, the employee may provide his/her time to mentor young
school children, provide their expertise to benefit individuals outside of their workplace, and
take part in community projects which the company may have initiated (e.g. re-building a
dilapidated school playground at a local school).

[137]
The economic dimension refers to employee behaviours which attempt to target the
conventional bottom line of profit and other positive performance outcomes the company
may be geared towards. Such behaviours focus on efficiency, cost-cutting, and a
conscientious work ethic. Their overarching aim is to contribute to the effective running of a
company. Here a behavioural example could be that the employee is punctual and completes
their work to a good standard.
Philanthropy, as its name implies, comprises more giving and charitable behaviours. This
could be for example donating money to a local charity, as well as organising events such as
a bake sale to raise money for such worthwhile causes. The philanthropic dimension is
similar to the social dimension, in that there is an element of voluntariness involved. The
employees may for instance, go abroad to India and help in the building of a local orphanage;
projects which are becoming more common, especially amongst larger organisations.
Last but not least, the environmental dimension, commonly implicit in the discussion of
corporate social responsibility, is the final dimension to comprise the multi-faceted ESR
construct. Employee work behaviours here positively attempt to be environmentally
sustainable. These could include taking public transport to work, recycling, and making sure
energy is not inefficiently used whilst at work.
These dimensions of course overlap to some extent. For example, reducing energy wastage
will no doubt have positive implications in terms of cost-savings for the company through
reduction in their energy bills. In addition, a specific behaviour in one dimension may target
another. In this instance, it may be that an employee takes part in a community project to
plant more trees. Such behaviour would be considered to be within the social dimension,
whilst it also targets the environmental aspect of social responsibility. Instead of this overlap
being viewed as unhelpful, it in fact adds further credence to the role of these varying facets
in comprising a mutual end goal of social responsibility, especially since these different
facets compose the overarching construct of CSR, and at the micro level, ESR.
As noted above, a concern sometimes is the context specificity of socially responsible
behaviours. Whilst CSR activities are argued to be context specific (e.g. Aguinis and Glavas,
2012), and rightly so, since each organisation will be engaging in varied activities, the
objective is to develop a context-independent ESR measure. This is because it is argued that
whilst the focus may be different, such as supporting a specific type of charity, the underlying
behaviours will be the same; volunteering and donating for instance. Doing so will allow us

[138]
to have a common measure to assess ESR across organisations, to examine the factors which
affect the propensity to engage in these behaviours, and to draw commonalities and
differences amongst findings arising from varied research efforts; all of which will not be
confounded by a context-specific measurement tool used to measure employee social
responsibility.
The objective of this research was to develop such a measure which would approach ESR
through a general organisational lens. Through a comprehensive literature review in
conjunction with semi-structured interviews, items were generated to capture the various
socially responsible behaviours that employees may partake in, which were hitherto validated
in two samples. The remaining of this chapter documents this process of scale development
and validation.
5.2.Semi-structured interviews
In order to facilitate item generation, forty semi-structured telephone interviews were
conducted with individuals that were currently employed. The individuals were
opportunistically approached by the researcher to complete the interview. When doing this,
care was taken so as to capture both the private and the public sectors equivalently, as well as
sample the voluntary sector. Different hierarchical levels within an organisation were
accounted for, in addition to the organisational size, and the different industries. Within each
industry, different job roles were sampled, including those centring on social responsibility
(e.g. Sustainability Director). Demographically, attempts were made to ensure the sample
was as heterogeneous and diverse as possible with regards to age (mean = 31.1 years; range =
24 to 55 years), ethnicity (30% Pakistani; 25% British; 22.5% Indian; 7.5% White Other),
and gender (55% males). Sample characteristics are provided in Table 5.01.
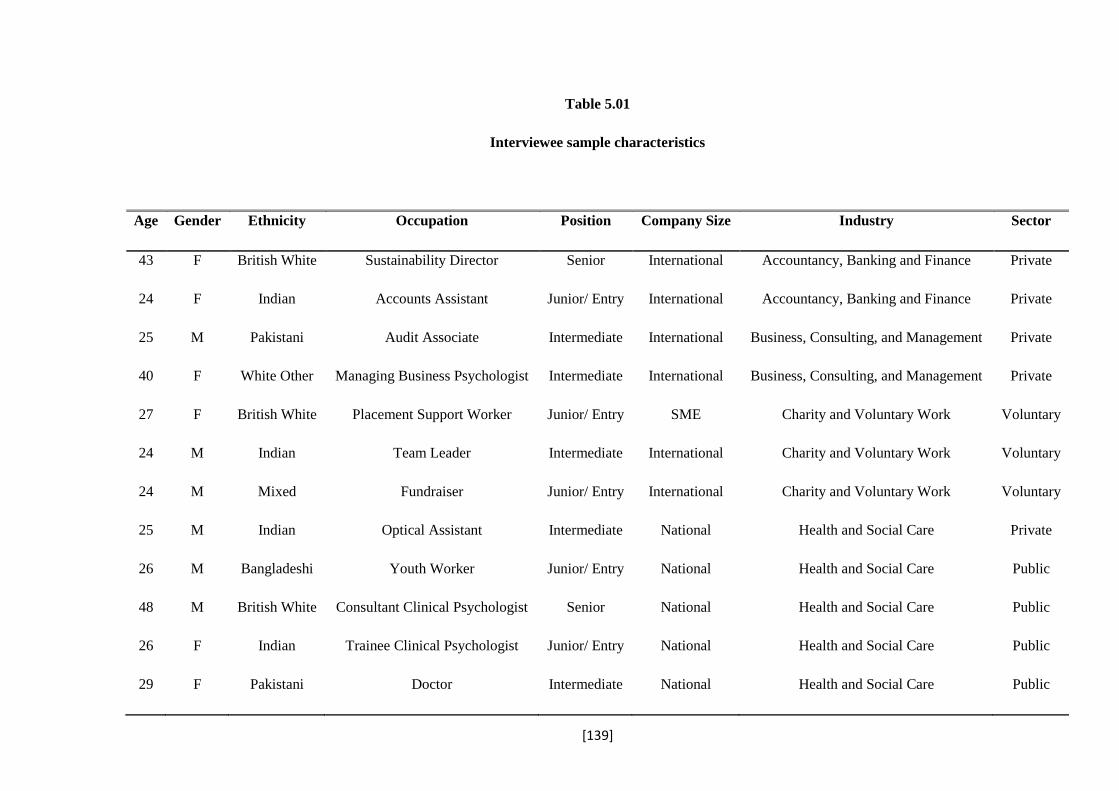
[139]
Table 5.01
Interviewee sample characteristics
Age Gender Ethnicity Occupation Position Company Size Industry Sector
43 F British White Sustainability Director Senior International Accountancy, Banking and Finance Private
24 F Indian Accounts Assistant Junior/ Entry International Accountancy, Banking and Finance Private
25 M Pakistani Audit Associate Intermediate International Business, Consulting, and Management Private
40 F White Other Managing Business Psychologist Intermediate International Business, Consulting, and Management Private
27 F British White Placement Support Worker Junior/ Entry SME Charity and Voluntary Work Voluntary
24 M Indian Team Leader Intermediate International Charity and Voluntary Work Voluntary
24 M Mixed Fundraiser Junior/ Entry International Charity and Voluntary Work Voluntary
25 M Indian Optical Assistant Intermediate National Health and Social Care Private
26 M Bangladeshi Youth Worker Junior/ Entry National Health and Social Care Public
48 M British White Consultant Clinical Psychologist Senior National Health and Social Care Public
26 F Indian Trainee Clinical Psychologist Junior/ Entry National Health and Social Care Public
29 F Pakistani Doctor Intermediate National Health and Social Care Public

[140]
24 F Pakistani Customer Service Adviser Junior/ Entry Large Health and Social Care Public
31 M Pakistani Doctor Senior National Health and Social Care Public
39 M Pakistani Practice Manager Senior National Health and Social Care Public
24 F Indian Recruitment Consultant Junior/ Entry SME HR and Recruitment Private
28 M Indian Recruitment Consultant Senior International HR and Recruitment Private
26 M Pakistani Recruitment Consultant Senior SME HR and Recruitment Private
30 M Pakistani Service Manager Intermediate International IT and Information Services Private
24 F Indian Bus. Psychologist (non-qualified) Junior/ Entry International Marketing, Advertising and PR Private
26 M British White Trustee Senior SME Media and Publishing Voluntary
24 M Chinese Sales Negotiator Intermediate SME Property and Construction Private
25 M Pakistani Site Manager Junior/ Entry International Property and Construction Private
26 F Pakistani Technical Analyst Intermediate National Property and Construction Voluntary
25 F Black Customer Service Adviser Junior/ Entry International Retail and Sales Private
43 M Black Functional Manager Senior International Retail and Sales Private
24 F British White Brand Manager Senior International Retail and Sales Private

[141]
Note: M = male, F = female; SME = small to medium enterprise
50 F British White Sales Assistant Junior/ Entry International Retail and Sales Private
52 M British White Sustainability Director Senior International Retail and Sales Private
36 F Pakistani Functional Manager Senior International Retail and Sales Private
24 M Indian Pharmacist Junior/ Entry National Science and Pharmaceuticals Public
26 M Pakistani Pharmacist Senior SME Science and Pharmaceuticals Public
28 F Bangladeshi Secondary Teacher Junior/ Entry SME Teaching and Education Public
24 F British White Researcher Junior/ Entry Large Teaching and Education Public
33 M British White Primary Teacher Junior/ Entry SME Teaching and Education Public
28 M British White Researcher Junior/ Entry Large Teaching and Education Public
25 F Indian Primary Teacher Junior/ Entry SME Teaching and Education Public
37 F Pakistani Secondary Teacher Senior SME Teaching and Education Public
46 M White Other Lecturer Intermediate Large Teaching and Education Public
55 M White Other Lecturer Junior/ Entry Large Teaching and Education Public

[142]
It is worth noting that in an attempt to do this, whilst the sample covered various ethnicities,
it presented a somewhat equitable balance between the majority (British White) and ethnic
minorities (e.g. British Pakistani); this therefore did not reflect the population spread
currently in the United Kingdom where British White comprise the majority. According to
the 2011 census (Office for National Statistics, 2011), British White accounted for
approximately 79.8% of the population whereas Asian or Asian British (to which British-
Pakistani and Indian belong), only accounted for 7.8%; a balance not reflected in the sample.
In order to ensure that this did not confound the findings, the interviews from different ethnic
groups were examined to detect any differences in the responses provided, for example the
behavioural examples given of ESR, under the various dimensions. The researcher found no
such nuances in responses, rather any differences that were present, were due to the different
industries (e.g. education versus healthcare). The objective in ensuring such a varied sample
was to ensure that the scale to be developed remained as context independent and
generalizable as possible, thus allowing it to be utilised in a wide variety of settings.
The rationale of these telephone interviews was to gauge interviewees’ understanding of the
operationalization of ESR behaviours, as well as confirm the definition of ESR and whether
interviewees felt it needed to be adjusted in any way. The majority of the interview involved
presenting interviewees with a definition of each of the dimensions of the proposed ESR
construct, providing an example of a behaviour that could fall under the different dimensions,
and asking them to generate further behavioural examples that possibly might occur within an
occupational setting. At times the interviewees generated non-context specific items, and in
other instances, the items were specific to their work setting. Interviews were transcribed
electronically in parallel to the interview.
As a result, these interviews fell between structured to semi-structured interviews, the former
erring more towards the quantitative as opposed to the qualitative side of research, in that
specific information is generated to answer the given research question. In the current
research, this would involve confirming the a priori hypothesised multi-dimensional nature
of ESR, in addition to generating examples of behaviours within each dimension; for which a
structured interview can be considered suitable (DeCicco and Bloom, 2006). Whilst in a
structured interview there is a script prepared beforehand as was the case in the current
research, there is no room for improvisation (Myers and Newman, 2007). Consequently,
whilst a structured interview set up is suitable for the present research objective, the adopted
interview structure was akin to semi-structured interviews as there was a script, but there was

[143]
some room for improvisation, depending on interviewee responses to more open-ended
questions in the interview; for example, when they were asked if the definition of ESR should
be adapted in any way (Myers and Newman, 2007).
The interviews were structured consistently across all interviewees, with a delineated
schedule that was followed. Myers and Newman (2007) recommend that a typical semi-
structured interview should consist at least of a script which is prepared before-hand, an
introduction from the interviewer, outlining the purpose of the interview, covering the
questions planned, and closing the interview. The interviews in the current research followed
such recommendations, with a pre-planned script, introduction to the research, outlining the
purpose of the interview and how it was to pan out, the core element of addressing the
interview script, and then closing the interview with any last comments from interviewees.
Intervention from the interviewer was minimal, however interjections on part of the
interviewer were allowed in order to get the interviewee to elaborate on an unclear point they
may have been making, or to get them to elucidate an interesting point. In some cases,
interviewees seemed confused and/or experienced difficulties in generating behavioural
examples of ESR. Here the interviewer would probe them, for instance by asking them how
they or others at their workplace had behaved in a socially responsible way, and/or provide an
additional example of a possible behaviour in one of the ESR dimensions. Indeed Myers and
Newman (2007) point out that a researcher should not follow the script too mechanically, but
rather should allow improvisation and flexibility depending on interviewee responses.
After brainstorming various socially responsible behaviours, interviewees were questioned on
the relevancy of all five dimensions in constituting ESR. Here the most common response
was that there was believed to be a very strong overlap between the social and philanthropic
dimensions, with some suggesting that it may indeed be one dimension; which in many
interviews happened to be reflected in the analogous types of behaviours generated for these
two dimensions. Furthermore, some individuals surmised that the economic dimensions may
not accurately capture the essence of being socially responsible, whilst the majority
maintained that all dimensions appeared distinct and relevant to conceptualisation of social
responsibility at the employee level.
The interview reached its conclusion by allowing the interviewees an opportunity to further
cogitate on whether they felt the dimensions sufficiently captured the definition of employee
social responsibility, and/ or if they would add any further dimensions, or likewise, exclude

[144]
any. In this instance, many interviewees were happy with the five dimensions and felt that
each dimension was broad enough, and thus adequately capturing all relevant behaviours that
may fall under the umbrella of social responsibility, whilst not being too constrictive at the
same time. When suggestions were made for possible changes, these centred on accounting
more for individual motivations for engaging in socially responsible behaviours, such as
religious outlook and moral superiority. As relevant as they may have been, these suggestions
were not in line with the objective of the scale, given that the purpose of the scale was to
capture employee ESRs, and not their motivations to engage with them.
The interviewees were provided the chance to proffer final comments before the interview
was called to a close. The interviews lasted approximately 20 - 40 minutes depending on the
competence of the interviewees to generate behaviours and/or their familiarity with social
responsibility itself. The interview script can be found in Appendix 6.
5.3.Scale development method
5.3.1. Item generation
When developing and validating the scale, recommendations made by DeVellis (2012) and
Hinkin (1995) were followed for the most part. According to domain sampling theory, it is
not possible to measure the construct of interest in its entirety; rather one has to rely upon a
sample of items to adequately tap into the underlying construct (Hinkin, 1998). When
generating items, both an inductive and a deductive approach were employed (Hinkin, 1995).
Inductively, items were generated through reliance upon the interviews and the views of the
currently employed respondents on the behaviours that could possibly be subsumed under
ESR. Ensuing from the interviews, the responses were analysed and items were formulated to
measure the construct of ESR behaviours at work (Churchill, 1979). In instances where the
behaviours were specific to a given work setting; the items were written and framed so as to
be context-independent. For example professions such as those in education and healthcare,
generated context-specific examples in many instances. In extracting a context-independent
item, an example can be behaviours being changed from ‘disposing medical equipment in
accordance with standardised procedures’ to ‘disposing waste appropriately’.

[145]
Items were generated deductively by relying on prior conceptualisations of CSR at the macro
level, and drawing parallels to the employee level. Furthermore, general scales of social
responsibility such as environmental behaviours were used as guidelines, (e.g. Whitmarsh
and O’Neill, 2010). The operational definition was also used as a means to brainstorm
possible items. Since items reflect the psychometric properties of a scale, efforts were made
to devise items which would tap into the latent construct from many different angles, as
recommended by DeVellis (2012).
Efforts were made to ensure questions were carefully worded, and used simple language so as
not to threaten the validity of the questionnaire. The items were developed to avoid multiple
negatives, and worded so as not to be double barrelled. Furthermore, although having a
mixture of positively and negatively framed items can be beneficial in avoiding response
acquiescence; due to the opinion that the disadvantages of compromised validity and
introduction of systematic error, for example, outweigh this advantage, these were also
avoided (DeVellis, 2012; Hinkin, 1995). The items were developed to be as short, and
concise as possible in order to ensure clarity, and efforts were made to make certain non-
ambiguity. The longest item in the item pool comprised of 16 words and 25 syllables, which
according to Fry (1977), would roughly fall at the seventh grade reading level; deemed
appropriate for the general population. The items were not temporally framed, and
furthermore efforts were made to ensure that there was no indication of strong or weak
assertions in the items. The final item pool consisted of 112 items (see Appendix 7). Having
such a large number of items, allowed greater scope to be selective for the final scale, in
order to strive for greater reliability.
A seven-point Likert scale was decided upon as the response format for the scale, as Likert
scales are considered ideal for behavioural research (Hinkin, 1998). With a greater number of
response options, there is also a greater chance of detecting variability which may be
noteworthy (DeVellis, 2012). More specifically, greater response accuracy is yielded with a
greater number of response options, yet having too many response options can be cognitively
demanding. For this reason, a seven-point Likert scale provides an ideal balance between this
trade-off. Churchill and Peter (1984) also show that a greater number of scale points are
related to an enhanced reliability estimate. The ratings options ranged from strongly disagree
to strongly agree, with neutral being the middle point, to provide respondents with the full
range of responses; as well as allowing neutral responses, so as not to force choice to either
agreement or disagreement with the scale items.

[146]
5.3.2. Item reduction
Content validity
Content validity concerns whether the items actually tap into the definition of the construct
being examined. Whilst there is no definite approach to demonstrate content validity, certain
techniques have been provided as guidelines in order to establish that the measure has content
adequacy (Hinkin, 1998; Schriesheim, Powers, Scandura, Gardiner, and Lankau, 1993).
These guidelines were used in order to demonstrate content adequacy for the current measure.
In order to ascertain the content validity of the items, as well as to narrow down the number
of items to only six per dimension for subsequent validation purposes, subject matter-experts,
specifically doctoral researchers in the field of industrial-organisational psychology, were
requested to participate (APA, 1995). This provided a test for the face validity of the items;
that is, the perceptions of whether the items appear to tap into the ESR construct they are
purported to measure (Nunnally, 1976). The experts (N = 7) were provided with a list of all
112 items, as well as the five dimensions of economic, environmental, social, stakeholder,
and philanthropy, along with their definitions. Similar to Podsakoff et al. (1990), they were
also provided with a sixth dimensions labelled ‘other’. The experts were asked to indicate for
each item, which dimension they believed the item tapped into, and to what extent on a scale
from 1 to 10; with 10 implying the item was a complete reflection of the dimension. Experts
were advised that they could, if they deemed necessary, indicate the item as reflecting more
than one dimension; what was important was their indication of the extent to which this was
the case for each dimension. If however the experts felt that a particular item did not reflect
any of the five dimensions, then they were instructed to indicate this as falling into the ‘other’
dimension, and if possible, also speculate as to what this dimension may possibly be. If items
were allocated to their correct dimension, it was assumed the items appropriately tapped into
the relevant dimension, whereas incorrect item allocation suggested the item tapped into
extraneous content. Experts were also requested to evaluate the clarity of items as well as
conciseness, and to highlight any items with concerns in these areas. The reader is referred to
Appendix 8 for an outline of this exercise.
Once the ratings were acquired, efforts were made to refine the selection of items to those
with the highest content validity and little overlap between dimensions. To do this, the mean
rating for each item was calculated across all experts. All items that had a mean of five or
[147]
higher (out of ten) were retained for further scrutiny. This suggested that the experts did not
disagree considerably over the potential utility of the item in representing a given dimension.
The items with a mean of below five were prematurely discarded on the basis that they did
not sufficiently tap into their respective dimension.
Subsequently the six highest scoring items were chosen in each dimension based on the mean
ratings of belongingness to the respective dimensions. However in some cases, this resulted
in some items being retained which in the researcher’s opinion were not considered as
relevant and/or completely generalizable across work contexts; this was further confirmed
with two other senior research colleagues. In such cases, items below the top six were
considered. This was done in order of descending ratings; those with higher ratings were
considered first and judgment was exercised on whether it should replace an item in the top
six.
The economic, environmental, and stakeholder categories were relatively discernible; that is,
experts were easily able to distinguish items which belonged to one category whilst not
overlapping with another. Therefore when rating these items and the dimension to which they
belonged, they were unlikely to indicate that the item also belonged to another dimension.
This was not the case however with the philanthropy and social dimensions. Often, there was
an overlap of items tapping into these two categories; that is, a certain item in many cases
was rated as belonging to both dimensions (to varying degrees), rather than to only one of
these. This was generally indicative of the results from interviews, which also suggested that
interviewees found it difficult in many cases to distinguish between the two categories. In
such cases, choosing the highest scoring items was not the sole criteria, rather the items
chosen for one dimension (e.g. social), had to be items which had a mean score of below five
for the other dimension (e.g. philanthropy). Therefore efforts were made to choose items
belonging to each category, which had a minimal overlap with the other category. As such,
when selecting items, comparisons were made both within and between dimensions.
Moreover, professional judgement was also exercised to a certain extent in selecting items
which were widely applicable across occupational contexts, and those which at face value
seemed to tap into a given category to a greater extent. In addition to these items, two further
items were deductively generated and were added under a new dimension on an ad hoc basis,
namely the ‘legal’ dimension. This was as a result of discussions with fellow senior research
colleagues that there may still be scope for ‘legal’ aspects of social responsibility to be
subsumed under the construct of ESR, given that Carroll’s (1991) definition highlights the

[148]
legal dimension. The purpose was therefore to include this dimension as a safeguard and to
assess its utility in the final ESR scale through subsequent validation processes. The resultant
32 items are presented in Table 5.02.
Churchill and Peter (1984) have evidenced that a greater number of final items are related to
a higher reliability estimate, and so by including a greater number of items in the piloting of
the scale, scope was allowed to delete problematic and/or futile items, whilst still being able
to maintain a desirable reliability estimate later on in the process. Although this does entail a
trade-off with keeping the measure short to avoid respondent fatigue and bias (Schriesheim
and Eisenbach, 1990). Nevertheless, since it was anticipated that the final scale would consist
of two to three items per dimension, it was considered advisable to contain double the final
number of items at this stage (Hinkin, 1998). This is in line with recommendations that there
be three to five items per anticipated factor/dimension, and so working towards the higher
ideal allows flexibility at later stages (Fabrigar, Wegener, MacCallum, and Strahan, 1999).
Table 5.02
Preliminary scale items and item codes
Dimension Items Item Code
Social
1. Educates at-risk groups in the community
about key issues (e.g. health, education, social)
2. Organises events in the wider community (e.g.
fairs, bazaars, fashion show etc.)
3. Assists in community projects
4. Provides his/her expertise to people in the
wider community for free (e.g. mentoring,
teaching, professional advice)
5. Participates in events in the wider community
6. Gets involved in volunteer or social groups in
the wider community
Soc 1
Soc 2
Soc 3
Soc 4
Soc 5
Soc 6
Philanthropy 7. Participates in charity events Phil 7

[149]
8. Raises money for charity
9. Donates to a charity
10. Organises charity events and/or fundraisers
11. Volunteers in charitable initiatives
12. Supports a local charity
Phil 8
Phil 9
Phil 10
Phil 11
Phil 12
Stakeholder
13. Is polite towards others
14. Provides others with transparent and honest
information
15. Listens to the viewpoints of others
16. Acts fairly towards others
17. Is helpful towards others
18. Treats others with respect
Stake 13
Stake 14
Stake 15
Stake 16
Stake 17
Stake 18
Environmental
19. Uses renewable resources where possible
20. Saves energy
21. Disposes of waste appropriately
22. Recycles
23. Behaves in an environmentally friendly manner
24. Reduces the environmental impact of his/her
travel
Env 19
Env 20
Env 21
Env 22
Env 23
Env 24
Legal
25. Follows rules and regulations
26. Obeys the law
Leg 25
Leg 26
Economic
27. Looks for ways to cut costs
28. Is efficient in his/her daily tasks
29. Completes work to a high standard
30. Meets deadlines
31. Achieves his/her goals and objectives
32. Does his/her fair share of the work
Econ 27
Econ 28
Econ 29
Econ 30
Econ 31
Econ 32
Note: soc = social; phil = philanthropy; stake = stakeholder; env = environmental; econ =
economic

[150]
5.4.Scale refinement and validation: Company Sample
After having developed a 32-item scale, with six items per dimension; the scale was subject
to further refinement and subsequent validation. In order to further refine the scale,
exploratory factor analysis was conducted to identify those items which did not clearly tap
into a specific factor (i.e. dimension) of ESR, and/or those items which appeared to measure
multiple facets. These were then subsequently deleted. The scale was then validated in
confirmatory factor analysis, to confirm its multi-dimensional structure, as well as to explore
if alternative best-fitting models were available. This was done with firstly the company
sample, and then later confirmed in the BG sample. The company sample consisted of 101
individual employees nested within 32 teams/ team leaders, set in a professional financial
services organisation and a commercial banking organisation; both within the UK. The BG
sample consisted of 232 individuals nested within 67 teams/ team leaders, operating within a
simulated business environment, in a prestigious UK business school. The reader is referred
to the preceding chapter (chapter four) for an in-depth consideration of both samples.
5.4.1. Exploratory factor analysis
Exploratory factor analysis (EFA) is very common in management research and has proved
useful especially in the development and refinement of new measures, as well as evaluation
of construct validity (Ford, MacCallum, and Tait, 1986). This is deemed an effective use of
EFA, as there are uncertainties as to the possible factor structure of the new measure
(Conway and Huffcutt, 2003). The component model and the common factor model are the
two most prominent models related to EFA (Schmitt, 2011). In the former, principal
component analysis (PCA) is most often used which assumes measurement without error, and
thus the resultant variances accounted for by the components can become escalated, whilst
with regards to the latter, common factor model, principal axis factoring (PAF) is most
commonly used (Schmitt, 2011). The method of choice predominantly is common factor
analysis (i.e. PAF) as evidenced by theory and empirical evidence (Conway and Huffcutt,
2003). This is considered a non-statistical estimation method as it does not rely upon any data
distribution suppositions, and is ideal for testing the latent structure of a measure (Conway
and Huffcutt, 2003).

[151]
Selecting the number of factors to retain is crucial as over or under extracting can lead to
significant modelling error (Schmitt, 2011). Furthermore, it is known that the technique
chosen informs the number of factors retained (e.g. Fabrigar et al., 1999). The Kaiser (1956)
criterion selects factors based on Eigenvalues greater than 1. However this has been criticised
for sometimes leading to the extraction of a superfluous number of factors (Gorsuch, 1997).
Furthermore it tends to be arbitrary, as it is difficult to ascertain that an Eigenvalue of 1.01
refers to a major factor, while in comparison, a value of 0.99 does not (Fabrigar et al., 1999).
An additional method is the Scree test (Cattell, 1966). Here the Eigenvalues from the
correlation matrix/ reduced correlation matrix are plotted, and the graph is then examined to
identify at which point the Eigenvalues dramatically level off ; so called the ‘elbow’ of the
Scree test, which then indicates the number of factors to be retained. Again this approach has
also been criticised as it can be quite subjective as to when the graph levels off (e.g. Kaiser,
1970). Ford et al. (1986) recommends that no single technique should be relied on, rather a
combination of techniques should be used, since no single one has been shown to be
significantly more accurate compared to the other (Conway and Huffcutt, 2003).
In terms of rotation, there are number of options. Rotating factors is useful when rotating
more than one factor, as this allows a more interpretable solution to be found. When looking
at interpretability, Thurstone’s (1947) notes on “simple structure” are important. Simply put,
this is when a factor has a number of variables which load highly on it, and the other
variables which load lowly. Furthermore variables should load highly on one/some of the
factors and load lowly on the rest (Fabrigar et al., 1999). There are two types of rotation,
namely orthogonal which forces uncorrelated factors, and oblique which allows factors to
correlate (Conway and Huffcutt, 2003). Of these, orthogonal rotation, specifically Varimax is
the most commonly used which focuses on ensuring the maximum amount of variance in
squared loadings on a factor (Fabrigar et al., 1999).
Nevertheless, it is recommended that one also exercise the use of theory and research when
deciding on the number of factors to retain, even if this is in contrast to the rotated solution,
as the rotated solution may be insensible (Fabrigar et al., 1999). It is also wise then to further
check the sensibility of the logic used to retain factors across different samples, or split
samples, if the original sample was sufficiently large (Fabrigar et al., 1999).
In line with recommendations by Hinkin (1998), principal axis factoring method was used as
it mixes common, specific, and random error variances (Ford et al., 1986). In conjunction

[152]
with this, orthogonal rotation, specifically Varimax, was used (Hinkin, 1998). It could be
argued that due to the multi-dimensional nature of ESR, oblique rotation be used which
would allow the factors to correlate (Conway and Huffcutt, 2003). However, it was predicted
that not all dimensions would correlate with one another, such as the philanthropy dimension
with the economic dimension, due to differential focuses. This distinction between focuses of
the various dimensions was something that was highlighted in a number of employee
interviews. As a result, analysis proceeded with orthogonal (Varimax) rotation. Based on the
above recommendations, the present study extracted factors based upon Eigenvalues greater
than 1 whilst also studying the Scree test in the first instances. However, judgement was also
exercised based on theory as to the number of factors to extract and therefore those with
Eigenvalues below 1 (but close to 1) were also considered. Additionally, only items which
predominantly loaded on the appropriate factor were retained. Here the 0.40 criterion level
was used, whereby any factor loadings lower than this were suppressed (Ford et al., 1986).
When looking at the variance explained, 60% is advised as the minimum acceptable target,
and as a result this was aimed for (Hinkin, 1998). Conducting EFA was an iterative process
whereby items were deleted, and the analysis was repeated in order to reach the most
effectual outcome of obtaining a factor structure, which accounted for a considerable
percentage of the total item variance whilst retaining theoretically sound items (Hinkin,
1998).
Below are the EFA results for the company sample, presented individually for the leader
ratings and the team member self-ratings of ESR. The findings are presented in two stages.
Stage 1 refers to the initial EFA including all 32 items, and stage 2 refers to the second EFA
conducted with the reduced number of 15 items, as informed by the first EFA; that is after
having removed low loading and unreliable items.
For the leader-ratings in the company sample, coefficient values below 0.4 were suppressed,
and factor extraction was based upon Eigenvalues greater than 1 initially. Six factors were
extracted which accounted for 74% of the variance. As can be seen in Table 5.03, whilst the
items for each dimension loaded in most cases on their relevant factors, what was noteworthy
was that social and philanthropy items loaded on one factor, with the two legal items loading
on different factors. There were a small number of cases where some items did not load on
the appropriate factor and/or loaded on a second factor, albeit to a lesser extent.

[153]
Research is undecided regarding the optimal number of items in a questionnaire (e.g.
Pritchard, Havitz, and Howard, 1999). Response bias can be reduced through a smaller
number of questions, however content and construct validity, internal consistency, and
reliability can be compromised (Churchill and Peter, 1984; Nunnally, 1976). Since the
intended use of this survey is in an occupational setting, for reasons of practicality, the
objective was to retain the lowest number of items, whilst minimally compromising
reliability and validity.
To further refine the scale, items which did not clearly load on a single factor, those with
lower loadings, and those which after being deleted could raise the reliability value (i.e.
Cronbach’s alpha), were candidates for deletion (Hinkin, 1995). This meant that the legal
dimension was removed from the scale as both items were not clearly loading on a single
factor. This did not compromise the face validity of the scale, as the decision to include the
legal dimension within the scale was a contentious one, and was done solely due to one of the
earlier conceptualisations of CSR by Carroll (1991), as a safeguard. As well as these
statistical criteria, it was also ensured that by deleting an item, the content validity of the
scale would not be compromised. In total, 17 items were deleted and the EFA was re-run with
the resulting 15 items in stage 2. This led to 4 factors being extracted which accounted for
77.9% of the variance (Table 5.04). The philanthropy and social items clearly loaded on
factor 1, stakeholder on factor 2, environmental on factor 3, and economic on factor 4. No
double or negative loadings were present.

[154]
Table 5.03
EFA results: Company sample with leader ratings at stage 1 (initial 32 item scale)
Company sample: Leader ratings
Stage 1 (initial 32 item scale)
Item
Social/
Philanthropy Stakeholder Economic Environment Factor 5 Factor 6
1. Educates at-risk groups in the
community about key issues (e.g. health,
education, social) [soc1]
.576
2. Organises events in the wider
community (e.g. fairs, bazaars, fashion
show etc.) [soc2]
.762
3. Assists in community projects [soc3] .827
4. Provides his/her expertise to people in
the wider community for free (e.g.
mentoring, teaching, professional
advice) [soc4]
.723
5. Participates in events in the wider
community [soc5] .721 .447
6. Gets involved in volunteer or social
groups in the wider community [soc6] .871
7. Participates in charity events [phil7] .756
8. Raises money for charity [phil8] .774
9. Donates to a charity [phil9] .665
10. Organises charity events and/or
fundraisers [phil10] .777
11. Volunteers in charitable initiatives
[phil11] .752
12. Supports a local charity [phil12] .695
13. Is polite towards others [stake13] .757
14. Provides others with transparent and .705

[155]
honest information [stake14]
15. Listens to the viewpoints of others
[stake15] .786
16. Acts fairly towards others [stake16] .838
17. Is helpful towards others [stake17] .802
18. Treats others with respect [stake18] .797
19. Uses renewable resources where
possible [env19] .658
20. Saves energy [env20] .615
21. Disposes of waste appropriately
[env21] .733
22. Recycles [env22] .724
23. Behaves in an environmentally
friendly manner [env23] .866
24. Reduces the environmental impact of
his/her travel [env24] .600
25. Adheres to rules and regulations
[leg25] .675
26. Obeys the law [leg26] .466
27. Looks for ways to cut costs [econ27] .407 .506
28. Is efficient in his/her daily tasks
[econ28] .764
29. Completes work to a high standard
[econ29] .731
30. Meets deadlines [econ30] .791
31. Achieves his/her goals and
objectives [econ31] .748
32. Does his/her fair share of the work
[econ32] .785
Note: Table shows factor loadings from the rotated factor matrix
N = 120; Extraction method = Principal Axis Factoring; Rotation method = Varimax

[156]
Table 5.04
EFA results: Company sample with leader ratings at stage 2(reduced 15-item scale)
Note: Table shows factor loadings from the rotated factor matrix
N = 121; Extraction method = Principal Axis Factoring; Rotation method = Varimax
Company sample:
Leader ratings
Stage 2 (reduced 15 item
scale)
Item
Social/
Philanthropy Stakeholder Environment Economic
2. Organises events in the
wider community (e.g. fairs,
bazaars, fashion show etc.)
[soc2]
.796
3. Assists in community
projects [soc3] .858
6. Gets involved in volunteer
or social groups in the wider
community [soc6]
.885
7. Participates in charity events
[phil7] .704
8. Raises money for charity
[phil8] .744
10. Organises charity events
and/or fundraisers [phil10] .747
16. Acts fairly towards others
[stake16] .771
17. Is helpful towards others
[stake17] .835
18. Treats others with respect
[stake18] .774
21. Disposes of waste
appropriately [env21] .896
22. Recycles [env22] .815
23. Behaves in an
environmentally friendly
manner [env23]
.717
28. Is efficient in his/her daily
tasks [econ28] .799
30. Meets deadlines [econ30] .713
32. Does his/her fair share of
the work [econ32] .765

[157]
When EFA was run on the full ESR scale (i.e. 32 items) with the company sample consisting
of team member self-ratings, five factors were extracted accounting for approximately 73.5%
of the variance (Table 5.05). Again the rotation matrix showed that items pertaining to the
philanthropy and social dimensions loaded on one factor, whereas the items for the other
dimensions loaded on their respective factors, with some instances of cross loadings.
To further refine the scale, items were deleted as per the leader file to check if the same factor
pattern could be retrieved from the two data files, in stage two. Whilst the legal items did
load on one factor with team member self-ratings of ESR, because the loadings were not
necessarily considered strong (both falling within the 0.6 range), and since theoretically the
value of the legal dimension to the scale was originally contested (see chapter two), at this
stage the decision was made to exclude this dimension conclusively. This led to four factors
being extracted accounting for 81% of the variance. Here all philanthropy and social items
loaded on factor 1, stakeholder items loaded on factor 2, environmental items loaded on
factor 3, and finally items referring to the economic dimension loaded on factor 4 (Table
5.06).
Note, in order to ensure analytical rigour, the above was repeated using oblique rotation,
specifically Direct Oblimin. This revealed rotated factor structures that were comparable,
thus demonstrating a reasonable sensitivity analysis.
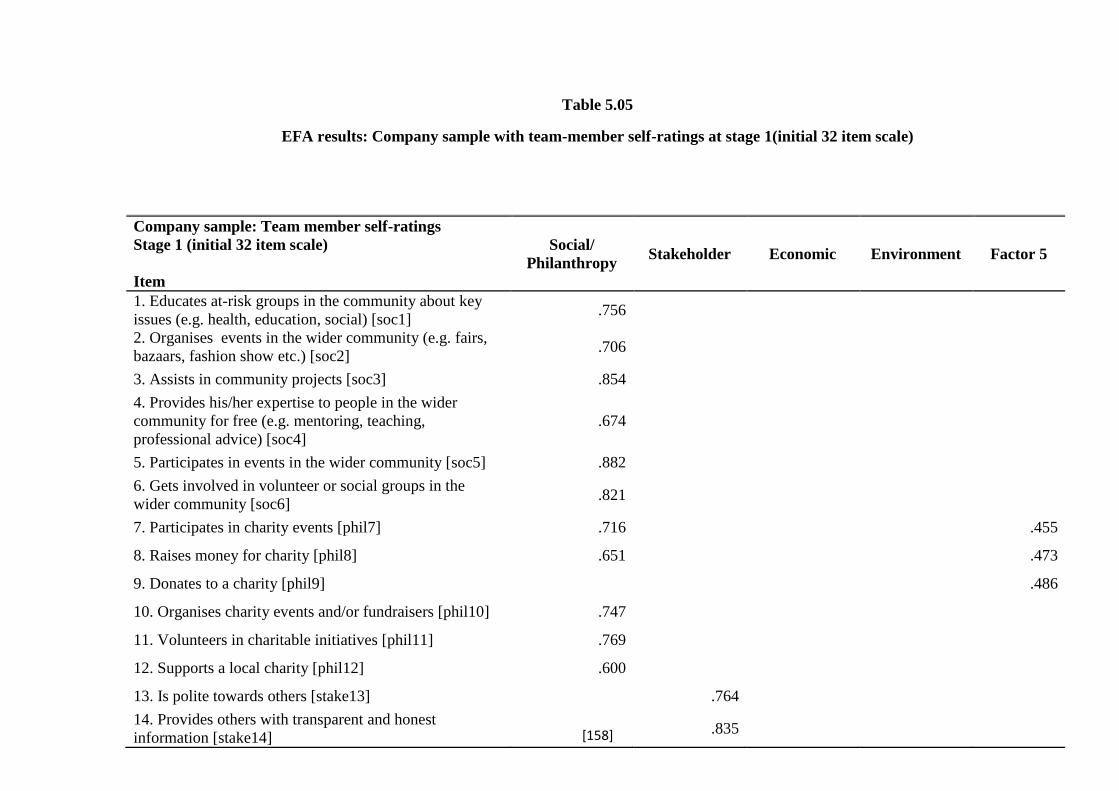
[158]
Table 5.05
EFA results: Company sample with team-member self-ratings at stage 1(initial 32 item scale)
Company sample: Team member self-ratings
Stage 1 (initial 32 item scale)
Item
Social/
Philanthropy Stakeholder Economic Environment Factor 5
1. Educates at-risk groups in the community about key
issues (e.g. health, education, social) [soc1] .756
2. Organises events in the wider community (e.g. fairs,
bazaars, fashion show etc.) [soc2] .706
3. Assists in community projects [soc3] .854
4. Provides his/her expertise to people in the wider
community for free (e.g. mentoring, teaching,
professional advice) [soc4]
.674
5. Participates in events in the wider community [soc5] .882
6. Gets involved in volunteer or social groups in the
wider community [soc6] .821
7. Participates in charity events [phil7] .716 .455
8. Raises money for charity [phil8] .651 .473
9. Donates to a charity [phil9] .486
10. Organises charity events and/or fundraisers [phil10] .747
11. Volunteers in charitable initiatives [phil11] .769
12. Supports a local charity [phil12] .600
13. Is polite towards others [stake13] .764
14. Provides others with transparent and honest
information [stake14] .835

[159]
Note: Table shows factor loadings from the rotated factor matrix
N = 101; Extraction method = Principal Axis Factoring; Rotation method = Varimax
15. Listens to the viewpoints of others [stake15] .863
16. Acts fairly towards others [stake16] .930
17. Is helpful towards others [stake17] .911
18. Treats others with respect [stake18] .904
19. Uses renewable resources where possible [env19] .706
20. Saves energy [env20] .753
21. Disposes of waste appropriately [env21] .823
22. Recycles [env22] .814
23. Behaves in an environmentally friendly manner
[env23] .872
24. Reduces the environmental impact of his/her travel
[env24] .544
25. Adheres to rules and regulations [leg25] .652
26. Obeys the law [leg26] .672
27. Looks for ways to cut costs [econ27]
28. Is efficient in his/her daily tasks [econ28] .700
29. Completes work to a high standard [econ29] .793
30. Meets deadlines [econ30] .828
31. Achieves his/her goals and objectives [econ31] .876
32. Does his/her fair share of the work [econ32] .834

[160]
Table 5.06
EFA results: Company sample with team member self-ratings at stage 2
(Reduced 15 item scale)
Company sample: Team
member self-ratings
Stage 2 (reduced 15 item
scale)
Item
Social/
Philanthropy Stakeholder Environment Economic
2. Organises events in the
wider community (e.g.
fairs, bazaars, fashion show
etc.) [soc2]
.616
3. Assists in community
projects [soc3] .814
6. Gets involved in
volunteer or social groups
in the wider community
[soc6]
.838
7. Participates in charity
events [phil7] .820
8. Raises money for charity
[phil8] .747
10. Organises charity events
and/or fundraisers [phil10] .818
16. Acts fairly towards
others [stake16] .910
17. Is helpful towards
others [stake17] .919
18. Treats others with
respect [stake18] .924
21. Disposes of waste
appropriately [env21] .867
22. Recycles [env22] .888
23. Behaves in an
environmentally friendly
manner [env23]
.926
28. Is efficient in his/her
daily tasks [econ28] .748
30. Meets deadlines
[econ30] .820
32. Does his/her fair share
of the work [econ32] .776
Note: Table shows factor loadings from the rotated factor matrix
N = 101; Extraction method = Principal Axis Factoring; Rotation method = Varimax

[161]
5.4.2. Confirmatory Factor Analysis
With EFA, a shortcoming is its inability to demonstrate goodness of fit of the resultant
model. This is because, as noted above, PAF is considered an exploratory method for the
purposes of finding the underlying factor structure, and as a result no standard errors are
yielded by the analysis, rendering it unable to estimate model fit (Schmitt, 2011). In order to
overcome this, confirmatory factor analysis (CFA) was conducted using AMOS (version 21)
in order to test the overall fit of the model by way of comparison of a single common factor
model with a multifactor model, as well as other possible models.
In contrast to EFA, in CFA, the model is specified a priori, as well as the zero and non-zero
loadings on the factors (Fabrigar et al., 1999). Contrary to popular belief, Borkenau and
Ostendorf (1990) argue that CFA is not necessarily the logical subsequent step to EFA, rather
it is a procedure with its own unique set of assumptions. CFA relies on the actual correlations
not differing significantly from those predicted by the model, which would otherwise lead to
the rejection of the model. Furthermore, CFA expects variables to load on the appropriate
factor, with close to zero loadings on other inappropriate factors, and is concerned with how
well the model specified fits the data set.
A common misunderstanding is that CFA is used to confirm the goodness of fit of the model
found as a result of EFA; however in many cases this does not play out (cf. Hinkin, 1998;
Schmitt, 2011). Kline (2005) in fact suggests that the model resulting from the EFA may be
shown to have poor fit in CFA. This could be due to reasons such as high factor loadings in
EFA being defined as free parameters in CFA, and cross loadings being reduced to zero,
which runs the danger of producing large inter-factor correlations (Schmitt and Sass, 2011;
van Prooijen and van der Kloot, 2001). Because of this, in the current study CFA was not
used to confirm the factor structure resulting from EFA, rather the model was set up in its
entirety in CFA and items were then reduced as per the modification indices and so forth.
This was an iterative process and so the model resulting from CFA was further explored in
EFA to ensure the best fitting and also the most conceptually sound model; a practise that is
deemed reasonable (Schmitt, 2011).
Different research employs different fit statistics in order to assess the fit of the proposed
model. All research tends to report the chi-square statistic (χ²) as normal protocol. Aside from
χ², there are a number of statistics which are commonly deployed to assess model fit (Kline,
2005; Schmitt, 2011). However the utility of approximate fit statistics is debated and so as

[162]
per the recommendations of Schmitt (2011), they were used to supplement the χ² test. A
common criticism tends to be that research uses those indices which are favourable in
supporting a good model fit (Kline, 2005). To prevent this bias, indices were chosen in line
with recommendations prior to analyses, and a mixture of fit indices was used to overcome
any apparent weaknesses of one another (Bentler, 2007; Kline, 2005; Schmitt, 2011).
The χ², Goodness of Fit index (GFI; Jöreskog and Sörbon, 1986), Root Mean Square Error of
Approximation (RMSEA; Kline, 2005), Tucker-Lewis Index (TLI; Tucker and Lewis, 1973),
and Comparative Fit Index (CFI; Bentler, 1990) were used to assess the fit of the model. Cut-
off values are recommended for goodness of fit indices, although the advice is not to interpret
these as golden rules of thumb (Marsh et al., 2004). Below listed are the fit indices that were
used in the current research. Theoretically, the model fit is considered acceptable when χ² is
not significant, the RMSEA has a value of 0.08 or below, and the GFI, CFI, and TLI are all
above 0.9, and more ideally, greater than 0.95 (e.g. Kline, 2005).
5.4.2.1.Assessing model fit
The χ² test is an example of an absolute fit index which assesses how well an a priori model
fits the data (McDonald and Ho, 2002). It is a traditional means of assessing goodness of fit,
whereby it is recommended that the smaller the value, the better the fit; with non-significance
being desirable (Hinkin, 1998). A χ² value that is two to three times larger than the degrees of
freedom is also considered acceptable; although the closer it is to the degrees of freedom, the
better (Carmines and McIver, 1981; Thacker, Fields, and Tetrick, 1989). A χ² value of zero
suggests that the specified model fits the data perfectly, that is, the predicted correlations and
covariances are equivalent to the actual correlations and covariances; whereas the higher the
χ² is, the worse the model fit is (Kline, 2005). When χ² is not significant, we can accept the
null hypothesis, which is that the specified model is acceptable.
A well-known criticism levelled against this test is its large dependence on sample size, as
well as on other model characteristics. For example, high correlations can cause the χ² value
to increase which would make it increasingly unlikely that the null hypothesis is accepted
(Kline, 2005). Consequently, this has led to proposals for the use of supplementary goodness
of fit indices for testing model fit (Hu and Bentler, 1998; Schmitt, 2011).

[163]
The goodness of fit index (GFI) is an example of an absolute fit index which assesses how
well the model fits the data in comparison to no model at all, and was proposed as an
alternative to χ² (Jöreskog and Sörbon, 1986). This index examines the extent to which the
variance in the sample covariance matrix can be accounted for by the model. A value of 1.0
indicates a perfect fit of the model, however in reality it is recommended that as this is rarely
attained, values of 0.90 or above are acceptable and indicative of a good fit (Kline, 2005).
Indeed, Miles and Shevlin (1998) recommend a cut-off value of 0.95 for those models with
low factor loadings and sample sizes. A weakness of this index is its sensitivity to matters
such as parameter increases and sample sizes (Miles and Shevlin, 1998).
Root mean square error of approximation (RMSEA), also an absolute fit index, is a
parsimony-adjusted index, and so it corrects for model complexity within the formula, and
prefers the simpler model over two competing models (Kline, 2005). This fit statistic is
touted as ‘one of the most informative fit indices’ (Diamantopoulos and Siguaw; 2000, pg.
85). The RMSEA index assumes that the model does not fit the data perfectly, but reflects
reality (Raykov and Marcoulides, 2000). The closer the RMSEA value is to zero, the better
the fit; however this is rarely attained, and instead the value should ideally be no greater than
0.06, with a suggested absolute maximum of 0.08 (Hu and Bentler, 1999). Others note that a
value of less than 0.05 indicates a good fit, whereas a value between 0.06 and 0.08 is
indicative of a reasonable fit, and anything above 0.10 is considered to reflect a poor fit
(Kline, 2005). Ideally, the lower bound of the 90% confidence interval provided should be
close to zero or at least within the acceptable values listed above, and the upper bound be no
greater than 0.10 (Kline, 2005).
It is recommended that in addition to absolute fit indices, two additional incremental indices
also be reported (Hoyle and Panter, 1995). There are three types of incremental fit indexes,
and in the present research the following two will be reported: TLI and CFI. The Tucker
Lewis index (TLI), also known as the Non-Normed Fit Index (NNFI), is an example of a type
two index which assesses the extent to which a model is an improvement over a baseline/null
model. The TLI overcomes the issue of sensitivity to sample sizes that was apparent with the
Normed Fit Index (NFI; Bentler and Bonnet, 1980). This index prefers simpler models,
although results can yield poor fit with small sample sizes, in contrast to the indications of
other fit indices (Kline, 2005). A cut-off value of 0.90, and in some cases, a cut-off value of
0.95 is suggested to be indicative of a good fit (Hu and Bentler, 1999). A possible
[164]
complication with this model is its indication of worse fit in correctly specified models, but
with an increasing number of variables in the model (Kenny and McCoach, 2003).
The comparative fit index (CFI: Bentler, 1990) is an example of a type three index which
assumes a non-central χ² distribution (Hu and Bentler, 1998). It compares the researcher’s
model to a baseline (usually null) model, and in comparison to TLI, performs well even when
sample sizes are small (Kline, 2005). This index does not assume that the researcher’s model
fits the data perfectly; rather it measures the improvement of fit with the data compared to the
null model (Kline, 2005). It is advised that CFI may be more appropriate in contrast to the χ²
test (Kline, 2005). Here a CFI value of greater than 0.90 is considered acceptable (Hinkin,
1998). Hu and Bentler (1999) suggest a cut off of 0.95 for continuous data and 0.96 for
categorical data, in order that incorrectly specified models may not be erroneously accepted.
A criticism arrayed against this model usually is the fact that the null model assumes zero
covariances, considered scientifically implausible, and so any improvement in fit of the
researcher’s model compared to this null model is somewhat blasé (Kline, 2005).
The above indices have their own individual strengths and limitations. Majority, if not all of
the research, tends to report the χ² as normal protocol, but varies in terms of the additional
goodness of fit indices used. A commonly levelled criticism tends to be that research uses
those indices which are favourable in supporting a good model fit (Kline, 2005). To prevent
this bias, the above indices were chosen in line with recommendations in the hope that the
combination of them would overcome apparent weaknesses; this choice was made prior to
conducting CFA (Bentler, 2007; Kline, 2005; McDonald and Ho, 2002; Schmitt, 2011).
5.4.2.2.Confirmatory factor analysis results
As opposed to confirming the structure found in EFA, in order to be more rigorous,
confirmatory factor analysis was conducted with the full set of 32 items with the purpose of
examining the model that would best fit the data in a bottom up fashion, as opposed to top-
down via EFA; as per the above noted recommendations. In order to refine the scale, items
were deleted through the use of modification indices, standardised residual covariances, as
well as poor item loadings. This was an iterative process and items were deleted one by one
to ensure no adverse effect on model fit, after having deleted a specific item. The model that
appeared to work best with the data as well as make good conceptual sense was one with five
individual dimensions that were allowed to co-vary.
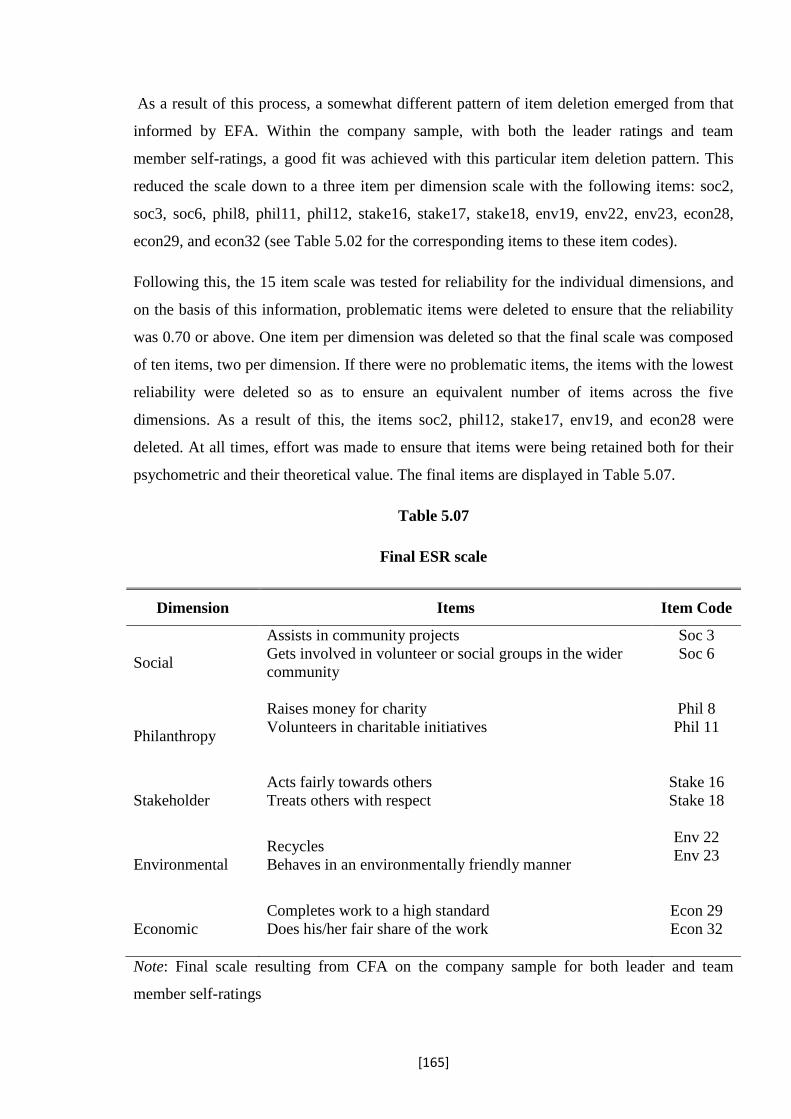
[165]
As a result of this process, a somewhat different pattern of item deletion emerged from that
informed by EFA. Within the company sample, with both the leader ratings and team
member self-ratings, a good fit was achieved with this particular item deletion pattern. This
reduced the scale down to a three item per dimension scale with the following items: soc2,
soc3, soc6, phil8, phil11, phil12, stake16, stake17, stake18, env19, env22, env23, econ28,
econ29, and econ32 (see Table 5.02 for the corresponding items to these item codes).
Following this, the 15 item scale was tested for reliability for the individual dimensions, and
on the basis of this information, problematic items were deleted to ensure that the reliability
was 0.70 or above. One item per dimension was deleted so that the final scale was composed
of ten items, two per dimension. If there were no problematic items, the items with the lowest
reliability were deleted so as to ensure an equivalent number of items across the five
dimensions. As a result of this, the items soc2, phil12, stake17, env19, and econ28 were
deleted. At all times, effort was made to ensure that items were being retained both for their
psychometric and their theoretical value. The final items are displayed in Table 5.07.
Table 5.07
Final ESR scale
Dimension Items Item Code
Social
Assists in community projects
Gets involved in volunteer or social groups in the wider
community
Soc 3
Soc 6
Philanthropy
Raises money for charity
Volunteers in charitable initiatives
Phil 8
Phil 11
Stakeholder
Acts fairly towards others
Treats others with respect
Stake 16
Stake 18
Environmental
Recycles
Behaves in an environmentally friendly manner
Env 22
Env 23
Economic
Completes work to a high standard
Does his/her fair share of the work
Econ 29
Econ 32
Note: Final scale resulting from CFA on the company sample for both leader and team
member self-ratings

[166]
On this reduced 10 item scale, CFA was conducted for competing models in order to ensure
that the first order five factor dimensional model was indeed the best fitting model for both
the leader ratings and team member self-ratings in the company sample. Here five models
were tested. Firstly a null model was tested where the 10 items did not load on any factor to
serve as the baseline, to which the subsequent models were compared. Following this, a first-
order one factor model, where all the items loaded onto an overall ESR factor was tested,
which represented a single ESR scale with no underlying dimensions. Furthermore, a first-
order five factor model, where the items loaded onto their respective five dimensions, was
also tested; which were all correlated, in order to represent five mutually inter-related ESR
dimensions. Additionally, a second-order model was tested whereby the items loaded onto
the five dimensions accordingly, which loaded on an overall ESR factor. Finally there was
also a further second-order model, where items loaded onto one of the five dimensions, and
here the social and philanthropy dimensions loaded onto one overarching factor, and the
stakeholder environment and economic dimensions loading onto a second overarching factor;
a model informed by the EFA results where the social and philanthropy items persistently
loaded onto one factor, as well as interviewee responses that these two were equivalent
and/or highly inter-related. Note that no constraints were added to these models.
As can be seen in Table 5.08, the first order five factor model resulted in the best fit with both
the leader ratings (χ² = 25.66; p>0.05) and the team member self-ratings (χ² = 27.36; p>0.05).
As well as the χ² being non-significant, meaning we can accept that the model fits the data, all
the other indices met the cut-offs confidently. The final CFA models for the company sample
for leader-ratings (Figure 5.01) and team member self-ratings (Figure 5.02) are graphically
depicted below.

[167]
Table 5.08
CFA results for company sample: Leader and team-member ratings
Company sample – Leader ratings¹
Model χ² DF GFI RMSEA TLI CFI
Null 747.39
(p<0.001) 45 0.40 0.36 0.00 0.00
One Factor 420.17
(p<0.001) 35 0.57 0.30 0.30 0.45
Five Factors 25.66
(p = 0.43) 25 0.96 0.02 1.00 1.00
Second Order (5
dimensions; 1 factor)
87.20
(p<0.001) 30 0.89 0.13 0.88 0.92
Second Order
(5 dimensions; 2 factors)
34.54
(p = 0.22) 29 0.95 0.04 0.99 0.99
Company sample – Team member self-ratings²
Null 796.22
(p<0.001) 45 0.41 0.41 0.00 0.00
One Factor 473.14
(p<0.001) 35 0.55 0.35 0.25 0.42
Five Factors 27.36
(p = 0.34) 25 0.95 0.03 0.99 1.00
Second Order (5
dimensions; 1 factor)
103.37
(p<0.001) 30 0.86 0.16 0.85 0.90
Second Order
(5 dimensions; 2 factors)
30.41
(p = 0.39) 29 0.94 0.02 1.00 1.00
Note: ¹N = 120 ²N = 101

[168]
Figure 5.01
Final five factor model: Company sample - leader ratings

[169]
Figure 5.02
Final five factor model: Company sample - team member self-ratings

[170]
5.4.3. Reliability analysis
The reliability (Table 5.09) was tested for the final ten-item scale for both the leader ratings
and team member self-ratings in the company sample, for the individual dimensions as well
as the full scale. Internal consistency by means of Cronbach’s alpha (α) is the most common
means of scrutinising reliability. A minimum α of 0.70 is suggested in order to demonstrate
strong item covariance and the appropriate sampling of the domain of interest (Churchill,
1979; Nunnally, 1976). For all dimensions, as well as the overall scale; in all cases the
reliability exceeded 0.7, as recommended by Nunnally (1976). Given that the issue of
calculating α for two-item scales is a contentious one, the correlations between the two items
for each dimension, were also calculated, and these are provided in brackets under the α (see
Eisinga, te Grotenhuis, and Pelzer, 2013). These Pearson correlation coefficients revealed
that the two items within each dimensions were significantly, positively, and highly
correlated with one another.
Table 5.09
Reliability and Pearson correlation coefficients: Company sample
Sample Social Philanthropy Stakeholder Environmental Economic Full
Scale
Leader
ratings¹
0.92
(.84**)
0.89
(.80**)
0.84
(.72**)
0.75
(.61**)
0.88
(.80**) 0.82
Team
member
self-
ratings²
0.86
(.76**)
0.79
(.65**)
0.97
(.94**)
0.94
(.89**)
0.90
(.83**) 0.76
Note: ¹N = 121 ²N = 101/ **p<0.01
5.4.4. Inter-factor correlations
Inter-factor correlations were computed for both the leader ratings and the team member self-
ratings within the company sample. In reference to the leader ratings (Table 5.10), all the
dimensions were moderately correlated with one another barring an exception, namely
between the philanthropy and environmental dimensions. Furthermore, all dimensions were
significantly and highly correlated with the overall ESR scale, thus suggesting that the
individual dimensions all tapped into the overall ESR construct.

[171]
Table 5.10
Inter-factor correlations: Company sample (leader-ratings)
Company sample
Leader-ratings 1 2 3 4 5 6
1.Full scale -
2.Social .78** -
3.Philanthropy .79** .65** -
4.Stakeholder .69** .34** .41** -
5.Environmental .49** .18* .06 .29** -
6.Economic .59** .19* .22* .61** .35** -
Note: N = 121; **p<0.01 *p<0.05
With regards to the team member self-ratings of ESR in the company sample (Table 5.11),
the social and philanthropy dimensions did not correlate significantly with the stakeholder,
environmental, or economic dimensions. This most likely reflects the divide between the
more extra-role nature of social and philanthropy behaviours, and the more in-role nature of
stakeholder, economic, and environmental behaviours. Nevertheless, given that the intention
was not to use team-member self-ratings in subsequent hypotheses testing, this issue was not
given further consideration. Aside from this, all other pairings were significantly correlated,
and all the dimensions were significantly and highly correlated with the overall ESR scale.
Table 5.11
Inter-factor correlations: Company sample (team member self-ratings)
Company sample
Team-member ratings 1 2 3 4 5 6
1.Full scale -
2.Social .72** -
3.Philanthropy .81** .71** -
4.Stakeholder .45** -.05 .05 -
5.Environmental .47** -.06 .13 .37** -
6.Economic .46** -.03 .05 .57** .39** -
Note: N = 101; **p<0.01 *p<0.05

[172]
5.5.Scale validation: Business Game sample
After having initially validated the scale in the company scale, to further validate the scale
and thus ensure the robustness of the final scale, the findings from the company sample were
replicated in the Business Game (BG) sample. This sample consisted of groups of individuals
working within a simulated business game environment, with team members nested within
teams/ leaders. Data from this sample was collected in a time-lagged study and so leaders and
team members provided ratings at three time points over a ten week period (time1/week1,
time 2/week 4, time 3/ week7). In this sample, leaders provided ratings of their subordinates’
ESR, and team members provided ratings of ESR for their fellow peers in a 360º fashion. For
greater details on this sample, the reader is referred to the Methodology and Samples chapter
(chapter four).
5.5.1. Exploratory factor analysis: Leader ratings
As with the company sample, coefficient values below 0.4 were suppressed when running the
EFAs on the BG sample, but this time no criteria were used to extract the number of factors,
rather the analysis was forced to extract four factors. This was so that it could be discerned if
the same factor structure could be replicated in the business game sample, with the leader and
team member ratings, at times 1, 2 and 3, as was the case with the company sample.
For time 1 (Table 5.12) with the leader ratings, only three factors had Eigenvalues greater
than 1. Collectively the four factors accounted for 82.3% of the variance. The items loaded
relevantly on their respective factors with no cross-loadings apparent. As with the company
sample, items pertaining to the factors social and philanthropy loaded on one factor.
At time 2 (Table 5.13) with the leader ratings, when imposing a four factor extraction, the
rotation did not converge. However when a four factor extraction was not imposed, rather
factors were extracted based upon Eigenvalues greater than 1, then the rotation did converge.
This surprisingly revealed a three factor structure whereby the items pertaining to the social
and philanthropic dimensions loaded on one factor and items from the environmental
dimension loaded onto another factor, as typical; however the items from the stakeholder and
economic dimension also loaded collectively on one factor. Cumulatively, these three factors
accounted for 79.7% of the variance.

[173]
For time 3 leader ratings of ESR (Table 5.14), only three of the factors had Eigenvalues
greater than 1, with the four factors collectively accounting for 90.4% of the variance. All
items again loaded on the appropriate factors, with social and philanthropy items loading on
the same factor again. However the issue in this instance was that the two stakeholder items
also tended to load on the economic dimension, as was the case at time 2, albeit with
substantially reduced loading strengths.
Note, in order to ensure analytical rigour, the above was repeated using oblique rotation,
specifically Direct Oblimin. This revealed rotated factor structures that were comparable,
thus demonstrating a reasonable sensitivity analysis.
Table 5.12
EFA results: BG sample with leader-ratings (Time 1)
BG sample:
Leader ratings- Time 1
Social/
Philanthropy Environment Stakeholder Economic
3. Assists in community
projects [soc3] .711
6. Gets involved in
volunteer or social groups
in the wider community
[soc6]
.679
8. Raises money for charity
[phil8] .818
11. Volunteers in charitable
initiatives [phil11] .795
16. Acts fairly towards
others [stake16] .843
18. Treats others with
respect [stake18] .851
22. Recycles [env22] .927
23. Behaves in an
environmentally friendly
manner [env23]
.819
29. Completes work to a
high standard [econ29] .758
32. Does his/her fair share
of the work [econ32] .877
Note: Table shows factor loadings from the rotated factor matrix - (Imposed four factor
extraction)
N = 188; Extraction method = Principal Axis Factoring; Rotation method = Varimax

[174]
Table 5.13
EFA results: BG sample with leader ratings (Time 2)
BG sample:
Leader ratings- Time 2
Stakeholder/
Economic
Social/
Philanthropy Environmental
3. Assists in community projects
[soc3] .775
6. Gets involved in volunteer or
social groups in the wider
community [soc6]
.851
8. Raises money for charity
[phil8] .888
11. Volunteers in charitable
initiatives [phil11] .730
16. Acts fairly towards others
[stake16] .894
18. Treats others with respect
[stake18] .780
22. Recycles [env22] .768
23. Behaves in an
environmentally friendly manner
[env23]
.945
29. Completes work to a high
standard [econ29] .805
32. Does his/her fair share of the
work [econ32] .810
Note: Table shows factor loadings from the rotated factor matrix - (Factors extracted with
Eigenvalues greater than 1)
N = 213; Extraction method = Principal Axis Factoring; Rotation method = Varimax

[175]
Table 5.14
EFA results: BG sample with leader ratings (Time 3)
BG sample:
Leader ratings-Time 3
Social/
Philanthropy Economic Environment Stakeholder
3. Assists in community
projects [soc3] .821
6. Gets involved in
volunteer or social groups
in the wider community
[soc6]
.926
8. Raises money for charity
[phil8] .875
11. Volunteers in charitable
initiatives [phil11] .931
16. Acts fairly towards
others [stake16] .412 .792
18. Treats others with
respect [stake18] .427 .773
22. Recycles [env22] .945
23. Behaves in an
environmentally friendly
manner [env23]
.741
29. Completes work to a
high standard [econ29] .899
32. Does his/her fair share
of the work [econ32] .837
Note: Table shows factor loadings from the rotated factor matrix - (Imposed four factor
extraction)
N = 209; Extraction method = Principal Axis Factoring; Rotation method = Varimax
5.5.2. Exploratory factor analysis: Team member ratings
In regards to the team member 360º ratings of ESR in the BG sample, for time 1 (Table 5.15),
two of the factors had Eigenvalues greater than 1. The four factors collectively accounted for
87.3% of the variance. At time 2 (Table 5.16), the four factors accounted for 87.4% of the
variance, and only two had Eigenvalues greater than one. Finally, at time 3 (Table 5.17), the
four factors accounted for 89% of the variance, and as with time 1 and 2; two factors had
Eigenvalues greater than one. Across all time points, the items loaded onto their respective
factors. When cross-loadings were present, the loadings onto the second irrelevant factor
tended to be significantly lower, and thus relatively trivial. On the whole, the four-factor

[176]
structure yielded by the company sample, tended to be replicated in the BG sample with
leader and team-member ratings of ESR, albeit with occasional instances of cross-loadings.
Note, in order to ensure analytical rigour, the above was repeated using oblique rotation,
specifically Direct Oblimin. This revealed rotated factor structures that were comparable,
thus demonstrating a reasonable sensitivity analysis.
Table 5.15
EFA results: BG sample with team member ratings (Time 1)
BG sample:
Team member ratings-
Time 1
Social/ Philanthropy Stakeholder Environment Economic
3. Assists in community
projects [soc3] .825
6. Gets involved in
volunteer or social
groups in the wider
community [soc6]
.835
8. Raises money for
charity [phil8] .825
11. Volunteers in
charitable initiatives
[phil11]
.843
16. Acts fairly towards
others [stake16] .794
18. Treats others with
respect [stake18] .867
22. Recycles [env22] .846
23. Behaves in an
environmentally friendly
manner [env23]
.765
29. Completes work to a
high standard [econ29] .448 .737
32. Does his/her fair
share of the work
[econ32]
.835
Note: Table shows factor loadings from the rotated factor matrix - (Imposed four factor
extraction)
N = 218; Extraction method = Principal Axis Factoring; Rotation method = Varimax

[177]
Table 5.16
EFA results: BG sample with team member ratings (Time 2)
BG sample:
Team member ratings-
Time 2
Social/ Philanthropy Stakeholder Economic Environment
3. Assists in community
projects [soc3] .847
6. Gets involved in
volunteer or social
groups in the wider
community [soc6]
.683
8. Raises money for
charity [phil8] .908
11. Volunteers in
charitable initiatives
[phil11]
.825
16. Acts fairly towards
others [stake16] .806
18. Treats others with
respect [stake18] .805 .413
22. Recycles [env22] .850
23. Behaves in an
environmentally friendly
manner [env23]
.719
29. Completes work to a
high standard [econ29] .784
32. Does his/her fair
share of the work
[econ32]
.750
Note: Table shows factor loadings from the rotated factor matrix - (Imposed four factor
extraction)
N = 218; Extraction method= Principal Axis Factoring; Rotation method=Varimax

[178]
Table 5.17
EFA results: BG sample with team member ratings (Time 3)
BG sample:
Team member ratings-
Time 3
Social/ Philanthropy Economic Environment Stakeholder
3. Assists in community
projects [soc3] .802
6. Gets involved in
volunteer or social
groups in the wider
community [soc6]
.886
8. Raises money for
charity [phil8] .819
11. Volunteers in
charitable initiatives
[phil11]
.782
16. Acts fairly towards
others [stake16] .401 .812
18. Treats others with
respect [stake18] .424 .727
22. Recycles [env22] .790
23. Behaves in an
environmentally friendly
manner [env23]
.793
29. Completes work to a
high standard [econ29] .802
32. Does his/her fair
share of the work
[econ32]
.844
Note: Table shows factor loadings from the rotated factor matrix - (Imposed four factor
extraction)
N = 217; Extraction method = Principal Axis Factoring; Rotation method = Varimax

[179]
5.5.3. Confirmatory factor analysis
In the company sample, confirmatory factor analysis revealed that whilst EFA was indicating
a four factor structure, with social and philanthropy items loading onto the same factor, the
first-order five factor model demonstrated a better model fit. That is, the five factor model,
where the items loaded onto their respective dimensions, which were inter-related; had a
better fit compared to the null model, the one factor model (all items tap into an overarching
construct of ESR), the second-order model where the five dimensions of ESR tapped into an
overall ESR construct, and an alternative second-order model where the social and
philanthropy dimensions tapped into an overarching factor, and the stakeholder,
environmental, and economic dimensions tapped into a second overarching factor. To further
validate and confirm this five factor model, the model fit for the models discussed was
compared in the BG sample for both team member and leader ratings across times 1, 2 and 3,
in order to deduce if the five factor model was indeed the best fitting model in this sample, to
further ensure robustness of the final model.
Confirmatory factor analysis (CFA) was henceforth conducted on the five competing models
in order to test for model fit. As with the company sample, the five models consisted of the
null model, a first-order one factor model where all items loaded onto an overall ESR factor,
a first-order five factor model where the five ESR dimensions were correlated with one
another, a second-order model with the five individual dimensions loading onto an overall
ESR factor, and an additional second-order model whereby the social and philanthropy
dimensions loaded onto one overarching factor, and the stakeholder, environment and
economic dimensions onto another overarching factor. This was done for both leader and
team member ratings of ESR in the BG sample, across all three time points. Note that no
constraints were added to these models.
With regards to the leader ratings in the BG sample (Table 5.18), for time 1, the five factor
model and the second-order two factor model (five dimensions tapping into two overarching
factors), were comparable in terms of fit. The five factor model had a lower chi-square value;
however, the second order model had a more ideal RMSEA and TLI score, making both
models competitive. For time 2 and time 3, the best fitting model was the five factor model
(time 2: χ² = 47.67; p<0.05| time 3: χ ² = 114.16; p<0.001). It should be noted however that
the RMSEA score of 0.15 was above the absolute cut-off of 0.10 for time 3. Nevertheless,
given that the other indices met the cut-off criteria, this was considered negligible.

[180]
Table 5.18
CFA results: BG sample with leader ratings
Note: Confirmatory factor analysis results for the leader ratings in the BG sample across all
three time points; N = 170
BG sample with leader ratings-Time 1
Model χ² DF GFI RMSEA TLI CFI
Null 987.14
(p<0.001) 45 0.43 0.35 0.00 0.00
One Factor 568.73
(p<0.001) 35 0.60 0.30 0.27 0.43
Five Factors 54.33
(p<0.05) 25 0.94 0.08 0.94 0.97
Second Order (5
dimensions; 1 factor)
146.12
(p<0.001) 30 0.86 0.15 0.82 0.88
Second Order
(5 dimensions; 2
factors)
55.69
(p<0.01) 29 0.94 0.07 0.96 0.97
BG sample with leader ratings -Time 2
Null 1261.59
(p<0.001) 45 0.38 0.40 0.00 0.00
One Factor 750.86
(p<0.001) 35 0.54 0.35 0.24 0.41
Five Factors 47.67
(p<0.05) 25 0.95 0.07 0.97 0.98
Second Order (5
dimensions; 1 factor)
183.68
(p<0.001) 30 0.85 0.17 0.81 0.87
Second Order
(5 dimensions; 2
factors)
62.56
(p<0.001) 29 0.93 0.08 0.96 0.97
BG sample with leader ratings -Time 3
Null 1730.56
(p<0.001) 45 0.31 0.47 0.00 0.00
One Factor 1071.58
(p<0.001) 35 0.45 0.42 0.21 0.39
Five Factors 114.16
(p<0.001) 25 0.90 0.15 0.91 0.95
Second Order (5
dimensions; 1 factor)
456.75
(p<0.001) 30 0.74 0.29 0.62 0.75
Second Order
(5 dimensions; 2
factors)
138.74
(p<0.001) 29 0.88 0.15 0.90 0.94

[181]
When CFA was run on the BG sample with team-member ratings (Table 5.19), the best
fitting model again was the five factor model across all 3 time points. At time 1, the χ² value
of 28.39 (p>0.05) was not significant allowing us to accept the null hypothesis. At time 2, the
χ² of 50.59 was significant (p<0.05), however all other indices of fit were acceptable. At time
3, the χ² again was not significant (χ² = 33.85; p>0.05), allowing us to accept the null
hypothesis once again. Across all three time points, the other indices of fit were at acceptable
levels and indicated that the five factor model was indeed the best fitting model. The
graphical models of these final five factor models, for both the team member and leader
ratings within the BG sample can be found in Appendix 9.
5.5.4. Reliability analysis
Reliability analysis was conducted on the final ten-item ESR measure, for the individual
dimensions as well as the overall ESR scale (Table 5.20). This was done for leader ratings of
ESR as well as team member ratings of ESR in the BG sample, for all three time points. With
the exception of one case, all other reliability values exceeded the recommended cut-off of
0.70. The α for the social dimension, with the leader ratings at time 1, was 0.69 thus just
falling short of the cut-off of 0.70. However since it was on the fence, and was not recurrent
at any other point in the BG sample, this was not considered problematic. Given that there is
disagreement as to whether α should be calculated for two-item scales, Pearson’s correlation
coefficients between the two items within each dimension were additionally calculated, and
these are given in brackets under the α for each dimension (Eisinga et al., 2013).

[182]
Table 5.19
CFA results: BG sample with team member ratings
Note: Confirmatory factor analysis results for the team member ratings in the BG sample
across all three time points; N = 210
BG sample with team member ratings-Time 1
Model χ² DF GFI RMSEA TLI CFI
Null 1557.37
(p<0.001) 45 0.32 0.40 0.00 0.00
One Factor 727.20
(p<0.001) 35 0.55 0.31 0.41 0.54
Five Factors 28.39
(p=0.290) 25 0.97 0.03 1.00 1.00
Second Order (5
dimensions; 1 factor)
174.05
(p<0.001) 30 0.86 0.15 0.86 0.91
Second Order
(5 dimensions; 2
factors)
67.41
(p<0.001) 29 0.94 0.08 0.96 0.98
BG sample with team member ratings -Time 2
Null 1714.12
(p<0.001) 45 0.30 0.42 0.00 0.00
One Factor 802.19
(p<0.001) 35 0.52 0.32 0.41 0.54
Five Factors 50.59
(p<0.05) 25 0.96 0.07 0.97 0.99
Second Order (5
dimensions; 1 factor)
256.59
(p<0.001) 30 0.84 0.19 0.80 0.86
Second Order
(5 dimensions; 2
factors)
76.58
(p<0.001) 29 0.94 0.09 0.96 0.97
BG sample with team member ratings -Time 3
Null 1914.76
(p<0.001) 45 0.26 0.45 0.00 0.00
One Factor 798.99
(p<0.001) 35 0.50 0.32 0.48 0.59
Five Factors 33.85
(p=0.111) 25 0.97 0.04 0.99 1.00
Second Order (5
dimensions; 1 factor)
206.22
(p<0.001) 30 0.84 0.17 0.86 0.91
Second Order
(5 dimensions; 2
factors)
74.04
(p<0.001) 29 0.93 0.09 0.96 0.98

[183]
Table 5.20
Reliability and Pearson correlation coefficients: BG sample
Rater Time Social Philanthropy Stakeholder Environmental Economic Full
Scale
Leader1 1 0.69
(.53**)
0.82
(.69**)
0.91
(.84**)
0.87
(.78**)
0.89
(.80**) 0.82
2 0.89
(.80**)
0.87
(.77**)
0.93
(.87**)
0.90
(.82**)
0.88
(.79**) 0.83
3 0.91
(.83**)
0.92
(.75**)
0.92
(.86**)
0.89
(.81**)
0.95
(.90**) 0.87
Team member2 1 0.87
(.76**)
0.88
(.79**)
0.92
(.86**)
0.89
(.80**)
0.88
(.79**) 0.89
2 0.79
(.66**)
0.90
(.81**)
0.94
(.88**)
0.90
(.82**)
0.89
(.80**) 0.90
3 0.86
(.76**)
0.83
(.72**)
0.93
(.86**)
0.94
(.89**)
0.93
(.86**) 0.92
Note: Reliability and correlation coefficients for the individual dimensions and the full ESR scale for the BG sample, for both leader and team
member ratings at times 1, 2 and 3; 1N = 196 – 215 (range), 2N = 217 – 220 (range); **p<0.01

[184]
5.5.5. Psychometric properties
After having confirmed the factor structure of the scale, and deriving the final ten-item ESR
scale, the next objective was to establish its psychometric properties, in the BG sample. Here
inter-factor correlations were explored, in addition to convergent and discriminant validity,
and predictive validity.
5.5.5.1.Inter-factor correlations
Inter-factor correlations were computed for the BG sample for leader and team member
ratings across all 3 time points. With regards to the leader ratings (Table 5.21), in most cases
the dimensions tended to be significantly correlated with one another at each time point.
However at time 1, the environmental dimension did not correlate with the social and the
philanthropy dimensions, and at time 2, the economic and stakeholder dimension did not
correlate with the social and philanthropy dimensions. This was however not the case with
the team-member ratings (Table 5.22). Here, all dimensions significantly correlated with one
another at every time point. Furthermore, all dimensions across all time points significantly
correlated with the overall ESR scale, suggesting that they were all tapping into the overall
umbrella of ESR behaviours.

[185]
Table 5.21
Inter-factor correlations: BG sample with leader ratings (Time 1 to 3)
Leader-ratings:
Time 11 1 2 3 4 5 6
1.Social -
2.Philanthropy .65** -
3.Stakeholder .20** .17* -
4.Environment .07 .05 .42** -
5.Economic .16* .16* .56** .35** -
6.Full ESR Scale .61** .57** .73** .60** .72** -
Leader-ratings:
Time 22 1 2 3 4 5 6
1.Social -
2.Philanthropy .68** -
3.Stakeholder .05 .10 -
4.Environment .28** .23** .43** -
5.Economic .05 .08 .70** .36** -
6.Full ESR Scale .54** .55** .75** .71** .73** -
Leader-ratings:
Time 33 1 2 3 4 5 6
1.Social -
2.Philanthropy .87** -
3.Stakeholder .15* .18** -
4.Environment .37** .36** .52** -
5.Economic .19** .18* .72** .45** -
6.Full ESR Scale .66** .66** .76** .75** .76** -
Note: 1N = 200 – 208 (range), 2N = 215, 3N = 210 – 212 (range); *p<0.05 **p<0.01

[186]
Table 5.22
Inter-factor correlations: BG sample with team-member ratings (Time 1 to 3)
Team member ratings:
Time 11 1 2 3 4 5 6
1.Social -
2.Philanthropy .84** -
3.Stakeholder .31** .29** -
4.Environment .44** .51** .45** -
5.Economic .29** .26** .68** .41** -
6.Full ESR Scale .78** .78** .72** .74** .71** -
Team member ratings:
Time 22 1 2 3 4 5 6
1.Social -
2.Philanthropy .81** -
3.Stakeholder .34** .22** -
4.Environment .48** .48** .58** -
5.Economic .36** .23** .74** .53** -
6.Full ESR Scale .77** .70** .76** .81** .77** -
Team member ratings:
Time 33 1 2 3 4 5 6
1.Social -
2.Philanthropy .85** -
3.Stakeholder .42** .39** -
4.Environment .59** .57** .61** -
5.Economic .43** .36** .74** .55** -
6.Full ESR Scale .80** .77** .81** .83** .80** -
Note: 1N = 219, 2N = 218 – 220 (range), 3N = 218; *p<0.05 **p<0.01

[187]
5.5.5.2.Convergent and discriminant validity
Here the additional scales that were included in the questionnaire are of interest. Namely,
these were the deviant behaviours scale (Bennett and Robinson, 2000), in-role behaviour
scale (Williams and Anderson, 1991), organisational citizenship behaviours scale (Podsakoff
et al., 1990), co-operation behaviours scale (Bettencourt and Brown, 1997), and finally, the
pro-environmental behaviours scale (Whitmarsh and O’Neil, 2010). Greater details on these
scales can be found within the Methodology and Samples chapter (chapter four). Correlations
between the newly developed scale and these additional scales are examined to check for
convergent and discriminant validity. When looking at convergent validity, it is expected that
the newly developed scale correlates with established measures; that are related to some
extent. On the contrary, discriminant validity is obtained when the newly developed scale
does not correlate too strongly with these measures, such that it appears to be tapping into the
same construct, and thus providing no additional value (Hinkin, 1998).
In order to test for convergent validity, the in-role behaviour (IRB), pro-environmental
behaviour (ENB), co-operation (COO), and organisation-citizenship behaviour (OCB), as
rated by the leaders, were correlated with the ESR dimensions, for both team member rated
and leader rated ESR, across all three time points. It was anticipated that the IRBs would
correlate with the economic dimension, the ENBs with the environmental dimension, COO
with the stakeholder dimension and OCBs with the social and philanthropy dimensions.
Research does not yield a close enough parallel, barring formative scales of volunteering for
example, to the social and philanthropy dimensions, and so the closest proxy was considered
OCB. This is because OCB is seen to tap into extra-role and ‘voluntary’ employee
behaviours, and in the same vein social and philanthropy are also assumed to tap into extra-
role behaviours which an employee is not obligated to perform as per their job role.
Correlations were computed at time 1 and time 3, in order to avoid any bias of the
intervention effects which took place between these two time points.
The correlation tables show that in most cases, the parallel constructs did correlate
significantly with their respective ESR dimensions. In reference to the leader ratings of ESR
however (Table 5.23 and 5.24), the OCB scale did not correlate with philanthropy behaviours
in time 1. Additionally, in time 3, the correlation between pro-environmental behaviours and
environmental ESR was not significant. In regards to the team member ratings of ESR,
similarly there were no significant correlations between the pro-environmental behaviours

[188]
and environmental dimensions of ESR at both time 1 and 3. Moreover in time 1, OCB did not
significantly correlate with social behaviours.
As noted earlier, OCB, whilst a rational approximate to social and philanthropy behaviours, is
still limited in tapping into the unique behaviours within these two ESR dimensions; namely
community engagement and charity. A possible explanation for why the correlation between
pro-environmental behaviours and environmental ESR did not materialise could be the nature
of the items. For example in the pro-environmental behaviours scale, the behaviours were
specifically focused (‘eats food which is organic, locally grown or in season’), whilst the
environmental ESR behaviours have more of a general focus (‘behaves in an environmentally
friendly manner’). This difference in focus could therefore have resulted in lack of
convergence.
In addition to testing for convergent validity for the above scales, deviant behaviours were
also measured under the assumption that these positive ESR behaviours should be negatively
correlated with deviant behaviours. Findings showed that in the vast majority of cases the
ESR dimensions were significantly and negatively correlated with deviant behaviours,
however there were some rare cases in which this was not so. For example with leader-ratings
at time 1, there was no correlation between deviant behaviours with the social and
philanthropy dimensions, with the correlation nearing zero; a neutral correlation was also
found with the environmental dimension of ESR, in the team member ratings of ESR at time
1. Interestingly, it so happened that here, there was indeed positive correlations between
social and philanthropy dimensions with deviant behaviours. A likely explanation for the lack
of correlation of the social and philanthropy dimensions with deviant behaviours, as well as
positive correlations could be that by engaging in these externally focused positive voluntary
behaviours, employees feel they consequently have leverage to act passively and/or to engage
in deviant behaviours, termed moral licensing (Blanken, van de Ven, and Zeelenberg, 2015).
Finally, with regards to discriminant validity, in the majority of cases, whilst the correlations
were significant, they were of moderate strength. This goes to show that whilst the ESR
construct and its dimensions may be measuring similar content to the parallel constructs, it is
still measuring extraneous content not measured by existing constructs; evidenced by these
moderate as opposed to high correlations. However with leader ratings there tended to be
high correlations between the economic dimension and its parallel construct of IRB. This
would suggest that the two have a significant degree of overlap, and so discriminant validity

[189]
could be considered questionable. Nevertheless, this significant overlap between the two does
not come as a surprise and was expected, given that both tap into work behaviours that
contribute to fulfilling mundane job specifications. Given that the utility of the ESR scale is
in providing a multi-dimensional insight into the various behaviours which comprise social
responsibility at work, one of which includes the more in-role work behaviours measured by
the economic dimension, this was not considered a serious issue.
To further demonstrate discriminant validity, the average variance extracted (AVE) was
calculated, following the recommendations of Fornell and Larcker (1981). For two variables
to be discriminate, the square root of the AVE must be higher than the correlation exhibited
between the two variables. As can be seen from the tables below, this condition tended to be
met for the most part. However at both at time 1 and time 3, with leader ratings, this
condition was not met between the economic dimension and IRB. Nevertheless as discussed
above, with regards to the economic dimension, given its nature, this was anticipated.
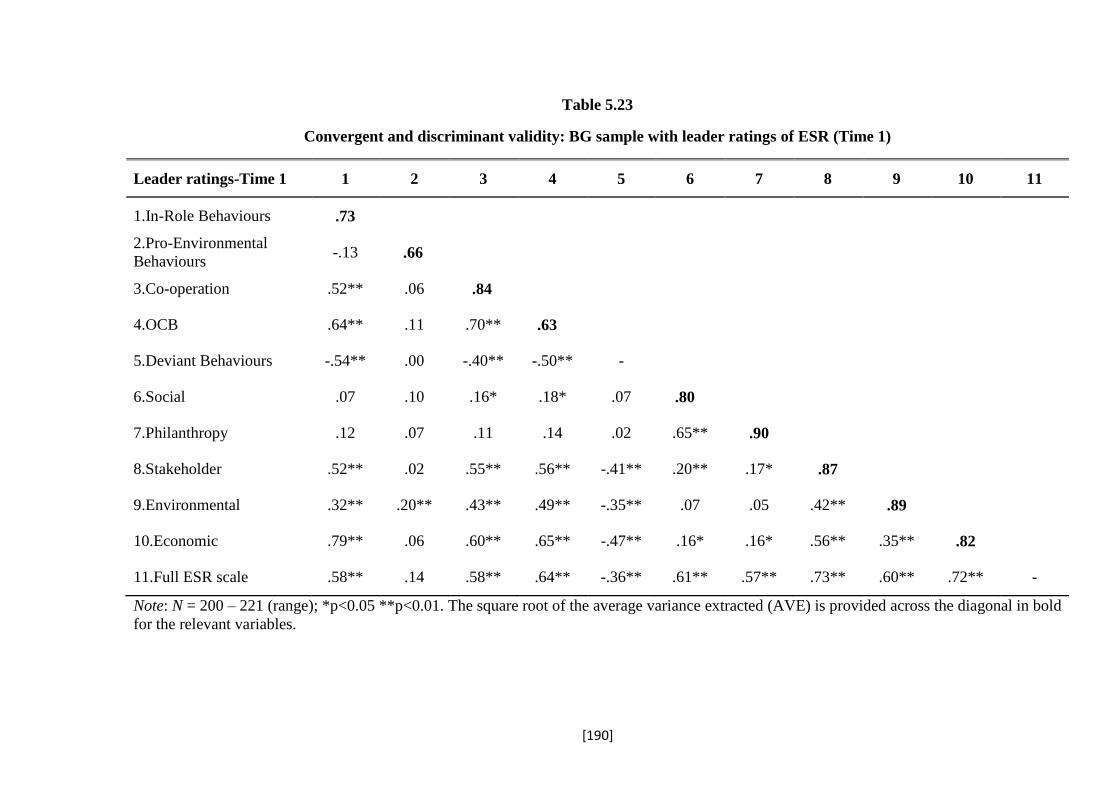
[190]
Table 5.23
Convergent and discriminant validity: BG sample with leader ratings of ESR (Time 1)
Leader ratings-Time 1 1 2 3 4 5 6 7 8 9 10 11
1.In-Role Behaviours .73
2.Pro-Environmental
Behaviours -.13 .66
3.Co-operation .52** .06 .84
4.OCB .64** .11 .70** .63
5.Deviant Behaviours -.54** .00 -.40** -.50** -
6.Social .07 .10 .16* .18* .07 .80
7.Philanthropy .12 .07 .11 .14 .02 .65** .90
8.Stakeholder .52** .02 .55** .56** -.41** .20** .17* .87
9.Environmental .32** .20** .43** .49** -.35** .07 .05 .42** .89
10.Economic .79** .06 .60** .65** -.47** .16* .16* .56** .35** .82
11.Full ESR scale .58** .14 .58** .64** -.36** .61** .57** .73** .60** .72** -
Note: N = 200 – 221 (range); *p<0.05 **p<0.01. The square root of the average variance extracted (AVE) is provided across the diagonal in bold
for the relevant variables.

[191]
Table 5.24
Convergent and discriminant validity: BG sample with leader ratings of ESR (Time 3)
Leader ratings-Time 3 1 2 3 4 5 6 7 8 9 10 11
1.In-Role Behaviours .77
2.Pro-Environmental
Behaviours -.09 .63
3.Co-operation .63** .06 .90
4.OCB .68** .02 .60** .47
5.Deviant Behaviours -.68** -.06 -.37** -.56** -
6.Social .14* .09 .28** .28** -.19** .93
7.Philanthropy .10 -.02 .18** .27** -.22** .87** .94
8.Stakeholder .56** -.23** .36** .48** -.63** .15* .18** .88
9.Environmental .34** -.01 .26** .40** -.50** .37** .36** .52** .92
10.Economic .81** -.07 .48** .61** -.70** .19** .18* .72** .45** .91
11.Full ESR scale .59** -.08 .45** .58** -.65** .66** .66** .76** .75** .76** -
Note: N = 198 – 214 (range); *p<0.05 **p<0.01. The square root of the average variance extracted (AVE) is provided across the diagonal in bold
for the relevant variables.

[192]
Table 5.25
Convergent and discriminant validity: BG sample with team-member ratings of ESR (Time 1)
Team member ratings-
Time 1 1 2 3 4 5 6 7 8 9 10 11
1.In-Role Behaviours .78
2.Pro-Environmental
Behaviours -.13 .64
3.Co-operation .52** .06 .86
4.OCB .64** .11 .70** .66
5.Deviant Behaviours -.54** .00 -.40** -.50** -
6.Social .00 -.12 .02 .09 .18* .86
7.Philanthropy .03 -.04 .09 .15* .16* .84** .91
8.Stakeholder .07 .03 .14* .14* -.19** .31** .29** .90
9.Environmental .06 -.06 .09 .08 .03 .44** .51** .45** .87
10.Economic .38** -.03 .29** .33** -.27** .29** .26** .68** .41** .87
11.Full ESR scale .15* -.06 .17* .22** -.02 .78** .78** .72** .74** .71** -
Note: N = 200 – 221 (range); *p<0.05 **p<0.01. The square root of the average variance extracted (AVE) is provided across the diagonal in bold
for the relevant variables.

[193]
Table 5.26
Convergent and discriminant validity: BG sample with team-member ratings of ESR (Time 3)
Team member ratings-
Time 3 1 2 3 4 5 6 7 8 9 10 11
1.In-Role Behaviours .82
2.Pro-Environmental
Behaviours -.09 .69
3.Co-operation .63** .06 .91
4.OCB .68** .02 .60** .55
5.Deviant Behaviours -.68** -.06 -.37** -.56** -
6.Social .15* .08 .20** .25** -.16* .97
7.Philanthropy .156* .13 .16* .24** -.22** .85** .86
8.Stakeholder .28** .08 .22** .33** -.36** .42** .39** .95
9.Environmental .29** .04 .23** .32** -.30** .59** .57** .61** .94
10.Economic .43** .02 .30** .44** -.33** .43** .36** .74** .55** .96
11.Full ESR scale .34** .08 .28** .41** -.35** .80** .77** .81** .83** .80** -
Note: N = 198 – 218 (range); *p<0.05 **p<0.01. The square root of the average variance extracted (AVE) is provided across the diagonal in bold
for the relevant variables.

[194]
5.5.5.3.Criterion validity
A scale is assumed to possess criterion validity when correlations between the newly
developed measure, and existing outcomes with which it is expected to relate with, are
significant (Hinkin, 1998). For example, a scale measuring motivation levels should also
theoretically be related to empowerment and enhanced job performance, as a result of
increased motivation. Two types of criterion validity were assessed; concurrent validity and
predictive validity. Concurrent validity inspects whether the new construct is correlated with
other similar constructs measured at the same time, whereas predictive validity seeks to
determine if the new construct measured at a former time, is related to performance outcomes
at a later point of measurement.
To test for both, only measurements from time 1 and 3 were utilised so as to avoid any bias of
the intervention effects which took place between these two time points. For concurrent
validity, the ESR dimensions, both leader-rated and team-member rated, were correlated with
assigned CSR priority (ACSR), CSR climate (CCSR), both rated by team-members, and team
effectiveness-ESR; which did not look at team effectiveness in general but rather if the team
was effective in regards to social responsibility, as rated by tutors. For greater details on these
constructs, the reader is referred to the Methodology and Samples chapter (chapter four).
These variables were correlated with one another at time 1, and again at time 3.
With regards to concurrent validity, for the leader ratings at time 1, only the correlations
between the environment and economic dimensions, with team effectiveness ESR, were
significant; the former being negatively correlated (Table 5.27). No significant correlations
were present with leader-ratings at time 3 (Table 5.28). In reference to team member ratings
of ESR at time 1, the social dimension was significantly correlated with ACSR, as were the
stakeholder and economic dimensions with team effectiveness ESR (Table 5.29). With team
member ratings at time 3, the environment dimension significantly correlated with CCSR,
and the stakeholder dimensions significantly correlated with team effectiveness-ESR (Table
5.30). A possible explanation for the lack of significance for a number of the correlations
may be whittled down to the choice of scales used to check for concurrent validity. Given
there is very little in the area of employee social responsibility, there was difficulty in
collating scales to assess for concurrent validity, and in the end climate for CSR, assigned
CSR priority, and team effectiveness-ESR were decided upon.

[195]
Table 5.27
Concurrent validity: BG sample-leader rated ESR (Time 1)
Leader-rated
ESR: Time 1 1 2 3 4 5 6 7 8 9
1.Social -
2.Philanthropy .65** -
3.Stakeholder .20** .17* -
4.Environmental .07 .05 .42** -
5.Economic .16* .16* .56** .35** -
6.Assigned CSR
Priority .07 .01 -.02 -.03 .07 -
7.CSR Climate .10 .02 .10 .06 .03 .16** -
8.Team
Effectiveness-
ESR
.08 .09 .06 -.15* .14* .00 -.02 -
9.Full ESR scale .61** .57** .73** .60** .72** .03 .10 .05 -
Note: N = 200 – 232 (range); *p<0.05 **p<0.01
Table 5.28
Concurrent validity: BG sample-leader rated ESR (Time 3)
Leader-rated
ESR: Time 3 1 2 3 4 5 6 7 8 9
1.Social -
2.Philanthropy .87** -
3.Stakeholder .15* .18** -
4.Environmental .37** .36** .52** -
5.Economic .19** .18* .72** .45** -
6.Assigned CSR
Priority .05 .06 .09 .10 .12 -
7.CSR Climate .09 .05 .05 .13 .06 .26** -
8.Team
Effectiveness-
ESR
.01 -.03 .09 .08 .00 .11 .12 -
9.Full ESR scale .15* .17* .35** .24** .38** .08 .16* .21* -
Note: N = 203 – 232; *p<0.05 **p<0.01

[196]
Table 5.29
Concurrent validity: BG sample-team member rated ESR (Time 1)
Team member
rated ESR:
Time 1
1 2 3 4 5 6 7 8 9
1.Social -
2.Philanthropy .84** -
3.Stakeholder .31** .29** -
4.Environmental .44** .51** .45** -
5.Economic .29** .26** .68** .41** -
6.Assigned CSR
Priority .14* .10 .13 .12 .07 -
7.CSR Climate -.12 -.09 .04 .04 -.02 .16** -
8.Team
Effectiveness-
ESR
.13 .04 .16* .03 .17* .00 -.02 -
9.Full ESR scale .78** .78** .72** .74** .71** .15* -.04 .15* -
Note: N = 219 – 232 (range); *p<0.05 **p<0.01
Table 5.30
Concurrent validity: BG sample-team member rated ESR (Time 3)
Team member
rated:
ESR Time 3
1 2 3 4 5 6 7 8 9
1.Social -
2.Philanthropy .85** -
3.Stakeholder .42** .39** -
4.Environmental .59** .57** .61** -
5.Economic .43** .36** .74** .55** -
6.Assigned CSR
Priority .09 .10 .08 .13 .09 -
7.CSR Climate .12 .11 .12 .16* .11 .26** -
8.Team
Effectiveness-
ESR
.07 .06 .19** .08 .13 .11 .12 -
9.Full ESR scale .59** .52** .47** .46** .53** -.04 .04 .21** -
Note: N = 218 – 232 (range); *p<0.05 **p<0.01

[197]
In order to assess for predictive validity, the ESR dimensions measured at time 1, both
leader-rated and team-member rated, were correlated with in-role behaviours (IRB),
organisational citizenship behaviours (OCB), deviant behaviours (DB), team effectiveness
(general effectiveness combined with ESR effectiveness), team effectiveness without ESR,
and team effectiveness only concerning ESR; all measured at time 3, and as rated by the
leader. This was done at the individual and group level; with aggregated scores for the latter.
At the individual level, in most cases, the ESR dimensions were significantly correlated with
these outcomes. Interestingly, with the leader-rated philanthropy dimension, a significantly
positive correlation with DB was present whilst the others were negative (Table 5.31). As
discussed above, this may be due to individuals feeling they have scope to engage in these
DB, as a result of having participated in extra-role behaviours, such as philanthropic
behaviours. Regarding the team member rated ESR, there were no significant correlations
with DB (Table 5.32). With reference to the full ESR scale, with leader rated ESR, the full
scale was positively and significantly correlated with IRB, OCB, and all team effectiveness
outcomes, and significantly and negatively related to DB. This was also the case with team
member rated ESR, except for this time, there was no significantly negative correlation with
DB. There were a number of instances when the philanthropy and the social dimension did
not correlate with many of the outcomes. A possible reason for this is, for instance, because
since they involve more voluntary behaviours, it may be perceived as goodwill behaviours
that the employee chooses to engage in, and these are not seen as leading to enhanced
performance in other domains.
At the group level, for leader rated ESR (Table 5.33), the dimensions of ESR as well as the
full ESR scale were uncorrelated with the team effectiveness measures. Likewise, the social
and philanthropy dimensions did not correlate significantly with any of the outcomes. Apart
from this, the other dimensions and the full scale tended to correlate significantly with the
remaining outcomes. With team member ratings of ESR (Table 5.34), similar results were
found, albeit some of the dimensions as well as the full ESR scale did correlate with some of
the team effectiveness measures. This time however, there were no significant correlations
for the deviant behaviours scale. On the whole, the below findings can be seen as providing
reasonable support for the predictive validity of the ESR dimensions, both leader and team
member rated and at the group and individual levels, but more so at the individual level.

[198]
Table 5.31
Predictive validity: BG sample-leader rated ESR
Predictive Validity
Leader rated ESR 1 2 3 4 5 6 7 8 9 10 11 12
1.Social¹ -
2.Philanthropy¹ .65** -
3.Stakeholder¹ .20** .17* -
4.Environmental¹ .07 .05 .42** -
5.Economic¹ .16* .16* .56** .35** -
6.Full ESR scale¹ .61** .57** .73** .60** .72** -
7.In-Role Behaviours² -.01 -.01 .53** .27** .69** .47** -
8.OCB² .16* .15 .44** .22** .58** .49** .68** -
9.Deviant Behaviours² .08 .21** -.24** -.28** -.44** -.24** -.68** -.56** -
10.Team Effectiveness-
Full² .19** .10 .11 .23** .14* .23** .16* .24** -.12 -
11.Team Effectiveness-
no ESR² .17* .10 .07 .23** .13 .21** .17* .24** -.15* .97** -
12.Team Effectiveness-
ESR² .16* .06 .20** .11 .14* .21** .08 .14* .01 .70** .52** -
Note: N = 200 – 232 (range); ¹measured at time 1 ²measured at time 3; *p<0.05 **p<0.01

[199]
Table 5.32
Predictive validity: BG sample-team member rated ESR
Predictive Validity
Team member rated
ESR
1 2 3 4 5 6 7 8 9 10 11 12
1.Social¹ -
2.Philanthropy¹ .84** -
3.Stakeholder¹ .31** .29** -
4.Environmental¹ .44** .51** .45** -
5.Economic¹ .29** .26** .68** .41** -
6.Full ESR scale¹ .78** .78** .72** .74** .71** -
7.In-Role Behaviours² .03 .00 .26** .10 .37** .21** -
8.OCB² .21** .22** .35** .21** .33** .36** .66** -
9.Deviant Behaviours² .00 -.09 -.13 -.07 -.10 -.10 -.68** -.59** -
10.Team Effectiveness-
Full² .13 .22** .25** .14* .22** .26** .16* .24** -.12 -
11.Team Effectiveness:
no ESR²
.12 .21** .23** .14* .20** .24** .17* .23** -.15* .97** -
12.Team Effectiveness:
ESR² .11 .16* .23** .09 .18** .21** .08 .17* .01 .70** .52** -
Note: N = 212 – 232 (range); ¹measured at time ²measured at time 3; *p<0.05 **p<0.01

[200]
Table 5.33
Predictive validity: BG sample-leader rated ESR (group level)
Predictive Validity
Leader rated ESR 1 2 3 4 5 6 7 8 9 10 11 12
1.Social1 -
2.Philanthropy1 .56** -
3.Stakeholder1 .32* .24 -
4.Environmental1 .22 .17 .51** -
5.Economic1 .26* .29* .76** .51** -
6.Full ESR scale1 .67** .62** .79** .70** .77** -
7.In-Role Behaviours2 -.002 -.02 .57** .36** .66** .42** -
8.OCB2 .23 .11 .51** .29* .58** .48** .67** -
9.Deviant Behaviours2 .09 .20 -.26 -.30* -.43** -.20 -.70** -.56** -
10.Team Effectiveness-Full2 .13 .09 .15 .22 .19 .21 .24 .31* -.17 -
11.Team Effectiveness-no
ESR2 .12 .09 .12 .24 .19 .21 .26* .32* -.21 .97** -
12.Team Effectiveness-ESR2 .09 .04 .18 .07 .13 .15 .10 .17 -.01 .70** .52** -
Note: N = 60 – 67 (range); ¹measured at time ²measured at time 3; *p<0.05 **p<0.01

[201]
Table 5.34
Predictive validity: BG sample-team member rated ESR (group level)
Predictive Validity
Team member rated ESR 1 2 3 4 5 6 7 8 9 10 11 12
1.Social1 -
2.Philanthropy1 .89** -
3.Stakeholder1 .42** .40** -
4.Environmental1 .44** .54** .52** -
5.Economic1 .37** .36** .70** .50** -
6.Full ESR scale1 .83** .85** .74** .76** .72** -
7.In-Role Behaviours2 -.12 -.15 .27* .05 .28* .06 -
8.OCB2 .17 .18 .44** .30* .27* .33** .70** -
9.Deviant Behaviours2 .03 -.05 -.15 -.08 -.05 -.07 -.70** -.56** -
10.Team Effectiveness-Full2 .09 .19 .31* .16 .31* .26* .24 .31* -.17 -
11.Team Effectiveness-no
ESR2 .07 .18 .28* .17 .31* .25* .26* .32* -.21 .97** -
12.Team Effectiveness-ESR2 .10 .15 .27* .07 .21 .20 .10 .17 -.01 .70** .52** -
Note: N = 64 – 67 (range); ¹measured at time ²measured at time 3; *p<0.05 **p<0.01

[202]
5.6.Inter-item correlations
It is important to ensure that the final items are considerably inter-correlated with one
another, so that they are seen to be tapping into the same construct domain. Low inter-item
correlations insinuate that the items are not sampling from the same domain, thus introducing
error and unreliability (Churchill, 1979). Inter-item correlations were calculated for both the
company and BG samples; the inter-item correlation tables for both the company sample and
the BG sample, for leader and team member ratings, can be found in Appendix 10. For the
company sample, inter-item correlations were calculated for leader-ratings and team-member
self-ratings. For the BG sample, inter-item correlations were calculated for leader-ratings and
team-member (i.e. peer 360) ratings across all three time periods.
With regards to the company sample, for leader-rated ESR, generally the individual items
within the ESR scale were significantly correlated with one another. However there were
certain inter-item correlations which were not significant; predominantly this was the case for
one of the environmental items (env22), and for both items in the economic dimensions (econ
29 and econ 32); see Table 5.02 for scale items and their respective item codes. Most of the
inter-item correlations which were not significant here, were when these items were
correlated with those belonging to either the social or philanthropy dimensions, although not
consistently so. Interestingly, when the inter-item correlations were computed for the team
member self-rated ESR in the company sample, this pattern was lucidly apparent. Here items
which belonged to the stakeholder, environment and economic dimensions did not correlate
with the items from the social and philanthropy dimensions. The stakeholder, economic and
environmental items correlated with one another strongly, as did the philanthropy and social
items with one another.
A likely explanation for this is that as mentioned earlier, it may be that a partition is
perceived between the more extra-role social and philanthropic behaviours, compared to the
environmental, stakeholder, and economic behaviours, which can be considered to be more
in-role in nature. Since this is reflective of the nature of the ESR behaviours within the scale,
and is something that was originally anticipated, it was not considered problematic.
As with the company sample, when the inter-item correlations were computed for the BG
sample with the leader and team-member ratings across the three time points, a similar
pattern emerged. With the leader ratings, for time 1 and time 2, as with the company samples,
the correlations of stakeholder, environment and economic items with those from the social

[203]
and philanthropy dimensions, in many cases were not significant. Regarding the leader
ratings at time 3, there were only four incidents when this was the case. It should be noted,
that all the inter-item correlations were significant with team-rated ESR, across all 3 time
points in the BG sample.
5.7.Aggregating to the group level
One of the key objectives of the new ESR scale was for it to capture social responsibility
behaviours both at the group and individual level. Whilst the scale is rated by individuals, it
was argued that the responses could be aggregated to the group level, by way of direct
consensus shift (Chan, 1998). In order to do this however, this aggregation to the group level
needs to be justified, and this is usually done by calculating inter-rate reliability coefficients
and intra-class correlations, and assessing if the resultant values meet the required cut-offs;
which would consequently substantiate the aggregation of responses to the group level.
In order to justify aggregation to the group level inter-rater reliability coefficients, in the form
of Rwg(j) (James et al., 1984), as well as intra-class correlations in the form of ICC(1) and
ICC(2) were computed (Shrout and Fleiss, 1979). The Rwg(j) measures within group
agreement and compares this to expected random variance, and recommendations are that
this be above 0.70. Additionally, intra-class correlation coefficients, calculated through the
use of one-way ANOVA, are used to demonstrate greater variance between groups compared
to within groups, suggesting consequently that the variance is due to group membership
(Bliese, 2000). The ICC(1) looks at the variance that can be attributed to group membership,
and here it is recommended that the F values be significant to demonstrate between group
variance, whilst others suggest that it is sufficient that the F value be greater than 1 (e.g. Bryk
and Raudenbaush, 1982). Furthermore, Bliese (2000) purports that the ICC(1) values need to
be greater than 0.05. Moreover, an ICC(2) looks at the reliability of group means, and it is
suggested that the cut-off of this be 0.50 (Shrout and Fleiss, 1979). Analysis was conducted
on the individual dimensions and the full ESR scale, and this was done for both the company
sample and the BG sample, for the leader and team-member ratings; and in the case of the
BG sample, across the three time points as well.
In reference to the company sample, for leader-ratings, the Rwg(j) values, the F values for
ICC(1), as well as the values for ICC(2); were all above their respective cut-offs (Table 5.35).

[204]
That is, the Rwg(j) values were greater than 0.70, and the ICC(1) values met the various
criteria with significant F values, F values greater than 1, and ICC(1) values greater than
0.05. The ICC(2) values were also greater than 0.50.
However this was not as straightforward for the team-member self-ratings in the company
sample (Table 5.36). Firstly, the Rwg(j) values for the social and philanthropy dimensions
were below 0.7. Secondly, in reference to the stakeholder and economic dimensions, the
ICC(1) values were neither greater than 0.05, nor were the F values greater than 1. Finally, all
ICC(2) values were below 0.50. It is however argued that in the case where aggregation is
justified by theory, one should proceed with group level analysis (Chen and Bliese, 2002).
Nevertheless, given that it was not the intention of the subsequent field study to utilise self-
ratings of socially responsible behaviours in testing hypotheses (chapter six), this issue was
not warranted further consideration.
Table 5.35
Inter-rater reliability coefficients and intra-class correlations for the company sample
Leader ratings of ESR
Company sample
Leader ratings
Dimension
Rwg
Estimate
of team
sizes
MS
Between
groups
MS
within
groups
ICC(1) ICC(2) F
Social 0.85 3.16 7.85 0.67 0.77 0.91 11.74**
Philanthropy 0.92 3.16 8.55 1.39 0.62 0.84 6.15**
Stakeholder 0.96 3.16 0.84 0.23 0.46 0.73 3.64**
Environment 0.96 3.16 4.18 0.26 0.82 0.94 15.81**
Economic 0.87 3.16 1.47 0.61 0.31 0.59 2.41**
Full Scale 0.97 3.16 2.05 0.25 0.70 0.88 8.27**
Note: N = 221; **p<0.01

[205]
Table 5.36
Inter-rater reliability coefficients and intra-class correlations for the company sample
Team member self-ratings of ESR
Company sample
Team-member self-ratings
Dimension
Rwg
Estimate
of team
sizes
MS
Between
groups
MS
within
groups
ICC(1) ICC(2) F
Social 0.45 3.16 3.99 2.51 0.16 0.37 1.59
Philanthropy 0.61 3.16 3.49 2.75 0.08 0.21 1.27
Stakeholder 0.88 3.16 0.66 0.77 -0.05 -0.17 0.86
Environment 0.80 3.16 1.33 1.13 0.05 0.15 1.18
Economic 0.86 3.16 0.56 0.82 -0.11 -0.47 0.68
Full Scale 0.87 3.16 0.79 0.54 0.13 0.32 1.46
Note: N = 101
With regards to the BG sample, for leader and peer ratings, (Table 5.37 and Table 5.38), all
Rwg(j) values were above 0.70, across both the leader and team-member ratings, across all
three time periods. With regards to ICC(1) values, not only were the F values significant, the
values were also above 0.05, and the F value was greater than 1; thus soundly meeting the
various purported requirements. Moreover, the ICC(2) values also met the cut-off value, as
all were above 0.50. It can as a result be confidently asserted that aggregation to the group
level is justified.

[206]
Table 5.37
Inter-rater reliability coefficients and intra-class correlations for the BG sample
Leader ratings of ESR
BG sample
Leader-ratings
Dimension
Time Rwg Estimate of
team sizes
MS
Between
groups
MS within
groups ICC(1) ICC(2) F
Social
1 0.97 3.33 3.48 0.31 0.76 0.91 11.32**
2 0.96 3.36 2.70 0.28 0.72 0.90 9.80**
3 0.96 3.31 3.57 0.19 0.85 0.95 19.22**
Philanthropy
1 0.97 3.33 2.82 0.12 0.87 0.96 23.97**
2 0.97 3.36 2.34 0.19 0.77 0.92 12.16**
3 0.96 3.31 3.20 0.16 0.85 0.95 19.89**
Stakeholder
1 0.95 3.33 3.70 0.33 0.75 0.91 11.23**
2 0.96 3.36 4.62 0.34 0.79 0.93 13.79**
3 0.96 3.33 5.04 0.31 0.82 0.94 16.44**
Environment
1 1.00 3.35 4.13 0.02 0.99 1.00 258.69**
2 0.99 3.36 4.29 0.06 0.95 0.99 67.88**
3 1.00 3.33 4.78 0.08 0.95 0.98 63.37**
Economic
1 0.79 3.35 3.49 1.06 0.41 0.70 3.30**
2 0.90 3.36 4.14 0.87 0.53 0.79 4.75**
3 0.86 3.33 5.09 0.84 0.60 0.83 6.04**
Full Scale
1 0.98 3.33 1.60 0.10 0.82 0.94 16.06**
2 1.00 3.36 1.70 0.10 0.83 0.94 17.06**
3 0.99 3.33 2.29 0.14 0.83 0.94 16.77**
Note: **p<0.001

[207]
Table 5.38
Inter-rater reliability coefficients and intra-class correlations for the BG sample
Team member ratings of ESR
BG sample
Team-member ratings
Dimension
Time Rwg Estimate of
team sizes
MS
Between
groups
MS within
groups ICC(1) ICC(2) F
Social
1 0.90 3.32 2.75 0.55 0.55 0.80 4.99**
2 0.91 3.35 1.68 0.47 0.44 0.72 3.59**
3 0.94 3.30 1.52 0.28 0.57 0.81 5.39**
Philanthropy
1 0.93 3.32 2.53 0.38 0.63 0.85 6.75**
2 0.91 3.32 1.82 0.41 0.51 0.78 4.45**
3 0.95 3.30 1.42 0.24 0.60 0.83 5.97**
Stakeholder
1 0.91 3.32 1.74 0.43 0.48 0.75 4.04**
2 0.93 3.32 1.82 0.34 0.57 0.81 5.40**
3 0.91 3.30 1.89 0.36 0.56 0.81 5.24**
Environment
1 0.94 3.32 2.27 0.28 0.68 0.88 8.09**
2 0.93 3.33 2.41 0.34 0.64 0.86 7.05**
3 0.96 3.30 1.92 0.23 0.69 0.88 8.30**
Economic
1 0.87 3.32 1.95 0.86 0.28 0.56 2.27**
2 0.88 3.32 2.14 0.59 0.44 0.72 3.62**
3 0.90 3.30 1.99 0.61 0.41 0.69 3.27**
Full Scale
1 0.99 3.32 1.41 0.21 0.64 0.85 6.83**
2 0.97 3.32 1.21 0.21 0.58 0.82 5.67**
3 0.99 3.30 1.22 0.17 0.66 0.86 7.34**
Note: **p<0.01
[208]
5.8.Summary
Semi-structured interviews with employed individuals from diverse occupational
backgrounds were conducted to preliminarily confirm the five-faceted structure of ESR, as
well as to generate items for the future ESR scale. From the initial pool of 112 items, 32 were
retained after being subjected to a content validity test through utilising expert subject-matter
ratings. These 32 items were subject to exploratory and confirmatory factor analysis in the
company and BG samples, for both leader and team member ratings. Subsequently, analysis
confirmed a final five dimensional structure of ESR; consisting of the dimensions of social,
philanthropy, stakeholder, environmental, and economic. The final ten-item scale consisted of
two items per dimension. Further analysis suggested that the scale possessed good
psychometric properties, and could be aggregated to the group level.

[209]
Chapter 6: Field Study
6.1.Introduction
Chapter three outlined the conceptual model guiding this thesis, in which the individual and
interactive moderating roles of assigned CSR priority and CSR climate, on the effects of
transformational leadership (TF) on employee social responsibility (ESR) were proposed;
both at the group and individual levels. This ensuing field study attempts to provide a
preliminary test for these propositions in an occupational setting, within a sample of
individuals (N = 101) nested within teams/team leaders (N = 32); situated in a commercial
banking organisation and a professional financial services organisation. More details of this
sample can be found in chapter four (Methodology and Samples). In order to test these
hypotheses, the newly developed ESR scale, as outlined in the preceding chapter, was
utilised. Presented below is a diagrammatic representation of the conceptual model (Figure
6.01), a reminder of the hypotheses to be tested (Table 6.01), as well as the measures to be
used.
Figure 6.01
Proposed conceptual model
Group Level
Individual Level
Group TF Group ESR
Assigned CSR
Priority CSR Climate
Individual TF Individual
ESR
Assigned CSR
Priority
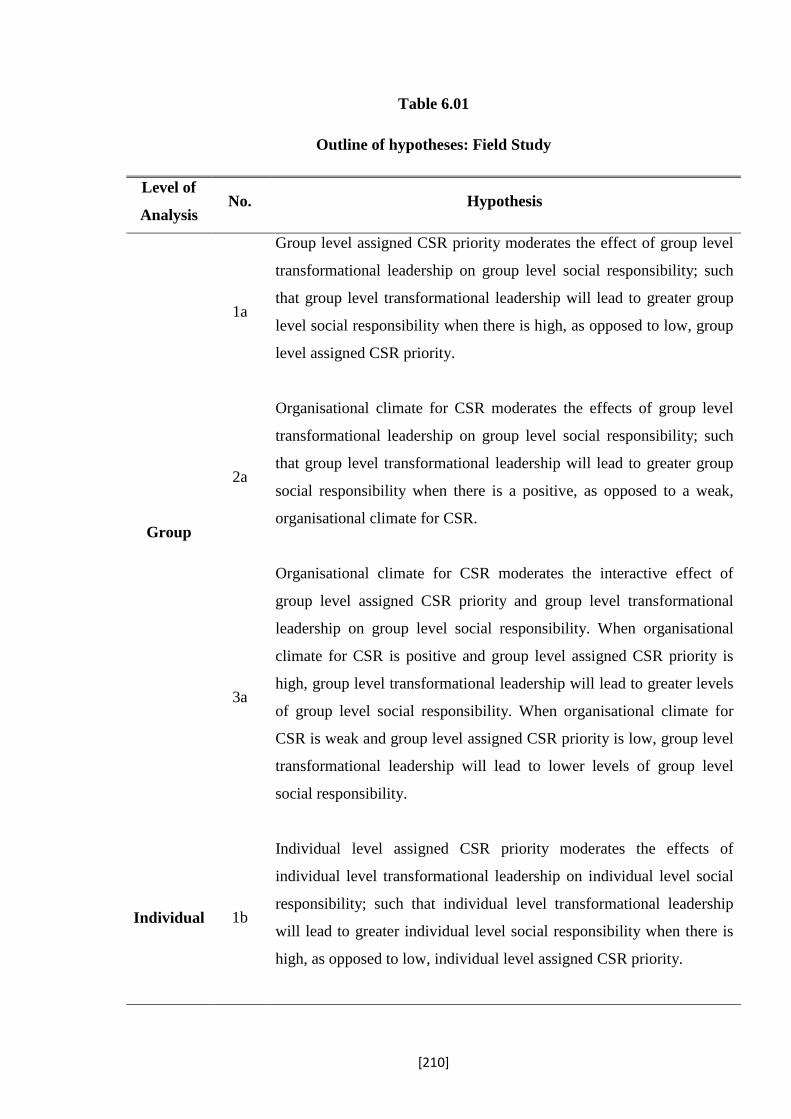
[210]
Table 6.01
Outline of hypotheses: Field Study
Level of
Analysis No. Hypothesis
Group
1a
Group level assigned CSR priority moderates the effect of group level
transformational leadership on group level social responsibility; such
that group level transformational leadership will lead to greater group
level social responsibility when there is high, as opposed to low, group
level assigned CSR priority.
2a
Organisational climate for CSR moderates the effects of group level
transformational leadership on group level social responsibility; such
that group level transformational leadership will lead to greater group
social responsibility when there is a positive, as opposed to a weak,
organisational climate for CSR.
3a
Organisational climate for CSR moderates the interactive effect of
group level assigned CSR priority and group level transformational
leadership on group level social responsibility. When organisational
climate for CSR is positive and group level assigned CSR priority is
high, group level transformational leadership will lead to greater levels
of group level social responsibility. When organisational climate for
CSR is weak and group level assigned CSR priority is low, group level
transformational leadership will lead to lower levels of group level
social responsibility.
Individual 1b
Individual level assigned CSR priority moderates the effects of
individual level transformational leadership on individual level social
responsibility; such that individual level transformational leadership
will lead to greater individual level social responsibility when there is
high, as opposed to low, individual level assigned CSR priority.

[211]
2b
Organisational climate for CSR moderates the effects of individual
level transformational leadership on individual level social
responsibility; such that individual level transformational leadership
will lead to greater individual level social responsibility when there is a
positive, as opposed to a weak, organisational climate for CSR.
3b
Organisational climate for CSR moderates the interactive effect of
individual level assigned CSR priority and individual level
transformational leadership on individual level social responsibility.
When organisational climate for CSR is positive and individual level
assigned CSR priority is high, individual level transformational
leadership will lead to greater levels of individual level social
responsibility. When organisational climate for CSR is weak and
individual level assigned CSR priority is low, individual level
transformational leadership will lead to lower levels of individual level
social responsibility.
6.2.Measures
Below is a list of the measures that the respondents were asked to complete. Team members
were asked to rate the leadership style of their team leader, as well as providing ratings for
assigned CSR priority and CSR climate. Team leaders were requested to provide ratings of
ESR for their individual subordinates. The full list of items per scale can be found in
Appendix 1 for the leader questionnaire and Appendix 2 for the team member questionnaire.
Team Member Questionnaire
Leadership Style: Transformational leadership style was assessed using the multi-factor
leadership questionnaire (MLQ; Bass and Avolio, 1990). In order to use this, a license was
obtained from Mind Garden Inc. This questionnaire was used to assess the four facets of
transformational leadership, namely individualised consideration, intellectual stimulation,
inspirational motivation, and idealised influence (α = 0.95). Team members responded to the

[212]
questions on a five-point Likert scale (0 = Not at all/ 4 = Frequently if not always) regarding
the leadership behaviours of their team leader. An example of an item is: ‘Seeks differing
perspectives when solving problems’. In order to analyse leadership style at the group level,
individual ratings were aggregated to the group level through a direct consensus shift (Chan,
1998).
Assigned CSR Priority: The procedure used by Zohar (2002a) to assess assigned safety
priority was used; here the questions were amended so that they tapped into assigned CSR
priority. The team members were asked to indicate the extent to which their team leader
conformed to each statement, on a five-point Likert scale (1 = Not at all/ 5 = To a very large
extent). An example of an item is: ‘Expect you to cut corners and neglect social
responsibility’. The α for this scale, in the context of assigned safety priority, is noted to be
0.82 (Zohar, 2002a). When calculated, α of this CSR-adapted scale was 0.49. On further
scrutiny, it appeared that the fifth item, which happened to be the only non-reverse scored
item, was problematic. This item was therefore deleted, to yield a α of 0.82, and the four-
scale measure of assigned CSR priority (items 1 - 4) was henceforth used in all subsequent
analyses. In order to analyse assigned CSR priority at the group level, individual ratings were
aggregated to the group level through a direct consensus shift (Chan, 1998).
Climate for CSR: This was assessed using the G-CSR scale developed by Mueller et al.
(2012). This was a six item measure tapping into issues such as the organisation’s handling of
CSR in general, and initiatives towards protecting the environment more specifically; the
referent was the organisation (α = 0.88). An example item includes: ‘My company does
enough towards protecting the environment’. Team members responded to these items on a
five-point Likert scale (1 = Strongly disagree/ 5 = Strongly agree). In order to analyse CSR
climate at the group level, individual ratings were aggregated to the group level through a
direct consensus shift (Chan, 1998).
Leader Questionnaire
Employee Social Responsibility: These behaviours were assessed using the newly-developed
ten-item multi-dimensional ESR scale (see chapter five for an outline of the scale
development and validation processes). Leaders rated the extent to which their team members
engaged in these behaviours. The scale consisted of five dimensions, namely social which

[213]
taps into behaviours benefiting the community for example (‘assists in community projects’),
philanthropy which looks at charitable behaviours (‘raises money for charity’), and
stakeholder which examines behaviours towards others (‘treats others with respect’). There
was also the environmental dimension which taps into environmentally focused behaviours
(‘recycles’), and finally the economic dimension which looks at core work obligations
(‘completes work to a high standard’). They responded to the items on a seven-point Likert
scale (1 = Strongly disagree/ 7 = Strongly agree). Leader-rated social responsibility
behaviours had a α of 0.82 in the current study. In order to analyse leader-rated ESR
behaviours at the group level, individual ratings were aggregated to the group level, through a
direct consensus shift (Chan, 1998).
Control Variables The control variables of company, team size, and leader tenure were
controlled for throughout group-level and individual-level analysis. The variable company
was controlled for since the sample was derived from two different organisations, and thus to
control for any extraneous influences, pertaining to the unique characteristics of each
company. Team size has been shown to affect for example performance in teams, and so this
was also controlled for (Haleblian and Finkelstein, 1993). Finally, leader tenure was
controlled since the leader’s experience with their subordinates may affect the ratings of
leadership style (Groves, 2005).
6.3.Analytical strategy
The sample was multilevel in nature; assessing constructs at both the group level and
individual level. More specifically, TF, assigned CSR priority, CSR climate, and ESR
behaviours were all measured at the individual level, and then aggregated to the group level
to analyse the group level model. TF, assigned CSR priority and ESR behaviours were also
analysed at the individual level to test for the individual level model, included in which were
the cross-level effects of organisational CSR climate. Teams were nested within leaders, with
leaders providing ratings of social responsibility behaviours of their team members.
Considering the multi-level nature of the model, inter-rater reliability statistics were
calculated in order to deduce if the constructs could be aggregated to the group level, to
represent a direct consensus shift (Chan, 1998) (see Table 6.02). In terms of ICC(1) values, it
is recommended that the F values be significant in order to demonstrate significant between
group variance, however there is an argument to the contrary, suggesting that this is not

[214]
necessary, rather F values should be greater than one (e.g. James et al., 1984). Bliese (2000)
also advises that ICC(1) values be greater than 0.05, and in this regard, all but the value of
assigned CSR priority, were acceptable. As can be seen from Table 6.02, all Rwg values were
above the recommended cut-off value of 0.70, and all ICC(1) values had F values greater
than the recommended minimum of 1 (James et al., 1984; Shrout and Fleiss, 1979). Indeed,
George (1990) has argued that when groups belong to the same organisation, as was
predominantly the case in this study, this can hamper the differences found between groups,
and so whilst the F values may not be significant, it is sufficient that they are greater than 1.
The ICC(2) values were however more problematic, as all but the value of the leader-rated
ESR scale fell below the cut-off of 0.50. When ICC(2) values are lower, the relationships
tend be attenuated, thus making tests of relevant relationships more conservative (Walker,
Kent, and Waldman, 2008). Nevertheless, it is argued that this should not prevent aggregation
if aggregation is justified by theory as well as high Rwg values (e.g. Chen and Bliese, 2002).
Hence, given that the Rwg and ICC(1) values were reasonable, the decision was made to
proceed with group-level analysis.
Table 6.02
Inter-rater reliability statistics and intra-class correlations: Field study
Construct Rwg ICC(1) ICC(2) F
Leader-rated ESR 0.97 0.70 0.88 8.27**
Assigned CSR priority 0.92 0.03 0.09 1.09
CSR climate 0.95 0.18 0.41 1.71*
Transformational leadership 0.94 0.07 0.20 1.25
Note: Table lists inter-rater agreement (Rwg), intra-class correlations (ICC), and F values
resulting from one-way ANOVAs; N = 101; *p<0.05 **p<0.01
The group level and individual level findings were analysed separately, given that the group
level and individual level hypotheses were mutually independent. Indeed, analysing
hypotheses existing at different levels of analysis independently is considered reasonable
(e.g. Colbert, Kristof-Brown, Bradley, and Barrick, 2008). At the group level, the PROCESS

[215]
macro devised by Hayes (2012) was used to test for simple moderation as well as the three-
way interaction effect. At the individual level, multi-level analysis was conducted using the
procedure recommended by Hofmann (1997) and Aguinis, Gottfredson, and Culpepper
(2013), in order to test for simple moderation, cross-level interaction effects, and three-way
interaction effects via hierarchical linear modelling techniques.
6.3.1. Group level analysis
The analysis at the group level was conducted using the PROCESS macro devised by Hayes
(2012). The PROCESS macro has the advantages of covering various analytical problems
relating to moderation and mediation analysis as well as combining the functions of previous
procedural tools, using a path analysis framework. It estimates coefficients through ordinary
least squares (OLS) regression, as well as generating conditional effects in a moderation
model, and providing means to probe both two and three way interactions. Whilst there have
been prior macros useful for conducting moderation analysis (e.g. Hayes and Matthes, 2009;
O’Connor, 1998), they have shortcomings such as not being able to conduct estimation, and
allowing the probing of three-way interactions, which Hayes (2012) addresses in his macro
(e.g. Hayes and Matthes, 2009).
Where interactions were significant, simple slopes were probed using the simple slope data
provided by the PROCESS macro, at one standard deviation below the mean and one
standard deviation above the mean. In order to plot the simple slopes, the procedure by
Aiken and West (1991) was used, to plot the simple slopes at one standard deviation above
and below the mean for single moderation effects. For the three-way interaction effect, the
plot data was derived from the PROCESS macro, and this was used to generate the graph.
Here, simple slopes were plotted at one standard deviation above (high) and below the mean
(low), for both moderators (i.e. assigned CSR priority and CSR climate), leading to four
simple slopes representing the four combinations (low, low; high, low; low, high; high, high)
between the two moderators.
The issue of centring data prior to analysis is a contentious one (e.g. Hayes, 2012). The idea
that mean-centring is needed in order to reduce multi-collinearity has been disproven; rather
it is argued that it by no means affects the results produced (Echambi and Hess, 2007; Hayes,
2012). However it can be useful in aiding the interpretation of results, and for this reason as
opposed to others, mean-centring is considered useful, and thus, variables were centred prior

[216]
to analysis (Aguinis et al., 2013; Hayes, Glynn, and Huge, 2012). In accordance with the
recommendations of Aiken and West (1991), predictor variables were centred on their
respective means, and the interaction terms were computed with these centred variables. The
controls of company membership, leader tenure and team size were used throughout analysis.
Hypothesis 1 stipulated the positive moderating effect of group level assigned CSR priority
on the relationship between transformational leadership at the group level and group social
responsibility behaviours (Figure 6.02). Testing this relationship involves estimating the
equation below in model 1 of the PROCESS macro, where TF is transformational leadership
(X), ACSR is assigned CSR priority (M), and the interaction is indicated by TF*ACSR (XM);
group ESR refers to group social responsibility behaviours.
Y=i + c1X + c2M + c3XM + ey (Hayes, 2012)
Group ESR=i + c1TF + c
2ACSR + c
3TF*ACSR + e
y
Figure 6.02
Statistical model for Hypothesis 1a: Field study
Note: TF = transformational leadership; ACSR = assigned CSR priority
Group TF
Group ESR
Group ACSR
TF x ACSR
c1
c2
c3
ey

[217]
Likewise, the moderating role of organisational CSR climate (M), between group level TF
(X) and group social responsibility behaviours, represented by the interaction TF*CCSR
(XM) was proposed in Hypothesis 2a (Figure 6.03). This involved the estimation of the
following equation, in model 1 of the PROCESS macro:
Y=i + c1X + c2M + c3XM + ey (Hayes, 2012)
Group ESR=i + c1TF + c
2CCSR + c
3TF*CCSR + e
y
Figure 6.03
Statistical model for Hypothesis 2a: Field study
Note: TF = transformational leadership; CCSR = CSR climate; Org=organisational
Finally, Hypothesis 3a stipulated a three-way interaction effect between group TF,
organisational CSR climate and group assigned CSR priority on group social responsibility
behaviours. This involved the testing of the following equation, in model 3 of the PROCESS
macro (see Figure 6.04).
Group TF
Group ESR
Org. CCSR
TF x CCSR
c1
c2
c3
ey

[218]
Y = i + c’1X + c’2M + b1W + c’4XM + b7XW + b8WM + b9XWM +ey (Hayes, 2012)
Group ESR= i + c’1TF + c’
2CCSR + b
1ACSR + c’
4TF*CCSR + b
7TF*ACSR +
b8ACSR*CCSR + b
9TF*ACSR*CCSR + e
y
Figure 6.04
Statistical model for Hypothesis 3a: Field study
Note: TF = transformational leadership; ACSR = assigned CSR priority; CCSR = climate for
CSR; Org = organisational
Group ESR
Group ACSR
TF x ACSR x CCSR ACSR x CCSR TF x ACSR
TF x CCSR
Org. CCSR
Group TF b1
c’1
c’2
c’4
b7 b8 b9
ey
[219]
6.3.2. Individual level analysis
At the individual level, multi-level analysis by way of hierarchical linear modelling, as per
the recommendations of Hofmann (1997) was utilised to test the hypotheses. Here, the groups
represented level 2, and the individuals within those groups represented level 1. As with
group level analysis, variables were grand-mean centred for analysis. More specifically,
predictor and moderator variables were standardised prior to computing interaction terms and
subsequent analysis. Centring is useful as it can aid the interpretation of findings (Dalal and
Zickar, 2002). Commonly, data is either grand-mean centred, where, as with the current
analysis, all predictor variables are centred in relation to their mean at a particular level; or
group-mean centred where level 1 predictors are not allowed to correlate with level 2
predictors (Enders and Tofighi, 2007). Proponents of group mean-centring suggest that it
provides a more accurate understanding of cross-level interaction effects (Hofmann and
Gavin, 1998). Nevertheless, it is argued that the choice of either needs to be dependent upon
theoretical processes, and in some cases, grand-mean centring may indeed be a more
plausible choice (Aguinis, Gottfredson, and Culpepper, 2013). Given that in the present
research, deviations from group averages were not expected, rather the differences between
the level 1 variables was of interest; grand-mean centring was considered appropriate (see
also Bliese, 2000). Additionally, whilst group-mean centring may allow for a more
meaningful interpretation of the cross-level effect, the change in parameters results in
reduced statistical power in testing the model, which was already compromised due to limited
sample size (Fedor, Caldwell, and Herold, 2006).
Hierarchical linear modelling is useful since it accounts for the fact that individuals within a
group are likely to be more similar than individuals between groups, and as a result, factoring
in this interdependence between group members by modelling both group and individual
level residuals (Hofmann, 1997). Furthermore, they allow us to examine relationships within
a hierarchical level and across hierarchical levels, and provide measures of individual and
group level variance in the outcome variable. In order to measure relationships within and
between hierarchical levels, two models are simultaneously estimated; where one models
relationships within the lower level units, and the second models the variation in these
relationships by their membership units (i.e. groups) (Bryk and Raudenbush, 1992).
In a model where individuals are nested within groups, as is the case in the present study,
hierarchical linear models estimate the level 1 model, noted as Yij = β0j + β1jXij + rij, separately
for each group. In this equation, Y represents the outcome variable for individuals (i) in their

[220]
respective groups (j). The value of the predictor variable is noted as X, whilst β0j and β1j refer
to intercepts and slopes respectively for the individual groups (j), with r referring to the
residual (Hofmann, 1997). Testing this equation for each group can result in one of four
patterns: firstly the groups can have identical slopes and intercepts, secondly they may have
identical slopes but vary by intercepts, thirdly they may have comparable intercepts but vary
by slope, and finally the groups may vary by both intercept and slope (see also Aguinis et al.,
2013).
The next part of hierarchical linear modelling addresses how group level variables can
explain the variation between groups in the latter three patterns. Consequently the level 2
analysis uses the intercepts and slopes from level 1 as outcome variables, as indicated by the
following equation:
β0j= γ00 + γ01Gj + U0j
β1j= γ10 + γ11Gj + U1j
(Hofmann, 1997)
Here, Gj refers to the group level variable, whilst γ00 and γ10 refer to the coefficients of the
intercept, and the slope of the individual level predictor variable X respectively. Additionally,
γ01 refers to the group level main effect of G, whilst γ11 indicates the interaction between the
group-level variable G with the individual level variable X. Level 2 residuals are represented
by U0j and U1j in the equation. The patterns of intercepts and slopes at level 1 would inform
the level 2 equations accordingly (Hofmann, 1997).
Hypothesis 1b looks at the moderating role of individual assigned CSR priority on the
relationship between individual level TF and individual ESR behaviours. This hypothesis was
tested with the intercept at random model, with the fixed effects of TF, assigned CSR
priority, and the interaction term of TF and assigned CSR priority. Hypothesis 2b proposed
the moderating effect of organisational CSR climate on the relationship between individual
TF on individual ESR behaviours. This hypothesis was likewise tested with the intercept at
random model, with the fixed effects as TF, CSR climate, and the interaction between the
two. Finally, Hypothesis 3b put forward a three-way interaction effect between individual TF,
individual assigned CSR priority, and organisational CSR climate on individual ESR

[221]
behaviours. This again was tested with the intercept at random model, with TF, CSR climate,
and assigned CSR priority as the fixed effects. Furthermore, the two way interactions
between TF and assigned CSR priority, TF and CSR climate, assigned CSR priority and CSR
climate, and the three way interaction between TF, assigned CSR priority, and CSR climate
were added as fixed effects. In all hypotheses tests, the controls of team size, company and
leader tenure were also factored in.
6.3.2.1.Preliminary individual level analysis
In order for multi-level analysis to be justified, there has to be significant within and between
group variance in the outcome variable of leader-rated ESR behaviours (Hofmann, 1997). To
do this, a model in which the intercept was not allowed to vary was compared to a model in
which the intercept was allowed to vary across groups; the null and unconditional models
respectively. Firstly, the null model was tested with only leader-rated ESR as the outcome
variable, and the intercept was not allowed to vary. This revealed a -2 Restricted Log-
Likelihood value of 266.79. Next an unconditional model was tested whereby the intercept
was allowed to vary at random, and group membership was factored in; this resulted in a -2
Restricted Log likelihood value of 209.85. The difference in the log likelihood values of
56.94 (1df) was shown to be significant in a chi-square test (p<0.001). This thus suggested
that the unconditional model provided a significantly better fit, implying there was significant
between-group variance; justifying the use of multi-level analysis. The variance of the
intercept and residual were imputed into the following equation in order to explain the
variance attributable to group membership: variance (intercept)/ variance (intercept +
residual); resulting in an ICC(1) value of 0.67, indicating that 67% of the variance in
intercept was attributable to group membership.
In order to test for variations by slopes, the slopes of the predictors in the different
hypotheses were systematically allowed to vary. When doing this, it transpired that either the
model did not converge, or that when it converged, the specific slope that was allowed to
vary was not significant. On a technical level, this would suggest that one should not proceed
with further testing, given that there is no variation between groups on a given slope.
Nevertheless, Aguinis et al. (2013) point out that in a number of cases, this is due to reduced
statistical power given that “Tests regarding τ11 [variance of slopes across teams] rely on
degrees of freedom determined by the number of L2 units (e.g., teams), which is usually

[222]
much smaller than a study’s total sample size regarding lower-level units (e.g., individual
employees)” (pg. 1503). In related reviews, Dalton, Aguinis, Dalton, Bosco, and Pierce
(2012) demonstrated that the median sample size at level 1 of analysis tends to range from
161-204 across a range of journal outlets, whilst Mathieu, Aguinis, Culpepper, and Chen
(2012) noted that the median value of level 2 sample sizes was 51. In the current study, the
sample was considerably smaller at both level 1 (N = 101) and level 2 (N = 32). Aguinis et al.
(2013) suggest that this significantly results in underpowered tests of slopes, leading to
erroneous conclusions that slopes are not significantly different from zero, when in fact they
may be, but the sample size hinders detection of significance. On the basis of this, Aguinis et
al. (2013) suggest that one should proceed with cross-level interaction testing when there is a
strong theoretical basis for doing so. As a result of this, given the theoretical rationale for the
proposed relationships in this study, analysis continued for all hypotheses at the individual
level with the intercept at random model.
Where interactions were significant, simple slopes were probed and plotted one standard
deviation below, and one standard deviation above the mean. The computational tool
provided by Preacher, Bauer, and Curran (2006) was used to probe the significant
interactions. In order to display the simple slopes graphically, the procedure by Aiken and
West (1991) was used, and subsequently the simple slopes were plotted one standard
deviation below and above the mean.

[223]
6.4.Results
6.4.1. Group level
Descriptive statistics, zero-order correlations, and scale reliabilities at the group level are
presented in Table 6.03. All other scales, barring assigned CSR priority (see above),
remained as complete scales for analysis purposes as these exhibited reliabilities of above .70
(Nunnally, 1978).
Table 6.03
Group level analysis: Means, standard deviations, and bivariate correlations
Variable M SD 1 2 3 4 5 6 7
1. Company¹ - - -
2. Team size 3.69 .69 .26 -
3. Leader job tenure 5.27 4.87 .07 -.13 -
4. Transformational
Leadership 2.90 .39 .15 .13 -.45* (.95)
5. CSR Climate 3.89 .47 -.03 -.08 -.06 .14 (.88)
6. Assigned CSR
Priority 4.69 .31 -.01 -.03 -.10 .33 .48** (.82)
7. Leader rated ESR-
Full scale 5.14 .75 -.32 -.27 .21 -.15 .02 -.05 (.82)
Note: Cronbach’s alpha are provided in brackets along the diagonal; M = mean; SD =
standard deviation; N = 32 in all cases; ¹0 = commercial banking organisation, 1 =
professional financial services organisation; *p<0.05 **p<0.01
Hypothesis 1a stipulated the positive moderating effect of group level assigned CSR priority
on the relationship between TF at the group level and group social responsibility behaviours.
More specifically, under conditions of high assigned CSR priority at the group level, it was
predicted that group TF would be positively related to group social responsibility behaviours.
As can be seen from Table 6.04, this was not significant (γ = 1.00, SE = 1.27, ns).

[224]
Table 6.04
Group level hypotheses testing: Leader-rated ESR
Predictor Leader-rated ESR
Estimate SE
Hypothesis 1a
Company -0.93 0.58
Team size -0.15 0.21
Leader job tenure 0.03 0.03
TF -0.01 0.42
ACSR 0.14 0.56
TF*ACSR 1.00 1.27
Hypothesis 2a
Company -0.88 0.58
Team size -0.19 0.20
Leader job tenure 0.03 0.03
TF 0.04 0.40
CCSR 0.04 0.29
TF*CCSR 0.61 0.65
Hypothesis 3a
Company -0.80 0.56
Team size -0.07 0.21
Leader job tenure 0.06† 0.03
TF -0.80 0.56
CCSR 0.13 0.32
ACSR -0.37 0.65
TF*CCSR -0.37 0.93
TF*ACSR 5.25† 2.62
ACSR*CCSR -0.95 1.23
TF*ACSR*CCSR 7.48† 3.65
Note: TF = transformational leadership; ACSR = assigned CSR priority; CCSR = CSR
climate; N = 32; *p<.05. **p<0.01 † p<0.10

[225]
Likewise, the moderating role of organisational CSR climate, between group level TF and
group social responsibility behaviours was proposed in Hypothesis 2a. It was hypothesised
that under a positive climate for CSR, group level TF would be positively related to increased
group social responsibility behaviours. Results showed that this TF and CSR climate
interaction was not significant (γ = 0.61, SE = 0.65, ns).
Finally, Hypothesis 3a stipulated a three-way interaction effect between group TF,
organisational CSR climate and group assigned CSR priority on group social responsibility
behaviours. It was predicted that under conditions of high assigned CSR priority and a
positive climate for CSR, group TF would related to greater social responsibility behaviours.
A negative relationship was expected when assigned CSR priority and CSR climate were
predicted to be low/weak. This three-way interaction was found to be marginally significant
(γ = 7.48, SE = 3.65, p<0.10; ΔR² = 0.12).
Simple slope analysis (see Table 6.05) revealed that the combined moderating influence of
assigned CSR priority and CSR climate was significant and positive when both were at high
levels (simple slope = 1.70, t = 2.17, p<0.05). The simple slope for when assigned CSR
priority was low and CSR climate was high, was marginally significant and negative (simple
slope= -3.70, t = -1.91, p<0.10). As can be seen in Figure 6.05, TF had a positive effect on
group CSR when both assigned CSR priority and CSR climate were high. This thus provides
partial support for Hypothesis 3a.
Table 6.05
Simple slope analysis for the three-way interaction at the group level
Simple slope analysis: TF x ACSR x CCSRGroup CSR
Assigned CSR
Priority CSR Climate Effect t p
-1SD -1SD -1.18 -1.64 ns
-1SD +1SD -3.70 -1.91 <.10
+1SD -1SD -0.09 -0.10 ns
+1SD +1SD 1.70 2.17 <.05
Note: Simple slope analysis at low (-1SD) and high (+1SD) levels of assigned CSR priority
and CSR climate; SD = standard deviation, TF = transformational leadership, ACSR =
assigned CSR priority, CCSR = CSR climate

[226]
Figure 6.05
Three way interaction effect at the group level

[227]
6.4.2. Individual level
As noted above, the procedure recommended by Hofmann (1997) to test for multi-level
moderation was used, specifically using the intercept at random model. Descriptive statistics,
zero-order correlations and scale reliabilities at the individual level are provided in Table
6.06.
Table 6.06
Individual level analysis: Means, standard deviations, and bivariate correlations
Variable M SD 1 2 3 4 5 6 7
1. Company¹ - - -
2. Team size 3.72 .65 .28** -
3. Leader job tenure 5.62 4.98 0.08 -0.08 -
4. Transformational
Leadership 2.87 .66 .07 .06 -.27** (.95)
5. CSR Climate² 3.90 .44 -.03 -.07 -.12 .12 (.88)
6. Assigned CSR
Priority 4.68 .53 -.01 -.01 -.05 .31** .29** (.82)
7. Leader rated ESR-
Full scale 5.12 .90 -.26** -.23* .15 -.06 -.03 .00 (.82)
Note: N = 101 in all cases; M = mean, SD = standard deviation; Cronbach’s alphas are
provided in brackets along the diagonal; ¹0 = commercial banking organisation 1 =
professional services organisation; ²based on aggregated scores; *p<0.05 **p<0.01

[228]
Table 6.07
Individual level hypotheses testing: Leader-rated ESR
Predictor Leader-rated ESR
Estimate SE
Hypothesis 1b
Company 0.98† 0.53
Team size -0.18 0.19
Leader job tenure 0.03 0.03
Individual TF 0.04 0.06
Individual ACSR 0.09 0.06
TF*ACSR 0.20** 0.07
Hypothesis 2b
Company 0.89 0.57
Team size -0.19 0.20
Leader job tenure 0.03 0.03
Individual TF 0.04 0.06
Org. CCSR 0.004 0.13
TF*CCSR 0.07 0.06
Hypothesis 3b
Company 0.97† 0.54
Team size -0.18 0.19
Leader job tenure 0.03 0.03
Individual TF 0.04 0.07
Org. CCSR -0.003 0.12
Individual ACSR 0.07 0.08
TF*CCSR 0.01 0.07
TF*ACSR 0.21* 0.10
CCSR*ACSR -0.05 0.07
TF*CCSR*ACSR -0.001 0.07
Note: TF = transformational leadership; ACSR = assigned CSR priority; CCSR = climate for
CSR; Org. = organisational; N = 101; *p<0.05 **p<0.01 †p<0.10

[229]
Hypothesis 1b predicted that individual level assigned CSR priority would have a positive
moderating effect between individual level TF and individual social responsibility
behaviours. As is evident from Table 6.07, there was indeed a significant interaction between
individual TF and assigned CSR priority on individual social responsibility behaviours (γ =
0.20, SE = 0.07, p<0.01; ΔR² = 0.08).
This interaction was plotted in order to decipher this significant relationship. As can be seen
from Figure 6.06, individual level TF had a positive effect on individual social responsibility
behaviours when assigned CSR priority was high. However when assigned CSR priority was
low, then TF had a negative effect on individual social responsibility behaviours. Simple
slope analysis indicated that this moderation was marginally significant and negative at low
levels of assigned CSR priority (simple slope = -0.16 (0.09), z = -1.73, p<0.10), and
significant and positive at high levels of assigned CSR priority (simple slope = 0.24 (0.10), z
= 2.48, p<0.05). This provides support for Hypothesis 1b.
Figure 6.06
Individual level: Moderating effect of assigned CSR Priority

[230]
Hypothesis 2b predicted that similarly, organisational CSR climate would also have a
positive moderating effect between TF at the individual level with individual social
responsibility behaviours. This hypothesis was not supported (γ = 0.07, SE = 0.06, ns).
Finally, Hypothesis 3b predicted a three way interaction effect between individual TF,
individual assigned CSR priority, and organisational CSR climate on individual social
responsibility behaviours. It was hypothesised that under conditions of elevated assigned
CSR priority and a positive climate for CSR, TF would have a positive relationship with
individual employee social responsibility behaviours. The findings however revealed that this
hypothesis was not supported (γ = -0.001, SE = 0.07, ns).
6.5.Discussion
Having developed a novel measurement tool to measure micro-level ESR in chapter five, the
aim of this first study was to utilise this measurement tool in order to test for the contextual
factors which facilitate individual and group ESR behaviours. Of interest was the combined
influence of TF, assigned CSR priority, and CSR climate in propagating ESR. At the group
level, this was done by testing the moderating influence of assigned CSR priority and CSR
climate, individually and then combined, all at the group level, on the effects of group TF on
group ESR. At the individual level, the moderating influence of individual assigned CSR
priority and CSR climate, both individually and combined, on the relationship between TF
and individual level ESR behaviours was investigated.
6.5.1. Summary of findings
At the group level, results revealed that assigned CSR priority and CSR climate did not
individually moderate the effects of group TF on group ESR, thus providing no support for
Hypotheses 1a and 2a respectively. However the interactive effects of assigned CSR priority
and CSR climate on the effects of TF on group social responsibility behaviours were partially
supported. More specifically, the relationship between TF and group social responsibility was
strongest when both assigned CSR priority was high and CSR climate was also high. This
provides partial confirmation for Hypothesis 3a.

[231]
At the individual level, the moderating effect of assigned CSR priority was supported. More
specifically, under conditions of high assigned CSR priority, TF was positively related to
individual level ESR behaviours, whilst the opposite relationship was evident under
conditions of low assigned CSR priority. This provided support for Hypothesis 1b.
Hypothesis 2b proposed the moderating role of organisational CSR climate on the effects of
TF on individual level ESR behaviours, such that a high climate for CSR would positively
moderate the relationship between TF and individual ESR. The results however were not
significant, and thus Hypothesis 2b was not supported.
Finally, at the individual level, the interactive effect of assigned CSR priority, TF, and
organisational CSR climate on individual ESR behaviours was expected in Hypothesis 3b.
More specifically, under conditions of a high organisational CSR climate and assigned CSR
priority, TF was predicted to be positively related to individual ESR, whereas the converse
was expected when assigned CSR priority and organisational CSR climate were low.
Analysis however yielded non-significant results for this hypothesized relationship and
consequently this hypothesis received no support.
6.5.2. Theoretical contributions
The closest current research has come to investigating ESR is by examining behaviours such
as volunteering, thus only capturing a small aspect of the multi-dimensional nature of ESR
(Booth et al., 2009). Not only this, but the initial conceptualisation of social responsibility
behaviours at the employee level appears questionable, as generalised behaviours are used to
capture these behaviours, such as employee recommendations in improving existing
organisational CSR programs (e.g. Vlachos et al., 2014). Thus the little research that has
focused on micro-CSR has done so by narrowly focusing on aspects of social responsibility
such as volunteering, or conversely by taking too broad a focus. As a result, the richness of
ESR is lost, but not only this, by failing to account for the multi-dimensionality of ESR
behaviours, research is unable to consider how the conflict between the various socially
responsible behaviours can be balanced (Aguilera et al., 2007).
This current study was unique in its multi-pronged approach to investigating the facilitating
conditions for ESR, and as a result, put forward the combined influence of TF, assigned CSR
priority and CSR climate. Through applying goal-setting theory, it was argued that effective

[232]
leadership behaviours set challenging goals and motivate and support employees towards
these goals (Locke and Latham, 2002). Additionally, they assign a high priority to CSR and
thus manage employee expectations of CSR, and avoid employee goal conflict by
emphasizing the wholeness of ESR (Aguilera et al., 2007). Furthermore, it was argued that
TF with a high assigned CSR priority alone was not sufficient given that an organisational
climate which was not conducive to CSR, could still engender goal conflict, by providing
inconsistent messages on the behaviours employees should adopt, causing employees to
prioritise some behaviours over others (Locke et al., 1994). Thus it was proposed that a CSR
climate which had policies and procedures focused on CSR, further iterated the importance of
CSR at the organisational level, and ensured that this was made salient to employees.
Accordingly, at the group level, the individual moderating effects of assigned CSR priority
and CSR climate were not evident. What was apparent however, was the combined
moderating role of these on the effects of group TF on group ESR. This provides credence to
the underlying rationale of this study, and interestingly points towards the necessary
precondition of all three factors of TF, assigned CSR priority, and CSR climate to be present,
in order for there to be a significant influence on group ESR, as outlined above. It seems that
TF coupled with either assigned CSR priority, or CSR climate, is not sufficient in
encouraging group ESR.
This further reinforces the explanatory power of goal-setting theory, in that leadership needs
to set challenging goals, inspire confidence, as well as motivate and support employees to
achieve these goals (Bass, 1990; Locke and Latham, 2002). Through assigned CSR priority,
the leader ensures that he/she clearly manages the expectations of the groups by highlighting
the significance of CSR and thus helping to thwart the experience of goal conflict (Katz and
Kahn, 1964). Furthermore, a positive CSR climate ensures that the policies and procedures
are CSR-orientated, further helping to prevent goal-conflict. This could as a result explain
why the individual moderating effects of assigned CSR priority and CSR climate were not
significant at the group level. As argued above, it is likely that alone these did not have the
needed effect to motivate and support employees, reduce role conflict, and encourage ESR.
Taken together, the interactive effects of TF, assigned CSR priority and CSR climate provide
the optimal conditions for group ESR, and thus the fact that only the three-way interaction
between these approached significance is in fact not surprising at all, but rather provides a

[233]
key theoretical contribution in demonstrating that optimal conditions necessitate both
assigned CSR priority and CSR climate, in conjunction with TF.
This further elucidates the context dependent effects of TF, by examining its influence in
combination with the novel constructs of assigned CSR priority and CSR climate (Yukl,
1999). The findings confirm the utility of TF in leading to positive work outcomes when
fitting conditions are in place (e.g. Judge and Piccolo, 2004). That is, TF in its own accord is
not unconditionally positive, rather, it exerts positive effects under the appropriate contextual
conditions, which in this study were a high assigned CSR priority and a positive CSR
climate, combined.
More specifically, at the group level, much like previous findings elucidating the moderating
role of climate on the effects of TF on employee behaviours (Charbonnier-Voirin et al.,
2010), in the present study also, the positive effects of TF on group CSR behaviours were
dependent upon a positive CSR climate. In particular, the current study showed the crucial
moderating role of a positive CSR climate, in addition to assigned CSR priority, in
facilitating group ESR. As a result, whilst very limited research has focused on a CSR-
specific climate, the current study is the first to highlight the role of an organisational climate
for CSR in facilitating group and individual ESR (see also El Akremi et al., in press).
Assigned CSR priority was also found to be an important contextual factor, thus reinforcing
previous literature on value-specific leadership behaviours (e.g. Zohar, 2002a). The present
study supported the moderating role of individual assigned CSR priority on the effects of TF
on ESR at the individual level. Previously, the likes of Barling et al. (2002) and Morhart et
al. (2009) evidenced that TF with a focus on specific outcomes such as safety and brand-
building behaviours respectively, was then positively associated with similar behaviours at
the employee level; that is enhancing safety indicators and employee brand-building
behaviours, in that order. More specifically, Zohar (2002a) suggested that TF was helpful in
enhancing safety at work, under the moderating influence of assigned safety priority. The
assigned CSR priority construct used in the current study was modelled on this assigned
safety priority, and thus provided a novel test of this construct in relation to CSR. By doing
so, the current study adds to the existing yet limited literature that effective leadership needs
to be value specific, and as such, when considering the ability of TF to enhance specific work
outcomes, in this case ESR, a specific focus is needed to these TF behaviours (CSR) in order
to convert them from value-free to value-specific.

[234]
At the individual level, TF was positively related to individual ESR behaviours when
assigned CSR priority was high. This further corroborates the findings of Zohar (2002a)
where the construct of assigned safety priority enhanced the effects of TF in reducing injury
rates. Additionally, the findings from the current research support findings which show that
TF behaviours directed at specific content such as brand building behaviours, has positive
effects on such behaviours (Barling et al., 2002; Morhart et al., 2009).
At the individual level, the individual moderating effect of CSR climate, and the interactive
effect of CSR climate and assigned CSR priority were not evident. One possible explanation
is that the CSR climate did not exert cross-level effects thus causing the single and interactive
moderating effect to go amiss. Indeed research has shown that climate does not always
exhibit cross level moderating effects (e.g. Walumbwa, Hartnell, and Oke, 2010). It may
possibly be that at the individual level, assigned CSR priority has a greater importance in
combination with TF. That is, when a leader uses TF behaviours, and manages expectations
of CSR through a high assigned CSR priority, CSR climate becomes redundant. Instead TF
assigns individual goals to employees, relevantly motivates and supports them towards these
goals, and attends to their individual needs. In combination with assigned CSR priority, this
is sufficient for employees to feel challenged, motivated and supported, as well as to negate
any experience of goal conflict regarding the multi-dimensionality of ESR behaviours.
Therefore, it may well be that individual ESR is independent of group ESR, and as a result
employee buy-in to ESR, as encouraged by their leader is sufficient for them to display ESR
behaviours, independent to what the group and/or organisation is encouraging.
It is also surprising that assigned CSR priority had a significant moderating effect at the
individual level, given that it was not significant at the group level. One possibility may be
that the group dynamics neutralized the possible effects of assigned CSR priority. For
example the leadership substitutes theory, as proposed by Kerr and Jermier (1978), stipulates
that certain characteristics pertaining to the individual such as skills and experience, to the
context such as structured tasks, and finally to the organisation such as cohesive work groups;
either substitute for, or neutralize leadership behaviours. In this case it may have been that the
groups prioritised CSR within the team, thus causing assigned CSR priority behaviours on
part of the leader to exert weak effects individually, but to exert a significant effect when in
combination with a positive CSR climate.
[235]
From these findings, it becomes apparent that the underlying dynamics of group and
individual ESR are distinct. At the group level, it seems the ideal conditions for ESR are
composed of TF, high assigned CSR priority and a positive CSR climate, whereas at the
individual level, effective leadership that assigns a high priority to CSR is sufficient, in and
of itself. This may be because at the group level, the group needs to experience that their TF
leader assigns a high importance to CSR, which is further reinforced by a positive CSR
climate, otherwise they do not feel the necessary support and encouragement to engage in
ESR. Whereas at the individual level, as noted above, due to the individualised relationship
of a TF leader with his/ her subordinate, individually attending to the subordinate and
highlighting the importance of CSR is adequate.
6.5.3. Limitations
However the study is not without its limitations. First and foremost, this was a cross-sectional
investigation in a field-setting thus whilst providing good external validity, as with any such
study, causality cannot be inferred. At the moment we can only conclude that TF, CSR
climate and assigned CSR priority are related to ESR, and not necessarily causally related. In
order to more confidently be able to draw causal inferences, the need for a longitudinal
investigation is necessary. Given however that this study is addressing a very limited and
nascent research domain, its exploratory nature was tested ideally in a cross-sectional
investigation. Nevertheless the next study, outlined in chapter seven, will address this
limitation by attempting to replicate the model in a time-lagged design, and thus providing
greater internal validity.
The present study also suffered from a limited sample size. Past research has demonstrated
the impact of sample sizes on analysis (e.g. Collins and Morris, 2008; La Du and Tanaka,
1989; Tett, Fitzke, Wadlington, Davies, and Anderson, and Foster, 2009). Small sample sizes
can lead to concerns over the validity generalisation hypothesis, with sampling error
explaining a significant proportion of the variance in validity coefficients (Salgado, 1998). In
the current research, it is therefore entirely possible that potentially important findings may
not have materialised, due to a loss of statistical power, and the borderline significant finding
of the three-way interaction may in fact have become apparent with a larger sample. All non-
significant findings in the current study should therefore be considered with caution given
this proportionate weakness. It is completely feasible that the individual moderating role of

[236]
CSR climate both at the group and individual level, as well as the three-way interaction at the
individual level does exist, but was not detected as a result of this reduced statistical power.
Nonetheless, as noted above these findings will be replicated in the time lagged study in a
sample that is double the size of the existing sample, and it is anticipated that this will
provide greater statistical power.
The limited sample size may have also been the cause for why slopes were not significantly
different across groups during preliminary individual level analysis. Aguinis et al. (2013)
point out that testing the differences in slopes relies on level two (i.e. group) sample sizes,
which tend to be significantly smaller than level one (i.e. individual) numbers. This small
sample size leads to reduced statistical power and precludes detection of possibly significant
effects. It is also likely that the findings of the group level, that is the three-way interaction
effect, was not replicated at the individual level because there was very little variance at the
individual level, compared to the group level. Going forward, the time-lagged study has a
sample size that is approximately double to the one used in the current study, and it is
imagined that this will circumvent the analytical issues faced in the current study.
The current research relied upon questionnaire data. Questionnaire data, whilst allowing for
the collection of data efficiently and effectively, is not without its weaknesses. Socially
desirable responding has been highlighted as a common concern with this method
(Holtgraves, 2004). In addition, employees provided ratings for assigned CSR priority and
CSR climate, thus leading to further concerns of common method biases (Podsakoff et al.,
2003). Even so, the study did attempt to minimise such concerns through its use of leader-
ratings of performance. It has been noted that when outcome measures are self-rated, the
ratings tend to be inflated and possess weak correlations with actual behaviour (Xie, Roy, and
Chen, 2006). Whilst further measures could have been taken, such as controlling for social
desirability, as well as positive and negative affectivity, Podsakoff et al. (2003) have
suggested that common method biases can be greatly minimised through various procedural
actions such as measuring predictor and criterion variables from different sources, as well as
ensuring respondents that there are no right or wrong responses; both of these
recommendations were implemented in this study. Thus we can be more confident that TF is
indeed related to greater ESR through assigned CSR priority and CSR climate.
In addition, this study was conducted in two Western organisations with the majority of
respondents being British. Thus the potential to generalize findings from a Western culture to

[237]
other cultures is not straightforward. It may be that there are cultural differences regarding a
performance versus human orientation, and this may as a result affect generalizability.
Indeed, research has demonstrated the culturally specific views of effective leader
behaviours, as a result of distinct culturally-informed implicit leadership theories (e.g.
Javidan, Dorfman, de Luque, and House, 2006). In study two, the time-lagged study, a
culturally diverse sample is employed and thus this limitation should hopefully be overcome.
6.5.4. Implications for practice
Various practical implications result from the findings. Given that this study was undertaken
in a field-setting in two organisations, it possess external validity, and thus any practical
contributions that arise from it can be considered sensible. Given the nature of findings, it is
evident that the practical implications are distinct at the group and individual levels.
At the group level, it is important to ensure the three necessary conditions for group ESR are
fulfilled; that is TF, assigned CSR priority, and CSR climate. As a result, leaders should be
trained to manage expectations regarding CSR, as well as communicating standards of
engaging with CSR. The need to consult with, and train leaders, so that they develop the
skills to implement TF behaviours as well as understand and communicate the importance of
CSR is needed. Research has shown that TF behaviours can be successfully trained with
resultant positive outcomes (Barling et al., 1996; Dvir et al., 2002). Furthermore, research in
the arena of safety has demonstrated the potential to develop those in leadership positions so
that they manage the conflict between safety and efficiency behaviours (Zohar, 2010). In
addition to this, the organisation needs to ensure the clear and non-contradictory CSR policies
and procedures are in place, and leader communications regarding CSR are in harmony with
these policies and procedures. Collectively, they can provide the optimal conditions to
support group engagement in CSR, through consistency of communication.
At the individual level, it seems that TF behaviours in tandem with assigning a high priority
to CSR are important. Here leaders should display effective TF behaviours so employees feel
empowered and supported, as well as communicate the importance of engaging with CSR
behaviours holistically. Consequently leadership training in TF behaviours, as well as
training in how expectations of employee engagement in CSR can be managed, is useful here
also. The importance is on individually attending to each employee and addressing his/her

[238]
specific needs, as well as tailoring communication and CSR goals to his/her abilities. Indeed,
Morhart et al. (2009) demonstrated the ability to train TF behaviours with a specific focus on
brand-specific behaviours.
Finally both at the group and the individual level, the importance of effective goal setting
cannot be underestimated. Leaders need to set challenging goals for groups and individuals
regarding ESR, in order to motivate employees to direct their behaviour in a goal-directed
fashion. The presence of CSR climate and/or assigned CSR priority will provide optimal
conditions for ESR and deter from sending conflicting messages as to what the leaders and
organisations hold dear. This therefore precludes any experience of role conflict by providing
employees with an unfailing message of what their leaders are encouraging, and what their
organisation is encouraging.
6.6.Summary
This chapter has utilised the newly developed ESR measurement tool in order to take the
initial steps in investigating the determinants of ESR at the group and individual levels. At
the group level, the significant moderating roles of assigned CSR priority and CSR climate,
together in an interactive fashion, on the effects of TF on group ESR was revealed. At the
individual level, the moderating role of individual level assigned CSR priority was identified.
Implications of the findings are discussed, and the need for a more longitudinal design to aid
in determining the direction of relationships is highlighted. This paves the way for the next
chapter in which the model is replicated in a time-lagged design, conducted over a period of
seven weeks.

[239]
Chapter 7: Time-lagged study
7.1.Introduction
In chapter six, the effects of transformational leadership (TF), assigned CSR priority, and
organisational CSR climate on group and individual employee social responsibility (ESR)
behaviours were investigated, by utilising the newly developed ESR scale (see chapter five).
Results revealed a marginally significant three-way interaction between group TF, group
assigned CSR priority and organisational CSR climate on subsequent group ESR. No results
were uncovered for the individual moderating roles of assigned CSR priority and
organisational CSR climate, on the effects of group TF on subsequent group ESR. At the
individual level, individual assigned CSR priority moderated the relationship between
individual level TF and individual ESR behaviours, whilst no significant findings were
yielded for the cross-level moderating effects of organisational CSR climate, and the three-
way interaction between individual level TF, individual level assigned CSR priority, and
organisational CSR climate.
One of the predominant weaknesses identified in this field study however was that, whilst it
possessed external validity by testing the proposed conceptual model in an organisational
setting, it lacked internal validity. That is, due to the cross-sectional nature of the
investigation, one could not from the results ascertain that TF, in combination with CSR
climate and/or assigned CSR priority, predicted enhanced group and individual engagement
in ESR behaviours.
In order to overcome this, the model is replicated in this chapter in a time-lagged design to
provide further credence to the model. This is done in a simulated business game (BG) setting
within a British business school. Over a seven week period, measurements of the predictor
variables were collected at time 1 (week 1), with the ESR behaviours being measured at time
2 (week 4) and time 3 (week 7). The data is analysed by testing the effects of the time 1
predictors, on time 2 and time 3 ESR behaviours, both at the group and the individual level.
Furthermore, results are also analysed by controlling for baseline measurements of ESR
behaviours (time 1) in order to assess if TF, group CSR climate, and/or assigned CSR priority
predicts groups and individuals’ ESR, over and beyond their initial engagement, over time.

[240]
Moreover, an additional limitation of the field study was noted to be its limited sample size in
which 101 team members, nested within 32 teams/ team leaders, was used to test for the
hypotheses. Given the issues experienced with analysis which possibly precluded the
detection of cross-level effects, as well as the borderline significance of the three-way
interaction effect at the group level; it was believed this restricted sample resulted in a loss of
statistical power (Aguinis et al., 2013). Furthermore, this may have been a likely explanation
for why the three-way effect was not replicated at the individual level. In addition, there were
concerns over the use of the primarily Western sample. In order to overcome these
shortcomings, another objective of this time-lagged study was to replicate the model in the
culturally diverse and significantly larger BG sample.
7.2.Hypotheses development
Longitudinal research is useful for allowing us to more confidently infer the directionality of
relationships between variables, than is the case with cross-sectional research. Nevertheless,
much of the work investigating the effects of leadership on employee outcomes has been
cross-sectional, and therefore we cannot conclusively state that certain leadership behaviours
predict employees’ behaviours (Judge and Piccolo, 2004; Lowe et al., 1996). Mitchell and
James (2001) highlight that survey designs in which all constructs are measured at the same
time, prevent the ability to assert the direction of findings.
When we discuss time, we refer to it in its traditional sense of standard clock time (Clark,
1985). Indeed, George and Jones (2000) noted that “standard or clock time has become the
dominant orientation toward time in the organisational literature” (pg. 659). As a result, our
time lagged study reflects influence of predictor variables measured at week 1, on outcome
variables at weeks 4 and 7. Consequently, time is allowed for individuals and groups to
engage in ESR behaviours in the interim period, and thus providing a more accurate depiction
of the effects of the antecedent and boundary conditions, on subsequent ESR (see Mitchell
and James, 2001).
There has been some research looking at the longitudinal effects of leader behaviours. For
example, Lorinkova, Pearsall, and Sims (2013) evidenced the positive effects of empowering
leadership over time, on team performance. Similarly, van Dierendonck and Dijkstra (2012)
revealed the positive effects of empowering leadership on follower empowerment after an
interval of three months. In addition, Walker et al. (2008) noted how changes in team

[241]
leadership predicted changes in customer satisfaction a year later, whilst Gupta, Huang, and
Niranjan (2010) noted the beneficial effects of team leadership in reducing conflict within
teams after a period of ten weeks, in a business game sample comparable to that of the
present study.
More specific to TF, the longitudinal effects of TF on employee work outcomes have been
demonstrated. For instance, Munir and Nielsen (2009) revealed a positive effect of TF on the
health of healthcare workers 18 months later, whilst Wilderom, van den Berg, and Wiersma
(2012) highlighted the positive effects of charismatic leadership, considered akin to the
idealised influence facet of TF, on objective financial performance measured after two years.
Nielsen, Randall, Yarker, and Brenner (2008) further showed how TF measured at time 1 is
positively related to employee well-being measured at time 2, after an 18 month interval;
whereas Tafvelin, Armelius, and Westerberg (2011) replicated these findings in a 12 month
interval. Similarly, van Dierendonck, Haynes, Borril, and Stride (2004) demonstrated
longitudinal effects of TF on employee well-being, whilst Keller (2006) further evidenced the
positive impact of TF on performance outcomes one year and five years later, such as
schedule performance and profitability respectively; demonstrating the effects of TF after an
even greater period of time.
Studies scrutinising the effects of leadership interventions on improving leadership
behaviours, and consequently employee outcomes, can also be used to further reinforce the
longitudinal effects of leadership. For example, Barling et al. (1996) demonstrated that leader
training in TF behaviours could lead to enhanced objective performance outcomes as well as
organisational commitment, measured five months following the intervention. Dvir et al.
(2002) also evidenced the positive impacts of TF training on subsequent employee
development and performance.
In addition, with regards to the safety literature, Zohar (2002b) noted the positive effects of
an intervention to improve supervisor safety-oriented interactions with employees over an
eight week period, on various safety performance indicators, such as a lowered injury rates
(see also Zohar and Luria, 2004). Moreover, an intervention to improve leaders’ self-
regulation resulted in improved objective performance of the teams (Yeow and Martin,
2013).
With reference to the longitudinal effects of assigned CSR priority, whilst not directly
inferred, as it is a novel construct introduced within this research, Zohar (2002a) was able to

[242]
do so for assigned safety priority, on which assigned CSR priority is modelled. He showed
how assigned safety priority in conjunction with TF and a safety climate, was helpful in
improving safety indicators, the latter which were measured over a six month period, and as a
result he was able to preclude reverse causality. Other studies which assessed proximate
constructs to assigned CSR priority, such as the effects of brand-specific TF on employee
brand building behaviours in the case of Morhart et al. (2009), have been conducted with
cross-sectional designs (see also Barling et al., 2002).
Finally, CSR climate is a very recent construct and so there have been no prior efforts to
longitudinally relate this to positive group and individual (CSR) outcomes. Pertaining to
climate in general, research has demonstrated its effects longitudinally. For example, Neal
and Griffin (2006) established over a five year period that a group climate for safety was
positively related to individual safety motivations, which in turn was positively related to
individuals’ safety participation. More specific to the current research, Liao and Chuang
(2007) highlighted the moderating role of a service climate relationship between TF on
employee service performance measured nine months later.
Based on the above, it is reasonable to expect the longitudinal effects of TF, assigned CSR
priority, and CSR climate. Much of the research has tended to be conducted over a longer
time period, in contrast to the seven week period in the present study. This as a result, should
be helpful in deducing the short-term effects of TF. It is hypothesised that CSR climate
and/or assigned CSR priority will have a significant moderating effect on the effects of TF,
all measured at baseline (time 1/ week 1), on individual and group ESR behaviours, both at
time 2 (week 4), and time 3 (week 7), in a multi-level time-lagged model (see Figure 7.01).
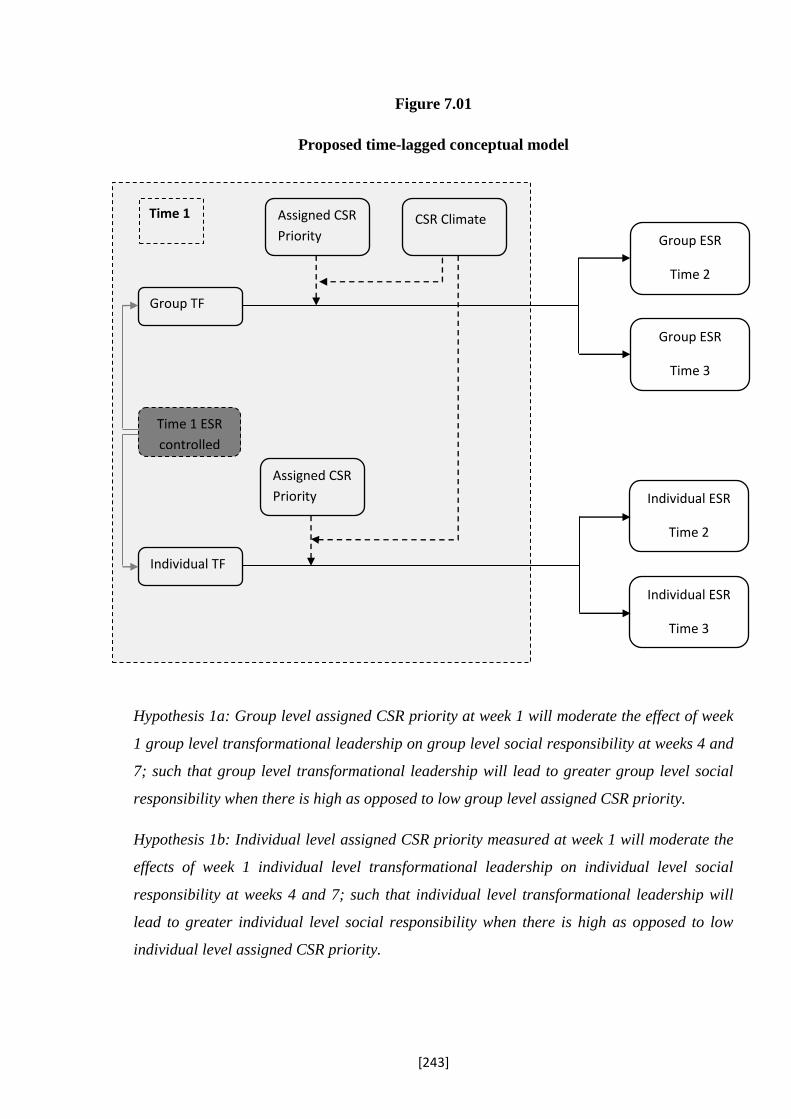
[243]
Figure 7.01
Proposed time-lagged conceptual model
Hypothesis 1a: Group level assigned CSR priority at week 1 will moderate the effect of week
1 group level transformational leadership on group level social responsibility at weeks 4 and
7; such that group level transformational leadership will lead to greater group level social
responsibility when there is high as opposed to low group level assigned CSR priority.
Hypothesis 1b: Individual level assigned CSR priority measured at week 1 will moderate the
effects of week 1 individual level transformational leadership on individual level social
responsibility at weeks 4 and 7; such that individual level transformational leadership will
lead to greater individual level social responsibility when there is high as opposed to low
individual level assigned CSR priority.
Group ESR
Time 3
Individual ESR
Time 3
Time 1
Group TF
Group ESR
Time 2
Assigned CSR
Priority CSR Climate
Individual TF
Individual ESR
Time 2
Assigned CSR
Priority
Time 1 ESR
controlled

[244]
Hypothesis 2a: Group level climate for CSR at week 1 will moderate the effects of week 1
group level transformational leadership on group level social responsibility at weeks 4 and
7; such that group level transformational leadership will lead to greater group social
responsibility when there is a positive as opposed to a weak group level climate for CSR.
Hypothesis 2b: Group level climate for CSR at week 1 will moderate the effects of week 1
individual level transformational leadership on individual level social responsibility at weeks
4 and 7; such that individual level transformational leadership will lead to greater individual
level social responsibility when there is a positive as opposed to a weak individual level
climate for CSR.
Hypothesis 3a: Group level climate for CSR at week 1 will moderate the interactive effect of
group level assigned CSR priority at week 1 and week 1 group level transformational
leadership, on group level social responsibility at weeks 4 and 7. When group level climate
for CSR is positive and group level assigned CSR priority is high, group level
transformational leadership will lead to greater levels of group level social responsibility.
When group level climate for CSR is weak and group level assigned CSR priority is low,
group level transformational leadership will lead to lower levels of group level social
responsibility
Hypothesis 3b: Group level climate for CSR at week 1 will moderate the interactive effect of
individual level assigned CSR priority at week 1 and week 1 individual level transformational
leadership, on individual level social responsibility at weeks 4 and 7. When group level
climate for CSR is positive and individual level assigned CSR priority is high, individual level
transformational leadership will lead to greater levels of individual level social
responsibility. When group-level climate for CSR is weak and individual level assigned CSR
priority is low, individual level transformational leadership will lead to lower levels of
individual level social responsibility.
Furthermore, the present study aims to assess the incremental increases in ESR behaviours
over time. Based on the above longitudinal literature where relationships tend to be
determined over a longer time period, it is expected that the hypothesised relationships in the
current study will persist, even after controlling for ESR behaviours measured at week 1, and
will thus represent ESR over and beyond that measured at baseline (i.e. week 1).

[245]
Mitchell and James (2001) argue that research involving causal relationships should make
explicit the way in which predictor X predicts outcome Y, within the context of time. In the
present study, based on the discussion of Mitchell and James (2001), it is anticipated that the
predictors in the current study occur before group and individual ESR behaviours.
Furthermore, it is argued these ESR behaviours do not transpire instantly; rather they need
time to develop, as employees scope out, and commit to voluntary activities, for instance.
More specifically, this study refers most closely to ‘configuration 3’ proposed by Mitchell
and James (2001); in that the predictors TF, assigned CSR priority, and CSR climate,
interactively predict ESR, and this ESR develops/changes over time, for example as
employees involve themselves in a greater number of organisational CSR initiatives.
Going beyond this, the ESR behaviours at week 1 can be considered baseline as they are
measured before the effects of predictors TF, assigned CSR priority, and CSR climate are
allowed to fully develop. Therefore in order to assess change in ESR from that of baseline,
ESR behaviours measured at week 1 need to be controlled for. This allows presumptions to
be made, relating to the enhancing effects of the predictors TF, assigned CSR priority, and
CSR climate on subsequent ESR, beyond that measured at baseline, and supposedly before
the predictors have had time to exert their full effects, and before employees have had
sufficient time to increase their ESR. Indeed, it is recommended that to causally test the
effects of a time 1 predictor on time 2 outcomes, the outcome at time 1 should be controlled
for (Granger, 1969). This will assist in making the case for the persistence of ESR
behaviours, which go beyond initial engagement. This leads to the following hypotheses:
Hypothesis 4a: Group level assigned CSR priority at week 1 will moderate the effect of week
1 group level transformational leadership on group level social responsibility at weeks 4 and
7, after having controlled for week 1 group ESR. Such that group level transformational
leadership will lead to an increase in group level social responsibility when there is high as
opposed to low group level assigned CSR priority.
Hypothesis 4b: Individual level assigned CSR priority measured at week 1 will moderate the
effects of week 1 individual level transformational leadership on individual level social
responsibility at weeks 4 and 7, after having controlled for week 1 individual ESR. Such that
individual level transformational leadership will lead to an increase in individual level social
responsibility when there is high as opposed to low individual level assigned CSR priority.

[246]
Hypothesis 5a: Group level climate for CSR at week 1 will moderate the effects of week 1
group level transformational leadership on group level social responsibility at weeks 4 and 7,
after having controlled for week 1 group ESR. Such that group level transformational
leadership will lead to an increase in group social responsibility when there is a positive as
opposed to a weak group level climate for CSR.
Hypothesis 5b: Group level climate for CSR at week 1 will moderate the effects of week 1
individual level transformational leadership on individual level social responsibility at weeks
4 and 7, after having controlled for week 1 individual ESR. Such that individual level
transformational leadership will lead to an increase in individual level social responsibility
when there is a positive as opposed to a weak individual level climate for CSR.
Hypothesis 6a: Group level climate for CSR at week 1 will moderate the interactive effect of
group level assigned CSR priority at week 1 and week 1 group level transformational
leadership, on group level social responsibility at weeks 4 and 7, after having controlled for
week 1 group ESR. When group level climate for CSR is positive and group level assigned
CSR priority is high, group level transformational leadership will lead to an increase in
group level social responsibility. When group level climate for CSR is weak and group level
assigned CSR priority is low, group level transformational leadership will lead to a decrease
in group level social responsibility
Hypothesis 6b: Group level climate for CSR at week 1 will moderate the interactive effect of
individual level assigned CSR priority at week 1 and week 1 individual level transformational
leadership, on individual level social responsibility at weeks 4 and 7, after having controlled
for week 1 individual ESR. When group level climate for CSR is positive and individual level
assigned CSR priority is high, individual level transformational leadership will lead to an
increase in levels of individual level social responsibility. When group-level climate for CSR
is weak and individual level assigned CSR priority is low, individual level transformational
leadership will lead to a decrease in individual level social responsibility.

[247]
7.3.Procedure
The above hypotheses were tested within the BG sample, where teams worked within a
simulated business game environment. Team members (N = 232) were nested within teams/
team leaders (N = 67). Greater details of the method and sample can be found within the
Methodology and Samples chapter (chapter four). Nevertheless, to serve as a reminder, the
measures used to test the above hypotheses are listed below. The team leaders and their team
members were requested to complete surveys at three time points. A baseline measurement
was taken in week 1 (time 1), with the subsequent two surveys on week 4 (time 2), and week
7 (time 3). It should be noted that initially this study was intended to host an intervention
study, examining the effect of training TF behaviours, and how this affected subsequent
performance outcomes over time. However subsequent analyses revealed that the
intervention had no significant effects in promoting ESR, and as a result, was not warranted
further consideration; refer to chapter four for a more in-depth discussion of the intervention.
The full list of items in the leader questionnaire can be found in Appendix 4, and the full list
of items in the team member questionnaire can be found in Appendix 5.
Leader Questionnaire
Employee Social Responsibility: These behaviours were assessed using the newly-developed
ten-item multi-dimensional ESR scale. Leaders rated the extent to which their team members
engaged in these behaviours. The scale consisted of five dimensions, namely social (‘assists
in community projects’), philanthropy (‘raises money for charity’), stakeholder (‘treats others
with respect’), environmental (‘recycles’), and finally economic (‘completes work to a high
standard’). They responded to the items on a seven-point Likert scale (1 = Strongly disagree/
7 = Strongly agree). The Cronbach’s alphas for leader-rated ESR at time 1, 2 and 3 were
0.82, 0.83, and 0.87 respectively. For group level analysis, the individual ratings were
aggregated to the group level through direct consensus shift (Chan, 1998).
Team Member Questionnaire
Transformational Leadership: This was assessed using the multi-factor leadership
questionnaire (MLQ; Bass and Avolio, 1990, for which a license was obtained from Mind
Garden Inc. This was used to assess the four facets of transformational leadership, namely

[248]
individualised consideration, intellectual stimulation, inspirational motivation, and idealised
influence. Subordinates responded to the questions on a five point Likert scale (0 = Not at all/
4 = Frequently if not always) regarding the leadership behaviours of their team leader. An
example of an item is: ‘Seeks differing perspectives when solving problems’. The α for this
scale in the study was noted as 0.95. For group level analysis, the individual ratings were
aggregated to the group level through direct consensus shift (Chan, 1998).
Assigned CSR Priority: The procedure used by Zohar (2002a) to assess assigned safety
priority was used; here the questions were amended so that they tapped into assigned CSR
priority. The team members were asked to indicate the extent to which their team leader
conformed to each statement, on a five-point scale (1 = Not at all/ 5 = To a very large extent).
An example of an item is: ‘Expect you to cut corners and neglect social responsibility’. When
calculated, the α of this CSR-adapted scale was initially 0.66. On further scrutiny, it appeared
that the fifth item which happened to be the only non-reverse scored item was problematic.
This item was therefore deleted and the four-item measure of assigned CSR priority (items 1-
4) was henceforth used in all subsequent analyses, with a final α of 0.84. For group level
analysis, the individual ratings were aggregated to the group level through direct consensus
shift (Chan, 1998).
Climate for CSR: Climate for CSR was assessed using the G-CSR scale developed by
Mueller et al. (2012). This was a six item measure tapping into issues such as the
organisation’s handling of CSR in general, and initiatives towards protecting the environment
more specifically; the referent was adapted from the organisation to the group. An example
item includes: ‘My group does enough towards protecting the environment’. Team members
responded to these items on a five point Likert scale regarding the behaviours of their own
group (1 = Strongly disagree/ 5 = Strongly agree). The α for this scale in the study was 0.86.
For group level analysis, the individual ratings were aggregated to the group level through
direct consensus shift (Chan, 1998).
Employee Social Responsibility: These behaviours were assessed using the newly-developed
ten-item multi-dimensional ESR scale. Team members were requested to rate the extent to
which their peers engaged in such behaviours in a 360º fashion, excluding self-ratings. The
scale consisted of five dimensions, namely social (‘assists in community projects’),
philanthropy (‘raises money for charity’), stakeholder (‘treats others with respect’),
environmental (‘recycles’), and finally economic (‘completes work to a high standard’). They

[249]
responded to the items on a seven-point Likert scale (1 = Strongly disagree/ 7 = Strongly
agree). The Cronbach’s alphas, for the 360º peer-rated ESR was 0.89, 0.90, and 0.92; for time
1, 2 and 3 respectively. For group level analysis, the individual ratings were aggregated to the
group level through direct consensus shift (Chan, 1998).
Controls: The variables of team size and intervention were controlled throughout group and
individual level analysis. Team size was controlled since it has been demonstrated to impact
upon team performance (Haleblian and Finkelstein, 1993). And the two intervention dummy
variables, to represent the TF and CSR interventions individually, were included to control
for any effects the interventions may have had.
7.4.Analytical strategy
Data was collected at the group and individual levels, where group members were nested
within team leaders, in order to test for multi-level effects. The team leaders provided
objective ratings for individuals’ levels of social responsibility, which were then aggregated
to provide a rating of the overall group’s social responsibility. In addition to this, the team
members provided ratings for their peers’ levels of social responsibility in a 360° fashion,
barring self-ratings. In order to analyse the group-level model, TF, assigned CSR priority and
CSR climate ratings were aggregated to the group level by way of direct consensus shift
(Chan, 1998). To test for the cross-level model, individual ratings of TF and assigned CSR
priority were used, as well as the aggregated construct of group CSR climate.
Owing to the multi-level nature of analysis, inter-rater reliability statistics were computed in
order to justify if the group level variables could indeed be aggregated to the group level, by
means of a direct consensus shift (Chan, 1998). Table 7.01 below provides the ICC(1),
ICC(2), and Rwg calculations for the group level variables in this study.

[250]
Table 7.01
Inter-rater reliability coefficients and intra-class correlations: Time-lagged study
Construct Time Rwg ICC(1) ICC(2) F
Leader-rated ESR1
1 0.98 0.82 0.94 16.06**
2 1.00 0.83 0.94 17.06**
3 0.99 0.83 0.94 16.77**
Team-rated ESR
(360°)2
1 0.99 0.64 0.85 6.83**
2 0.97 0.58 0.82 5.67**
3 0.99 0.66 0.86 7.34**
Assigned CSR priority 1 0.81 0.06 0.19 1.23
CSR climate 1 0.88 <0.01 0.01 1.01
TF leadership 1 0.92 0.29 0.59 2.41**
Note: Rwg = inter-rater reliability; ICC = intra-class correlation; F= values are derived from
one-way ANOVAs; 1N = 67, 2N = 232**p<0.01
All computed Rwg values were above the recommended 0.70, whilst with regards to ICC(1)
and ICC(2) it is recommended that for the former the F value should be greater than one, and
for the latter, the cut-off value is 0.50 (James et al.,1984; Shrout and Fleiss, 1979).
Accordingly, all ICC(1) values were acceptable, given that the F value was greater than one.
However, the ICC(2) values for both assigned CSR priority and CSR climate at time 1, were
below the cut-off value of 0.50. Nevertheless, given that aggregation was justified by theory,
as well as high Rwg values and acceptable ICC(1) values, it is deemed reasonable to continue
with group level analysis (e.g. Chen and Bliese, 2002). Indeed, low ICC(2) values makes
tests of relationships more conservative as opposed to more liberal (Walker et al., 2008).
Data at the group and individual level was analysed as in the field study in chapter six. The
reader is referred to this preceding chapter for greater detail on the analysis strategy for the
group and individual levels. At the group level, the PROCESS macro by Hayes (2012) was
used to test the group-level model, specifically through the use of models 1 and 3. At the
individual level, hierarchical linear modelling analysis was conducted according to
established recommendations by the likes of Hofmann (1997) and Aguinis et al. (2013).

[251]
7.4.1. Group level analysis
Hypothesis 1a stipulated the positive moderating effect of group level assigned CSR priority
on the relationship between transformational leadership at the group level and group social
responsibility behaviours. This interaction between TF and assigned CSR priority was tested
through model 1 in the PROCESS macro. Likewise, the moderating role of group CSR
climate between group level transformational leadership and group social responsibility
behaviours was proposed in Hypothesis 2a. This interaction between TF and CSR climate
was again tested using model 1 of the macro. Finally, Hypothesis 3a stipulated a three-way
interaction effect between group transformational leadership, organisational CSR climate and
group assigned CSR priority on group social responsibility behaviours. This three-way
interaction was tested in model 3 of the macro. Hypotheses 4a, 5a, and 6a involved testing the
same relationships but with the added control of time 1 group ESR. They were thus tested
with the same models, with the added exception that time 1 group ESR was also controlled
for (in addition to controls of intervention and team size). As with analysis in chapter six,
data was grand-mean centred for analysis in order to aid interpretation of the results (Aguinis
et al., 2013). All models at the group level were tested with the outcome of leader-ratings of
ESR, which were aggregated to the group level.
Where interactions were significant, simple slopes were probed using the simple slope data
provided by the PROCESS macro, at one standard deviation below the mean and one
standard deviation above the mean. In order to plot the simple slopes, the procedure by
Aiken and West (1991) was used to plot the simple slopes at one standard deviation above
and below the mean for single moderation effects. For the three-way interaction effect, the
plot data was derived from the PROCESS macro, and this was used to generate the graph.
Here, simple slopes were plotted at one standard deviation above (high) and below (low) the
mean, for both moderators (i.e. assigned CSR priority and CSR climate), leading to four
simple slopes representing the four combinations (low, low; high, low; low, high; high, high)
between the two moderators.
7.4.2. Individual level analysis
At the individual level, multi-level analysis by way of hierarchical linear modelling, as per
the recommendations of Hofmann (1997) was utilised to test the hypotheses. Here, the groups
represented level 2, and the individuals within those groups represented level 1. All predictor

[252]
variables were grand-mean centred prior to computing interaction terms. The hypotheses
were tested with both leader-ratings of social responsibility behaviours, as well as peer 360º
ratings of social responsibility behaviours, which were averaged across group members to
provide each individual within a team, a single averaged peer-rating.
Hypothesis 1b looks at the moderating role of individual assigned CSR priority on the
relationship between individual level TF and individual ESR behaviours. Hypothesis 2b
proposed the cross-level moderating effect of a group level CSR climate on the relationship
between individual level TF and individual ESR behaviours. Finally, hypothesis 3b put
forward a three-way interaction effect between individual TF, individual assigned CSR
priority and group CSR climate on individual ESR behaviours. These hypotheses were tested
using the intercept at random model for the peer-ratings of ESR, and with the TF at random
model for leader ratings of ESR (see below). Additionally, Hypotheses 4b, 5b, and 6b
proposed the same relationships respectively, which were tested in the same way with the
added control of time 1 individual ESR (in addition to controls of intervention and team size);
in order to test for changes in individual ESR over time. With peer-ratings of social
responsibility behaviours, these hypotheses were tested with the intercept at random model.
With leader-ratings, these hypotheses were tested with the TF at random model. See below
for further clarity on why this was the case.
7.4.2.1.Preliminary individual level analysis
In order for multi-level analysis to be justified, there has to be significant within and between
group variance in the outcome variable of ESR behaviours. To do this, a model in which the
intercept was not allowed to vary was compared to a model in which the intercept was
allowed to vary; the null and unconditional models respectively. Firstly, the null model was
tested with only ratings of social responsibility behaviours as the outcome variable, and the
intercept was not allowed to vary. Next an unconditional model was tested whereby the
intercept was allowed to vary at random, and group membership was factored in. This was
done for both leader-rated ESR and peer-rated 360º ESR at times 2 and 3. To compare model
fit, the difference in -2 Restricted Log Likelihood values and degrees of freedom was
computed; this difference was then checked against a chi-square table in order to test if the
unconditional model provided a significantly better fit compared to the null model (see Table

[253]
7.02). In all cases, the unconditional model fit the data significantly better, thus suggesting
significant between group variance; as a result multi-level analysis is justified.
Table 7.02
Comparing model fit of null and unconditional models: Time-lagged study
Outcome Null
Model
Unconditional
Model
Difference in: -2 Restricted Log
Likelihood Values
(Degrees of Freedom)
χ²
Leader-rated
ESR: Time 2¹ 492.99 301.05 191.94 (1) p<0.001
Leader-rated
ESR: Time 3² 545.33 357.31 188.02 (1) p<0.001
Peer-rated
ESR: Time 2³ 477.99 396.03 81.96 (1) p<0.001
Peer-rated
ESR: Time 34 462.91 360.63 102.28 (1) p<0.001
Note: This table and uses chi-square test (χ²) to assess the significance of the difference
between the two -2 Restricted Log Likelihood values; ¹N = 15 ²N = 210 ³N = 219 4N = 218
Following this, the variance of the intercept and residual were imputed into the following
equation in order to explain variance attributable to group membership: variance (intercept)/
variance (intercept + residual). For leader-ratings at time 2, this yielded a value of 0.84
suggesting that 84% of the variance was attributable to group membership. For time 3 leader
ratings, this value was 0.83, indicating that 83% of the variance was attributable to group
membership. For peer-ratings at time 2, the calculated value was 0.79, indicating that 79% of
the variance was attributable to group membership. At time 3, this value was 0.70 suggesting
70% of the variance was attributable to group membership.
In order to test for variations by slopes, the slopes of the predictors in the different
hypotheses were systematically allowed to vary, for both leader-rated and peer-rated ESR at
times 2 and 3. For leader-ratings of social responsibility behaviours at times 2 and 3, in most
cases the model did not converge. However when the model was calculated with TF at
random, the model did converge; and the slope of TF was indicated to be statistically
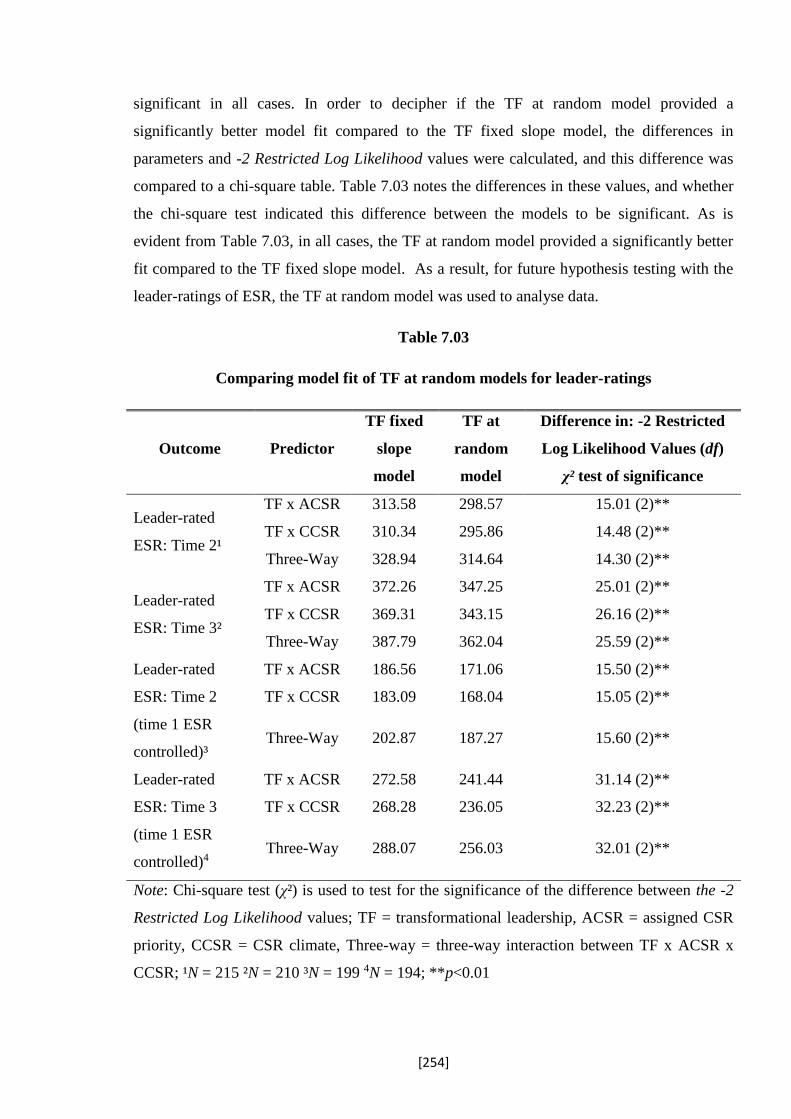
[254]
significant in all cases. In order to decipher if the TF at random model provided a
significantly better model fit compared to the TF fixed slope model, the differences in
parameters and -2 Restricted Log Likelihood values were calculated, and this difference was
compared to a chi-square table. Table 7.03 notes the differences in these values, and whether
the chi-square test indicated this difference between the models to be significant. As is
evident from Table 7.03, in all cases, the TF at random model provided a significantly better
fit compared to the TF fixed slope model. As a result, for future hypothesis testing with the
leader-ratings of ESR, the TF at random model was used to analyse data.
Table 7.03
Comparing model fit of TF at random models for leader-ratings
Outcome Predictor
TF fixed
slope
model
TF at
random
model
Difference in: -2 Restricted
Log Likelihood Values (df)
χ² test of significance
Leader-rated
ESR: Time 2¹
TF x ACSR 313.58 298.57 15.01 (2)**
TF x CCSR 310.34 295.86 14.48 (2)**
Three-Way 328.94 314.64 14.30 (2)**
Leader-rated
ESR: Time 3²
TF x ACSR 372.26 347.25 25.01 (2)**
TF x CCSR 369.31 343.15 26.16 (2)**
Three-Way 387.79 362.04 25.59 (2)**
Leader-rated
ESR: Time 2
(time 1 ESR
controlled)³
TF x ACSR 186.56 171.06 15.50 (2)**
TF x CCSR 183.09 168.04 15.05 (2)**
Three-Way 202.87 187.27 15.60 (2)**
Leader-rated
ESR: Time 3
(time 1 ESR
controlled)4
TF x ACSR 272.58 241.44 31.14 (2)**
TF x CCSR 268.28 236.05 32.23 (2)**
Three-Way 288.07 256.03 32.01 (2)**
Note: Chi-square test (χ²) is used to test for the significance of the difference between the -2
Restricted Log Likelihood values; TF = transformational leadership, ACSR = assigned CSR
priority, CCSR = CSR climate, Three-way = three-way interaction between TF x ACSR x
CCSR; ¹N = 215 ²N = 210 ³N = 199 4N = 194; **p<0.01

[255]
When doing this for peer-ratings of ESR, it transpired that either the models did not
converge, or that when they converged, the specific slope that was allowed to vary was not
significant. This was parallel to what occurred in the field study chapter (chapter six). On a
technical level, this would suggest that one should not proceed with further testing, given that
there is no variation between groups on a given slope. Nevertheless, Aguinis et al. (2013)
point out that in a number of cases, this is due to reduced statistical power given that “Tests
regarding τ11 [variance of slopes across teams] rely on degrees of freedom determined by
the number of L2 units (e.g., teams), which is usually much smaller than a study’s total
sample size regarding lower-level units (e.g., individual employees)” (pg. 1503). Given that
the current sample size was approximately double that of the field study sample size, such an
issue was not anticipated here (N group = 67; N individuals = 232). Nevertheless it occurred,
thus hinting that the sample size was still not sufficient, possibly because the model to be
tested was more complex.
Aguinis et al. (2013) point out that small sample sizes can significantly result in
underpowered tests of slopes, leading to erroneous conclusions that slopes are not
significantly different from zero, when in fact they may be but the sample size hinders
detection of significance. On the basis of this, Aguinis et al. (2013) suggest that one should
proceed with cross-level interaction testing when there is a strong theoretical basis for doing
so. As a result of this, given the theoretical rationale for the proposed relationships in this
study, analysis continued for all hypotheses at the individual level, with the intercept at
random model, in the case of time 2 and 3 peer-ratings of ESR.
Where interactions were significant, simple slopes were probed and plotted one standard
deviation below, and one standard deviation above the mean. The computational tool
provided by Preacher et al. (2006) was used to probe the significant interactions. In order to
display the simple slopes graphically, the procedure by Aiken and West (1991) was used, and
subsequently the simple slopes were plotted one standard deviation below and above the
mean.

[256]
7.5.Results
7.5.1. Group level
A time lagged approach to analysis was utilised whereby predictors were measured at time 1,
and their impact on group ESR behaviours, as rated by their leaders, at time 2 (week 4) and 3
(week 7) was analysed. Descriptive statistics are provided in Table 7.04
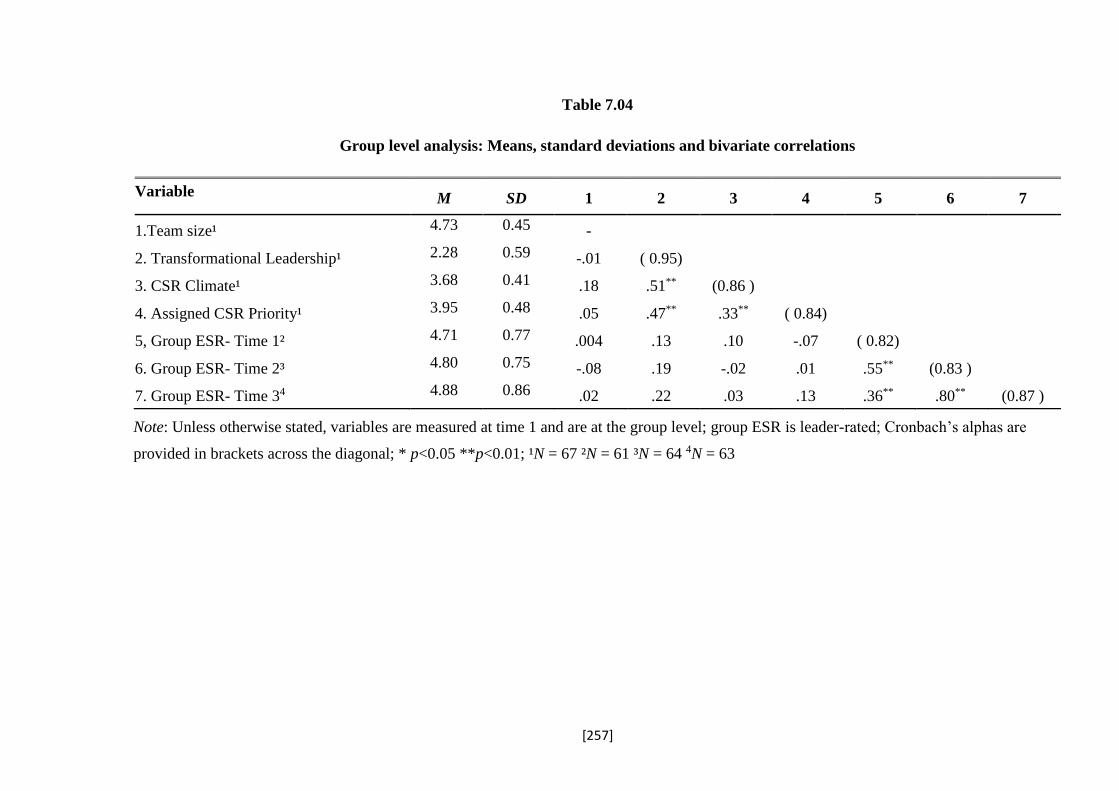
[257]
Table 7.04
Group level analysis: Means, standard deviations and bivariate correlations
Variable M SD 1 2 3 4 5 6 7
1.Team size¹ 4.73 0.45 -
2. Transformational Leadership¹ 2.28 0.59 -.01 ( 0.95)
3. CSR Climate¹ 3.68 0.41 .18 .51** (0.86 )
4. Assigned CSR Priority¹ 3.95 0.48 .05 .47** .33** ( 0.84)
5, Group ESR- Time 1² 4.71 0.77 .004 .13 .10 -.07 ( 0.82)
6. Group ESR- Time 2³ 4.80 0.75 -.08 .19 -.02 .01 .55** (0.83 )
7. Group ESR- Time 34 4.88 0.86 .02 .22 .03 .13 .36** .80** (0.87 )
Note: Unless otherwise stated, variables are measured at time 1 and are at the group level; group ESR is leader-rated; Cronbach’s alphas are
provided in brackets across the diagonal; * p<0.05 **p<0.01; ¹N = 67 ²N = 61 ³N = 64 4N = 63

[258]
Hypothesis 1a predicted a positive moderating effect of time 1 assigned CSR priority on the
effects of time 1 TF on time 2 and 3 group ESR behaviours, such that under conditions of
high assigned CSR priority, TF would have stronger effects on group ESR. As is evident
from Table 7.05, this hypothesis was not significant, both on time 2 group ESR (γ = 0.05, SE
= 0.44, ns) and time 3 group ESR (γ = 0.29, SE = 0.51, ns).
Hypothesis 2a predicted a positive moderating effect of time 1 CSR climate on the
relationship between time 1 TF and time 2 and 3 group ESR. More specifically, it was
expected that the positive effects of TF on group ESR would be enhanced under conditions of
a positive climate for CSR. This finding was marginally significant for both time 2 group
ESR (γ = 0.55, SE = 0.31, p<0.10; ΔR² = 0.05), and time 3 group ESR (γ = 0.68, SE = 0.35,
p<0.10; ΔR² = 0.06).
Simple slope analysis revealed that at time 2, the moderating effect of CSR climate was
significant at high levels of CSR climate (simple slope = 0.75, t = 3.00, p<0.01). As evident
from Figure 7.02, under conditions of high CSR climate, TF was positively related to time 2
group ESR; partially supporting this hypothesis.
Figure 7.02
Moderating effect of CSR climate on group ESR at time 2

[259]
At time 3, simple slope analysis revealed that CSR climate had a significant moderating
effect, likewise at high levels of CSR climate (simple slope = 0.84, t = 2.91, p<0.01). As
shown in Figure 7.03, under conditions of a high CSR climate, TF was positively related to
time 3 group ESR; partially supporting this hypothesis.
Figure 7.03
Moderating effect of CSR climate on group ESR at time 3
Finally Hypothesis 3a predicted a moderating effect of time 1 CSR climate on the interactive
effect of time 1 TF and time 1 assigned CSR priority on time 2 and 3 group ESR. That is,
when assigned CSR priority is high and CSR climate is positive, the effects of TF on group
ESR behaviours were expected to be stronger. The results were significant for time 2 group
ESR (γ = 1.93, SE = 0.81, p<0.05; ΔR² = 0.08), but not for time 3 group ESR (γ = 0.89, SE =
0.98, ns).
As illustrated in the Table 7.06 simple slope analysis for time 2 revealed that assigned CSR
priority and CSR climate only had a positive moderating effect at high levels of assigned
CSR priority and high levels of CSR climate (simple slope = 1.05, t = 2.64, p<0.05). Figure

[260]
7.04 illustrates that TF was positively related to time 2 group ESR, when both assigned CSR
priority and CSR climate were high, thus partially supporting this hypothesis.
Figure 7.04
Three-way interaction effect on group ESR at time 2

[261]
Table 7.05
Group level hypotheses testing with leader-ratings of ESR
Group level: Leader-rated ESR
Predictor Time 1 on Time 2¹ Time 1 on Time 3²
Estimate SE Estimate SE
Hypothesis 1a
TF time 1 -0.12 0.19 -0.15 0.22
CSR time 1 -0.19 0.20 -0.07 0.23
Team size -0.08 0.22 0.09 0.26
TF 0.34† 0.19 0.34 0.22
ACSR -0.13 0.23 0.05 0.27
TF*ACSR 0.05 0.44 0.29 0.51
Hypothesis 2a
TF time 1 -0.19 0.19 -0.20 0.23
CSR time 1 -0.29 0.19 -0.14 0.22
Team size 0.06 0.22 0.24 0.25
TF 0.53* 0.20 0.56* 0.23
CCSR -0.47 0.29 -0.38 0.33
TF*CCSR 0.55† 0.31 0.68† 0.35
Hypothesis 3a
TF time 1 -0.12 0.19 -0.14 0.23
CSR time 1 -0.33† 0.19 -0.19 0.23
Team size 0.19 0.22 0.31 0.27
TF 0.40† 0.22 0.45† 0.26
CCSR -0.79† 0.44 -0.37 0.53
ACSR -0.22 0.22 0.004 0.27
TF*CCSR 1.16* 0.52 1.28* 0.62
TF*ACSR -0.41 0.55 -0.13 0.67
ACSR*CCSR -0.53 0.72 -0.94 0.87
TF*ACSR*CCSR 1.93* 0.81 0.89 0.98
Note: TF = transformational leadership; ACSR = assigned CSR Priority; CCSR = CSR
Climate; TF time 1 and CSR time 1 = intervention controls; ¹N = 64 ²N = 63; *p<0.05
**p<0.01 †p<0.10

[262]
Table 7.06
Simple slope analysis for the three-way interaction – Time 2 group ESR
Simple slope analysis: TF x ACSR x CCSRGroup ESR time 2
Assigned CSR
Priority CSR Climate Effect t P
-1SD -1SD .50 1.50 ns
-1SD +1SD .69 1.58 ns
+1SD -1SD -.64 -1.21 ns
+1SD +1SD 1.05 2.64 <.05
Note: Simple slope analysis at low (-1SD) and high (+1SD) levels of assigned CSR priority
and CSR climate; SD = standard deviation, TF = transformational leadership, ACSR =
assigned CSR priority, CCSR = CSR climate
7.5.1.1.Controlling for time 1 ESR
The next step was to additionally control for time 1 ESR, in order to assess if these results
remained significant. This would consequently suggest that the predictors resulted in a
positive change in group ESR.
Hypothesis 4a proposed that time 1 assigned CSR priority would positively moderate the
relationship between TF at time 1, and time 2 and 3 group ESR, even after having controlled
for time 1 group ESR. As can be seen in Table 7.07, the moderating effect of assigned CSR
priority was not significant for either time 2 group ESR (γ = 0.22, SE = 0.40, ns), nor time 3
group ESR (γ = 0.51, SE = 0.52, ns).
Hypothesis 5a put forward the positive moderating effect of time 1 CSR climate between
time 1 TF and time 2 and 3 group ESR, after having controlled for time 1 group ESR. The
moderating effect of CSR climate was neither significant for time 2 group ESR (γ = 0.30, SE
= 0.27, ns) nor for time 3 group ESR (γ = 0.55, SE = 0.35, ns).
Finally Hypothesis 6a predicted the positive combined moderating effect of time 1 assigned
CSR priority and time 1 CSR climate between TF at time 1, and time 2 and 3 group ESR,
after having controlled for time 1 group ESR. The moderating role of CSR climate on the
interactive effect of TF and assigned CSR priority was significant for time 2 group ESR
behaviours (γ = 1.57, SE = 0.76, p<0.05; ΔR² = 0.05). This moderation however was not
significant for time 3 group ESR behaviours (γ = 0.73, SE = 1.02, ns).

[263]
As can be seen in Table 7.08 of the simple slope analysis results, at time 2, the combined
moderating effect of assigned CSR priority was only significant when both were at high
levels (simple slope = 1.03, t = 2.96, p<0.01). Plotting the simple slopes (Figure 7.05)
demonstrated that TF was positively related to group ESR at time 2, when both assigned CSR
priority and CSR climate were high. This consequently provides partial support for this
hypothesis.
Figure 7.05
Three-way interaction effect on group ESR at time 2 (time 1 ESR controlled)

[264]
Table 7.07
Group level hypotheses testing: Leader-rated ESR (time 1 ESR controlled)
Group level: Leader-rated ESR (Time 1 ESR controlled)
Predictor Time 1 on Time 2¹ Time 1 on Time 3¹
Estimate SE Estimate SE
Hypothesis 4a
Group ESR Time 1 0.52** 0.12 0.40* 0.15
TF time 1 -0.08 0.18 -0.05 0.23
CSR time 1 -0.03 0.18 -0.005 0.23
Team size -0.06 0.20 0.14 0.26
TF 0.20 0.17 0.25 0.22
ACSR 0.003 0.21 0.07 0.28
TF*ACSR 0.22 0.40 0.51 0.52
Hypothesis 5a
Group ESR Time 1 0.48** 0.11 0.32* 0.15
TF time 1 -0.19 0.18 -0.13 0.23
CSR time 1 -0.10 0.18 -0.07 0.23
Team size 0.04 0.20 0.24 0.26
TF 0.44* 0.18 0.48* 0.24
CCSR -0.51† 0.26 -0.36 0.34
TF*CCSR 0.30 0.27 0.55 0.35
Hypothesis 6a
Group ESR Time 1 0.46** 0.12 0.33† 0.16
TF time 1 -0.18 0.18 -0.14 0.24
CSR time 1 -0.19 0.18 -0.14 0.24
Team size 0.11 0.20 0.27 0.27
TF 0.34† 0.19 0.40 0.26
CCSR -0.87* 0.40 -0.42 0.55
ACSR 0.06 0.21 0.15 0.29
TF*CCSR 0.72 0.49 0.99 0.66
TF*ACSR 0.19 0.51 0.29 0.70
ACSR*CCSR -0.93 0.69 -1.17 0.93
TF*ACSR*CCSR 1.57* 0.76 0.73 1.02
Note: TF = transformational leadership; ACSR = assigned CSR Priority; CCSR = CSR
Climate; ¹N = 60 ²N = 59; *p<0.05 **p<0.01 †p<0.10

[265]
Table 7.08
Simple slope analysis for the three-way interaction – Time 2 group ESR
(Time 1 group ESR controlled)
Simple slope analysis: TF x ACSR x CCSRGroup ESR time 2
(Time 1 Group ESR controlled)
Assigned CSR Priority CSR Climate Effect t P
-1SD -1SD 0.26 0.85 ns
-1SD +1SD 0.24 0.57 ns
+1SD -1SD -0.16 -0.33 ns
+1SD +1SD 1.03 2.96 <0.01
Note: Simple slope analysis at low (-1SD) and high (+1SD) levels of assigned CSR priority
and CSR climate; SD = standard deviation, TF = transformational leadership, ACSR =
assigned CSR priority, CCSR = CSR climate
7.5.2. Individual level
As with the group level analysis, the hypotheses at the individual level were tested on
individual ESR behaviours, measured at both time 2 and 3. The descriptive statistics are
provided in Table 7.09

[266]
Table 7.09
Individual level analysis: Means, standard deviations, and bivariate correlations
Variable M SD 1 2 3 4 5 6 7 8 9 10
1.Team size 4.79 .41 -
2.Transformational Leadership¹ 2.28 .84 -.02 ( .95)
3.Group CSR climate¹ 3.69 .36 .13 .33** ( .86)
4.Assigned CSR Priority¹ 3.96 .80 .01 .23** .18** ( .84)
5.Leader-rated ESR: Time 1² 4.68 .74 .05 .20** .20** .03 (.82 )
6.Leader-rated ESR: Time 2³ 4.78 .76 -.05 .21** .04 .01 .55** ( .83)
7.Leader-rated ESR: Time 34 4.89 .88 -.02 .20** .06 .06 .37** .77** (.87 )
8.Peer-rated ESR: Time 15 4.79 .75 -.09 .09 .33** .15* .24** .19** .16* (.89 )
9.Peer-rated ESR: Time 25 4.95 .72 -.15* .09 .16* .18** .13 .16* .17* .60** (.90 )
10.Peer-rated ESR: Time 36 5.03 .69 -.08 .14* .38** .16* .23** .35** .28** .64** .67** ( .92)
Note: Unless otherwise stated, variables are measured at time 1 and are at the individual level; Cronbach’s alphas are provided in brackets across
the diagonal; ¹N = 232 ²N = 203 ³N = 215 4N = 210 5N = 219 6N = 218; *p<0.05 **p<0.01

[267]
7.5.2.1.Leader-rated ESR as outcome
Hypothesis 1b predicted the positive moderating effect of assigned CSR priority, such that
under conditions of high assigned CSR priority, the effects of TF on individual ESR
behaviours, as rated by the leader, would be enhanced. As is evident from Table 7.10, this
hypothesis was not significant either for time 2 ESR behaviours (γ = -0.02, SE = 0.03, ns),
nor for time 3 ESR behaviours (γ = -0.01, SE = 0.03, ns).
Hypothesis 2b likewise argued for the moderating role of CSR climate, so that under
conditions of a positive climate for CSR, the effects of TF on individual ESR behaviours, as
rated by the leader, would be greater. Again, this hypothesis received no support for time 2
ESR behaviours (γ = 0.02, SE = 0.04, ns), nor for time 3 ESR behaviours (γ = -0.03, SE =
0.06, ns).
Finally, the moderating effect of CSR climate on the interactive effect between TF and
assigned CSR priority was tested in Hypothesis 3b. It was hypothesised that when both
assigned CSR priority was high, and CSR climate positive, the conditions for the effect of TF
on individual ESR behaviours would be optimised. This relationship received no support
either for time 2 individual ESR behaviours (γ = -0.01, SE = 0.03, ns), or time 3 individual
ESR behaviours (γ = 0.03, SE = 0.04, ns).

[268]
Table 7.10:
Cross level hypotheses testing with leader ratings of ESR
Cross-level: Leader-rated ESR
Predictor Time 1 on Time 2¹ Time 1 on Time 3²
Estimate SE Estimate SE
Hypothesis 1b
TF time 1 0.04 0.19 0.13 0.21
CSR time 1 0.16 0.18 0.03 0.21
Team size -0.14 0.21 -0.05 0.24
TF 0.04 0.04 0.05 0.06
ACSR 0.01 0.02 -0.004 0.03
TF*ACSR -0.02 0.03 -0.01 0.03
Hypothesis 2b
TF time 1 0.06 0.19 0.15 0.22
CSR time 1 0.16 0.19 0.04 0.22
Team size -0.12 0.22 -0.06 0.25
TF 0.05 0.04 0.04 0.06
CCSR -0.04 0.09 -0.002 0.10
TF*CCSR 0.02 0.04 -0.03 0.06
Hypothesis 3b
TF time 1 0.06 0.19 0.14 0.22
CSR time 1 0.17 0.19 0.04 0.22
Team size -0.11 0.22 -0.05 0.25
TF 0.05 0.04 0.05 0.06
CCSR -0.04 0.09 -0.01 0.11
ACSR 0.02 0.03 -0.01 0.03
TF*CCSR 0.02 0.04 -0.04 0.06
TF*ACSR -0.03 0.03 -0.01 0.04
ACSR*CCSR 0.03 0.04 0.01 0.04
TF*ACSR*CCSR -0.01 0.03 0.03 0.04
Note: TF = transformational leadership; ACSR = assigned CSR Priority; CCSR = CSR
Climate; TF time 1 and CSR time 1 = intervention controls; ¹N = 215 ²N = 210

[269]
7.5.2.2.Peer 360º ratings of ESR as outcome
Given that none of the findings were significant at the individual level, when leader-rated
ESR behaviours were examined, the hypotheses were once again tested with peer 360º ratings
of ESR behaviours. Using peer-ratings of individual ESR, the positive moderating effect of
assigned CSR priority on the effects of TF on individual ESR behaviours, as stipulated in
Hypothesis 1b, was not significant, as evident in Table 7.11. This was the case for both time
2 ESR behaviours (γ = 0.04, SE = 0.04, ns), and time 3 ESR behaviours (γ = 0.02, SE = 0.04,
ns).
In Hypothesis 2b, it was predicted that a positive CSR climate would enhance the relationship
between TF and individual ESR behaviours, and this was significant both at time 2 (γ = 0.11,
SE = 0.04, p<0.01; ΔR² = 0.05) and time 3 (γ = 0.10, SE = 0.04, p<0.01; ΔR² = 0.07). At time
2, simple slope analysis revealed that the moderation was significant at low levels of CSR
climate (simple slope = -0.23, z = -3.73, p<0.01) but not at high levels of CSR climate
(simple slope = -0.01, z = -0.15, ns). Figure 7.06 demonstrates that under conditions of a low
CSR climate, TF was negatively related to individual ESR behaviours.
Figure 7.06
Moderating effect of CSR climate on time 2 individual ESR

[270]
At time 3, similarly the moderation was significant at low levels of CSR climate (simple
slope = -0.21, z = -3.41, p<0.01), but not at high levels of CSR climate (simple slope = -0.01,
z = -0.15, ns). Figure 7.07 demonstrated that under conditions of a low CSR climate, TF was
negatively related to individual ESR behaviours. This therefore provides partial support for
this hypothesis.
Figure 7.07
Moderating effect of CSR climate on time 3 individual ESR
Finally Hypothesis 3b was tested. This hypothesis outlined the moderating role of CSR
climate on the interactive effect between TF and assigned CSR priority. It was predicted that
under conditions of a high assigned CSR priority, and a positive climate for CSR, TF would
lead to greater individual ESR behaviours. This hypothesis was significant for time 2
individual ESR behaviours (γ = -0.10, SE = 0.04, p<0.05; ΔR² = 0.06). However this
hypothesis was not significant for time 3 individual ESR behaviours (γ = -0.03, SE = 0.04,
ns).
Simple slope analysis for time 2 individual ESR behaviours, as displayed in Table 7.12,
showed that the interactive moderating effect of assigned CSR priority and CSR climate was
significant when both assigned CSR priority and CSR climate were at low levels (simple
slope = -0.38, z = -4.25, p<0.01), and when assigned CSR priority was high and CSR climate
was low (simple slope = -0.16, z = -2.07, p<0.05). The simple slope plot (Figure 7.08)

[271]
revealed that under conditions of a high CSR climate and low assigned CSR priority, TF was
positively related to time 2 individual ESR behaviours, whereas when both assigned CSR
priority and CSR climate were low, TF was negatively related to individual ESR behaviours.
This provides partial support for this hypothesis.
Figure 7.08
Three-way interaction effect on time 2 individual ESR
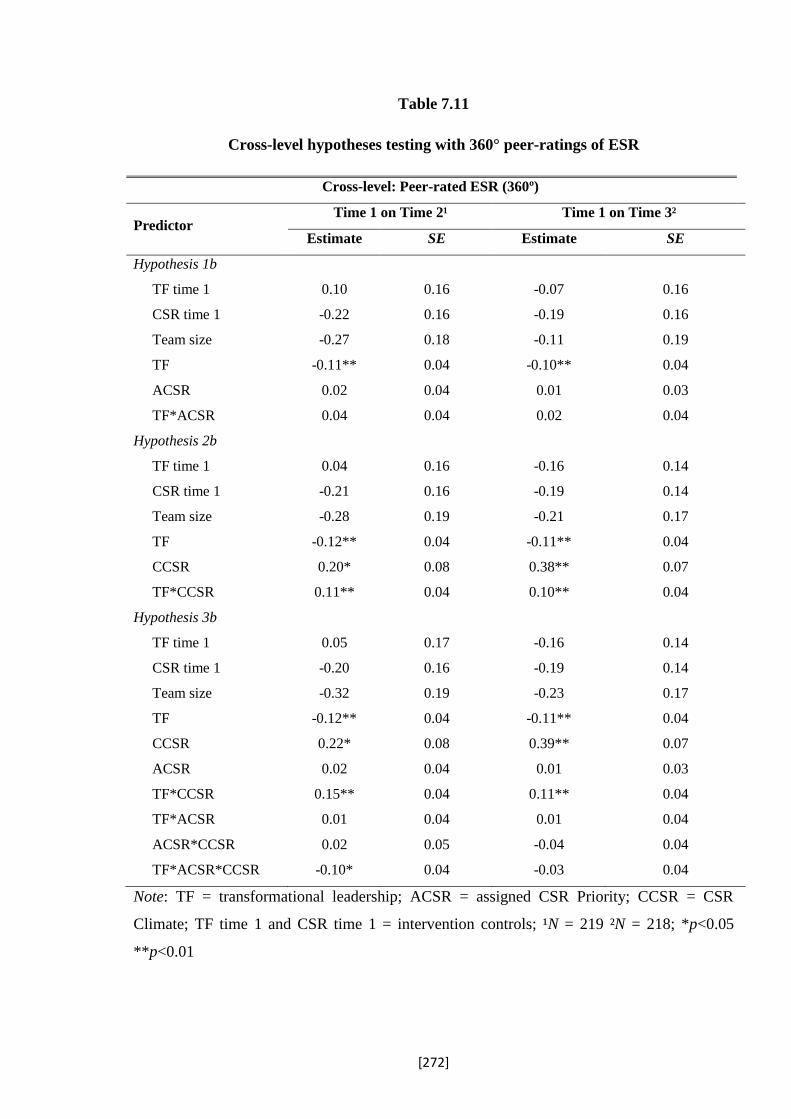
[272]
Table 7.11
Cross-level hypotheses testing with 360° peer-ratings of ESR
Cross-level: Peer-rated ESR (360º)
Predictor Time 1 on Time 2¹ Time 1 on Time 3²
Estimate SE Estimate SE
Hypothesis 1b
TF time 1 0.10 0.16 -0.07 0.16
CSR time 1 -0.22 0.16 -0.19 0.16
Team size -0.27 0.18 -0.11 0.19
TF -0.11** 0.04 -0.10** 0.04
ACSR 0.02 0.04 0.01 0.03
TF*ACSR 0.04 0.04 0.02 0.04
Hypothesis 2b
TF time 1 0.04 0.16 -0.16 0.14
CSR time 1 -0.21 0.16 -0.19 0.14
Team size -0.28 0.19 -0.21 0.17
TF -0.12** 0.04 -0.11** 0.04
CCSR 0.20* 0.08 0.38** 0.07
TF*CCSR 0.11** 0.04 0.10** 0.04
Hypothesis 3b
TF time 1 0.05 0.17 -0.16 0.14
CSR time 1 -0.20 0.16 -0.19 0.14
Team size -0.32 0.19 -0.23 0.17
TF -0.12** 0.04 -0.11** 0.04
CCSR 0.22* 0.08 0.39** 0.07
ACSR 0.02 0.04 0.01 0.03
TF*CCSR 0.15** 0.04 0.11** 0.04
TF*ACSR 0.01 0.04 0.01 0.04
ACSR*CCSR 0.02 0.05 -0.04 0.04
TF*ACSR*CCSR -0.10* 0.04 -0.03 0.04
Note: TF = transformational leadership; ACSR = assigned CSR Priority; CCSR = CSR
Climate; TF time 1 and CSR time 1 = intervention controls; ¹N = 219 ²N = 218; *p<0.05
**p<0.01

[273]
Table 7.12
Simple slope analysis for the three-way interaction – Time 2 individual ESR
(Peer-rated)
Simple slope analysis: TF x ACSR x CCSRIndividual ESR time 2 (peer-rated)
Assigned CSR
Priority CSR Climate Simple slope z P
-1SD -1SD -0.38 -4.25 <.01
-1SD +1SD 0.12 1.13 ns
+1SD -1SD -0.16 -2.07 <.05
+1SD +1SD -0.06 -0.73 ns
Note: Simple slope analysis at low (-1SD) and high (+1SD) levels of assigned CSR priority
and CSR climate; SD = standard deviation, TF = transformational leadership, ACSR =
assigned CSR priority, CCSR = CSR climate
7.5.2.3.Controlling for time 1 ESR
As with the group level analysis, hypotheses were also tested at the individual level, after
having controlled for time 1 ESR. This was done in order to test if individual ESR behaviours
at time 2 and time 3 persisted beyond those measured at time 1. The hypotheses were
analysed with both leader-rated and peer-rated ESR.
Firstly, the hypotheses were tested with leader-ratings of ESR. As apparent in Table 7.13,
the moderating role of assigned CSR priority between TF and individual ESR, as posited in
Hypothesis 4b received no support. This was the case at both time 2 (γ = -0.03, SE = 0.02,
ns), and time 3 (γ = -0.01, SE = 0.03, ns).
Hypothesis 5b predicted a positive moderating effect of a positive CSR climate on the
relationship between TF and individual ESR behaviours. Again this hypothesis received no
support, both at time 2 (γ = 0.02, SE = 0.03, ns), and time 3 (γ = -0.05, SE = 0.05, ns).
Finally Hypothesis 6b was tested. Here the moderating role of CSR climate on the interactive
effect between TF and assigned CSR priority was put forward, such that under conditions of a
positive climate for CSR and a high assigned CSR priority, the effects of TF on individual
ESR would be greater. Again this received no support either at time 2 (γ = -0.002, SE = 0.03,
ns) and time 3 (γ = 0.03, SE = 0.03, ns).
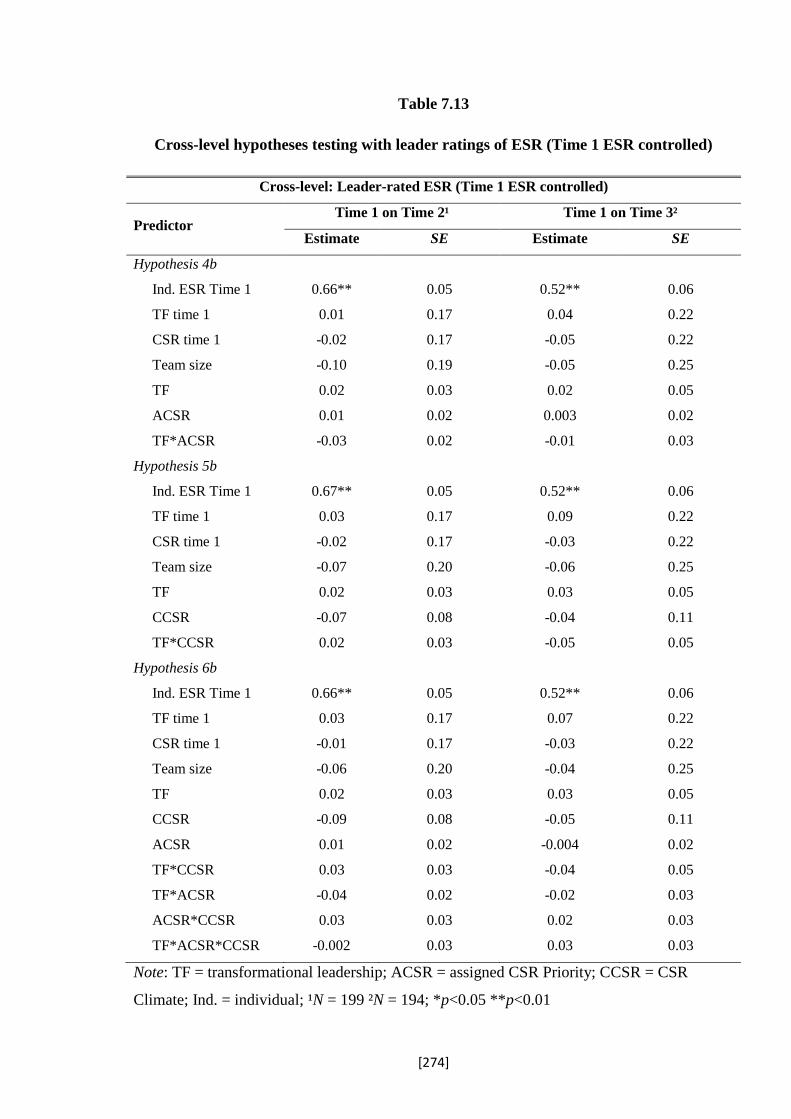
[274]
Table 7.13
Cross-level hypotheses testing with leader ratings of ESR (Time 1 ESR controlled)
Cross-level: Leader-rated ESR (Time 1 ESR controlled)
Predictor Time 1 on Time 2¹ Time 1 on Time 3²
Estimate SE Estimate SE
Hypothesis 4b
Ind. ESR Time 1 0.66** 0.05 0.52** 0.06
TF time 1 0.01 0.17 0.04 0.22
CSR time 1 -0.02 0.17 -0.05 0.22
Team size -0.10 0.19 -0.05 0.25
TF 0.02 0.03 0.02 0.05
ACSR 0.01 0.02 0.003 0.02
TF*ACSR -0.03 0.02 -0.01 0.03
Hypothesis 5b
Ind. ESR Time 1 0.67** 0.05 0.52** 0.06
TF time 1 0.03 0.17 0.09 0.22
CSR time 1 -0.02 0.17 -0.03 0.22
Team size -0.07 0.20 -0.06 0.25
TF 0.02 0.03 0.03 0.05
CCSR -0.07 0.08 -0.04 0.11
TF*CCSR 0.02 0.03 -0.05 0.05
Hypothesis 6b
Ind. ESR Time 1 0.66** 0.05 0.52** 0.06
TF time 1 0.03 0.17 0.07 0.22
CSR time 1 -0.01 0.17 -0.03 0.22
Team size -0.06 0.20 -0.04 0.25
TF 0.02 0.03 0.03 0.05
CCSR -0.09 0.08 -0.05 0.11
ACSR 0.01 0.02 -0.004 0.02
TF*CCSR 0.03 0.03 -0.04 0.05
TF*ACSR -0.04 0.02 -0.02 0.03
ACSR*CCSR 0.03 0.03 0.02 0.03
TF*ACSR*CCSR -0.002 0.03 0.03 0.03
Note: TF = transformational leadership; ACSR = assigned CSR Priority; CCSR = CSR
Climate; Ind. = individual; ¹N = 199 ²N = 194; *p<0.05 **p<0.01

[275]
Given that none of the findings were significant for when leader-ratings of ESR were used,
the hypotheses were once again tested, having controlled for time 1 ESR, but with peer 360º
ratings of ESR. Hypothesis 4b proposed a positive moderating effect of assigned CSR
priority between TF and individual ESR behaviours. As can be seen from Table 7.14, this
hypothesis received no support, either at time 2 (γ = 0.01, SE = 0.04, ns) or at time 3 (γ = -
0.004, SE = 0.03, ns).
In Hypothesis 5b, the moderating effect of a CSR climate between TF and individual ESR
behaviours were proposed. It was expected that when the CSR climate was positive, the
effects of TF on individual ESR behaviours would be enhanced. This hypothesis received no
support at time 2 (γ = 0.04, SE = 0.04, ns) and time 3 (γ = 0.04, SE = 0.03, ns).
Finally, Hypothesis 6b speculated upon the moderating effect of CSR climate on the
interactive effect of TF and assigned CSR priority on individual ESR behaviours. It was
hypothesised that under conditions of a positive CSR climate and a high assigned CR
priority, the effects of TF on individual ESR behaviours would be greater. This hypothesis
was marginally significant at time 2 (γ = -0.07, SE = 0.04, p<0.10, ΔR² = 0.07). There was no
support however for this hypothesis for individual ESR behaviours measured at time 3 (γ = -
0.01, SE = 0.03, ns).
At time 2, simple slope analysis (see Table 7.15) revealed that the interactive moderating
effect of assigned CSR priority and CSR climate was marginally significant only when both
assigned CSR priority and CSR climate were at low levels (simple slope = -0.16, z =-1.77,
p<0.10). Figure 7.09 illustrates that the relationship between TF and individual ESR
behaviours at time 2 was positive under conditions of high CSR climate and low assigned
CSR priority, and was negative when both assigned CSR priority and CSR climate were low,
providing partial support for this hypothesis.

[276]
Table 7.14
Cross-level hypotheses testing with peer 360° ratings of ESR (time 1 ESR controlled)
Cross-level: 360° peer-rated ESR (Time 1 ESR controlled)
Predictor Time 1 on Time 2¹ Time 1 on Time 3²
Estimate SE Estimate SE
Hypothesis 4b
Ind. ESR Time 1 0.52** 0.06 0.54** 0.05
TF time 1 0.09 0.12 -0.06 0.12
CSR time 1 -0.15 0.12 -0.12 0.12
Team size -0.19 0.14 -0.06 0.14
TF -0.05 0.04 -0.03 0.03
ACSR -0.003 0.03 -0.01 0.03
TF*ACSR 0.01 0.04 -0.004 0.03
Hypothesis 5b
Ind. ESR Time 1 0.51** 0.06 0.49** 0.05
TF time 1 0.08 0.12 -0.11 0.11
CSR time 1 -0.14 0.12 -0.13 0.11
Team size -0.17 0.15 -0.13 0.13
TF -0.05 0.04 -0.05 0.03
CCSR 0.01 0.06 0.20** 0.06
TF*CCSR 0.04 0.04 0.04 0.03
Hypothesis 6b
Ind. ESR Time 1 0.51** 0.06 0.49** 0.05
TF time 1 0.09 0.13 -0.11 0.11
CSR time 1 -0.14 0.13 -0.13 0.11
Team size -0.19 0.15 -0.13 0.13
TF -0.04 0.04 -0.05 0.03
CCSR 0.01 0.07 0.20** 0.06
ACSR 0.005 0.03 -0.01 0.03
TF*CCSR 0.07† 0.04 0.04 0.03
TF*ACSR -0.02 0.04 -0.01 0.03
ACSR*CCSR 0.06 0.04 0.01 0.04
TF*ACSR*CCSR -0.07† 0.04 -0.01 0.03
Note: TF = transformational leadership; ACSR = assigned CSR Priority; CCSR = CSR
Climate; Ind. = individual; ¹N = 216 ²N = 215; *p<0.05 **p<0.01 †p<0.10

[277]
Table 7.15
Simple slope analysis for the three-way interaction – Time 2 individual ESR
(Peer-rated: Time 1 ESR controlled)
Simple slope analysis: TF x ACSR x CCSRIndividual ESR time 2 (peer-rated)
Controlling for time 1 ESR
Assigned CSR
Priority CSR Climate Simple slope Z p
-1SD -1SD -0.16 -1.77 <.10
-1SD +1SD 0.12 1.17 ns
+1SD -1SD -0.06 -0.74 ns
+1SD +1SD -0.06 -0.74 ns
Note: Simple slope analysis at low (-1SD) and high (+1SD) levels of assigned CSR priority
and CSR climate; SD = standard deviation, TF = transformational leadership, ACSR =
assigned CSR priority, CCSR = CSR climate
Figure 7.09
Three-way interaction effect on time 2 individual ESR
(Time 1 individual ESR controlled)

[278]
7.6.Discussion
In the field study (chapter six), where a preliminary test of the conceptual model was
conducted, results revealed a marginally significant finding for the three-way interaction
between TF, organisational CSR climate and assigned CSR priority on group ESR. At the
individual level, an interaction between TF and assigned CSR priority on individual ESR was
found to be significant. No other relationships, barring these two, were significant. Given the
limitations of the field study, predominantly its cross-sectional nature and restricted sample
size, the present time-lagged study was conducted. Its objectives were to provide a replication
for the findings of the field study, as well as extending these findings to provide some more
definitive results in a larger and more culturally diverse sample. In addition, this study
wanted to provide a test for the directionality of the findings by measuring the effects of
predictors at time 1 on time 2 and 3 ESR, both at the group and individual levels. Finally, the
hypotheses were also tested by controlling for time 1 ESR in order to deduce if the predictors
caused positive changes in ESR behaviours over time.
7.6.1. Summary of findings
At the group level, with leader-ratings of social responsibility behaviours as the outcome,
findings revealed that CSR climate had a marginally significant moderating effect at the
group level at time 2 and 3; however this effect did not remain significant when time 1 ESR
was controlled for. The three-way interaction between TF, assigned CSR priority, and group
CSR climate was significant at time 2, and remained significant when time 1 ESR was
controlled for. No effects were found for the moderating role of group assigned CSR priority
at the group level, and the three-way interaction at time 3.
At the individual level, a similar pattern of results was uncovered, for 360° peer-ratings of
social responsibility behaviours. More specifically, the moderating role of group CSR climate
was found to be significant both at time 2 and 3; however this was no longer significant when
time 1 ESR was controlled for. The three-way interaction between TF, assigned CSR priority,
and group CSR climate on individual ESR was significant at time 2, and was marginally
significant after controlling for time 1 ESR. There were no effects for the moderating role of
assigned CSR priority. In addition, no evidence was found for the effects of the three-way
interaction at time 3.

[279]
7.6.2. Theoretical contributions
Given the relatively comparable findings at both the group and individual level, their
theoretical contributions will be collectively discussed. The results point towards a number of
theoretical contributions. First and foremost, they relate to the conclusions we can derive
about directionality of findings due to the time-lagged nature of the study. Because predictors
were measured at time 1 and social responsibility behaviours at time 2 and 3, we can more
confidently assert that the predictors exert longitudinal effects on social responsibility
behaviours. This is an important conclusion, as in many cases, attempts are not made to
address the causal direction of findings, and thus do not preclude reverse causality (e.g.
Martin, Guillaume, Thomas, and Epitropaki, 2015). Given the infancy of micro-CSR,
especially ESR, this study in conjunction with the field study not only provide a preliminary
insight into some of the contextual determinants of employee engagement with CSR, but also
indicates the possible direction of the effects of TF, assigned CSR priority, and CSR climate.
Indeed, Kelly and McGrath (1988) concluded that “the duration of the interval between cause
and effect is left unspecified in our theoretical formulations and in our interpretation of
concrete findings” (pg. 19). Given that this statement was made over two decades ago, it is
disheartening to admit that this issue is still perpetuated in management research (Mitchell
and James, 2001; Roe, Gockel, and Meyer, 2012). Mitchell and James (2001) argued that
much of the research conducted focuses on the causal relationships between X and Y, yet a
very limited amount of research subsists, which makes an active attempt to explore the
timings of such relationships. They make the case, that in order to ensure the tenability of
management research, the ‘when’ in theories and methods, needs to be placed under greater
scrutiny. Whilst this study cannot for certain specify the timings of X (predictors) and Y
(ESR); by providing more than one measurement of Y, as advised by Mitchell and James
(2001), it makes an effort to determine when Y might possibly occur, and as a result helps to
reduce ambiguity pertaining to timings. Hence, it affords an exploratory insight into such
timings, with results indicating that the effects of the predictors may only exert short-term
effects on ESR, due to the lack of findings at time 3. As a result, this explicit focus on the
timing of the constructs of interest provides “…a significant advance in the study of temporal
concerns in the organisational literature” (Okhuysen, 1999; pg. 23).
The findings of the current study further underpin the longitudinal effects of TF on
subsequent work outcomes. The effects of TF on employee well being measured months,
even years later, have been evidenced (Munir and Nielsen, 2009; Tafvelin et al., 2011).

[280]
Furthermore, the longitudinal effects of TF on objective performance outcomes, as well as
employee behaviours such as OCBs have also been noted (Barling et al., 1996). The current
findings corroborate these, as well as extend them by demonstrating the utility of TF in
relation to ESR, also measured longitudinally.
The consistent findings of the moderating role of CSR climate at the group and individual
levels, point towards the longitudinal effects of a CSR-specific climate on ESR. Such a
finding substantiates the previous limited evidence of the longitudinal effects of climate in
general. For example, Neal and Griffin (2006) evidenced the longitudinal effects of a safety
climate on subsequent safety participation, whilst Liao and Chuang (2007) noted the
moderating longitudinal effects of a service climate on subsequent employee service
performance. Given that the research series presented in the current thesis provides the first
test for the effects of a CSR climate on ESR, it goes even further and demonstrates that this
CSR-specific climate is causally related to ESR at both the group and individual levels.
There was however no significant findings for the moderating role of assigned CSR priority
on the relationship between TF, and group and individual social responsibility behaviours.
Since this thesis provides a novel insight into the construct of assigned CSR priority, these
null findings cannot be compared and contrasted in order to appreciate why this may have
been the case. However, it was modelled on the construct of assigned safety priority as
proposed by Zohar (2002a), who was able to evidence the longitudinal effects of assigned
safety priority. Given the parallel nature of the construct, this finding is counterintuitive to
what would be expected. Not only this, but given that in the field study, the individual
moderating effect of assigned CSR priority was significant at the individual level, it is
surprising that similar findings were not revealed in the current study.
One difference between the present study and the field study is the way in which CSR climate
was conceptualised. In the field study it was conceptualised as an organisational CSR
climate, whereas in the current study it was framed as a group CSR climate; thus possessing
differential referents. It may be that given the proximity of the latter, this may have provided
more robust effects, compared to the leader’s assigned CSR priority. Indeed, Kerr and
Jermier (1978), in their substitutes of leadership theory, provide various examples of
instances in which leadership may become substituted for by individual, task and
organisational characteristics. For instance they acknowledge how spatial distance between
leader and subordinates may neutralise leader effects. When such a rationale is applied to the

[281]
current study, and specifically to CSR climate, it may well therefore be the case that because
the CSR climate was at the group level, there was less spatial distance between the
subordinates and the climate, and so it may have exerted stronger effects on individual and
group ESR, thus making assigned CSR priority redundant. Whereas in the field study, the
climate was conceptualised at the organisational level, and so there was greater spatial
distance between this CSR climate, and employees at the individual level, thus assigned CSR
priority was not neutralised and/or substituted, as per Kerr and Jermier’s (1978) theory.
Furthermore, it can be argued that the CSR climate reflected the group characteristics of an
individual’s respective group, and this characteristic substituted for the leadership
characteristic of assigned CSR priority. That is, individuals looked to their group for the
importance of CSR, as well as how to conduct themselves in a socially responsible manner;
and this in itself sufficed. Given these findings, there is room to argue that effective (TF)
leadership behaviours do not need a specific focus, in order to engender specific work
outcomes (e.g. Barling et al., 2002; Fu et al., 2010). Rather the presence of effective
leadership behaviours which set behavioural goals for employees and motivate them towards
these goals, along with a positive CSR climate; provides employees with a consistent focus
for their goal-directed efforts.
The three-way interaction effect of TF, assigned CSR priority and CSR climate was further
supported in the current study. This validates the earlier argument made in chapter six, that
the combined effects of TF, assigned CSR priority, and CSR climate provide the strongest
effects on subsequent ESR. They do this by collectively providing a consistent message of
the importance of CSR. That is, effective leadership sets challenging socially responsible
behavioural goals for employees and motivates employees towards those goals, in addition to
supporting goal directed efforts (Locke and Latham, 2002). This in combination with a high
assigned CSR priority manages employee expectations of CSR, and helps avert from
employee role conflict as to which dimension of ESR they should prioritise (Katz and Kahn,
1964). Furthermore, the CSR climate outlines the policies and procedures regarding CSR,
and iterates the saliency, as well as importance of CSR. Collectively, they emphasize that
employees should engage with the full repertoire of socially responsible behaviours, and
consequently employees do not feel they have to prioritise certain behaviours at the expense
of others (Locke et al., 1994). It should be noted that the three-way interaction was only
marginally significant in the field study, nevertheless as noted above, this may have been due
to the differences in conceptualisation of CSR climate, where in the present study it was

[282]
conceptualised at the group level, and in the field study, it was conceptualised at the
organisational level. It is also possible, that because the sample size of the current study was
proportionately larger compared to that of the field study, this provided greater statistical
power in detecting significant relationships.
What is noteworthy in the current study is that the interactive effects of TF and CSR climate,
as well as the three-way interaction, in most cases tended to be short-term. That is, the effects
of these predictors were significant on time 2 ESR at the group and individual levels, but
were rarely so at time 3. The only significant or marginally significant effects at time 3 were
for the moderating role of group CSR climate on the effects of TF on ESR, which no longer
remained significant when time 1 ESR, was controlled for. It may thus be that for long-term
effects of TF on ESR, only CSR climate is necessary. It could also be possible that an
additional factor is in operation through which TF may exert its effects indirectly, which was
not accounted for by the current study. For instance, most of the studies on TF and well-being
conducted longitudinally did not find direct effects but rather indirect effects (e.g. Tafvellin et
al., 2011). Possible underlying mechanisms for the effects of the predictors on subsequent
ESR behaviours, is something that will be explored in the succeeding chapter (general
discussion). On the basis of current findings, we can ascertain that TF, in conjunction with
assigned CSR priority and CSR climate predicts subsequent ESR at time 2; as well as
changes in this ESR at time 2, after having controlled for time 1 ESR.
It is also probable that the timing of measurement of the predictors influenced whether any
relationships were found between the predictors, the interactions between them, and
subsequent ESR. Indeed, Mitchell and James (2001) point to the notable roles of
equilibration, equilibrium, and entropic periods. The former refers to the period in which time
is taken for X to affect Y, which stabilises during the equilibrium period; with effects of X on
Y, wearing off in the entropic period. Measuring the predictors and/or outcomes at incorrect
times (i.e. equilibration and entropic periods), may fail to tap into measuring Y at the
equilibrium period, thus affecting the results obtained. It could be that the measurement
periods in the current study were not effectively honing into ESR at the equilibrium period,
thus reducing the likelihood of detecting significant effects which were in operation. It is
additionally feasible, given the nature of the BG simulation task, that team leaders were more
motivated towards the start of the simulation (i.e. time 1), but became disengaged towards the
later stages, thus leading to a reduced exertion of long-term effects. This is especially
noteworthy, given that there was no assessed group work towards the end of the seven week

[283]
research period. This issue of timing of measurement is of prime importance when studying
causal relationships, and as a result is explored further in the ensuing chapter.
7.6.3. Limitations
First and foremost, the current study was a quasi-longitudinal study. Whilst this helps to
determine directionality, we still cannot confidently assert causal relationships from the
current findings; that is, we cannot affirm that because the predictors were measured prior to
the outcomes of ESR, that they indeed cause ESR. In order to do the latter, the model needs
to be tested within an experimental design. As Mitchell and James (2001) point out, because
we did not manipulate the predictors, we cannot rule out the likely explanation that the
variance in Y, which we attribute to X, may indeed be attributable to an earlier Y.
Furthermore, whilst we can preclude reverse causality, having demonstrated that predictors
measured at time 1 are able to predict subsequent ESR; we cannot conclude that these
predictors caused improvements and changes in ESR. Nevertheless, given the infancy of
micro-CSR research, especially with regards to employee behavioural contributions, this
study is an important step in investigating the directionality of findings, which can provide
future research with the impetus to corroborate as well as establish the causality of such
relationships more definitively.
It appears that as with the field study, sample size was also an issue within the current study.
Whilst in the present study, the sample size was approximately double that of the time-lagged
study, there were still some technical issues when analysing the data. For instance the model
would not converge when testing for the various steps of hierarchical linear modelling, and
thus yielded non-significant slopes. Whilst the analysis continued given theoretical basis to
expect multi-level effects, this is something that needs to be addressed in future research with
much larger sample sizes, especially at level two, in order to replicate and authenticate
current findings (Aguinis et al., 2013).
In addition, when testing the model at the individual level with leader-ratings of ESR, non-
significant results were yielded, and consequently peer-ratings of ESR were used instead.
Since findings have demonstrated medium to high correlations of peer and leader-ratings of
employee work behaviours, it is surprising that the current findings at the individual level
were significant for peer-ratings of ESR but not leader-ratings (see Harris and Shaubroeck,
1988). Nevertheless, it is not uncommon to use peer ratings of employee outcomes (Allen,

[284]
Barnard, Rush, and Russell, 2000). It may be that in this instance, there is a greater likelihood
of peers observing an individual’s social responsibility behaviours as opposed to leaders who
may otherwise not be as present. This may especially be relevant given the multi-dimensional
nature of ESR, which may consequently require individuals to be at different places and at
non-typical work times (e.g. volunteering within the local community). All the same, this is
something that remains to be confirmed by future research, in order to provide some validity
to the current findings.
Finally, common method biases such as socially desirable responding and positive and
negative affectivity cannot be ruled out. Nevertheless, Podsakoff et al. (2003) suggest that by
implementing procedural measures such as measuring predictor and criterion variables from
different sources, temporally separating measurement of predictor and criterion variables, as
well as reassuring participants that there are no right or wrong answers; can greatly minimise
such biases. Given all of these recommendations were implemented in this study, this issue is
not considered too problematic.
7.6.4. Implications for practice
Similarly to the field study, the current findings point to the importance of the combined
influence of TF, assigned CSR priority, and CSR climate, given that such a relationship was
consistently significant; at time two at least. Furthermore, there is room to argue that TF and
CSR climate alone are also sufficient in encouraging ESR. Nevertheless, given the
consistency of the three-way effect in the current study and in the prior field-study,
organisations would do well by focusing on the collective combination of TF, assigned CSR
priority and CSR climate. This combination is also more intuitively appealing.
As a result, organisations would benefit by developing their leaders to demonstrate effective
TF behaviours. Research has evidenced the effectiveness of TF training in leading to a
change in leadership behaviours, as well as subsequent performance outcomes; both at the
employee and organisational levels (Barling et al., 1996; Dvir et al., 2002). In addition to
this, and as an extra measure, leaders should be developed so that they reiterate the
importance of CSR and manage employee expectations of CSR. This can help to reduce any
experience of role conflict in employees, in relation to the various dimensions of ESR.
Indeed, research has evidenced the ability to train TF leaders with a specific focus (e.g.
Morhart et al., 2009). Moreover, organisations should outline CSR relevant policies and

[285]
procedures at the organisational level and make these salient. Whilst the current study
conceptualised CSR climate at the group level, it is possible that just as leadership effects can
trickle down from top-management levels to supervisory levels, organisational climate can
also inform group climate (e.g. Mayer, Kuenzi, Greenbaum, Bardes, and Salvador, 2009).
Finally, given that TF, in conjunction with CSR climate and assigned priority tended to exert
short-term effects, it is important that the above recommendations are consistently
implemented within the organisation. This ensures that the leaders are continuously
reinforcing the importance of CSR, and the organisation is, without fail, communicating
CSR-relevant policies and procedures. The focus on developing TF leaders should not be a
one-off developmental activity, rather this should also remain as a recurrent theme within the
organisation. Ensuring this consistent focus on these relevant factors will help to prevent
stagnation of effects on subsequent ESR.
7.7.Summary
The current study provides an extension to the previous field study, and to some extent,
confirms the robustness of the effects of the three-way way interaction between TF, assigned
CSR priority, and CSR climate on subsequent ESR. Furthermore, there is evidence to suggest
that TF, in addition to a group CSR climate, may be sufficient alone. Given the time-lagged
nature of the current study, findings add some clarity to the direction of relationships, and
suggest that TF, assigned CSR priority, and CSR climate indeed precede employee social
responsibility behaviours. This was the case for time two employee behaviours, and rarely for
employee time three ESR behaviours; as a result, they may only exert a short-term effect. In
the general discussion which ensues, attempts are made to collate the findings of the research
series, and explore the next steps, which future research on ESR can foray into.

[286]
Chapter 8: Discussion
8.1.Introduction
The purpose of this chapter is to broadly reflect upon the research series presented within this
thesis, specifically, the scale development and validation process, the field study, and the
time-lagged study. In doing so, attempts are made to identify the theoretical contributions of
this collection of studies, as well as to address any limitations. Furthermore, implications for
practice are outlined and efforts are made to draw upon possible future research directions,
especially given the infancy of ESR as a topic of research within the organisational behaviour
(OB) domain.
8.2.Overview of findings
Scale development
In the scale development chapter, qualitative interviews were conducted with a number of
employed individuals from different occupational backgrounds as well as industries. These
interviews confirmed the structure of ESR as a multi-dimensional construct consisting of the
five unique dimensions of social, philanthropy, environmental, stakeholder, and economic; as
well as producing a pool of potential scale items. These items were exposed to subject-matter
expert ratings, in order to whittle them down for subsequent validation purposes, whilst
ensuring content validity of resultant items. The scale was then validated in EFA and CFA, in
order to reduce its length as well as to confirm its factor structure; resulting in a robust and
reliable ten item scale, with good psychometric properties. It was established that this scale
was useful in measuring employee social responsibility behaviours both at the individual and
group levels of analysis.
Test of antecedent and boundary conditions
Chapter six and seven, the field and time-lagged study respectively, attempted to provide a
test for the antecedent and boundary conditions of ESR. The findings from both the field
study and the time-lagged study are outlined in Table 8.01. As can be seen from the table,
[287]
there tended to very little support for the moderating role of assigned priority, on the effects
of TF on subsequent group and individual ESR. It only materialised in one instance, in the
field study, at the individual level. The single moderating effect of CSR climate in contrast
tended to receive greater support. The most consistent finding across the studies however was
that of the three-way interaction effect between TF, assigned CSR priority, and CSR climate
on subsequent group and individual ESR. In the time-lagged study, the effects tended to only
materialise at time 2, and not time 3. When time 1 ESR was controlled, in order to assess the
change in ESR behaviours at both the group and individual levels, these three-way
interactions at time 2 remained viable.
Field study: In the field study, a preliminary test for the conceptual model was provided in a
cross-sectional study conducted with an organisational sample. The moderating effects of
assigned CSR priority and CSR climate, individually and in combination, on the relationship
between TF and leader-rated group and individual ESR was tested. At the group level, only
the three way interaction between group TF, group assigned CSR priority and CSR climate
on leader-rated group ESR, was marginally significant. At the individual level, the
moderating role of individual assigned CSR priority on the effects of individual TF on
individual leader-rated ESR was significant.
Time-lagged study: The purpose of the time-lagged study was to replicate and extend the
findings of the field study, in a time-lagged setup within a simulated Business Game setting.
In the time-lagged study, all predictors were measured at time 1, and the effects of these
predictors on subsequent group (leader-rated) and individual ESR behaviours (peer-rated),
measured at times 2 and 3, were tested. Moreover, these same relationships were analysed
once again, whilst this time controlling for time 1 ESR, in order to deduce changes in group
and individual ESR engagement over time, if any.
At the group level, the moderating effects of group CSR climate, was marginally significant
on both time 2 and 3 leader-rated group ESR outcomes. Furthermore, the three-way
interaction on time 2 leader-rated group ESR was also significant. When time 1 ESR was
controlled for, only the three-way interaction on time 2 leader-rated group ESR remained
significant.
At the individual level, the moderating role of group CSR climate on the relationship between
individual TF on both time 2 and time 3 peer-rated individual ESR behaviours was
significant. Additionally, the three-way interaction effect was also significant for time 2 peer-

[288]
rated individual ESR behaviours. When time 1 ESR was controlled for, this three-way
interaction became marginally significant; no other relationships were significant.
Table 8.01
Summary of findings
Level of
Analysis Hypothesis Field study
Time-lagged
study
Time-lagged
study
(Time 1 ESR
controlled)
Group
TF x ACSR x x x
TF x CCSR x x
TF x ACSR x CCSR
[only at time 2]
[only at time 2]
Individual
TF x ACSR x x
TF x CCSR x x
TF x ACSR x CCSR x
[only at time 2]
[only at time 2]
Note: TF = transformational leadership; ACSR = assigned CSR priority; CCSR = CSR
climate

[289]
8.3.Theoretical contributions
Below, a general overview of the theoretical contributions pertaining to each study is
provided. More specific theoretical contributions can be accessed within the respective
chapters.
8.3.1. Scale development
A significant contribution made by this thesis is in developing a micro-CSR taxonomy and
measurement tool, which allows us to conceptualise and measure employee socially
responsible behaviours. To date, when studying employee social responsibility engagement,
it tends to be conceptualised in various ways across different research efforts. For example,
those such as Booth et al. (2009) and Caligiuri et al. (2013) have looked at employee
volunteering, whilst others have focused on environmental/ green behaviours (Kim et al., in
press). Philanthropy has also been singled out by examining the amount individuals donated
to charities (e.g. Raman and Zboja, 2006). As a result, the multi-dimensional nature of CSR
has been, to a considerable extent, largely disregarded in micro-CSR research; through a
predominant focus on a narrow subset of socially responsible behaviours.
There have been efforts made to conceptualise employee socially responsible behaviours in a
more holistic fashion. However those that do this sometimes are too broad in their approach,
causing the specificity of behaviours to be lost. For example Vlachos et al. (2014) termed
ESR as extra-role CSR-specific performance, but rather than conceptualising this as
behavioural engagement in socially responsible activities, such behaviours were more
focused on for instance providing feedback to supervisors on how their organisation’s CSR
program could be improved. Whilst Vlachos et al. (2014) tried to go into more detail in
differentiating between in-role and extra-role CSR specific performance, the
conceptualisation of these socially responsible behaviours remained too broad.
More recently, Chen and Hung-Basecke (2014) attempted to formulate a more encompassing
measurement of micro-CSR. However the way in which they did so was not necessarily by
devising a behavioural scale, but rather by developing a list of 23 ‘CSR activities’ of the
company, which they categorized into the social and environmental facets, stakeholder
relationship building, and community support; and they asked employees to indicate the
behaviours they had engaged in the past 12 months. In order to calculate an employee ‘CSR
participation’ score, the number of activities engaged in were summed up, and divided by the

[290]
total number of activities available to the employees to participate in, given that four offices
were sampled. The issue with this was that it is akin to a formative assessment tool, whereas
it is argued, to further research efforts on ESR, a non-time bound behavioural measurement
tool is needed. Moreover the economic dimensions of CSR is missing, and given that this is
identified as a common facet of CSR reverberated in many definitions of CSR, and agreed
upon in a recent review by Rupp and Mallory (2015), this is an oversight (see also Dahlsrud,
2008). Not only this, but any efforts on the part of the authors to delineate the process of scale
development and validation for this assessment tool are non-existent in the paper. In contrast,
the current thesis makes clear efforts to firstly identify the many definitions of CSR, and on
the basis of scholarly consensus, defines ESR as a five-faceted multi-dimensional construct.
Items for the new ESR scale are then generated inductively via interviews, and deductively
through the use of the definition and past research, which are subsequently subjected to a test
of content validity by subject-matter experts. The process of then refining and validating this
scale is comprehensive, and concludes in the establishment of sound psychometric properties
of the ESR scale. In contrast to such rigorous scale development and validation efforts
therefore, Chen and Hung-Basecke’s (2014) scale apparently falls considerably short.
When research chooses to focus on a specific facet or facets of ESR, they not only neglect the
multi-dimensional nature of these ESR behaviours, but also the inherent conflict between the
various dimensions (Aguilera et al., 2007). What is needed, as a result, is to measure ESR
behaviours in their entirety, and thus provide a more accurate demonstration of how
employees can engage with the multitude of ESR behaviours equivocally. In the present
thesis, firstly a mutual conceptualisation of ESR was reached which highlighted the five
dimensions of social, philanthropy, economic, environmental, and stakeholder dimensions, as
informed by past research (e.g. Dahlsrud, 2008). Secondly, this was then used to conduct
qualitative interviews with a number of employees from various industries with distinct
employment backgrounds, in order to develop items. Finally, efforts were made to rigorously
validate the measure in a number of samples.
Doing so has not only resulted in the first specific multi-dimensional ESR scale to measure
employee behaviours, but it has also provided the much needed clarity to the domain of
micro-CSR. Rupp and Mallory (2015) highlighted the ‘dilemma of specificity’ surrounding
CSR, noting that it had become an umbrella term for a wide-ranging number of activities,
some of which were distinct domains of research in themselves (e.g. diversity). They
attempted to provide a more conclusive conceptualisation of CSR by building upon the works

[291]
of Carroll (1991), Aguinis and Glavas (2012) and Dahlsrud (2008), and listing the five
dimensions of CSR as stakeholder obligation, social obligation, economic obligation,
voluntariness dimension, and the environmental dimension. It is safe to conclude therefore,
that not only did the current thesis reach a parallel conceptualisation itself, but this was
incorporated in the scale development process. Such consistency can provide the much
needed clarity to CSR research in general, and micro-CSR more specifically, and thus help to
drive more focused research efforts in this area.
Furthermore, the robustness of the scale development and validation procedures employed to
develop this scale can be attested to, since the recommendations of Hinkin (1995) and
DeVellis (2012) were closely applied. Given the nascent to intermediary nature of micro-
CSR research, rather than impose the possible items of this scale, both a deductive and a
inductive approach were used to generate items, and efforts were made to ensure context-
independence of the scale through the use of qualitative interviews with employed individuals
from various industries, and with differing occupational backgrounds. Moreover, the scale
was validated in a number of samples to further increase rigour of the scale development
process. On the basis of this, it can be concluded that the thesis made notable efforts to
develop a methodologically sound, and theoretically relevant scale to measure employee
socially responsible behaviours; independent of industry and organisational-specific artefacts,
as well as employee occupational and demographical backgrounds.
8.3.2. Antecedents and boundary conditions
This thesis further made efforts to not only conceptualise, and on the basis of that, develop a
rigorous new ESR behavioural measurement tool, but also to then apply this scale in order to
provide a preliminary test for the possible determinants of ESR. Aguinis and Glavas (2012),
in their review on CSR, called for OB researchers to give CSR its due attention at the micro-
level and to enhance research at the individual level, which at the time of their review
consisted of only 4% of the overall research on CSR. In doing so, they developed a multilevel
model in which they focused upon the outcomes of CSR, including predictors, moderators
and mediators. However, whilst the authors made the call to OB researchers to investigate
micro-level CSR, they neglected to consider the determinants of employee engagement in
CSR in their paper. Furthermore the authors make efforts to explore the outcomes of CSR at
the employee level, such as organisational attraction and job pursuit intentions; but they do

[292]
not focus on employee engagement with social responsibility itself. When focusing on
employee engagement in CSR, we need to focus on the determinants of employee
participation in the company’s CSR activities, before we can then focus on the outcomes of
said engagement. Otherwise we fall into the trap of focusing on the benefits employee
engagement in CSR can bring to the organisation’s table, without first clarifying how this
engagement can come about in the first place. As a result, this thesis took a scrupulous stance
on specifically focusing on determinants of ESR, and honed into the possibly significant roles
of TF, assigned CSR priority, and CSR climate.
Goal-setting theory (e.g. Locke and Latham, 2002) was used to theoretically inform the
proposed antecedent and boundary conditions of ESR. The theory suggests that effective
goals have a motivational effect on employee causing them to direct their efforts towards
these goals, be energised towards achieving these goals, make use of task relevant knowledge
and skills, and persist in their efforts. Specifically, this theory highlights the negative role of
goal-conflict which can arise when various employee goals are not properly aligned. This is
especially relevant to ESR behaviours, given that the various dimensions appear to conflict
with one another in their focus. Consequently, this theory informed the combination of TF,
assigned CSR priority, and CSR climate, based on the utility of these in encouraging
employee engagement, more specifically, in those behaviours which may conflict with one
another; as suggested by prior research. Firstly TF leadership has been consistently evidenced
as effective in facilitating positive work outcomes (Judge and Piccolo, 2004). The effects of
TF in encouraging employee pro-active behaviours are also demonstrated, which can be
argued to be similar in nature to ESR behaviours, which also require employees to be pro-
active to a certain extent (Den Hartog and Belschak, 2012). The relation of TF to CSR
specific outcomes has also been noted, such that TF has been shown to be related to greater
organisational CSR activities (Du et al., 2013; Waldman et al., 2006). In addition Zhu and
Akhtar (2014) have further unearthed the positive effects of TF on employee pro-social
behaviours.
It was argued however in the present thesis, that TF in itself was not sufficient in encouraging
social responsibility at the micro-level, as it lacked a CSR focus. Thus the role of assigned
CSR priority, modelled on the original construct of assigned safety priority developed by
Zohar (2002a), was put forward. Zohar (2002a) noted that when leadership prioritised safety,
and did not neglect it for the purposes of solely encouraging efficiency, safety indicators
within the workplace improved. Similarly, it was proposed that when TF leaders assign an

[293]
importance to social responsibility and manage employee expectations of the socially
responsible behaviours employees need to engage in, social responsibility in employees
would be enhanced, by minimising goal-conflict between the different behaviours. In support
of this, research has shown the way in which TF, focused on a specific outcome, can
engender comparable outcomes in employees. For instance Morhart et al. (2009) noted the
effects of brand-specific TF on subsequent employee brand-building behaviours. In relation
to CSR itself, the utility of environmental TF behaviours on subsequent employee
environmental behaviours has also been demonstrated (Graves, Sarkis, and Zhu, 2013).
Finally, the role of a CSR climate was proposed. Climate has been shown to moderate the
effects of TF on employee work outcomes (Charbonnier-Voirin et al., 2010; Liao and
Chuang, 2007). It was argued that even when leaders demonstrate TF behaviours and assign
importance to CSR, if the group or organisational climate is not conducive, then this will still
serve to hamper ESR. All three in combination, it was anticipated, would encourage
employee engagement in socially responsible behaviours, by balancing the conflict between
the different dimensions of ESR. They would do this, it was proposed, through
communicating a consistent message with regards to CSR. That is, having a CSR climate
which also supported this message through its policies and procedures, and a TF leader who
used motivational leader behaviours, whilst also managing expectations with regards to CSR.
Efforts are thus made in underscoring the importance of studying TF in relation to a specific
focus, so that the value free behaviours of TF become value laden towards which they are
directing followers, by introducing the novel construct of assigned CSR priority (Fu et al.,
2010). In addition, this research is one of, if not the first, to provide a unique test of the
effects of a CSR climate on ESR, and highlight its use in providing a supportive and
conducive environment for employee socially responsible behaviours. Indeed in some cases,
findings from the current research series suggested that TF behaviours along with a positive
CSR climate may alone be sufficient in propagating employee engagement; although the
most consistent findings attest to the combination of the three factors. The current thesis
indeed found support for this unique amalgamation in both the field study and the time-
lagged study. Findings demonstrated that the specific combination of all three constructs was
needed in order to positively facilitate employee engagement consistently, both at the group
and individual levels.
[294]
Through the study of this combination of factors, contributions are made to the respective
research domains of each specific construct. Firstly, with regards to TF, the need to approach
TF from a multi-level perspective was addressed, such that its effects were examined at the
group and individual levels in a multi-level model (Yukl, 1999). Moreover, the study further
made contributions to investigating the boundary conditions of TF, by looking at the
facilitating roles of assigned CSR priority and CSR climate (Avolio et al., 2009). In addition
to this, the research series helped establish the utility of TF in encouraging social
responsibility in employees, thus adding these employee outcomes to its already wide-
ranging repertoire.
Furthermore, the findings of the utility of CSR climate further corroborate prior research
evidence, which highlights the moderating roles of various climates on positive work
outcomes (Hofman et al., 2003; Tordera et al., 2008). For example, a climate for innovation
has been shown to moderate the relationship between TF and its effects on employee adaptive
performance (Charbonnier-Voirin et al., 2010). Additionally, with regards to CSR-specific
outcomes, Yim and Fock (2013) have noted the moderating effects of a social responsibility
climate on the relationship between pride in volunteer work and volunteer work as a calling,
on subsequent perceptions of the meaningfulness of volunteer work. The findings from this
thesis confirm the moderating effects of a CSR climate in the influence of TF on ESR, and
thus provide a novel insight into the role of such a climate in relation to ESR.
Finally, the thesis points towards the importance of considering TF behaviours in relation to
the specific focus of interest. That is, rather than considering the effectiveness of TF
behaviours alone, which are argued to be value free; instead demonstrating how TF
behaviours focused on a specific outcome, in this case CSR, can encourage related outcomes
at the employee level (Fu et al., 2010). Research has noted how a safety-specific focus can
encourage safety performance (Barling et al., 1996; Zohar, 2002a). Whilst in the area of
marketing, TF focused on brand-building behaviours, can engender employee brand building
behaviours (Morhart et al., 2009). Although there was limited evidence for the utility of
assigned CSR priority individually with TF; its function in combination with TF and CSR
climate was evidenced, and thus the findings from this research do not entirely contrast to
those previously established.
These results consequently provide a first test for some of the unique contextual determinants
of ESR. In this manner, efforts are made to provide a first-hand insight into the determining

[295]
conditions of micro-level CSR, thus addressing such a niche. By so doing, it is anticipated
that this research will provide the momentum to enhance further interest in exploring the
conditions under, and mechanisms through which, ESR can be enhanced.
8.3.3. Time-lagged investigation
Not only did this research series provide a preliminary examination of the possible antecedent
and boundary conditions to consider, when looking to encourage individual and group level
engagement in socially responsible behaviours, it also made efforts to determine the causal
sequence of these relationships. When studying relationships through cross-sectional studies,
such as in the field study (chapter six), we can only assume that the predictors TF, assigned
CSR priority, and CSR climate are related to ESR (Mitchell and James, 2001). What we
cannot infer is the direction of these effects; indeed it is possible that the relationship could be
operating in a reverse order. In order to overcome this limitation in the field study, which
whilst providing external validity, lacked internal validity, attempts were made to replicate
the findings in a time-lagged study with the business game simulation sample, over a seven
week period. More specifically, attempts were made to measure the effects of time 1 (week 1)
predictors on subsequent group and individual socially responsible behaviours both at time 2
(week 4) and 3 (week 7). Furthermore, time 1 ESR behaviours were subsequently controlled
for in additional analyses, in order to determine change in employee engagement from that of
baseline.
Kelly and McGrath (1988) stated that “the duration of the interval between cause and effect is
left unspecified in our theoretical formulations and in our interpretation of concrete findings”
(pg. 19). In addressing this, chapter seven specifically sought to stipulate that the predictors
of TF, CSR climate, and assigned CSR priority were expected to precede group and
individual ESR. Efforts were therefore made to determine the causal relationships between
TF, assigned CSR priority, and CSR climate collectively on individual and group ESR,
measured three, and six weeks later.
Results revealed partial support for the direction of effects between the predictors at time 1
(week 1) on subsequent ESR. Furthermore, in some cases these effects remained significant
after controlling for time 1 ESR, thus suggesting that ESR does indeed positively change over
time, as a result of the effects of the predictors. Currently, the focus on more longitudinal and
time-lagged investigations has tended to be neglected in research in general. In most cases,

[296]
this can be attributed to practical constraints when conducting research, such that it is
difficult to implement and manage a longitudinal study, especially when attrition rates can
disproportionately increase over time; and/or being unable to gain access to organisations in
the first instance to collect longitudinal data (Mitchell and James, 2001).
These results reinforce previous findings revealed in longitudinal investigations of TF. The
longitudinal effects of TF have been demonstrated by the likes of Munir and Nielsen (2009)
who confirmed that TF was useful in predicting the health of healthcare workers measured
over a year later. These effects of TF on subordinate wellbeing have been evidenced by other
researchers, also over varying time periods (e.g. van Dierendonck et al., 2004; Wilderom et
al., 2012). Whilst a number of longitudinal investigations of TF look at wellbeing outcomes,
research has also demonstrated longitudinal effects of TF on outcomes such as profitability
(Keller, 2006). The results of the time-lagged study further corroborate such findings, over a
shorter period of time, and also build upon them by demonstrating the predictive power of TF
on the novel outcome of ESR.
Assigned CSR priority was unique to this research series; nevertheless, it was modelled on
the construct of assigned safety priority developed by Zohar (2002a). Zohar (2002a) did
evidence the longitudinal effects of assigned safety priority, in conjunction with TF, on
subsequent safety performance indicators. Whilst TF and assigned CSR priority alone did not
relate to enhanced ESR in the time-lagged study, they did so under conditions of a positive
CSR climate. Currently there have been very little efforts to conceptualise CSR climate, and
studies looking at the effects of this CSR climate are scarce (El Akremi et al., in press; Yim
and Fock, 2013). As a result, and as it is to be expected given the originality of the current
research series, there are no efforts to demonstrate the longitudinal effects of CSR climate.
Research has however demonstrated in general, the longitudinal moderating effects of
different climate types in numerous other research domains (e.g. Liao and Chuang, 2007;
Neal and Griffin, 2006).
Consequently the contribution of this research in examining the longitudinal effects of a
novel assigned CSR priority, and the relatively recent construct of CSR climate, are
especially noteworthy. The results from the time-lagged study thus substantiate previous
longitudinal effects of assigned safety priority, and confirm that such effects also hold when
this construct is modelled as assigned CSR priority, when considered in conjunction with TF
and CSR climate. Furthermore, with regards to CSR climate, the time-lagged study provides

[297]
the first evidence of its kind demonstrating the longitudinal effects of a CSR climate on
micro-level ESR, which hold after controlling for initial ESR. Given such results confirm
prior findings of similar yet distinct constructs, the robustness of these new and relatively
recent constructs can be acknowledged.
Furthermore, in attempting to provide a time-lagged study of the model, in order to more
confidently assert directionality of relationships, efforts were made to specify the role of time
in the proposed model. As such, the time-lagged study attempted to explore the possible time
effects of when ESR occurs, subsequent to the effects of the combination of predictors. Thus
whilst exploratory in nature, given that it was the first study of its kind, relevant measures
have been taken to determine the time lag between X (the predictors) and Y (the outcome of
ESR). Furthermore, by controlling for time 1 ESR, efforts were made to denote the rate of
change of Y. As a result, it is believed that the time-lagged study goes some way in not only
specifying generally that X precedes Y, as research is generally inclined to do, but rather also
exploring the duration of effects, the time lag between relationships, in addition to exploring
rates of change (George and Jones, 2000).
Nonetheless, as discussed above and explored within the respective chapter; not all
hypothesized relationships materialised. Mitchell and James (2001) provide a compelling
account for the role of time in research and building the case for when predictors causally
relate to outcomes, and at which points do X and Y occur. Appreciating this can generate
some clarity as to why some findings were not significant.
It is probable that ESR may have been measured either too early or too late, as opposed to
when it had matured and had reached a consequent stage of constancy. Indeed Mitchell and
James (2001) note that measuring Y, in this case ESR behaviours, either too soon or too late,
can result in null findings which do not necessarily reflect the absence of a relationship, but
rather the misspecification of when Y occurs. When a time lag is too great, effects may wear
off, and when it is too small, then effects may not have fully matured and stabilised by the
time of measurement.
The authors go on to discuss the causal cycle and the moderation by causal cycle curve
(MCC), in which they put forward the notable roles of the equilibration period, the
equilibrium condition, and the entropic period, which follow one another in a linear fashion,
respectively. The equilibration period is the time it takes for the effects of X to impact upon
Y, whilst the equilibrium condition denotes when Y becomes stable, and the entropic period

[298]
reflects uncertain and inconsistent changes in Y based on certain measurements of X. They
argue that Y should be measured when it reaches a state of constancy in the equilibrium
condition, in order to provide a more accurate reflection of the effects of X on Y. Measuring
Y at either the equilibration period or entropic period will lead to an underestimated value,
the strength of which will differ depending on how far elapsed the equilibrium type condition
is from the measurement point chosen.
As can be seen in Figure 8.01, a possible MCC curve for the current research is depicted.
This is of course merely represents a prediction of what may possibly have occurred in the
time-lagged study. As apparent from the figure, the moderating roles of assigned CSR
priority and CSR climate are demonstrated by the different line graphs. Firstly, as would be
expected, and as reinforced by the findings from the research, a combination of low assigned
CSR priority and CSR climate, in combination with low transformational leadership (TF), has
a lower magnitude of causal relation to ESR. However as these increased, so does the
magnitude of causal relation. As the findings revealed in both the field study and the time-
lagged study, the optimal conditions for ESR behaviours were when both assigned CSR
priority and CSR climate were high, in combination with high TF; that is, a high magnitude
of causal relation.
Figure 8.01
The MCC Curve
(Adapted from Mitchell and James, 2001)
Mag
nit
ud
e o
f ca
usa
l rel
atio
n
Equilibration Equilibrium Entropic
Low TF; Low assigned CSR priority;
Weak CSR climate
Mean TF: Mean assigned CSR priority;
Mean CSR climate
High TF: High assigned CSR priority;
Positive CSR climate

[299]
Now, what is notable about the graph is how small the equilibrium condition is, which is
theoretically proposed in this thesis to be the cause of some of the limited causal findings in
the time-lagged study. Mitchell and James (2001) suggest that the magnitude of the causal
relation which draws the link between X and Y is moderated by the point at which Y is
measured in the causal cycle. Based on their theorising, it is proposed that given the short
time lag of seven weeks in the BG study, time 1 predictors were more likely to exert
significant effects on time 2 outcomes of ESR behaviours, which was not the case for time 3
outcomes; due to a possible short equilibrium condition, as represented by the causal cycles
in the figure above. Again, the MCC Figure above is based merely on theoretical conjecture,
and the slopes of the curve, as well as the steepness, and the symmetry or asymmetry depends
on the data at hand. Building on this, because commonly the effects of time 1 predictors on
time 2 outcomes tended to be significant, it is possible that this was due to, as Mitchell and
James (2001) surmise, the short-term effects of X on Y.
8.3.4. Goal setting theory
When looking at micro-CSR and at employee reactions to CSR for example, various theories
have been used in order to provide a theoretical underpinning for how such relationships may
work. At the micro level of CSR, the most popular theories have been those such as social
identity theory, signalling theory, social exchange theory, and theory of justice (Rupp and
Mallory, 2015). These have been employed to explore the relationships between
organisational CSR and job pursuit intentions (signalling theory), organisational
identification (social identity), organisational commitment (social exchange), and job
satisfaction (justice), to name but a few (Behrend, Baker, and Thompson, 2009; De Roeck et
al., 2014; Farooq et al., 2014; Jones, 2010).
Given the robustness of the goal-setting theory and its applicability to micro-level CSR, by
considering the conflicting behavioural goals of the various dimensions, it is surprising that it
has not been widely touted in regards to ESR. The goal-setting theory proposes that goals,
when effectively set, have a consistent motivational effect on individuals (Locke and Latham,
1990). Furthermore, the role of leaders in motivating goal-directed efforts have been noted
(Locke and Latham, 2002). Given that ESR is a multi-dimensional construct, it reasonable to
assume that the various dimensions, distinct in nature, could pose goal conflict. Research has

[300]
evidenced that when employees are provided with two seemingly conflicting goals, for
instance of production and quality, they will prioritise one over the other (Locke et al., 1994).
Goal-setting theory can also be applied at the group level. For instance DeShon et al. (2004)
focused on the goal-setting and feedback processes within teams. They proposed a model in
which they looked at individual-specific and team-specific goals, and the role of feedback
loops. More specifically, they noted that when individual and team goals are congruent, thus
suggesting a lack of conflict, then the feedback loops indicate similar behavioural outputs.
However when there is discrepancy, and as a result suggesting goal conflict, they advocate a
choice needs to be made, and this involves either the individual feedback loop having
behavioural control, or the team feedback loop having behavioural control. This leads to
prioritisation of either individual level or team level goals, depending on various factors, such
as goal importance, as well as situational characteristics. The authors evidenced that receiving
either individual level feedback or team level feedback, causes team members to either focus
on individual or team performance respectively. Applied to the current context, goal-setting
theory would suggest that individual ESR goals need to be consistent with group ESR goals,
otherwise goal conflict is experienced, and a trade-off is incurred. Additionally, it can also be
surmised that within the ESR construct itself, the conflict of the various goals need to be
balanced.
Consequently, the interactive roles of TF, assigned CSR priority, and CSR climate were
proposed to motivate ESR-related goal-directed efforts at both the group and individual
levels, as well as to manage the conflict between the various socially responsible behaviours,
by communicating a consistent message with regards to the importance of CSR, holistically.
These relationships were expected to operate comparably at the group and individual levels.
Given this reasoning and sound application to the current research series, it is proposed that
goal-setting theory should be another theory that should be focused upon when investigating
determinants of ESR, especially when the focus is on encouraging the multiplicity of ESR
behaviours.
Moreover, whilst the research series presented within this thesis made attempts to explore the
possible determinants of ESR, it did not consider the underlying mechanisms of such effects,
which in relation to goal-setting theory; self-efficacy would be a natural consideration (see
below). Whilst this is not a significant shortcoming of the current research by any means,
given that its role was that of an exploratory nature, the persistent neglect of mediating

[301]
influences between predictors of, and subsequent ESR, will hinder the progress of research
on ESR. As a result, future research is encouraged to start to explore the possible mediating
mechanisms operating between the predictors of TF, assigned CSR priority, and CSR
climate, on subsequent ESR in order to enrich this burgeoning area.
8.4.Limitations
A general overview of limitations within the current research series are explored below.
Limitations more specific to each study can be accessed in the respective chapters.
8.4.1. Sample size
Sample size appeared to be a common issue across both the field study and the time-lagged
study. Restricted sample sizes can have a negative effect on analysis, and so it is possible that
this may have hampered the robustness of the findings derived, as a result of reduced
statistical power (e.g. Collins and Morris, 2008; Tett et al., 2009). The limited sample size
may have been the cause of the issues experienced during hierarchical linear modelling
analysis at the individual level. More specifically, in both the time-lagged and the field study,
there were issues where the model would not converge, causing analysis to proceed with the
intercept at random model in many cases. Not only this, in the atypical cases where the model
did converge, systematic testing of slopes would, in a number of cases, reveal none that were
significant. Whilst this posed a significant limitation for multi-level analysis, analysis
nevertheless proceeded on the basis of recommendations of Aguinis et al. (2013). The
authors suggested that inability to find significance in slopes may well be due to a small
sample size, especially given the relevance of level two sample sizes, which tend to be much
smaller than level one samples; and multi-level analysis should nonetheless continue.
What was unexpected was how this issue was reverberated in the time-lagged study which
had a sample of approximately double the size of the field study. The level one sample in the
time-lagged study of 232 individuals was greater than the noted median of 161-204 (Dalton et
al., 2012). Moreover, the time-lagged sample of 67 groups was also greater than the listed
median of 51 in other research studies (Mathieu et al., 2012). It may have been that the
student nature of the time-lagged sample exacerbated the issue, which was not helped by an
increase in sample size. Additionally, the model’s complexity may have warranted an even
[302]
greater sample size. Future research would do well by confirming the current findings in a
larger sample, and evading the technical issues in analysis experienced in the current thesis.
Finally, due to the limited sample sizes, it cannot be conclusively said that the non-significant
findings from the current research, are indeed non-significant relationships in the wider
occupational population. Rather, it is possible that with larger sample sizes, these effects may
indeed materialise. Therefore conclusions regarding the absence of some relationships in the
current research series should be interpreted with caution.
8.4.2. Causality
The field study was correlational in nature which precludes conclusions being made as to the
direction of effects (Mitchell and James, 2001). Whilst it provided a test of external validity,
being that it was conducted in a real occupational setting embedded within an organisation, it
lacked internal validity. From this study we are able to assume that the predictors of TF,
assigned CSR priority, and CSR climate are related to one another, nevertheless, we do not
know if these predictors are able to forecast resultant changes in ESR. Whilst this was a
notable limitation of the current thesis, it was not disabling, since the time-lagged study
which followed sought to offset this. Collectively, both studies conjoin to provide external
and internal validity of the findings.
The time lagged study made efforts to determine the direction of effects of the predictors TF,
assigned CSR priority, and CSR climate on ESR. However, it cannot be definitely concluded
that these predictors did indeed cause changes in ESR. Due to the research still being
correlational in nature, lacking the robustness of experimental methodology, it is entirely
feasible that external constructs not measured by this research co-varied with TF, assigned
CSR priority, CSR climate, and ESR.
When examining the time lagged effects of TF, research has varied in the time periods for
measurement. Hence there was no clear guidance on the temporal frames to expect within the
current research. That is, does TF exerts its effects in a relatively short amount of time, or do
the effects mature and develop over time, leading to enhanced ESR? This issue is resounded
by the following comment from George and Jones (2000): “although theories in
organisational behaviour, more often than not, specify relationships among constructs in
causal terms, the duration of effects, the time lag between causes and effects, and differences

[303]
in rates of change are often left unspecified” (pg. 670). For this reason, the research was
conducted over a time period out of convenience. As Kenny (1975) pointed out, time lags are
often “…because of convenience, not theory, since theory rarely specifies the exact length of
the causal lag” (pg. 894).
Without making efforts to conclusively determine the causal relationships between these
constructs, it is possible that reverse causality could be operating. Such that, for example
whilst theoretically we might expect TF to be in some way related to ESR behaviours, it
could be that employees that engage in ESR behaviours are more likely to cause their leaders
to demonstrate greater TF behaviours towards them. Indeed research has speculated that
employees that demonstrate greater performance at work are more likely to engender positive
leader-member exchange (LMX) relationships with their leader, as opposed to the
traditionally understood relationship between high-quality LMX leading to greater
performance (e.g. Martin et al., 2015; Uhl-Bien, 2006).
Nevertheless, the time lagged study was the first of its kind in studying the effects of the
various predictors on ESR measured over an extended time frame. In so doing, it has
provided an exploratory test for the possible time lags which may be operating between such
relationships (Mitchell and James, 2001). Future research could further explore a wider range
of time-lags in order to hone into the relevant timing of constructs.
8.4.3. Nature of sample
Another possible limitation relates to the nature of the samples employed in both the field
study and the time-lagged study. Firstly, the field study relied exclusively on a sample
consisting of teams predominantly in the financial services sector, with a small proportion
located within a commercial banking division. It can therefore be argued that this restricted
focus constricts the ability to generalise the findings to the wider industries. Indeed it could
be anticipated that the recent financial crisis of 2008 that occurred within the UK, caused
such types of organisations to become hyperaware of social responsibility, and to make
greater efforts to enhance employee engagement with an improved organisational CSR
agenda.
Interestingly, research looking at Fortune 500 companies, to which Company X (N = 30
teams) belonged to in the field study, suggests that organisational CSR efforts in fact

[304]
experienced a downturn in 2008, during the financial crisis; given that CSR initiatives require
large financial investments (Karaibrahimoglu, 2010). Contrary to these findings, Giannarakis
and Theotokas (2011) demonstrated that there was an increase in organisational CSR activity
during the financial crisis, which dipped post-financial crisis in the period from 2009 to 2010.
It may be that organisations invested heavily in CSR in order to regain trust as well as to reap
the strategic benefits that are oft-noted with CSR, so as to encourage organisational survival
(e.g. Porter and Kramer, 2006). What is not clear however is why there was a dip post
financial crisis, and it may well be that financial resources were limited immediately after the
financial crisis, and consequently organisational resources were limited. It should be pointed
out that in the study by Giannarakis and Theotokas (2011); various sectors were examined,
with financial services composing 17% of the total sample. Thus these effects were not
industry specific, but were additionally applicable to other industries such as energy utilities
and technology hardware and telecommunications.
On a technical level it should be acknowledged that the study was not necessarily concerned
with the proportion of micro-level ESR, but rather the contextual factors that either enhanced
or hampered this relationship at the employee level. Therefore issues of industry-specific
findings arising from the study are relatively negligible. Naturally, future research would
benefit from replicating these findings in various different sectors in order to assess if the
same determinants, as in the current research, are relevant.
With regards to the time-lagged study, the student team sample is qualitatively unique to the
intended application, which is, to organisations and employees within those organisations.
As a result it can be questionable as to what extent these teams are reflective of the teams in
an occupational setting. Nonetheless, it can be argued that the teams in the time-lagged study
were similar in many respects to those within organisational settings. For instance they were
required to work collectively together to accomplish tasks, with a large portion of their
academic and simulated company performance being dependent on how the team worked
together. Thus they can be argued to have possessed task and outcome interdependence,
argued to be a critical factor defining teams, as well as determining consequent team
performance (Barrick, Bradley, Kristof-Brown, and Colbert, 2007; Beal, Cohen, Burke, and
McLendon, 2003). Furthermore, they were also located within a larger ‘organisational’
setting (the university), with policies and procedures and codes of conduct they needed to
abide by, similar to what can be expected within an organisation.

[305]
Finally, it should be borne in mind that the outcomes of employee social responsibility
behaviours, was measured with a tool that was developed with employees across various
industries and sectors. Therefore, in relation to the field study, the behaviours that were being
sought for can be considered to be general across the various sectors. With regards to the
time-lagged study, if anything, this should have implied that tests of the relationships would
have been more conservative, as the sample was qualitatively distinct from the employee
sample used to develop the scale items.
8.4.4. Rescaling predictors
Another possible limitation relates to the rescaling, or centring, of predictors. There are
predominantly two approaches to centring predictors, namely grand-mean centring and
group-mean centring. In the former all variables are centred, according to the level they
subsist at; so for example, in group level analysis, variables would be centred across the total
number of teams. Whereas group-mean centring alters the data, such that predictors at level
one become uncorrelated with level two predictors (Enders and Tofighi, 2007). In the current
research series, predictors both at the group and individual levels were grand-mean centred.
There are however concerns that when testing cross-level interactions, grand-mean centring
can conflate within- and between-group effects (Aguinis et al., 2013). As a result, the likes of
Hofmann and Gavin (1998) have promoted the use of group-mean centring. However Bliese
(2000) noted that spurious cross-level interactions were rare, and as a result, Aguinis et al.
(2013) recommend that the choice of centring technique be based on theoretical arguments,
because in some cases, grand-mean centring may indeed be more relevant. Whilst grand-
mean centring was used in the current research, especially given the lack of significance of
slopes, future research could bear these best-practice recommendations in mind, when
replicating and extending current findings.
8.5.Implications for practice
At the group level, it appears that TF and CSR climate alone can be sufficient in enhancing
group ESR, whilst findings also demonstrate that the optimal conditions are when high TF,
high assigned CSR priority, and a positive CSR climate exist in unison. When looking to
facilitate individual engagement, recommendations are comparable to the group level. Whilst

[306]
there is evidence that both at the group and individual levels, TF and CSR climate may be
sufficient, and additionally at the individual level, the combination of TF assigning a high
priority to CSR may also be adequate in itself, the most consistent finding has been for the
three-way interaction effect, as outlined in Table 8.01 earlier. That is organisations would do
well by focusing on all of the three following components: leadership interventions to train
effective TF behaviours, training leaders to assign high priorities to CSR, and developing a
positive climate for CSR.
The current research series provided evidence for the utility of TF, in conjunction with
assigned CSR priority and CSR climate, in encouraging ESR. This results in various practical
implications. Firstly it suggests that TF is indeed effective in promoting positive work
outcomes, and this applies to sustainability-focused outcomes also, as was the case in this
thesis (Bass, 1985; Judge and Piccolo, 2004; Lowe et al., 1996). Thus organisations should
focus on providing training to enhance effective TF behaviours.
Research has evidenced the positive effects of leadership interventions on subsequent
behavioural outcomes. For instance Barling et al. (1996) showed that a TF training workshop,
followed by individual booster sessions, led to an increase in TF behaviours. Not only this,
but these learned effective TF behaviours resulted in positive objective performance
outcomes as well as employee outcomes. Dvir et al. (2002) similarly evidenced the positive
effects of TF leader training on subsequent subordinate development and performance, in
comparison to a control group who received eclectic leadership training.
However as noted above, TF alone is not sufficient in encouraging ESR, rather TF behaviours
need to be directed towards CSR. Here the novel role of assigned CSR priority was proposed.
Thus organisations need to focus not only on training effective TF behaviours, but also
ensuring that leaders are versed on the importance of CSR, and are trained on communicating
the importance of CSR, in addition to managing employees’ CSR expectations, such that the
experience of conflict in employees between the various CSR dimensions is avoided. Indeed,
Zohar (2002a) showed that enhancing supervisors’ safety-oriented interactions with
subordinates, in conjunction with superiors communicating a high priority to safety, resulted
in subsequently positive safety outcomes. In addition to this, Morhart et al. (2009) further
evidenced the utility of leadership training in developing brand-specific TF behaviours,
which subsequently engendered related employee behaviours.

[307]
Furthermore, organisations should not neglect the role of the organisation’s policies and
procedures and ensure they are sufficiently focused on CSR, in order to facilitate the
development of a positive CSR climate at the organisational level, which could also inform
the CSR climate at the group level. Grojean, Resin, Dickson, and Smith (2004) provide
strategies for developing an organisational ethical climate, which can also be applied to CSR.
On the basis of their recommendations, the organisations should seek to establish clear
expectations of socially responsible conduct. They should further train and develop leaders so
that they can handle CSR-related situations effectively, and additionally they should provide
the relevant training and mentoring to their subordinates in order to direct appropriate ways
of working within an organisation that prioritises CSR. Moreover, value based leadership
should be implemented, which motivates and inspires employees to work towards the
collective good of CSR, whilst the organisation should reward desirable sustainability-
focused behaviours, so that the importance of CSR is made salient. Finally, organisations
should acknowledge that not all individuals are inclined towards social responsibility, and so
they should make efforts to initially hire those employees whose values are congruent with
the organisation’s CSR focused values.
From the time lagged study, it also appears that the effects of TF, CSR climate, and assigned
CSR priority are not long-term. Therefore leaders should consistently demonstrate effective
TF behaviours and encourage and motivate employees towards the different dimensions of
ESR. Leaders should also ensure that they assign a high importance to CSR and encourage
employees to commit to CSR, and manage any goal conflict that may arise. Moreover, the
organisation should ensure that the CSR climate is continuously reinforced through its
policies and procedures, ensuring for example that commendable CSR efforts are rewarded,
and so making certain the salience of CSR. Doing so can ensure maintenance of ESR.
Moreover, given that this thesis has made efforts to confirm the multi-dimensional nature of
ESR, consisting of the five dimensions of social, philanthropy, stakeholder, economics, and
environment; organisations should focus on these equivocally. As a result the predominant
focus should not be on one or two of the dimensions, at the expense of the others. Doing so
will engender role conflict for employees and this may lead to one dimension being
prioritised at the expense of the other. Not only is this practically not desirable, given the
many negative outcomes of role conflict for employees, but it also supersedes the importance
of ESR as a multi-dimensional construct. If an organisation indeed wants to be authentically
sincere in its sustainability efforts, then it not only should focus on the bottom line and

[308]
fulfilling work objectives, but also on ensuring minimal adverse impact to the natural
environment in employees’ daily work activities, encouraging philanthropic efforts, ensuring
stakeholders internal and external to the organisational are treated respectfully, and finally,
engaging with the local community. In so doing, the organisation can ensure that it is socially
responsible throughout the various levels of the organisation and avert any cynicism to the
contrary.
Finally, this thesis puts forward a novel ESR measurement tool. This addresses a clear
lacking in previous research where measurement of ESR, or its closest proximate tends to be
vague, imprecise, and not fully capturing the multi-dimensionality of such behaviours. Since
many organisations are seeking to enhance their social responsibility, encouraging employees
to engage in such activities can be considered a notable item on the organisation’s agenda.
Through the use of this ESR scale, human resource practitioners can deploy this in activities
such as the personal development review, and ensure that employees’ focus is being placed
on social responsibility within their work roles. Given that robust scale development and
validation procedures were closely adhered to in developing the ESR scale, practitioners can
rest assured that they are using a valid and reliable tool in possibly sensitive employer-
employee activities. Furthermore, this scale was rated in a multitude of ways in the current
research: as self-ratings, leader-ratings, and 360º peer ratings. Whilst self-ratings were not
used during hypotheses testing, it may be useful for organisations to take a multi-faceted
angle and ask employees to rate themselves, as well as obtain leader and peer ratings for the
specific employee. In this way, comparisons can be drawn; gaps can be identified and
addressed, as well as ensuring a more accurate insight.
8.6.Future Research Directions
Given the burgeoning nature of study on ESR, the current research series provides a
springboard for future research to extend awareness on ESR, by taking initial steps in
investigating the boundary conditions and antecedents of ESR. Below a number of
recommendations for future research are explored, providing a broad scope of interesting
means to build upon the current findings. Of course these recommendations are by no means
exhaustive, and the reader is directed to recent reviews such as those of Rupp and Mallory
(2015) and Gond et al. (working paper), for a more detailed list. Given that investigation of
the underlying mechanisms of the proposed relationships was beyond the scope of this thesis,

[309]
this would be considered an important initial step in the right direction in furthering
understanding of the means by which ESR comes about.
8.6.1. Mechanisms of ESR
Whilst the current research investigated the boundary conditions affecting employees’ ESR, it
did not provide a test of the underlying mechanisms through which ESR can be facilitated.
For instance, goal-setting theory provided the theoretical underpinnings of the current
research, with the presumption being that setting challenging and effective goals, in addition
to balancing the conflict between the different social responsibility behaviours, would
motivate ESR, and ameliorate experience of goal-conflict. A related construct to goal-setting
theory is that of efficacy, as proposed by the social-cognitive theory (Bandura, 1997). Self-
efficacy is defined as “...belief in one’s capabilities to organize and execute courses of action
required in managing prospective situations” (Bandura, 1997; pg.2). Self-efficacy is related
to goal-setting. In fact, Locke and Latham (2002) argue that “goal setting theory is fully
consistent with social-cognitive theory in that both acknowledge the importance of conscious
goals and self-efficacy” (pg.714). Those deemed to possess high self-efficacy tend to set
more difficult goals for themselves, are more persistent in trying to achieve them, and they
also implement more effective strategies to do so (Locke and Latham, 2002). Further research
therefore could benefit from explicitly testing the effects of constructs such as self-efficacy,
given its natural affiliation with goal-setting theory, on the relationship between TF and
social responsibility behaviours, as these have been noted to be beneficial in encouraging pro-
active behaviours (Den Hartog and Belschak, 2012). Consequently, it might be expected that
the greater the self-efficacy, the more likely employees are to push themselves with regards
to their socially responsible activities.
Indeed, a key motivational mechanism, by which TF is thought to exert its effects on
employees leading to subsequent positive outcomes, is through self-efficacy (Kirkpatrick and
Locke, 1996; Liu, Siu, and Shi, 2010; Nielsen, Yarker, Randall, and Munir, 2009; Pillai and
Williams, 2004). At the group level, this is termed collective efficacy which refers to the
group’s belief in their capabilities as a whole to attain the required performance goals (Gully,
Incalcattera, Joshi, and Beaubien, 2002). Consequently, self-efficacy and team/collective
efficacy have been shown to be positively related to proactive and extra-role behaviours, as
well as other positive outcomes such as employee wellbeing and satisfaction (Caillier, in

[310]
press; Salanova et al., 2011). By examining the role of self-efficacy, efforts will be made to
assist in addressing the calls to investigate the mechanisms through which TF operates
(Avolio et al., 2009).
Aside from self-efficacy, and moving further afield, to date research has considered the role
of value congruence, social exchange theory, social identity, and justice theory, in relation to
effects of CSR on employee outcomes such as reactions to CSR and CSR attitudes; to name
but a few (Collier and Esteban, 2010; Gond et al., 2010; Groves and LaRocca, 2011; Rupp,
Ganapathi, Aguilera, and Williams, 2006). Of these, social identity theory tends to be the
most commonly applied in discussing employee reactions to organisational CSR (e.g. Rupp
and Mallory, 2015). Research deploying social identity theory demonstrates for instance the
positive effects of CSR on organisational commitment, organisational identification, and
employee attraction (Backhaus et al., 2002; Brammer et al., 2007; Glavas and Godwin,
2013). More closely aligned with CSR itself, Cha et al. (2014) noted the positive relationship
between employees’ and/or their organisation’s pro-social identity with employee pro-social
behaviours. The premise would be that TF could facilitate employees’ engagement with CSR
by fostering employee identification with the organisation, and consequently the
organisation’s CSR agenda.
An additional interesting avenue for research investigating the underlying mechanisms of
micro-CSR, would be examining the potential mediating influence of self-regulatory focus in
enhancing ESR; a theory which is not usually referred to when discussing CSR (Kark and
van Dijk, 2007). Self-regulatory theory suggests that TF and transactional (contingent-
reward) leadership styles can prime a promotion and prevention motivational focus in
followers respectively, engendering them to be both creative and prone to risk-taking, or
diligent and risk-averse, in that order. Given that CSR behaviours such as environmental and
economic behaviours could be considered as those which request employees to follow certain
procedures and pay attention to detail, a prevention motivational focus could be argued to be
useful here. Whereas behaviours such as philanthropic, require followers to go beyond their
core duties, and get creative, in for example organising novel fundraising initiatives; and so
here a promotion motivational focus could be argued to be helpful. It would be interesting
therefore to examine, how these two motivational focuses, as elicited differentially within
followers by TF and transactional leadership styles, would facilitate the diverse range of
social responsibility behaviours.
[311]
Future research would additionally benefit from clarifying the roles of assigned CSR priority
and CSR climate at multiple levels of analysis. The current research was able to evidence the
fact that the optimal conditions for ESR necessitate TF, in conjunction with a positive climate
for CSR and assigned CSR priority. Whilst the study provided some evidence of their effects,
not all hypotheses were supported and so their effects still remain tentative. It could well be
speculated that given larger sample sizes, the individual moderating role of assigned CSR
priority and CSR climate will become more apparent.
8.6.2. Real versus pseudo-teams
This research focused on teams and the factors affecting their collective ESR. However,
when discussing teams different authors have defined teams in various ways. In fact given the
trend for team work, many organisations have attempted to employ team working in order to
reap the many touted benefits of team working, such as enhanced performance, creativity,
and innovation (Mathieu et al., 2008). However it can be argued that in many cases these
teams are not reflective of real teams rather pseudo teams (West and Lyubovnikova, 2012).
Pseudo teams, according to West and Lyubovnikova (2012), are ‘‘a group of people working
in an organisation who call themselves or are called by others a team; who have differing
accounts of team objectives; whose typical tasks require team members to work alone or in
separate dyads towards disparate goals; whose team boundaries are highly permeable with
individuals being uncertain over who is a team member, and who is not; and/or who, when
they meet, may exchange information but without consequent shared efforts towards
innovation’’ (pg. 26). They go on to argue that in contrast, real teams are those which share
objectives, are interdependent, have autonomy, demonstrate reflexivity, and are bounded
within a specific (organisational) context and have specified roles. The issue then becomes as
to what extent the teams used in research contexts reflect real teams or pseudo teams. Due to
romance of team-working, managers are wont to label individuals working in close proximity
to one another and on related tasks for example, as teams, when in fact they are more
reflective of pseudo teams (West and Lyubovnikova, 2012).
In the current thesis, the student sample in the time-lagged study can be argued to meet the
criteria of real teams. That is they were working interdependently, they reflected on their
performance, they were bounded within the academic context, they had autonomy to shape
their simulated car manufacturing company as well as making the according decisions, they

[312]
had a shared objective to attain the highest market share compared to other teams they were
competing against, and they all had specified roles within the team. This can be convincingly
ascertained, given the first-hand experience of the primary researcher with such teams. On
the other hand however, not much was known about the teams in the field study, barring the
fact that the organisation labelled them as teams. The enquiry thus centres on the extent to
which they were reflective of real teams, or if they were merely a reflection of the fad
commonly associated with the romance of teamwork in organisations.
It would be interesting for future research to investigate how pseudo teams versus real terms
are affected by the factors in the present research (assigned CSR priority, TF, and CSR
climate). It is evidenced that pseudo teams are not able to reach the same performance
standards as real teams, indeed falling significantly behind real terms in terms of performance
outcomes (e.g. Dawson, West, Adamsachew, and Topakas, 2011). Similarly it would be
reasonable to expect that real teams are likely to exhibit greater group ESR, given the right
contextual factors.
8.6.3. Outcomes of ESR
Research has evidenced the positive effects of CSR on various performance outcomes. For
instance CSR is related to enhanced financial performance for the organisation (Orliztky et
al., 2003; Rodgers et al., 2013). Furthermore, it can also lead to market benefits for the
organisation such as enhanced reputation, positive consumer reactions such as enhanced
loyalty and purchase intentions, as well as employee outcomes of organisational commitment
and identification (De Roeck et al., 2014; Melo and Garrido-Morgado, 2011). Following on
from this, it would be interesting to determine the knock-on effects of ESR on organisational-
level and more general societal outcomes for example, which could provide further impetus
for organisations to enhance micro-level ESR efforts; as well as determining if this increased
ESR also leads to positive employee outcomes, such as enhanced job satisfaction and
commitment to the organisation.
More specifically, in their recent review, Rupp and Mallory (2015) note that we are little
aware of the outcomes of employee-focused micro-CSR. They point out that an alleged
purpose of CSR is to ‘ameliorate human misery’ (Margolis, and Walsh, 2003). And so, when
discussing micro-CSR, we need to be able to determine the true efficacy of CSR beyond an
exclusive focus on objective financial organisational outcomes for example, and placing the

[313]
spotlight on those who are intended to be benefited from such CSR activities, including
employees themselves, in order to not negate the humanitarian aspect of CSR. Going beyond
employees, given the multi-dimensional definition of CSR adhered to in the current research,
the other targeted beneficiaries of such CSR activities can be acknowledged as the local
community, and the wider population, which the social and philanthropic dimensions target,
as well as the environment in general. Indeed, Freeman and Moutchnik (2013) note
communities to be key stakeholders. Given that CSR is also conceptualised as the triple
bottom line of profit, planet, and people, it is dismaying to reveal that the ‘profit’ aspect has
been predominantly focused upon when examining the benefits of CSR. Future research
would benefit from re-focusing on the humanitarian aspects of CSR, and examining if ESR
does indeed have significant impacts in reducing ‘human misery’.
8.6.4. Specifying time lags
A specific issue in relation to time-lagged studies of effects is when Y, the outcome, should
be measured (Mitchell and James, 2001). In the current thesis, given that the study was
conducted in term two of the academic calendar, the time period within which the effects of
X on subsequent Y measured subsequently at various time points was limited. Measuring too
soon or too late, as discussed above in the moderation by causal curve cycle, can cause the
measurement of Y to be significantly attenuated, depending on how great the elapse in
measurement of Y is from the equilibrium period (Mitchell and James, 2001).
Mitchell and James (2001) suggest that a key issue which needs to be resolved regarding
measurement of Y is when to measure Y, and how often. Whilst theory and previous research
can help here, for the current time-lagged study, there was little to go by given the novel
construct of ESR. The authors recommend that in such ambiguous situations, multiple
measurements of Y can be helpful. Future research could thus increase the robustness of
current research efforts by specifically attempting to delineate the time point at which Y
occurs following X.
8.6.5. Individual Differences
Another interesting avenue for future research would be to examine the influence of
individual differences on the relationships studied within this thesis. More specifically, the

[314]
focus of the thesis was investigating the context under which ESR can be encouraged,
regardless of individual affinities towards CSR and so forth. But of course, it is to be
expected that individual differences will moderate the extent to which the combination of TF,
assigned CSR priority, and CSR climate are effective in facilitating employee socially
responsible behaviours. For instance, Rodrigo and Arenas (2008) identified three types of
employees; those that were committed, indifferent or dissident, regarding their reactions to
the implementation of CSR initiatives at their workplace. It would be reasonable to assume
that the dissident employee, the one who according to the authors does not accept the new
organisational social role, does not identify with the organisation, and has very little sense of
importance of CSR; is likely to be actively opposed to engaging in socially responsible
behaviours at work. In contrast, the committed employee who has a personal affinity towards
social responsibility and is accepting of the new organisational role, identifies strongly with
the organisation, and perceives a sense of importance in their work; is likely to make active
efforts to engage with various socially responsible behaviours and initiatives, with the
indifferent employee lying between the two, and adopting a more passive role.
Research has evidenced the effects of individual differences on individual reactions to CSR.
For instance, when referring to organisational attraction, when individuals themselves are
affined towards socio-environmental consciousness, they are also more likely to be attracted
to an organisation that is socially responsible (Tsai, Joe, Lin, and Wang, 2014). Rupp et al.
(2013) also point out the possible notable role of an individual’s moral identity. In addition,
Gellert and de Graaf (2012) further noted that when there are a greater number of older
workers within an organisation, the more likely it is that they consider ‘aging workforce
management’ as constituting CSR. Moreover, and more specific to ESR itself, Kim et al. (in
press) provided evidence that those leaders who were high in conscientiousness, had greater
workplace green behaviours, which in turn were positively related to individual workplace
green behaviours.
Nevertheless, Rupp and Mallory (2015) point to the black box of individual differences,
given the currently limited focus in research. They argue for research to address this niche
and in so doing look at factors such as gender differences, culture, age, and personal
orientations towards CSR. The current research thus posits this to be an interesting direction
for further research, which can help to build upon the findings of the current research, and
demarcate the effects of individual differences upon such relationships.

[315]
8.6.6. Dark side of ESR
To date, the studies that have studied micro-level CSR have focused on what can be termed
the ‘bright side’ of CSR, and have neglected what could be the ‘dark side’ of CSR. That is,
such research has had a tendency to focus on the resulting positive effects of CSR. There is
some research to suggest that outcomes of CSR are not necessarily always positive. For
instance, studies in this area have shown how perceptions of misallocated resources towards
CSR can engender negative reactions in the employees of an organisation (Mallory and Rupp,
in press). Similarly, Rodrigo and Arenas (2008) also outline the possible ‘dissident employee’
who is averse to the organisation’s CSR efforts, and who may thus attempt to actively
sabotage such CSR efforts. Furthermore, when organisational CSR efforts are viewed as
insincere, commonly termed green-washing, then this can also lead to negative outcomes
(Ramus and Montiel, 2005). Recently, Ormiston and Wong (2013) revealed that prior social
responsibility of CEOs was positively related to corporate social irresponsibility (CSiR). The
authors termed this ‘moral licensing’ whereby prior ESR provided ‘credits’ which allowed
CEOs the impetus to engage in CSiR.
Moral licensing refers to a phenomenon whereby individuals that have previously engaged in
what could be considered morally praiseworthy behaviour, come to believe that they have
moral leeway, and feel liberated to engage in more immoral behaviour (Monin and Miller,
2001). Merritt, Effron, and Monin (2010) argue that this is so because previously moral
behaviour assures individuals of their moral self-regard, and they therefore feel able to
engage in morally questionable behaviour without feeling that they are immoral beings. The
authors go on to discuss that this process may occur because previous moral behaviour
provides individuals with credits to engage in future negative behaviours, or because
previously positive behaviours change the meaning of future behaviours. Blanken et al.
(2015) in a recent meta-analysis on moral licensing further attested to such effects of moral
licensing.
Moreover, Klotz and Bolino (2013) note that due to previously engaging in positive
behaviours and thus gaining a moral license, individuals may be able to engage in negative
future behaviours without significant harm to their personal reputation, due to the previous
credits they have earned. They therefore point out that whilst research focuses on the positive
effects of behaviours such as OCBs, attention should also be placed on the observation that
engaging in these behaviours can also lead to engagement in deviant behaviours, and so a

[316]
more nuanced understanding of the interplay between positive and negative behaviours is
needed.
Such findings can also be applied within groups. Kouchaki (2011) provided consistent
evidence across five studies that an in-group members’ previously moral (non-
discriminatory) behaviour, provides a moral license for individuals to engage in morally
questionable (discriminatory) behaviour in the future. This thus provides evidence that it is
not just one’s own moral behaviour that is significant, rather others’ moral actions can also
provide individuals with the moral license they need to engage in morally dubious behaviours
in the near future.
More relevant to micro-CSR, Conway and Peetz (2012) investigated the effects of salient
moral behaviour on subsequent pro-social behaviour, specifically willingness to volunteer
and actual donations to charities. They showed that when individuals thought back to the
previously moral actions, they engaged in compensatory behaviour, and consequently
donated less money to charity. With regards to willingness to volunteer, when individuals
recalled their recent moral behaviour, they were less likely to express willingness to
volunteer. The opposite was true however, if individuals recalled their recent immoral
behaviour, as they were more likely to express willingness to volunteer; the latter engaging in
moral cleansing. Indeed, Jordan, Mullen, and Murnighan (2011) underscore the possibly
dynamic nature of moral behaviour in that, typical of a pendulum, it swings from moral
cleansing to moral licensing. Building upon this, it is possible that employee engagement in
CSR at a certain period could provide them with these moral credits causing them to engage
in socially irresponsible behaviours in the future. This again, would be a relevant area for
future enquiry, as well as determining how these possible negative effects arising from
engagement in ESR can be avoided.
[317]
8.7.Summary
This chapter has sought to provide a general overview of the findings from the scale
development, field, and time-lagged studies, and to collate them in order to provide more
definitive conclusions on the antecedent and boundary conditions of ESR. In so doing, efforts
have been made to identify the overarching contributions of the thesis, resulting from this
research series. The key limitations of the current research series have been noted, as well as
the resulting practical implications of the findings. Given the infancy of research on
employee engagement in CSR, special efforts have been made to provide future directions for
research, building on a multitude of possible avenues for prospective research enquiry.

[318]
Chapter 9: Conclusion
This thesis attempted to address the significant lacking in the research on CSR, specifically
micro-level CSR, by way of investigating employee engagement in the organisation’s CSR
activities. A triple-pronged research series was systematically presented in order to address
such a dearth. Firstly semi-structured qualitative interviews were conducted in order to verify
the five-faceted multi-dimensional conceptualisation of ESR, as well as for item generation
purposes. The resultant initial item pool underwent a test of content validity with subject-
matter expert ratings. After having primarily refined the scale, exploratory and confirmatory
factor analysis confirmed the factor structure of the ESR scale, as well as finalising the items
of the scale; resulting in a ten-item ESR scale, that taps into the social, philanthropy,
stakeholder, economic, and environmental dimensions of ESR.
An auxiliary aim of this thesis was to further explore possible determinants of employee
social responsibility. This was made possible after having developed the ESR scale. As a
result, the proposed relationships in the conceptual model underwent preliminary testing in a
field sample, consisting of two organisations from the professional financial services sector
and the commercial banking sector. Analyses revealed a moderating effect of assigned CSR
priority on the effects of TF on ESR at the individual level. At the group level, findings
demonstrated the existence of a three-way interaction effect between TF, assigned CSR
priority, and CSR climate on group ESR.
Given the cross-sectional nature of the field study, the predominantly Western sample, and
the limited sample size; an attempt was made to replicate the findings in a time-lagged study,
set within a simulated business game environment. Whilst the single moderating effect of
assigned CSR priority at the individual level was not replicated, findings indicated the
possible moderating effects of CSR climate on the effects of TF on ESR, at the group and
individual levels. Nevertheless the most consistent findings tended to be for the three-way
interaction effect between TF, CSR climate, and assigned CSR priority, on individual and
group ESR. This finding however inclined towards ESR measured at time two, as opposed to
time three, suggestive of short-term effects of the determinants of ESR. This relationship
remained after controlling for time one ESR, thus pointing towards a change in ESR over
time. Given the nature of the results highlighting the consistency of the three-way interaction

[319]
effect, the practical implications and theoretical contributions centred on this finding in the
general discussion. Moreover, the need to focus on the underlying mechanisms of the
relationships found within this thesis was predominantly singled out for future research.
This thesis made notable attempts to lay the groundwork upon which research at the micro-
level of CSR, specifically that which centres upon facilitating ESR, can flourish. The
distinguished benefits of CSR at the macro-level, for organisations that choose to become its
advocates, are commonly noted. It stands to reason, that there is also much to be gleaned
from encouraging those imperative stakeholders within the organisation, viz. the employees,
to become the torchbearers for their organisation’s CSR efforts. In so doing, the organisation
can justly hold the accolade for being socially responsible, through and through. After all, it
appears being good, truly does make good business sense.
[320]
10. References
Aguilera, R. V., Rupp, D. E., Williams, C. A., & Ganapathi, J. (2007). Putting the S back in
corporate social responsibility: A multilevel theory of social change in organisations.
Academy of Management Review, 32, 836-863.
Aguilera, R., Williams, C., Conley, J., & Rupp, D. E. (2006). Corporate governance and
social responsibility: A comparative analysis of the UK and the US. Corporate Governance:
An International Review, 14, 147-158.
Aguinis, H., & Glavas, A. (2013). Embedded versus peripheral corporate social
responsibility: Psychological foundations. Industrial and Organizational Psychology, 6, 314-
332.
Aguinis, H., Gottfredson, R. K., Culpepper, S. A. (2013). Best-practice recommendations for
estimating cross-level interaction effects using multilevel modeling. Journal of Management,
39, 1490-528.
Aguinis, H., & Glavas, A. (2012). What we know and don't know about corporate social
responsibility: A review and research agenda. Journal of Management, 38, 932-968.
Aguinis, H. (2011). Organizational responsibility: Doing good and doing well. In S. Zedeck
(Ed.), APA handbook of industrial and organizational psychology (Vol. 3, pp. 855-879).
Washington, DC: American Psychological Association.
Aiken, L. S., West, S. G., & Reno, R. R. (1991). Multiple regression: Testing and
interpreting interactions. California: Sage.
Albinger, H. S., & Freeman, S. J. (2000). Corporate social performance and attractiveness as
an employer to different job seeking populations. Journal of Business Ethics, 28(3), 243-253.
Alfaro-Barrantes, P. (2012). Examining the relationship between employees' perceptions of
and attitudes toward corporate social responsibility and organizational identification.
Electronic Theses, Treatises and Dissertations: Paper 4690.

[321]
Ali, I., Ur Rehman, K., Ali, S. I., Yousaf, J., & Zia, M. (2010). Corporate social responsibility
influences, employee commitment, and organizational performance. African Journal of
Business Management, 4 (12), 2796-2801.
Allen, T. D., Barnard, S., Rush, M. C., & Russell, J. E. (2000). Ratings of organizational
citizenship behavior: Does the source make a difference? Human Resource Management
Review, 10(1), 97-114.
Allen, C., Schewe, C. D., & Wijk, G. (1980). More on self-perception theory’s foot technique
in the pre call/mail survey setting. Journal of Marketing Research, 17, 498–502.
Almeida, F., & Sobral, F. (2010). The social commitment of Brazilian managers: The
concept, a scale, and an empirical study of corporate social responsibility. Latin American
Business Review, 11 (4), 293-316.
American Psychological Association (APA). (1995). Standards for educational and
psychological testing. Washington, DC: Author.
Anseel, F., Lievens, F., Schollaert, E., & Choragwicka, B. (2010). Response rates in
organizational science, 1995–2008: A meta-analytic review and guidelines for survey
researchers. Journal of Business and Psychology, 25(3), 335-349.
Antonakis, J., Fenley, M., & Liechti, S. (2011). Can charisma be taught? Tests of two
interventions. Academy of Management Learning & Education, 10(3), 374-396.
Appelbaum, S. H., Deguire, K. J., & Lay, M. (2005). The relationship of ethical climate to
deviant workplace behaviour. Corporate Governance, 5 (4), 43-55.
Ashforth, B. E., & Mael, F. (1989). Social identity theory and the organization. Academy of
Management Review, 14(1), 20-39.
Ates, A. (2008). Fundamental concepts in management research and ensuring research
quality: Focusing on case study method. European Academy of Management, 8, 1-35.
Avey, J. B., Wernsing, T. S., & Palanski, M. E. (2012). Exploring the process of ethical
leadership: The mediating role of employee voice and psychological ownership. Journal of
Business Ethics, 107, 21-34.

[322]
Avolio, B. J., Gardner, W. L., Walumbwa, F. O., Luthans, F., & May, D. R. (2004).
Unlocking the mask: A look at the process by which authentic leaders impact follower
attitudes and behaviors. The Leadership Quarterly, 15(6), 801-823.
Avolio, B. J. (2007). Promoting more integrative strategies for leadership theory-building.
American Psychologist, 62, 25-33.
Avolio, B. J., Walumbwa, F. O., & Weber, T. J. (2009). Leadership: Current theories,
research, and future directions. Annual Review Psychology, 60, 421-449.
Backhaus, K. B., Stone, B. A., & Heiner, K. (2002). Exploring the relationship between
corporate social performance and employer attractiveness. Business & Society, 41(3), 292-
318.
Bagozzi, R. P., & Yi, Y. (1990). Assessing method variance in multitrait-multimethod
matrices: The case of self-reported affect and perceptions at work. Journal of Applied
Psychology, 75, 547-560.
Bandura, A. (1997). Self-efficacy: The exercise of control. New York: Freeman.
Bandura, A. (1986). Social foundations of thought and action. Englewood Cliffs, NJ:
Prentice-Hall.
Bansal, P. (2003). From issues to actions: The importance of individual concerns and
organizational values in responding to natural environmental issues. Organization Science,
14(5), 510-527.
Bansal, P., & Roth, K. (2000). Why companies go green: A model of ecological
responsiveness. Academy of Management Journal, 43(4), 717-736.
Barkay, T. (2012). Employee volunteering: soul, body and CSR. Social Responsibility
Journal, 8 (1), 48-62.
Barley, S. R. (1990). Images of imaging: Notes on doing longitudinal field work.
Organization Science, 1, 220-247.
Barling, J., Christie, A., & Turner, N. (2008). Pseudo-transformational leadership: Towards
the development and test of a model. Journal of Business Ethics, 81, 851-861.

[323]
Barling, J., Loughlin, C., & Kelloway, E. K. (2002). Development and test of a model linking
safety-specific transformational leadership and occupational safety. Journal of Applied
Psychology, 87, 488-496.
Barling, J., Weber, T., & Kelloway, E. K. (1996). Effects of transformational leadership
training on attitudinal and financial outcomes: A field experiment. Journal of applied
psychology, 81(6), 827.
Barrick, M. R., Bradley, B. H., Kristof-Brown, A. L., & Colbert, A. E. (2007). The
moderating role of top management team interdependence: Implications for real teams and
working groups. Academy of Management Journal, 50(3), 544-557.
Bass, B. M. (1999). Two decades of research and development in transformational
leadership. European journal of work and organizational psychology, 8(1), 9-32.
Bass, B. (1997). Does the transactional- transformational leadership paradigm transcend
organizational and national boundaries? The American Psychologist, 52 (2), 130-139.
Bass, B. (1990). From transactional to transformational leadership: learning to share the
vision. Organizational Dynamics, 18 (3), 19-31.
Bass, B. M. & Avolio, B. J. (1990). Transformational leadership development: Manual for
the Multifactor Leadership Questionnaire. Palo Alto, CA: Consulting Psychologist Press.
Bauman, C. W., & Skitka, L. J. (2013). Corporate social responsibility as a source of
employee satisfaction. Research in Organizational Behavior, 32, 63-86.
Beal, D. J., Cohen, R. R., Burke, M. J., & McLendon, C. L. (2003). Cohesion and
performance in groups: A meta-analytic clarification of construct relations. Journal of
Applied Psychology, 88, 989-1004.
Bedeian, A. G., & Armenakis, A. A. (1981). A path-analytic study of the consequences of
role conflict and ambiguity. Academy of Management Journal, 24 (2), 417-424.
Behrend, T. S., Baker, B. A., & Thompson, L. F. (2009). Effects of pro-environmental
recruiting messages: The role of organizational reputation. Journal of Business and
Psychology, 24, 341-350.

[324]
Bennett, R. J., & Robinson, S. L. (2000). Development of a measure of workplace
deviance. Journal of applied psychology, 85(3), 349.
Bentler, P. M. (2007). On tests and indices for evaluating structural models. Personality and
Individual Differences, 42, 825-829.
Bentler, P. M. (1990). Comparative fit indexes in structural models. Psychological Bulletin,
107, 238-246.
Bentler, P. M., & Bonett, D. G. (1980). Significance tests and goodness of fit in the analysis
of covariance structures. Psychological Bulletin, 88, 588-606.
Berger, I. E., Cunningham, P. H., & Drumwright, M. E. (2006). Identity, identification, and
relationship through social alliances. Journal of the Academy of Marketing Science, 34 (2),
128-137.
Bettencourt, L. A., & Brown, S. W. (1997). Contact employees: Relationships among
workplace fairness, job satisfaction and prosocial service behaviors. Journal of
retailing, 73(1), 39-61.
Bhattacharya, C. B., Korschun, D., & Sen, S. (2009). Strengthening stakeholder–company
relationships through mutually beneficial corporate social responsibility initiatives. Journal of
Business Ethics, 85(2), 257-272.
Bhattacharya, C. B., Sen, S., & Korschun, D. (2008). Using corporate social responsibility to
win the war for talent. MIT Sloan Management Review, 49 (2), 36-44.
Bissing-Olson, M. J., Iyer, A., Fielding, K. S., & Zacher, H. (2013). Relationships between
daily affect and proenvironmental behavior at work: The moderating role of pro-
environmental attitude. Journal of Organizational Behavior, 34, 156-175.
Blanken, I., van de Ven, N., & Zeelenberg, M. (2015). A meta-analytic review of moral
licensing. Personality and Social Psychology Bulletin, 41(4), 540-558.
Blau, P. (1964). Exchange and Power in Social Life. New York: Wiley
Bliese, P. D. (2000). Within-group agreement, non-independence, and reliability:
Implications for data aggregation and analysis. In K. J. Klein & S. W. Kozlowski (Eds.),

[325]
Multilevel theory, research, and methods in organizations (pg. 349 –381). San Francisco:
Jossey-Bass.
Blome, C. & Paulraj, A. (2013). Ethical climate and purchasing social responsibility: A
benevolence focus. Journal of Business Ethics, 116, 567-585.
Boal, K. B., & Peery, N. (1985). The cognitive structure of corporate social responsibility.
Journal of Management, 11 (3), 71-82.
Boiral, O., & Paillé, P. (2012). Organizational citizenship behaviour for the environment:
Measurement and validation. Journal of business ethics, 109(4), 431-445.
Bolton, S. C., Kim, R. C-H., & O'Gorman, K. D. (2011). Corporate social responsibility as a
dynamic internal organizational process: A case study. Journal of Business Ethics, 101, 61-
74.
Booth, J. E., Won Park, K., & Glomb, T. K. (2009). Employer-supported volunteering
benefits: gift exchange among employers, employees, and volunteer organizations. Human
Resource Management, 48 (2), 227-249.
Borkenau, P., & Ostendorf, F. (1990). Comparing exploratory and confirmatory factor
analysis: A study on the 5-factor model of personality. Personality and Individual
differences, 11(5), 515-524.
Brammer, S., Millington, A., & Rayton, B. (2007). The contribution of corporate social
responsibility to organizational commitment. International Journal of Human Resource
Management, 18, 1701-1719.
Brammer, S. J., & Pavelin, S. (2006). Corporate reputation and social performance: The
importance of fit. Journal of Management Studies, 43(3), 435-455.
Branson, R. (2013). Screw business as usual. UK: Ebury Publishing.
Braun, S., Peus, C., Weisweiler, S., & Frey, D. (2013). Transformational leadership, job
satisfaction, and team performance: A multilevel mediation model of trust. The Leadership
Quarterly, 270-283.

[326]
Brockner, J., Senior, D., & Welch, W. (2014). Corporate volunteerism, the experience of
self-integrity, and organizational commitment: evidence from the field. Social Justice
Research, 27, 1-23.
Brown, M. E., Trevino, L. K., & Harrison, D. A. (2005). Ethical leadership: A social learning
perspective for construct development and testing. Organizational Behavior and Human
Decision Processes, 97, 117-134.
Brown, M. E., & Trevino, L. K. (2006). Ethical Leadership: A review and future directions.
The Leadership Quarterly, 17, 595-616.
Bryk, A. S., & Raudenbush, S. W. (1992). Hierarchical linear models: applications and data
analysis methods. Newbury Park, CA: Sage.
Buehler, V. M., & Shetty, Y. K. (1976). Managerial response to social responsibility
challenge. Academy of Management journal, 19(1), 66-78.
Burchard, M. (2011). Ethical dissonance and response to destructive leadership: A proposed
model. Emerging Leadership Journeys, 4 (1), 154-176.
Burtscher, M. J., & Meyer, B. (2014). Promoting good decisions: How regulatory focus
affects group information processing and decision-making. Group Processes & Intergroup
Relations, 17 (5), 663-681.
Bycio, P., Hackett, R. D., & Allen, J. S. (1995). Further assessments of Bass’s (1985)
conceptualization of transactional and transformational leadership. Journal of Applied
Psychology, 80, 468-478.
Caillier, J. G. (in press). Linking transformational leadership to self-efficacy, extra-role
behaviors, and turnover intentions in public agencies: The mediating role of goal clarity.
Administration & Society, 0095399713519093.
Calabrese, A., & Lancioni, F. (2008). Analysis of corporate social responsibility in the
service sector: Does there exist a strategic path? Knowledge and Process Management, 15
(2), 107-125.
Caligiuri, P., Mencin, A., & Jiang, K. (2013). Win-win-win: The influence of company -
sponsored volunteerism programs on employees, NGOs, and business units. Personnel
Psychology, 66, 825-860.

[327]
Campion, M. A., Medsker, G. J., & Higgs, A. C. (1993). Relations between work group
characteristics and effectiveness: Implications for designing effective work groups. Personnel
Psychology, 46, 823-850.
Carmeli, A., Gillat, G., & Waldman D. A. (2007). The role of perceived organizational
performance in organizational identification, adjustment and job performance. Journal of
Management Studies, 44(6), 972-992.
Carmeli, A., Gelbard, R., & Gefen, D. (2010). The importance of innovation leadership in
cultivating strategic fit and enhancing firm performance. Leadership Quarterly, 21, 339-349.
Carmines, E. G., & McIver, J. P. (1981). Analyzing models with unobserved variables:
Analysis of covariance structures. Social measurement: Current issues, 65-115.
Carroll, A. B.., & Buchholtz, A. K. (2014). Business and Society: Ethics, Sustainability, and
Stakeholder Management. Stamford, CT: Cengage Learning.
Carroll, A. B. (1991). The pyramid of corporate social responsibility: Toward the moral
management of organizational stakeholders. Business Horizons, 34(4), 39-48.
Carroll, A. B. (1979). A three-dimensional conceptual model of corporate social
performance. Academy of Management Review, 4, 497-505.
Cattell, R. B. (1966). The scree test for the number of factors. Multivariate behavioral
research, 1(2), 245-276.
Celma, D., Martínez-Garcia, E., & Coenders, G. (2014). Corporate social responsibility in
Human Resource Management: An analysis of common practices and their determinants in
Spain. Corporate Social Responsibility and Environmental Management, 21(2), 82-99.
Cha, J., Chang, Y. K., & Kim, T-Y. (2014). Person–Organization fit on prosocial identity:
Implications on employee outcomes. Journal of Business Ethics, 123(1), 57-69.
Chan, D. (1998). Functional relations among constructs in the same content domain at
different levels of analysis: A typology of composition models. Journal of applied
psychology, 83(2), 234.

[328]
Charbonnier-Voirin, A., El Akremi, A., & Vandenberghe, C. (2010). A multilevel model of
transformational leadership and adaptive performance and the moderating role of climate for
innovation. Group and Organization Management, 35 (6), 699-726.
Chen, Y-R R., & Hung-Basecke, C-J F. (2014). Examining the internal aspect of corporate
social responsibility (CSR): Leader behavior and employee CSR participation.
Communication Research Reports, 31 (2), 210-220.
Chen, Y., Tang, G., Jin, J., Li, J., & Paillé, P. (2014). Linking market orientation and
environmental performance: The influence of environmental strategy, employee’s
environmental involvement, and environmental product quality. Journal of Business
Ethics, 127(2), 479-500.
Chen, Y-S. & Chang, C-H. (2013). The determinants of green product development
performance: Green dynamic capabilites, green transformational leadership, and green
creativity. Journal of Business Ethics, 116, 107-119.
Chen, G., & Bliese, P. D. (2002). The role of different levels of leadership in predicting self-
and collective efficacy: Evidence for discontinuity. Journal of Applied Psychology, 87, 549-
556.
Chin, M. K., Hambrick, D.C., & Trevino, L.K. (2013). Political ideologies of CEOs: The
influence of executives’ values on CSR. Administrative Science Quarterly, 58, 197-232.
Christensen, L. J., Mackey, A., & Whetten, D. (2014). Taking responsibility for corporate
social responsibility: The role of leaders in creating, implementing, sustaining, or avoiding
socially responsible firm behaviors. Academy of Management Perspectives, 28(2), 164-178.
Churchill Jr, G. A., & Peter, J. P. (1984). Research design effects on the reliability of rating
scales: a meta-analysis. Journal of marketing research, 360-375.
Churchill, G. A. (1979). A paradigm for developing better measures of marketing constructs.
Journal of Marketing Research, 16 (1), 64-73.
Clarke, S. (2013). Safety Leadership: A meta-analytic review of transformational and
transactional leadership styles as antecedents of safety behaviours. Journal of Occupational
and Organizational Psychology, 86, 22-49.
[329]
Clark, P. (1985). A review of the theories of time and structure for organizational sociology.
Research in the Sociology of Organizations, 4, 35-79.
Cohen, J. (1988). Statistical power analysis for the behavioural science (2nd ed.). New Jersey:
Erlbaum Associates.
Colbert, A. E., & Witt, L. A. (2009). The role of goal-focused leadership in enabling the
expression of conscientiousness. Journal of Applied Psychology, 94 (3), 790.
Colbert, A. E., Kristof-Brown, A. L., Bradley, B. H., & Barrick, M. R. (2008). CEO
transformational leadership: The role of goal importance congruence in top management
teams. Academy of Management, 51 (1), 81-96.
Collier, J., & Esteban, R. (2007). Corporate social responsibility and employee commitment.
Business Ethics: A European Review, 16 (1), 19-33.
Collins, M. W., & Morris, S. B. (2008). Testing for adverse impact when sample size is
small. Journal of Applied Psychology, 93, 463- 471
Conway, P., & Peetz, J. (2012). When does feeling moral actually make you a better person?
Conceptual abstraction moderates whether past moral deeds motivate consistency or
compensatory behavior. Personality and Social Psychology Bulletin, 38, 907–919.
Conway, J. M., & Huffcutt, A. I. (2003). A review and evaluation of exploratory factor
analysis practices in organizational research. Organizational research methods, 6(2), 147-
168.
Cook, T. D., Campbell, D. T., Peracchio, L., (1990). Quasi experimentation. In: Dunnette, J.
D., Hough, L. M. (Eds.), Handbook of Industrial and Organizational Psychology, pp. 491-
576. Palo Alto, CA: Consulting Psychologists Press.
Crilly, D., Schneider, S. C., & Zollo, M. (2011). Psychological antecedents to socially
responsible behavior. European Management Review, 5(3), 175-190.
Cropanzano, R., & Mitchell, M. S. (2005). Social exchange theory: An interdisciplinary
Review. Journal of Management, 31(6), 874-900.

[330]
Curras-Perez, R., Bigne-Alcaniz, E., & Alvarado-Herrera, A. (2009). The role of self-
definitional principles in consumer identification with a socially responsible company.
Journal of Business Ethics, 89, 547-564.
Dadhich, A., & Bhal, K. T. (2008). Ethical Leader Behaviour and Leader-Member Exchange
as Predictors of Subordinate Behaviours. Vikalpa, 33(4), 15.
Dahlsrud, A. (2008). How corporate social responsibility is defined: An analysis of 37
definitions. Corporate Social Responsibility and Environment Management, 15, 1-13.
Dalal, D. K., & Zickar, M. J. (2012). Some common myths about centering predictor
variables in moderated multiple regression and polynomial regression. Organizational
Research Methods, 15, 339-362
Dalton, D. R., Aguinis, H., Dalton, C. A., Bosco, F. A., & Pierce, C. A. (2012). Revisiting the
file drawer problem in meta-analysis: An empirical assessment of published and non-
published correlation matrices. Personnel Psychology, 65, 221-249.
Davies, I. A., & Crane, A. (2010). Corporate social responsibility in small-and medium-size
enterprises: investigating employee engagement in fair trade companies. Business Ethics: A
European Review, 19(2), 126-139.
Davis, J. H., Schoorman, F. D., & Donaldson, L. (1997). Toward a stewardship theory of
management. Academy of Management review, 22(1), 20-47.
Dawson, J. F. (2003). Do we have enough? The accuracy of incomplete data from small
groups. Academy of Management Best Paper Proceedings.
del Brío, J. Á., Fernandez, E., & Junquera, B. (2007). Management and employee
involvement in achieving an environmental action-based competitive advantage: an empirical
study. The International Journal of Human Resource Management, 18(4), 491-522.
Delmas, M., & Pekovic, S. (2013). Environmental standards and labor productivity. Journal
of Organizational Behavior, 34(2), 230-252.
Den Hartog, D. N., & Belschak, F. D. (2012). When does transformational leadership
enhance employee proactive behavior? The role of autonomy and role breadth self-
efficacy. Journal of Applied Psychology, 97 (1), 194.

[331]
Den Hartog, D. N., & De Hoogh, A. H. B. (2009). Empowering behaviour and leader fairness
and integrity: Studying perceptions of ethical leader behaviour from a levels-of-analysis
perspective. European Journal of Work and Organizational Psychology, 18 (2), 199-230.
De Roeck, K., Marique, G., Stinglhamber, F., & Swaen, V. (2014). Understanding
employees’ responses to corporate social responsibility: Mediating roles of overall justice and
organizational identification. The International Journal of Human Resource Management,
25(1), 91-112.
DeShon, R. P., Kozlowski, S. W., Schmidt, A. M., Milner, K. R., & Wiechmann, D. (2004).
A multiple-goal, multilevel model of feedback effects on the regulation of individual and
team performance. Journal of applied psychology, 89(6), 1035-1056.
DeVellis, R. F. (2012). Scale development: Theory and application (3rd ed.). Chapel Hill,
USA: Sage.
Diamantopoulos, A. and Siguaw, J. A. (2000). Introducing LISREL. London: Sage
Publications.
DiCicco‐Bloom, B., & Crabtree, B. F. (2006). The qualitative research interview. Medical
education, 40(4), 314-321.
Downey, S. N., van der Werff, L., Thomas, K. M., & Plaut, V. C. (2015). The role of
diversity practices and inclusion in promoting trust and employee engagement. Journal of
Applied Social Psychology, 45(1), 35-44.
Druskat, V. U. (1994). Gender and leadership style: transformational and transactional
leadership in the Roman Catholic Church. Leadership Quarterly, 5, 99-119.
Du, S., Swaen, V., Lindgreen, A., & Sen, S. (2013). The roles of leadership styles in
Corporate Social Responsibility, Journal of Business Ethics, 114, 155-169.
Du, S., Bhattacharya, C. B., & Sen, S. (2010). Maximising business returns to corporate
social responsibility (CSR): The role of CSR communication. International Journal of
Management Reviews, 12(1), 8-19.
Du, S., Bhattacharya, C. B., & Sen, S. (2007). Reaping relational rewards from corporate
social responsibility: The role of competitive positioning. International journal of research in
marketing, 24(3), 224-241.

[332]
Dutton, J. E., & Dukerich, J. M. (1991). Keeping an eye on the mirror: image and identity in
organizational adaptation. Academy of Management Journal, 34, 517-54.
Dvir, T., Eden, D., Avolio, B. J., & Shamir, B. (2002). Impact of transformational leadership
on follower development and performance: a field experiment. Academy of Management
Journal, 45 (4), 735-744.
Easterby-Smith, M., Thorpe, R., & Lowe, A. (2004). Management Research (2nd ed.).
London: Sage Publications.
Echambi, R., & Hess, J. D. (2007). Mean-centering does not alleviate collinearity problems in
moderated multiple regression models. Marketing Research, 26, 438-445.
Eberhardt-Toth, E., & Wasieleski, D. M. (2013). A cognitive elaboration model of
sustainability decision making: Investigating financial managers’ orientation toward
environmental issues. Journal of Business Ethics, 117, 735-751.
Edmondson, A. C., & McManus, S. E. (2007). Methodological fit in management field
research. Academy of Management Review, 32, 1155-1179.
Edwards, P., Roberts, I., Clarke, M., DiGuiseppi, C., Pratap, C., Wentz, R., et al. (2002).
Increasing response rates to postal questionnaires: Systematic review. British Medical
Journal, 324, 1-9.
Eisenbeiss, S. A., van Knippenberg, D., & Boerner, S. (2008). Transformational leadership
and team innovation: integrating team climate principles. Journal of applied
psychology, 93(6), 1438.
Eisenbeiss, S. A., & Brodbeck, F. (2014). Ethical and unethical leadership: A cross-cultural
and cross-sectional analysis. Journal of Business Ethics, 122, 343-359.
Eisinga, R., Te Grotenhuis, M., & Pelzer, B. (2013). The reliability of a two-item scale:
Pearson, Cronbach, or Spearman-Brown? International journal of public health, 58(4), 637-
642.
El Akremi, A., Gond, J. P., Swaen, V., De Roeck, K., & Igalens, J. (in press). How Do
Employees Perceive Corporate Responsibility? Development and Validation of a
Multidimensional Corporate Stakeholder Responsibility Scale. Journal of Management,
0149206315569311.

[333]
Elkington, J. (1999). Triple bottom-line reporting: looking for balance. Australian CPA, 69,
18-21.
Ellemers, N., Kingma, L., van de Burgt, J., & Barreto, M. (2011). Corporate social
responsibility as a source of organizational morality, employee commitment and satisfaction.
Journal of Organizational Moral Psychology, 1 (2), 97-124.
Ellis, A. D. (2008). The impact of corporate social responsibility on employee attitudes and
behaviours. Academy of Management Annual Meeting Proceedings, 8 (1), 1 -6.
Elmore, T. P. (2011). Promoting ethical behaviour among local government employees: The
roles of ethical leadership, ethics codes, training, and audits. Retrieved 1st July 2015 from:
https://mospace.umsystem.edu/xmlui/bitstream/handle/10355/10852/ElmoreProEthBeh.pdf?s
equence=1
Ehrhart, M. G. (2004). Leadership and procedural justice climate as antecedents of unit-level
organizational citizenship behavior. Personnel Psychology, 57, 61-94.
Emerson, R. M. (1976). Social exchange theory. Annual Review of Sociology, 2, 335-362.
Enders, C. K., & Tofighi, D. (2007). Centering predictor variables in cross-sectional
multilevel models: A new look at an old issue. Psychological Methods, 12, 121-138.
Evans, W. R., Goodman, J. M., & Davis, W. D. (2010). The impact of perceived corporate
citizenship on organizational cynicism, OCB, and employee deviance. Human
Performance, 24(1), 79-97.
Fabrigar, L. R., Wegener, D. T., MacCallum, R. C., & Strahan, E. J. (1999). Evaluating the
use of exploratory factor analysis in psychological research.Psychological methods, 4(3),
272-299.
Fabrizi, M., Mallin, C., & Michelon, G. (2014). The role of CEO’s personal incentives in
driving corporate social responsibility. Journal of Business Ethics, 124(2), 311-326.
Falkenberg, J., & Brunsael, P. (2011). Corporate social responsibility: A strategic advantage
or a strategic necessity? Journal of Business Ethics, 99, 9-16.

[334]
Farooq, O., Payaud, M., Merunka, D., & Valette-Florence, P. (2014). The impact of corporate
social responsibility on organizational commitment: Exploring multiple mediation
mechanisms. Journal of Business Ethics, 125, 563-580.
Fedor, D. B., Caldwell, S., & Herold, D. M. (2006). The effects of organizational changes on
employee commitment: A multilevel investigation. Personnel Psychology, 59(1), 1-29.
Ferreira, P., & Real de Oliveira, E. (2014). Does corporate social responsibility impact on
employee engagement? Journal of Workplace Learning, 26(4), 232-247.
Fields, D. L. (2002). Taking the measure of work. California: Sage Publications.
Flammer, C. (2013). Corporate social responsibility and shareholder reaction: The
environmental awareness of investors. Academy of Management Journal, 56(3), 758-781.
Ford, J. K., MacCallum, R. C., & Tait, M. (1986). The application of exploratory factor
analysis in applied psychology: A critical review and analysis. Personnel Psychology, 59,
291-314.
Fornell, C., & Larcker, D.F. (1981). Evaluating structural equation models with unobservable
variables and measurement error. Journal of Marketing Research, 18, 39-50.
Freeman, E., & Moutchnik, A. (2013). Stakeholder management and CSR: questions and
answers. Umwelt Wirtschafts Forum, 21(1-2), 5-9.
Freeman, R. E. (1984). Strategic management: A stakeholder approach. Englewood Cliffs,
NJ: Prentice-Hall.
Friedman, M. (1970). The social responsibility of business is to increase its profits. The New
York Times Magazine, 13th September, 1970.
Friedrich, R. (2012). Authentic leadership: A possible route to sustainable trust? Retrieved
30th June 2015 from: http://arno.unimaas.nl/show.cgi?fid=24007.
Frese, M., Beimel, S., & Schoenborn, S. (2003). Action training for charismatic leadership:
Two evaluations of studies of a commercial training module on inspirational communication
of a vision. Personnel Psychology, 56(3), 671-698.
[335]
Frese, M., Fay, D., Hilburger, T., Leng, K., & Tag, A. (1997). The concept of personal
initiative: Operationalization, reliability and validity in two German samples. Journal of
occupational and organizational psychology, 70, 139-162.
Fry, E. (1977). Fry's readability graph: Clarifications, validity, and extension to level
17. Journal of reading, 242-252.
Fu, W., & Deshpande, S.P. (2014). The impact of caring climate, job satisfaction and
organizational commitment on job performance of employees in a China’s insurance
company. Journal of Business Ethics, 124, 339-349.
Fu, P. P., Tsui, A. S., Liu, J., & Li, L. (2010). Pursuit of whose happiness? Executive leaders’
transformational behaviors and personal values. Administrative Science Quarterly, 55, 222-
254.
Gagne, M., & Deci, E. L. (2005). Self-determination theory and work motivation. Journal of
Organizational Behavior, 26, 331-362.
Galaskiewicz, J. (1997). An urban grants economy revisited: Corporate charitable
contributions in the Twin Cities. Administrative Science Quarterly, 42, 445-471.
Galbreath, J. (2010). How does corporate social responsibility benefit firms? Evidence from
Australia. European Business Review, 22 (4), 411-431.
Galpin, T., & Lee Whittington, J. (2012). Sustainability leadership: from strategy to
results. Journal of Business Strategy, 33(4), 40-48.
Garay, L., & Font, X. (2012). Doing good to do well? Corporate social responsibility reasons,
practices and impacts in small and medium accommodation enterprises. International
Journal of Hospitality Management, 31(2), 329-337.
Gardner, W. L., Avolio, B. J., Luthans, F., May, D. R., & Walumbwa, F. (2005). 'Can you see
the real me?' A self-based model of authentic leader and follower development. The
Leadership Quarterly, 16(3), 343-372.
Gavin, M. B., & Hofmann, D. A. (2002). Using hierarchical linear modeling to investigate
the moderating influence of leadership climate. Leadership Quarterly, 13, 15–33.

[336]
Gelade, G. A. (2006). But what does it mean in practice? The Journal of Occupational and
Organizational Psychology from a practitioner perspective. Journal of Occupational and
Organizational Psychology, 79(2), 153-160.
Gellert, F. J., & Graaf, F. J. (2012). Corporate social responsibility and aging workforces: an
explorative study of corporate social responsibility implementation in small‐and
medium‐sized enterprises. Business Ethics: A European Review, 21(4), 353-363.
George, J. M., & Jones, G. R. (2000). The role of time in theory and theory building. Journal
of Management, 26, 657- 684.
George, J. M. (1990). Personality, affect and behavior in groups. Journal of Applied
Psychology, 75, 698 -709.
Geva, A. (2008). Three models of corporate social responsibility: Interrelationships between
theory, research, and practice. Business and Society Review, 113 (1), 1-41.
Giannarakis, G., & Theotokas, I. (2011). The effect of financial crisis in corporate social
responsibility performance. International Journal of Marketing Studies, 3(1), 2-10
Glavas, A., & Godwin, L. N. (2013), Is the perception of ‘goodness’ good enough? Exploring
the relationship between perceived corporate social responsibility and employee
organizational identification. Journal of Business Ethics, 114, 15-27.
Godos-díez, J.-L., Fernández-Gago, R., & Martínez-Campillo, A. (2011). How important are
CEOs to CSR practices? An analysis of the mediating effect of the perceived role of ethics
and social responsibility. Journal of Business Ethics, 98, 531-548.
Gond, J-P, El Akremi, A., Swaen, V., & Babu, N. (working paper). The psychological micro-
foundations of corporate social responsibility: A systematic review focused on employees.
Journal of Organizational Behavior.
Gond, J.-P., El Akremi, A., Igalens, J., & Swaen, V. (2010). A corporate social performance-
corporate financial performance behavioural model for employees. In C. Bhattacharya, D.
Levine, C. Smith, & D. Vogel (Eds.), Corporate responsibility and global business:
Implications for corporate and marketing strategy (pp. 13–48). Cambridge: Cambridge
University Press.

[337]
Gorsuch, R. L. (1997). Exploratory factor analysis: Its role in item analysis. Journal of
personality assessment, 68(3), 532-560.
Granger, C. J. W. (1969). Investigating causal relations by econometric models and cross-
spectral methods. Econometrica, 37, 424-438.
Grant, A. M. (2012). Giving time, time after time: Work design and sustained employee
participation in corporate volunteering. Academy of Management Review, 37, 589-615.
Grant, M. A., Dutton, J. E., & Rosso, B. D. (2008). Giving commitment: Employee support
programs and the prosocial sensemaking process. Academy of Management Journal, 51 (5),
898-918.
Graves, L. M., Sarkis, J., & Zhu, Q. (2013). How transformational leadership and employee
motivation combine to predict employee proenvironmental behaviors in China. Journal of
Environmental Psychology, 35, 81-91.
Greening, D. W., & Turban, D. B. (2000). Corporate social performance as a competitive
advantage in attracting a quality workforce. Business and Society, 39(3), 254-303.
Greening, D.W., & Gray, B. (1994). Testing a model of organizational response to social and
political issues. Academy of Management Journal, 37(3), 467-498.
Greenleaf, R. K. (1996). On becoming a servant leader. San Francisco: Jossey-Bass.
Griffin, J. J., Bryant, A., & Koerber, C. P. (2014). Corporate responsibility and employee
relations from external pressure to action. Group & Organization Management, 1-27.
Griffith, J. (2004). Relation of principal transformational leadership to school staff job
satisfaction, staff turnover, and school performance. Journal of Educational Administration,
42 (3), 333-356.
Grojean, M. H., Resick, C. J., Dickson, M. W., & Smith, D. B. (2004). Leaders, values, and
organizational climate: Examining leadership strategies for establishing an organizational
climate regarding ethics. Journal of Business Ethics, 55, 223-241.
Groves, K. S. (2014). Examining leader-follow congruence of social responsibility values in
transformational leadership. Journal of Leadership & Organizational Studies, 21 (3), 227-
243.

[338]
Groves, K. S., & LaRocca, M. A. (2011). An empirical study of leader ethical values,
transformational and transactional leadership, and follower attitudes towards corporate social
responsibility. Journal of Business Ethics, 103, 511-528.
Groves, K. S. (2005). Gender differences in social and emotional skills and charismatic
leadership. Journal of Leadership & Organizational Studies, 11(3), 30-46.
Gully, S. M., Phillips, J. M., Castellano, W. G., Han, K., & Kim, A. (2013). A mediated
moderation model of recruiting socially and environmentally responsible job applicants.
Personnel Psychology, 66(4), 935-973.
Gully, S. M., Incalcaterra, K. A., Joshi, J.M., Beaubien, J. M. (2002). A metaanalysis of
team-efficacy, potency, and performance: interdependence and level of analysis as
moderators of observed relationships. Journal of Applied Psychology, 87, 819–835.
Gupta, V. K., Huang, R., & Niranjan, S. (2010). A longitudinal examination of the
relationship between team leadership and performance. Journal of Leadership &
Organizational Studies, 17(4), 335-350.
Haleblian, J., & Finkelstein, S. (1993). Top management team size, CEO dominance, and
firm performance: The moderating roles of environmental turbulence and
discretion. Academy of management journal, 36(4), 844-863.
Hamstra, M. R. W., Sassenberg, K., Van Yperen, N. W., & Wisse, B. (2014). Followers feel
valued-When leaders' regulatory focus makes leaders exhibit behavior that fits followers'
regulatory focus. Journal of Experimental Social Psychology, 51, 34-40.
Hamstra, M. R. W., Van Yperen, N. W., Wisse, B., & Sassenberg, K. (2011).
Transformational-transactional leadership styles and followers’ regulatory focus. Journal of
Personnel Psychology, 10 (4), 182-186.
Hannah, S. T., Avolio, B. J., & Walumbwa, F. O. (2011). Relationship between authentic
leadership, moral courage, and ethical and pro-social behaviors. Business Ethics Quarterly,
21(4), 555-578.
Hansen, S. D., Dunford, B. B., Boss, A. D., Boss, R. W., & Angermeier, I. (2011). Corporate
social responsibility and the benefits of employee trust: A cross-disciplinary perspective.
Journal of Business Ethics, 102, 29-45.

[339]
Harris, M. M., & Schaubroeck, J. (1988). A meta‐analysis of self‐supervisor, self‐peer, and
peer‐supervisor ratings. Personnel Psychology, 41(1), 43-62.
Harrison, R. L., & Reilly, T. M. (2011). 2011). Mixed methods designs in marketing
research. Qualitative Market Research: An International Journal, 14 (1), 7-16.
Hayes, A. F. (2012). PROCESS: A versatile computational tool for observed variable
mediation, moderation, and conditional process modeling [white paper]. Retrieved from
http://www. afhayes.com
Hayes, A. F., Glynn, C. J., & Huge, M. E. (2012). Cautions regarding the interpretation of
regression coefficients and hypothesis tests in regression models with interactions.
Communication Methods and Measures, 6, 1-12.
Hayes, A. F., & Matthes, J. (2009). Computational procedures for probing interactions in
OLS and logistic regression: SPSS and SAS implementations. Behavior Research Methods,
41, 924-936.
Hemingway, C. A., & Maclagan, P. W. (2004). Managers' personal values as drivers of
Corporate Social Responsibility. Journal of Business Ethics, 50, 33-44.
Herman, H. M., Huang, X., & Lam, W. (2013). Why does transformational leadership matter
for employee turnover? A multi-foci social exchange perspective. The Leadership
Quarterly, 24(5), 763-776.
Higgins, E. T. (1998). Promotion and prevention: Regulatory focus as a motivational
principle. Advances in Experimental Social Psychology, 30, 1-46.
Higgins, E. T., Friedman, R. S., Harlow, R. E., Idson, L. C., Ayduk, O. N., & Taylor, A.
(2001). Achievement orientations from subjective histories of success: Promotion pride
versus prevention pride. European Journal of Social Psychology, 31, 3-23.
Hinkin, T. R. (1998). A brief tutorial on the development of measures for use in survey
questionnaires. Organizational research methods, 1(1), 104-121.
Hinkin, T. R. (1995). A review of scale development practices in the study of organisations.
Journal of Management, 21 (5), 967-988.

[340]
Hofmann, D. A., Morgeson, F. P., & Gerras, S. J. (2003). Climate as a moderator of the
relationship between leader-member exchange and content-specific citizenship: Safety
climate as an exemplar. Journal of Applied Psychology, 88 (1), 170-178.
Hofmann, D. A., & Gavin, M. B. (1998). Centering decisions in hierarchical linear models:
Theoretical and methodological implications for organizational science. Journal of
Management, 24, 623-641.
Hofmann, D. A. (1997). An overview of the logic and rationale of hierarchical linear
models. Journal of management, 23(6), 723-744.
Holtgraves, T. (2004). Social desirability and self-reports: Testing models of socially
desirable responding. Personality and Social Psychology Bulletin, 30(2), 161-172.
House, R. J. (1977). A 1976 theory of charismatic leadership. Faculty of Management
Studies, University of Toronto.
Howe, K. R. (1988). Against the quantitative-qualitative incompatibility thesis, or, dogmas
die hard. Educational Researcher, 17, 10-16.
Hu, L.-T., & Bentler, P. M. (1999). Cutoff criteria for fit indexes in covariance structure
analysis: Conventional criteria versus new alternatives. Structural Equation Modeling, 6, 1-
55.
Hu, L.-T., & Bentler, P. M. (1998). Fit indices in covariance structure modeling: Sensitivity
to underparameterized model misspecification. Psychological Methods, 3, 424-453.
Ivancevich, J. M. (1976). Effects of goal setting on performance and job satisfaction. Journal
of Applied Psychology, 61(5), 605.
James, L. R., & Jones, A. P. (1974). Organizational climate: A review of theory and research.
Psychological Bulletin, 81, 1096-1112.
James, L. R., Demaree, R. G., & Wolf, G. (1984). Estimating within-group interrater
reliability with and without response bias. Journal of applied psychology, 69(1), 85.
Javidan, M., Dorfman, P. W., De Luque, M. S., & House, R. J. (2006). In the eye of the
beholder: Cross cultural lessons in leadership from Project GLOBE. The Academy of
Management Perspectives, 20(1), 67-90.

[341]
Jiang, L., Yu, G., Li, Y., & Li, F. (2010). Perceived colleagues’ safety knowledge/behavior
and safety performance: Safety climate as a moderator in a multilevel study. Accident
Analysis & Prevention, 42(5), 1468-1476.
Jick, T. D. (1979). Mixing qualitative and quantitative methods: Triangulation in action.
Administrative Science Quarterly, 24, 602-611.
Jiraporn, P., & Chintrakarn, P. (2013). How do powerful CEOs view corporate social
responsibility (CSR)? An empirical note. Economics Letters, 119, 344-347.
Jo, H., & Harjoto, M. (2012). The causal effect of corporate governance on corporate social
responsibility. Journal of Business Ethics, 106, 53-72.
Johnson, C. E., Shelton, P. M., & Yates, L. (2012). Nice guys (and gals) finish first: ethical
leadership and organisational trust, satisfaction, and effectiveness. International Leadership
Journal, 4 (1), 3-19.
Johnston, H. R. (1976). A new conceptualization of source of organizational climate.
Administrative Science Quarterly, 21, 95-103.
Jones, D. A. (2010). Does serving the community also serve the company? Using
organizational identification and social exchange theories to understand employee responses
to a volunteerism program. Journal of Occupational and Organizational Psychology, 83,
857-878.
Jordan, J., Mullen, E., & Murnighan, J. K. (2011). Striving for the moral self: The effects of
recalling past moral actions on future moral behavior. Personality and Social Psychology
Bulletin, 37, 701-713.
Jöreskog, K. G., & Sörbom, D. (1986). LISREL VI: Analysis of linear structural relationships
by maximum likelihood and least squares methods. Mooresville, IN: Scientific Software.
Judge, T. A., & Piccolo, R. F. (2004). Transformational and transactional leadership: A meta-
analytic test of their relative validity. Journal of Applied Psychology, 89 (5), 755-768.
Jung, D. I., & Avolio, B. J. (2000). Opening the black box: An experimental investigation of
the mediating effects of trust and value congruence on transformational and transactional
leadership. Journal of Organizational Behavior, 21, 949-964.

[342]
Jung, D. I., Chow, C., & Wu, A. (2003). The role of transformational leadership in enhancing
organizational innovation: Hypotheses and some preliminary findings. The Leadership
Quarterly, 14, 525-544.
Kahai, S. S., Sosik, J. J., & Avolio, B. J. (2000). Effects of leadership styles, anonymity and
rewards in an electrical meeting system environment. Working paper, Centre for Leadership
Studies, Binghamon University.
Kaiser, H. F. (1970). A second generation Little-Jiffy. Psychometrika, 35, 401-415.
Kaiser, H. F. (1956). The varimax method of factor analysis. Unpublished doctoral
dissertation, University of California, Berkeley.
Kapp, E. A. (2012). The influence of supervisor leadership practices and perceived group
safety climate on employee safety performance. Safety Science, 50, 1119-1124.
Karaibrahimoğlu, Y. Z. (2010). Corporate social responsibility in times of financial
crisis. African Journal of Business Management, 4(4), 382-389.
Kark, R., Shamir, B., & Chen (2003). The two faces of transformational leadership:
Empowerment and dependency. Journal of Applied Psychology, 88, 246-255.
Kark, R., & Van Dijk, D. (2007). Motivation to lead, motivation to follow: the role of the
self-regulatory focus in leadership processes. Academy of Management Review, 32 (2), 500-
528.
Katzenbach, J. R., & Smith, D. K. (1993). The discipline of teams. Harvard Business Review,
71(7/8), 111–121.
Katz-Navon, T. A. L., Naveh, E., & Stern, Z. (2005). Safety climate in health care
organizations: a multidimensional approach. Academy of Management Journal, 48(6), 1075-
1089.
Katz, D., & Kahn, R. L. (1978). The Social Psychology of Organizations. New York: Wiley.
Keller, R. T. (2006).Transformational leadership, initiating structure, and substitutes for
leadership: A longitudinal study of research and development project team performance.
Journal of Applied Psychology, 91, 202-210.
Kelly, J. R., & McGrath, J. E. (1988). On time and method. Newbury Park, CA: Sage.
[343]
Kelloway, E., Barling, J., & Helleur, J. (2000). Enhancing transformational leadership: The
roles of training and feedback. Leadership & Organization Development Journal, 21(3), 145-
149.
Kenny, D. A., & McCoach, D. B. (2003). Effect of the number of variables on measures of fit
in structural equation modeling. Structural equation modeling, 10(3), 333-351.
Kenny, D. A. (1975). Cross-lagged panel correlations: A test for spuriousness. Psychological
bulletin, 82, 887-903.
Kerr, S., & Jermier, J. M. (1978). Substitutes for leadership: Their meaning and
measurement. Organizational behavior and human performance, 22(3), 375-403.
Kim, A., Kim, Y., Han, K., Jackson, S. E., & Ployhart, R. E. (in press). Multilevel influences
on voluntary workplace green behavior: individual differences, leader behavior and coworker
advocacy. Journal of Management, 38(2), 163-197.
Kim C. H., & Scullion, H. (2013). The effect of Corporate Social Responsibility (CSR) on
employee motivation: A cross-national study. Poznan University of Economics Review,
13(2), 5-30.
Kim, H-R., Lee, M., Lee, H-T., & Kim, N-M. (2010). Corporate social responsibility and
employee-company identification. Journal of Business Ethics, 95, 557-569.
Kirkman, B. L., & Rosen, B. (1999). Beyond self-management: Antecedents and
consequences of team empowerment. Academy of Management journal,42(1), 58-74.
Kirkpatrick, S. A., & Locke, E. A. (1996). Direct and indirect effects of three core
charismatic leadership components on performance and attitudes. Journal of Applied
Psychology, 81, 36-51.
Kline, R. B. (2005). Principles and Practice of Structural Equation Modeling (2nd Edition
ed.). New York: The Guilford Press.
Klotz, A. C., & Bolino, M. C. (2013). Citizenship and counterproductive work behavior: A
moral licensing view. Academy of management review, 38(2), 292-306.
[344]
Korek, S., Felfe, J., & Zaepernick-Rothe, U. (2010). Transformational leadership and
commitment: A multilevel analysis of group-level influences and mediating
processes. European Journal of Work and Organizational Psychology, 19(3), 364-387.
Kozlowski, S. W. J., & Klein, K. J. (2000). A multilevel approach to theory and research in
organizations: Contextual, temporal, and emergent processes. In K. J. Klein & S. W. J.
Koslowski (Eds.), Multilevel theory, research, and methods in organizations: pg.3-90. San
Francisco: Jossey Bass.
Kouchaki, M. (2011). Vicarious moral licensing: the influence of others' past moral actions
on moral behavior. Journal of personality and social psychology, 101 (4), 702-715.
La Du, T. J., & Tanaka, J. S. (1989). Influence of sample size, estimation method, and model
specification on goodness-of-fit assessments in structural equation models. Journal of
Applied Psychology, 74 (4), 625-635.
Lamm, E., Tosti-Kharas, J., & Williams, E. G. (2013). Read this article, but don’t print it:
Organizational citizenship behavior toward the environment. Group & Organization
Management, 1059601112475210.
Lee, N., & Lings, I. (2008). Doing Business Research: A Guide to Theory and Practice.
London: SAGE.
Lewin, K. (1935). Environmental forces in child behavior and development, In K. Lewin
(Ed.), A dynamic theory of personality: Selected papers, pp.66-113. New York: McGraw
Hill.
Liao, H., & Chuang, A. (2007). Transforming service employees and climate: A multilevel,
multisource examination of transformational leadership in building long-term service
relationships. Journal of Applied Psychology, 92 (4), 1006-1019.
Lim, B. C., & Ployhart, R. E. (2004). Transformational leadership: Relations to the five-
factor model and team performance in typical and maximum contexts. Journal of Applied
Psychology, 89, 610-621.
Liu, J., Siu, O. L., & Shi, K. (2010). Transformational leadership and employee well‐being:
The mediating role of trust in the leader and self‐efficacy. Applied Psychology, 59 (3), 454-
479.

[345]
Locke, E. A., & Latham, G. P. (2002). Building a practically useful theory of goal setting and
task motivation: A 35-year odyssey. American psychologist, 57( 9), 705.
Locke, E. A., Smith, K. G., Erez, M., Chah, D. O., & Schaffer, A. (1994). The effects of
intra-individual goal conflict on performance. Journal of Management,20 (1), 67-91.
Locke, E. A., & Latham, G. P. (1990). A theory of goal setting & task performance. Prentice-
Hall, Inc.
Lorinkova, N. M., Pearsall, M. J., & Sims, H. P. (2013). Examining the differential
longitudinal performance of directive versus empowering leadership in teams. Academy of
Management Journal, 56(2), 573-596.
Lowe, K. B., Kroeck, K. G., & Sivasubramaniam, N. (1996). Effectiveness correlates of
transformational and transactional leadership: A meta-analytic review of the MLQ literature.
Leadership Quarterly, 7, 385-425.
Luo, X., & Bhattacharya, C. B. (2006). Corporate social responsibility, customer satisfaction,
and market value. Journal of marketing, 70(4), 1-18.
Maak, T., & Pless, N. M. (2006). Responsible leadership in a stakeholder society-A relational
perspective. Journal of Business Ethics, 66, 99-115.
MacKenzie, S. B., Podsakoff, P. M., & Rich, G. A. (2001). Transformational and
transactional leadership and salesperson performance. Journal of the Academy of Marketing
Sciences, 29 (2), 115-134.
MacKinnon, D. P., Coxe, S., & Baraldi, A. N. (2012). Guidelines for the investigation of
mediating variables in business research. Journal of Business and Psychology, 27(1), 1-14.
Maclagan, P. (1999). Corporate social responsibility as a participative process.Business
Ethics: A European Review, 8(1), 43-49.
Maignan, I., & Ferrell, O. C. (2000). Measuring corporate citizenship in two countries: The
case of the United States and France. Journal of Business Ethics, 23, 283-297.
Maignan, I., Ferrell, O., & Hult, G. (1999). Corporate citizenship: Cultural antecedents and
business benefits. Journal of the Academy of Marketing Science, 27(4), 455-469.

[346]
Margolis, J. D., & Walsh, J. P. (2003). Misery loves companies: Rethinking social initiatives
by business. Administrative science quarterly, 48(2), 268-305.
Mallory, D. B., & Rupp, D. E. (in press). Good leadership: Using corporate social
responsibility to enhance leader-member exchange. In Bauer, T., & Erdogan, B. (Eds.). The
Oxford Handbook of Leader-Member Exchange. University of Oxford Press.
Manika, D., Wells, V.K., Gregory-Smith, D., & Gentry, M. (2015). The impact of individual
attitudinal and organizational variables on workplace environmentally friendly behaviors.
Journal of Business Ethics, 126, 663-684.
Marsh, H. W., Hau, K-T., & Wen, Z. (2004). In search of golden rules: Comment on
hypothesis-testing approaches to setting cutoff values for fit indexes and dangers in
overgeneralizing Hu and Bentler’s (1999) findings. Structure Equation Modeling: A
Multidisciplinary Journal, 11 (3), 320-341.
Martin, R., Guillaume, Y., Thomas, G., Lee, A., & Epitropaki, O. (2015). Leader–Member
Exchange (LMX) and Performance: A Meta‐Analytic Review. Personnel Psychology,
DOI: 10.1111/peps.12100.
Mathieu, J. E., Aguinis, H., Culpepper, S. A., & Chen, G. (2012). Understanding and
estimating the power to detect cross-level interaction effects in multilevel modeling. Journal
of Applied Psychology, 97, 951-966.
Mathieu, J., Maynard, M. T., Rapp, T., & Gilson, L. (2008). Team effectiveness 1997-2007:
A review of recent advancements and a glimpse into the future. Journal of
Management, 34(3), 410-476.
Mayer, D. M., Aquino, K., Greenbaum, R. L., & Kuenzi, M. (2012). Who displays ethical
leadership, and why does it matter? An examination of antecedents and consequences of
ethical leadership. Academy of Management Journal, 55 (1), 151-171.
Mayer, D. M., Kuenzi, M., & Greenbaum, R. L. (2010). Examining the link between ethical
leadership and employee misconduct: The mediating role of ethical climate. Journal of
Business Ethics, 95, 7-16.

[347]
Mayer, D. M., Kuenzi, M., Greenbaum, R., Bardes, M., & Salvador, R. B. (2009). How low
does ethical leadership flow? Test of a trickle-down model. Organizational Behavior and
Human Decision Processes, 108(1), 1-13.
Mayfield, J., & Mayfield, M. (2006). The benefits of leader communication on part-time
worker outcomes: A comparison between part-time and full-time employees using motivating
language. Journal of Business Strategies, 23(2), 131-153.
Mayfield, J., & Mayfield, M. (2009). The role of leader motivating language in employee
absenteeism. Journal of Business Communication, 46 (4), 455-479.
Mazereeuw-van der Duijn Schouten, C., Graafland, J., & Kaptein, M. (2014). Religiosity,
CSR Attitudes, and CSR Behavior: An Empirical Study of Executives’ Religiosity and
CSR. Journal of business ethics, 123(3), 437-459.
Mazutis, D. D. (2013). The CEO effect: A longitudinal, multilevel analysis of the relationship
between executive orientation and corporate social strategy, Business & Society, 52(4), 631-
648.
McDonald, R. P., & Ho, M. H. R. (2002). Principles and practice in reporting structural
equation analyses. Psychological Methods, 7, 64-82.
McGrath, J. E. (1982). Dilemmatics: The study of research choices and dilemmas. In J. E.
McGrath, Martin, J., & Kulka, J. R. (Ed.), Judgement Calls in Research: 69-102. Beverly
Hills: Sage.
McWilliams, A., & Siegel, D. (2001). Corporate social responsibility: A theory of the firm
perspective. Academy of Management Review, 26 (1), 117-127.
Melo, T., & Garrido-Morgado, A. (2012). Corporate reputation: A combination of social
responsibility and industry. Corporate Social Responsibility and Environmental
Management, 19, 11-31.
Menges, J. I., Walter, F., Vogel, B., & Bruch, H. (2011). Transformational leadership
climate: Performance linkages, mechanisms, and boundary conditions at the organizational
level. The Leadership Quarterly, 22(5), 893-909.
Merritt, A. C., Effron, D. A., & Monin, B. (2010). Moral self‐licensing: When being good
frees us to be bad. Social and personality psychology compass, 4(5), 344-357.
[348]
Metcalf, L., & Benn, S. (2013). Leadership for sustainability: An evolution of leadership
ability. Journal of Business Ethics, 112, 369-384.
Michaelis, B., Stegmaier, R., & Sonntag, K. (2010). Shedding light on followers' innovation
implementation behavior: The role of transformational leadership, commitment to change,
and climate for initiative. Journal of Managerial Psychology, 25 (4), 408- 429.
Michelon, G., Boesso, G., & Kumar, K. (2013). Examining the link between strategic
corporate social responsibility and company performance: An analysis of the best corporate
citizens. Corporate Social Responsibility and Environmental Management, 20(2), 81-94.
Miles, J., & Shevlin, M. (2007). A time and a place for incremental fit indices. Personality
and Individual Differences, 42, 869-874.
Milgram, S. (1964). Issues in the study of obedience: A reply to Baumrind. American
Psychologist, 19, 448-452.
Miska, C., Hilbe, C., & Mayer, S. (2014). Reconciling different views on responsible
leadership: a rationality-based approach. Journal of Business Ethics, 125, 349-360.
Mitchell, A., & Zhang, M. (2004). Resolving goal conflict: The effect of regulatory focus on
product choice. Advances in Consumer Research, 31, 142-143.
Mitchell, T. R., & James, L. R. (2001). Building better theory: Time and the specification of
when things happen. Academy of Management Review, 26(4), 530-547.
Mitchell, R. K., Agle, B. R., & Wood, D. J. (1997). Toward a theory of stakeholder
identification and salience: Defining the principle of who and what really counts. Academy of
Management Review, 22 (4), 853-886.
Molina-Azorin, J. F. (2012). Mixed methods research in strategic management: Impact and
applications. Organizational Research Methods, 15 (1), 33-56.
Monin, B., & Miller, D.T. (2001). Moral credentials and the expression of prejudice. Journal
of Personality and Social Psychology, 81, 33-43.
Morgeson, F. P., Aguinis, H., Waldman, D.A., & Siegel, D. S. (2013). Extending corporate
social responsibility research to the human resource management and organizational behavior
domains: A look to the future. Personnel Psychology, 66(4), 805-824.

[349]
Morhart, F. M., Herzog, W., & Tomczak, T. (2009). Brand-specific leadership: turning
employees into brand champions. Journal of Marketing, 73, 122-142.
Morsing, M., & Oswald, D. (2009). Sustainable leadership: management control systems and
organizational culture in Novo Nordisk A/S. Corporate Governance: International Journal of
Business in Society, 9(1), 83-99.
Moss, S. (2009). Cultivating the regulatory focus of followers to amplify their sensitivity to
transformational leadership. Journal of Leadership and Organizational Studies, 15 (3), 241-
259.
Mueller, K., Hattrupp, K., Spiess, S.O., & Lin-Hi, N. (2012). The effects of corporate social
responsibility on employees’ affective commitment: A cross-cultural investigation. Journal of
Applied Psychology, 97(6), 1186-1200.
Muller, A., & Kolk, A. (2010). Extrinsic and intrinsic drivers of corporate social
performance: Evidence from foreign and domestic firms in Mexico. Journal of Management
Studies, 47(1), 1-26.
Munir, F., & Nielsen, K. (2009). Does self‐efficacy mediate the relationship between
transformational leadership behaviours and healthcare workers’ sleep quality? A longitudinal
study. Journal of Advanced Nursing, 65(9), 1833-1843.
Muthuri, J. N., Matten, D., & Moon, J. (2009). Employee volunteering and social capital:
Contributions to corporate social responsibility. British Journal of Management, 20, 75-89.
Myers, M. D., & Newman, M. (2007). The qualitative interview in IS research: Examining
the craft. Information and organization, 17(1), 2-26.
Nadelson, S. (2006). The role of the environment in student ethical behavior. Journal of
College and Character, 7(5), 1-9.
Neal, A., & Griffin, M. A. (2006). A study of the lagged relationships among safety climate,
safety motivation, safety behavior, and accidents at the individual and group levels. Journal
of Applied Psychology, 91(4), 946-953.
Neubert, M. J., Wu, C., & Roberts, J. A. (2013). The influence of ethical leadership and
regulatory focus on employee outcomes. Business Ethics Quarterly, 23(2), 269-296.

[350]
Neubert, M. J., Kacmar, K. M., Carlson, D. S., Chonko, L. B., & Roberts, J. A. (2008).
Regulatory focus as a mediator of the influence of initiating structure and servant leadership
on employee behavior. Journal of Applied Psychology, 93, 1220-1233.
Nielsen, K., Yarker, J., Randall, R., & Munir, F. (2009). The mediating effects of team and
self-efficacy on the relationship between transformational leadership, and job satisfaction and
psychological well-being in healthcare professionals: A cross-sectional questionnaire
survey. International journal of nursing studies, 46 (9), 1236-1244.
Nielsen, K., Randall, R., Yarker, J., & Brenner, S. O. (2008). The effects of transformational
leadership on followers’ perceived work characteristics and psychological well-being: A
longitudinal study. Work & Stress, 22(1), 16-32.
Nielsen, K., Randall, R., Yarker, J., & Sten-Olof, B. (2008). The effects of transformational
leadership on followers’ perceived work characteristics and psychological well-being: A
longitudinal study. Work & Stress: An International Journal of Work, Health &
Organisations, 22 (1), 16-32.
Nord, W. R., & Fuller, S. R. (2009). Increasing corporate social responsibility through an
employee-centred approach. Employee Rights Responsibility Journal, 21, 279-290.
Norton, T. A., Zacher, H., & Ashkanasy N. M. (2014). Organizational sustainability policies
and employee green behavior: The mediating role of work climate perceptions. Journal of
Environmental Psychology, 38, 49-54.
Nunnally, J .C. (1976). Psychometric theory (2nd ed.). New York: McGraw-Hill.
O’Connor, B. P. (1998). SIMPLE: All-in-one programs for exploring interactions in
moderated multiple regression. Educational & Psychological Measurement, 58, 836-840.
Office for National Statistics, 2011 Census: Aggregate data (England and Wales) [computer
file]. UK Data Service Census Support. Downloaded from: http://infuse.mimas.ac.uk. This
information is licensed under the terms of the Open Government Licence
[http://www.nationalarchives.gov.uk/doc/open-government-licence/version/2].
Okhuysen, G. A. (1999). The many faces of time: Temporal considerations in the study of
organizational decision making. Paper presented at the annual meeting of the Academy of
Management, Chicago.

[351]
Okpara, J. O., & Wynn, P. M. (2011). Stakeholders’ perceptions about corporate social
responsibility; Implications for poverty alleviation. Thunderbird and International Business
Review, 54 (1), 91-103.
Ones, D. S., & Dilchert, S. (2012). Environmental sustainability at work: A call to
action. Industrial and Organizational Psychology, 5(4), 444-466.
Orange. (2005). Eurocar© software and manual. Upper Heyford, UK: Orange Learning Ltd.
Organ, D., & Ryan, K. (1995). A meta-analytic review of attitudinal and dispositional
predictors of organizational citizenship behavior. Personnel Psychology, 48, 775-802.
Orlitzky, M., Schmidt, F. L., & Rynes, S. L. (2003). Corporate social and financial
performance: A meta-analysis. Organization Studies, 24, 403-441.
Ormiston, M. E., & Wong, E. M. (2013). License to ill: The effects of corporate social
responsibility and CEO moral identity on corporate social irresponsibility. Personnel
Psychology, 66(4), 861-893.
Paillé, P., & Mejía-Morelos, J. H. (2014). Antecedents of pro-environmental behaviors at
work: The moderating influence of psychological contract breach. Journal of Environmental
Psychology, 38, 124-131.
Parry, K. W., & Sinha, P. N. (2005). Researching the trainability of transformational
organizational leadership. Human Resource Development International, 8(2), 165-183.
Parry, K. W., & Proctor-Thomson, S. B. (2002). Perceived integrity of transformational
leaders in organisational settings. Journal of Business Ethics, 35, 75-96.
Paxson, M. C. (1995). Increasing survey response rates: Practical instructions from the total
design method. Cornell Hotel and Restaurant Administration Quarterly, 36, 66-73.
Pearce, C., & Manz, C .C. (2011). Leadership centrality and corporate social ir-responsibility
(CSIR): The potential ameliorating effects of self and shared leadership on CSIR. Journal of
Business Ethics, 102(4), 563-579.
Pedersen, E. R. G. (2011). All animals are equal, but…: management perceptions of
stakeholder relationships and societal responsibilities in multinational corporations. Business
Ethics: A European Review, 20(2), 177-191.

[352]
Pelletier, L. G., Tuson, K. M., Green-Demers, I., Noels, K., & Beaton, A. M. (1998). Why are
you doing things for the environment? The motivation toward the environment scale
(MTES). Journal of Applied Social Psychology, 28 (5), 437-468.
Peloza, J. (2009). The challenge of measuring financial impacts from investments in
corporate social performance. Journal of Management, 35(6), 1518-1541.
Peterson, D. K. (2002). Deviant workplace behaviour and the organizational ethical climate.
Journal of Business and Psychology, 17 (1), 47-61.
Peterson, D. K. (2004). Recruitment strategies for encouraging participation in corporate
volunteer programs. Journal of Business Ethics, 49, 371-386.
Piccolo, R. F., & Colquitt, J. A. (2006). Transformational leadership and job behaviours: The
mediating role of core job characteristics. Academy of Management Journal, 2, 327-340.
Piccolo, R. F., Greenbaum, R., Den Hartog, D. N., & Folger, R. (2010). The relationship
between ethical leadership and core job characteristics. Journal of Organizational behavior,
31, 259-278.
Pierce, J. R., & Aguinis, H. (in press). Detrimental citizenship behavior: A multilevel
framework of antecedents and consequences. Management and Organization Review,
DOI: 10.1111/more.12015.
Pillai, R., & Williams, E. A. (2004). Transformational leadership, self-efficacy, group
cohesiveness, commitment, and performance. Journal of organizational change
management, 17(2), 144-159.
Pless, N. M., & Maak, T. (2011). Responsible leadership: Pathways to the future. Journal of
Business Ethics, 98, 3-13.
Podsakoff, P. M., MacKenzie, S. B., Lee, J. Y., & Podsakoff, N. P. (2003). Common method
biases in behavioral research: A critical review of the literature and recommended remedies.
Journal of Applied Psychology, 88, 879-903.
Podsakoff, P. M., MacKenzie, S. B., Moorman, R. H., & Fetter, R. (1990). Transformational
leader behaviours and their effects on followers’ trust in leader, satisfaction, and
organizational citizenship behaviours. Leadership Quarterly, 1(2), 107-142.

[353]
Podsakoff, P., & Todor, W. (1985). Relationships between leader reward and punishment
behavior and group processes and productivity. Journal of Management, 11, 55-73.
Ponnu, C. H., & Tennakoon, G. (2009). The association between ethical leadership and
employee outcomes- the Malaysian case. Electronic Journal of Business Ethics and
Organization Studies, 14 (1), 21-32.
Porter, M. E., & Kramer, M. R. (2006). Strategy and society: The link between competitive
advantage and corporate social responsibility. Harvard Business Review, 84 (12), 78-92.
Prabhakar, G. P. (2005). Switch leadership in projects: An empirical study reflecting the
importance of transformational leadership on project success across twenty-eight nations.
Project Management Journal, 36 (4), 53-60.
Preacher, K. J., Curran, P. J., & Bauer, D. J. (2006). Computational tools for probing
interaction effects in multiple linear regression, multilevel modeling, and latent curve
analysis. Journal of Educational and Behavioral Statistics, 31, 437-448.
Pritchard, M. P., Havitz, M. E., & Howard, D. R. (1999). Analysing the commitment-loyalty
link in service contexts. Journal of the Academy of Marketing Science, 27 (3), 333-348.
Quinn, L. and Dalton, M. (2009). Leading for sustainability: implementing the tasks of
leadership. Corporate Governance, 9 (1), 21-38.
Raman, P., & Zboja, J. J. (2006). The effects of employee attitudes on workplace charitable
donations. Journal of Nonprofit & Public Sector Marketing, 16(1-2), 41-60.
Ramchander, S., Schwebach, R. S., & Staking, K. (2012). The informational relevance of
corporate social responsibility: Evidence from DS400 index reconstitutions. Strategic
Management Journal, 33, 303-314.
Ramus, C. A., & Montiel, I. (2005). When are corporate environmental policies a form of
greenwashing? Business and Society, 44 (4), 377-414.
Ramus, C. A., & Steger, U. (2000). The roles of supervisory support behaviors and
environmental policy in employee “Ecoinitiatives” at leading-edge European companies.
Academy of Management Journal, 43(4), 605-626.

[354]
Raykov, T., & Marcoulides, G. A. (2000). A method for comparing completely standardized
solutions in multiple groups. Structural equation modeling, 7(2), 292-308.
Reidenbach, R. E., & Robin, D. P. (1990). Toward the development of a multidimensional
scale for improving evaluations of business ethics. Journal of Business Ethics, 9, 639-653.
Rentsch, J. R. (1990). Climate and culture: Interaction and qualitative differences in
organizational meanings. Journal of Applied Psychology, 75, 668-681.
Robertson, J. L., & Barling, J. (2013). Greening organizations through leaders' influence on
employees' pro-environmental behaviors. Journal of Organizational Behavior, 34, 176-194.
Rodell, J. B. (2013). Finding meaning through volunteering: Why do employees volunteer
and what does it mean for their jobs? Academy of Management Journal, 56 (5), 1274-1294.
Rodgers, W., Choy, H. L., & Guiral, A. (2013). Do Investors Value a Firm’s Commitment to
Social Activities? Journal of business ethics, 114(4), 607-623.
Rodrigo, P., & Arenas, D. (2007). Do employees care about CSR programs? A typology of
employees according to their attitudes. Journal of Business Ethics, 83, 265-283.
Roe, R. A., Gockel, C., & Meyer, B. (2012). Time and change in teams: Where we are and
where we are moving. European Journal of Work and Organizational Psychology, 21(5),
629-656.
Romani, S., Grappi, S., & Bagozzi, R. P. (2013). Explaining consumer reactions to corporate
social responsibility: The role of gratitude and altruistic values. Journal of Business
Ethics, 114(2), 193-206.
Ronan, W. W., Latham, G. P., & Kinne, S. B. (1973). Effects of goal setting and supervision
on worker behavior in an industrial situation. Journal of Applied Psychology, 58(3), 302.
Rowold, J. (2008). Relationships among transformational, transactional, and moral-based
leadership: Results from two empirical studies. Leadership Review, 8, 4-17.
Ruiz, P., Ruiz, C., & Martinez, R. (2011a). The cascading effect of top management’s ethical
leadership: Supervisors or other lower-hierarchical individuals. African Journal of Business
Management, 5 (12), 4755-4764.

[355]
Ruiz, P., Ruiz, C., & Martinez, R. (2011b). Improving the “leader-follower” relationship: Top
manager or supervisor? The ethical leadership trickle-down effect on follower job response.
Journal of Business Ethics, 99, 587-608.
Rummel, R. J. (1970). Applied factor analysis. Evanston, IL: Northwestern University Press.
Rupp, D. E., & Mallory, D. B. (2015). Corporate social responsibility: Psychological, person-
centric, and progressing. The Annual Review of Organizational Psychology and
Organizational Behavior, 2, 211-236.
Rupp, D. E., Skarlicki, D. P., & Shao R. (2013).The psychology of corporate social
responsibility and humanitarian work: A person-centric perspective. Industrial and
Organizational Psychology, 7, 361-368.
Rupp, D. E., Ganapathi, J., Aguilera, R. V., & Williams, C. A. (2006). Employee reactions to
corporate social responsibility: An organizational justice framework. Journal of
Organizational Behaviour, 27, 537-543.
Ruzindana, A. (1997). The importance of leadership in fighting corruption in Uganda. In K.
A. Elliott (ed.), Corruption and the global economy (pp 133-145). Washington DC: Institute
for International Economics.
Ryan, R. M., Kuhl, J., & Deci, E. L. (1997). Nature and autonomy: Organizational view of
social and neurobiological aspects of self-regulation in behaviour and development.
Development and Psychopathology, 9, 701-728.
Ryan, R. M., & Deci, E. L. (2000). Self-determination theory and the facilitation of intrinsic
motivation, social development, and well-being. American Psychologist, 55 (1), 68-78.
Salanova, M., Lorente, L., Chambel, M. J., & Martinez, I. M. (2011). Linking
transformational leadership to nurses’ extra-role performance: The mediating role of self-
efficacy and work engagement. Journal of Advanced Nursing, 67, 2256- 2266.
Sale, J. E. M., Lohfeld, L. H., & Brazil, K. (2002). Revisiting the quantitative-qualitative
debate: Implications for mixed-methods research. Quality and Quantity, 36, 43-53.
Salgado, J. F. (1998). Sample size in validity studies of personnel selection. Journal of
Occupational and Organizational Psychology, 71, 161-164.

[356]
Sarkis, J., Graves, L.M., & Zhu, Q. (2013). How transformational leadership and employee
motivation combine to predict employee pro-environmental behaviors in China. Journal of
Environmental Psychology, 35, 81-91.
Scandura, T. A., & Williams, E. A. (2000). Research methodology in management: Current
practices, trends, and implications for future research. Academy of Management Journal, 43
(6), 1248-1264.
Schaubroeck, J., Lam, S. S., & Cha, S. E. (2007). Embracing transformational leadership:
team values and the impact of leader behavior on team performance. Journal of Applied
Psychology, 92(4), 1020-1030.
Schmidt, K. H., Kleinbeck, U., & Brockmann, W. (1984). Motivational control of motor
performance by goal setting in a dual-task situation. Psychological Research, 46(1-2), 129-
141.
Schmitt, T. A. (2011). Current methodological considerations in exploratory and
confirmatory factor analysis. Journal of Psychoeducational Assessment, 29(4), 304-321.
Schmitt, T. A., & Sass, D. A. (2011). Rotation criteria and hypothesis testing for exploratory
factor analysis: Implications for factor pattern loadings and interfactor correlations.
Educational and Psychological Measurement, 71, 95-113.
Schneider, B., & Snyder, R. A. (1975). Some relationships between job satisfaction and
organizational climate. Journal of Applied Psychology, 60, 318-328.
Schneider, B., & Reichers, A. E. (1983). On the etiology of climates. Personnel Psychology,
36, 19-39.
Schneider, B. (1987). The people make the place. Personnel Psychology, 40, 437-454.
Schneider, B. (1990). The climate for service: An application of the climate construct. In B.
Schneider (Ed.), Organizational climate and culture (pp. 383-412). San Francisco: Jossey-
Bass.
Schneider, B., Holcombe, K. M., & White, S. S. (1997). Lessons learned about service
quality: What it is, how to manage it, and how to become a service quality organisation.
Consulting Psychology Journal: Practice and Research, 49 (1), 35-50.

[357]
Schriesheim, C. A., & Eisenbach, R. J. (1990). Item wording effects on exploratory
factoranalytic results: An experimental investigation. Proceedings of the 1990 Southern
Management Association annual meetings, 396-398.
Schriesheim, C. A., Powers, K. J., Scandura, T. A., Gardiner, C. C., & Lankau, M. J., (1993).
Improving construct measurement in management research: Comments and a quantitative
approach for assessing the theoretical content adequacy of paper-and-pencil survey-type
instruments. Journal of Management, 19, 385-417.
Scholtens, B. (2008). A note on the interaction between corporate social responsibility and
financial performance. Ecological economics, 68(1), 46-55.
Senatra, B. D. (1980). Role conflict, role ambiguity, and organizational climate in a public
accounting firm. Accounting Review, 55 (4), 594-603.
Sendjaya, S., Sarros, J. C., & Santora, J. C. (2008). Defining and measuring servant
leadership behaviour in organizations. Journal of Management Studies, 45, 402-424.
Shamir, B., House, R. J., & Arthur, M. B. (1993). The motivational effects of charismatic
leadership: A self concept based theory. Organization Science, 4, 577-593.
Shamir, B., & Eilam, G. (2005). 'What's your story?' A life-stories approach to authentic
leadership development. Leadership Quarterly, 16(3), 395-417.
Shahin, A., & Zairi, M. (2007). Corporate governance as a critical element for driving
excellence in corporate social responsibility. International Journal of Quality & Reliability
Management, 24 (7), 753-770.
Shannon, H. S., Robson, L. S., & Guastello, S. J. (1999). Methodological criteria for
evaluating occupational safety intervention research. Safety Science, 31(2), 161-179.
Shen, J., & Benson, J. (in press). When CSR is a social norm: How socially responsible
human resource management affects employee work behavior. Journal of Management, DOI:
10.1177/0149206314522300.
Shrout, P. E., & Fleiss, J. L. (1979). Intraclass correlations: uses in assessing rater
reliability. Psychological bulletin, 86(2), 420-428.
[358]
Simola, S. K., Barling, J., & Turner, N. (2010). Transformational leadership and moral
orientation: Contrasting an ethic of justice and an ethic of care. Leadership Quarterly, 21,
179-188.
Smith, J. K., & Heshusius, L. (1986). Closing down the conversation: The end of the
quantitative-qualitative debate. Educational Researcher, 15 (1), 4-13.
Snell, R. S. (2000). Studying moral ethos using an adapted Kohlbergian model. Organization
Studies, 21(1), 267-295.
Sparrowe, R. T. (2005). Authentic leadership and the narrative self. Leadership Quarterly,
16, 419-439.
Stam, D. A., Knippenberg, D. V., & Wisse, B. (2010). The role of regulatory fit in visionary
leadership. Journal of Organizational Behavior, 31, 499-518.
Stancu, A., Grigore, G. F., & Rosca, M. I. (2011). The impact of corporate social
responsibility on employees. International Conference on Information and Finance, 21, 11-
16.
Stenmark, C. A., & Mumford, M. D. (2011). Situational impacts on leader ethical decision-
making. Leadership Quarterly, 22, 942-955.
Tafvelin, S., Armelius, K., & Westerberg, K. (2011). Toward understanding the direct and
indirect effects of transformational leadership on well-being a longitudinal study. Journal of
Leadership & Organizational Studies, 18(4), 480-492.
Tang, Y., Qian, C., Chen, G., & Shen, R. (in press). How CEO hubris affects corporate social
(ir) responsibility. Strategic Management Journal, DOI: 10.1002/smj.2286.
Tang, Y-T., & Chang, C. H. (2010). Impact of role ambiguity and role conflict on employee
creativity. African Journal of Business Management, 4 (6), 869-881.
Tenbrunsel, A. E., & Smith‐Crowe, K. (2008). Ethical decision making: Where we’ve been
and where we’re going. The Academy of Management Annals, 2 (1), 545-607.
Tett, R. P., Fitzke, J. R., Wadlington, P. L., Davies, S. A., Anderson, M. G., & Foster, J.
(2009). The use of personality test norms in work settings: Effects of sample size and
relevance. Journal of Occupational and Organizational Psychology, 82(3), 639-659.

[359]
Thacker, J. W., Fields, M. W., & Tetrick, L. E. (1989). The factor structure of Union
Commitment: An application of confirmatory factor analysis. Journal of Applied
Psychology, 74(2), 228.
Thurstone, L. L. (1947). Multiple factor analysis. Chicago: University of Chicago Press.
Toor, S., & Ofori, G. (2009). Ethical leadership: Examining the relationships with full range
leadership model, employee outcomes, and organizational culture. Journal of Business
Ethics, 90, 533-547.
Tordera, N., González-Romá, V., & Peiró, J. M. (2008). The moderator effect of
psychological climate on the relationship between leader-member exchange (LMX) quality
and role overload. European Journal of Work and Organizational Psychology, 17 (1), 55-72.
Trevino, L. K., Butterfield, K. D., & McCabe, D. I. (1998). The ethical context in
organizations: Influences on employee attitudes and behaviors. Business Ethics Quarterly, 8,
447-476.
Trevino, L. K., Hartman, L. P., Brown, M. (2000). Moral person and moral manager: How
executives develop a reputation for ethical leadership. California Management Review, 42(4),
128-142.
Tsai, Y. H., Joe, S. W., Lin, C. P., & Wang, R. T. (2014). Modeling job pursuit intention:
moderating mechanisms of socio-environmental consciousness. Journal of Business
Ethics, 125(2), 287-298.
Tucker, L. R., & Lewis, C. (1973). A reliability coefficient for maximum likelihood factor
analysis. Psychometrika, 38, 1-10.
Tuckman, B. W. (1965). Developmental sequence in small groups. Psychological
bulletin, 63(6), 384-399.
Turker, D. (2009). Measuring corporate social responsibility: A scale development study.
Journal of Business Ethics, 85, 411-427.
Turner, N., Barling, J., Epitropaki, O., Butcher, V., & Milner, C. (2002). Transformational
leadership and moral reasoning. Journal of Applied Psychology, 87, 304-311.

[360]
Uhl-Bien, M. (2006). Relational Leadership Theory: Exploring the social processes of
leadership and organizing. Leadership Quarterly, 17, 654-676.
Unsworth, K. L., Dmitrieva, A., & Adriasola, E. (2013). Changing behaviour: Increasing the
effectiveness of workplace interventions in creating pro‐environmental behaviour
change. Journal of Organizational Behavior, 34(2), 211-229.
Van Dierendonck, D., & Dijkstra, M. (2012). The role of the follower in the relationship
between empowering leadership and empowerment: A longitudinal investigation. Journal of
Applied Social Psychology, 42 (1), 1-20.
Van Dierendonck, D. (2011). Servant leadership: A review and synthesis. Journal of
Management, 37 (4), 1228-1261.
van Dierendonck, D., Haynes, C., Borrill, C., & Stride, C. (2004). Leadership behavior and
subordinate well-being. Journal of Occupational Health Psychology, 9, 165-175.
Van Prooijen, J. W., & Van Der Kloot, W. A. (2001). Confirmatory analysis of exploratively
obtained factor structures. Educational and Psychological Measurement, 61(5), 777-792.
Van Sell, M., Brief, A. P., & Schuler, R. S. (1981). Role conflict and role ambiguity:
Integration of the literature and directions for future research. Human Relations, 34, 43-71.
Viswesvaran, C., Deshpande, S. P., & Milman, C. (1998). The effect of corporate social
responsibility on employee counterproductive behaviour. Cross Cultural Management: An
International Journal, 5 (4), 5 -12.
Vlachos, P. A., Panagopoulos, N. G., & Rapp, A. (2014). Employee judgments of and
behaviors towards corporate social responsibility: A multi-study investigation of direct,
cascading, and moderating effects, Journal of Organizational Behavior, 35, 990-1017.
Vlachos P. A., Panagopoulos, N. G., & Rapp, A. A. (2013). Feeling good by doing good:
Employee CSR-induced attributions, job satisfaction, and the role of charismatic leadership.
Journal of Business Ethics, 118 (3), 577-588.
Voegtlin, C., Patzer, M., & Scherer, A. G. (2012). Responsible leadership in global business:
a new approach to leadership and its multi-level outcomes. Journal of Business Ethics, 105,
1-16.

[361]
Voegtlin, C. (2011). Development of a scale measuring discursive responsible leadership.
Journal of Business Ethics, 98, 57-73.
Wageman, R. (1995). Interdependence and group effectiveness. Administrative Science
Quarterly, 40, 145-180.
Waldman, D. A., & Siegel, D. (2008). Defining the socially responsible leader. Leadership
Quarterly, 19, 117-131.
Waldman, D. A., Siegel, D. S., & Javidan, M. (2006). Components of CEO transformational
leadership and corporate social responsibility. Journal of Management Studies, 43, 1703-
1725.
Walker, M., & Kent, A. (2013). The roles of credibility and social consciousness in the
corporate philanthropy-consumer behavior relationship. Journal of business ethics, 116(2),
341-353.
Walker, A. G., Smither, J. W., & Waldman, D. A. (2008). A longitudinal examination of
concomitant changes in team leadership and customer satisfaction. Personnel Psychology, 62,
547-577.
Wallace, J. C., Butts, M. M., Johnson, P. D., Stevens, F. G., & Smith, M. B. (in press). A
multilevel model of employee innovation: Understanding the effects of regulatory focus,
thriving, and employee involvement climate. Journal of Management, 0149206313506462.
Wallace, J. C. (2004). A multilevel examination of occupational safety: Regulatory focus as
an explanatory link between climate, conscientiousness, and performance (Doctoral
dissertation, Georgia Institute of Technology).
Walumbwa, F. O., Wang, P., Wang, H., Schaubroeck, J., & Avolio, B. J. (2010).
Psychological processes linking authentic leadership to follower behaviours. Leadership
Quarterly, 21, 901-914.
Walumbwa, F. O., Hartnell, C. A., & Oke, A. (2010). Servant leadership, procedural justice
climate, service climate, employee attitudes, and organizational citizenship behavior: a cross-
level investigation. Journal of Applied Psychology, 95(3), 517.

[362]
Walumbwa, F. O., Avolio, B. J., Gardner, W. L., Wernsing, T. S., & Peterson, S. J. (2008).
Authentic leadership: Development and validation of a theory-based measure. Journal of
Management, 34(1), 89-126.
Watts, P., Holme, L., & Tinto, R. (1998). Meeting changing expectations: Corporate social
responsibility. Geneva: World Business Council for Sustainable Development.
West, M. A., & Lyubovnikova, J. (2012). Real teams or pseudo teams? The changing
landscape needs a better map. Industrial and Organizational Psychology, 5(1), 25-28.
West, M. A. (2002). Sparkling fountains or stagnant ponds: An integrative model of
creativity and innovation implementation in work groups. Applied Psychology: An
International Review, 51 (3), 355-424.
Wilderom, C. P., van den Berg, P. T., & Wiersma, U. J. (2012). A longitudinal study of the
effects of charismatic leadership and organizational culture on objective and perceived
corporate performance. The Leadership Quarterly, 23(5), 835-848.
Willer, R., Flynn, F. J., & Zak, S. (2012). Structure, identity, and solidarity: A comparative
field study of generalized and direct exchange. Administrative Science Quarterly, 57, 119-
155.
Williams, L. J., & Andersen, S. E. (1991). Job satisfaction and organizational commitment as
predictors of organizational citizenship behaviors. Journal of Management, 17, 601-617.
Wilson, J., & Musick, M. (1998). The contribution of social resources to volunteering. Social
Science Quarterly, 799-814.
Whitmarsh, L., & O’Neill, S. (2010). Green identity, green living? The role of pro-
environmental self-identity in determining consistency across diverse pro-environmental
behaviours. Journal of Environmental Psychology, 30, 305-314.
Whittington, J. L., Goodwin, V.L., & Murray, B. (2004). Transformational leadership, goal
difficulty, and task design: independent and interactive effects on employee outcomes. The
Leadership Quarterly, 15 (5), 593-606.
Wu, L. Z., Kwan, H. K., Yim, F. H. K., Chiu, R. K., & He, X. (in press). CEO ethical
leadership and corporate social responsibility: A moderated mediation model. Journal of
Business Ethics, DOI 10.1007/s10551-014-2108-9.

[363]
Wu, T-C., Chen, C-H., & Li, C-C. (2008). A correlation among safety leadership, safety
climate, and safety performance. Journal of Loss Prevention in the Process Industries, 21,
307-318.
Xie, J. L., Roy, J. P., & Chen, Z. (2006). Cultural and individual differences in self‐rating
behavior: an extension and refinement of the cultural relativity hypothesis. Journal of
Organizational Behavior, 27(3), 341-364.
Yammarino, F. J., Spangler, W. D., & Dubinsky, A. J. (1998). Transformational and
contingent reward leadership: Individual, dyad, and group levels of analysis. Leadership
Quarterly, 9 (1), 27-54.
Yammarino, F. J., & Dubinsky, A. J. (1994). Transformational leadership theory: using levels
of analysis. Personnel psychology, 47(4), 787.
Yeow, J., & Martin, R. (2013). The role of self-regulation in developing leaders: A
longitudinal field experiment. The Leadership Quarterly, 24(5), 625-637.
Yim, F., & Fock, H. (2013). Social responsibility climate as a double-edged sword: How
employee-perceived social responsibility climate shapes the meaning of their voluntary
work? Journal of Business Ethics, 114, 665-674.
Yukl, G. (1999). An evaluation of conceptual weaknesses in transformational and charismatic
leadership theories. Leadership Quarterly, 10 (2), 285-305.
Zhang, M., Fan, D. D., & Zhu, C.J. (2014). High-performance work systems, corporate social
performance and employee outcomes: Exploring the missing links. Journal of Business
Ethics, 120, 423-435.
Zhang, L., & Gowan, M. A. (2012). Corporate social responsibility, applicants’ individual
traits, and organizational attraction: A person-organization fit perspective. Journal of
Business Ethics, 27, 345-362.
Zhu, Y., & Akhtar, S. (2014). How transformational leadership influences follower helping
behavior: The role of trust and prosocial motivation. Journal of Organizational
Behavior, 35(3), 373-392
Zohar, D., (2000). A group-level model of safety climate: Testing the effect of group climate
on micro-accidents in manufacturing jobs. Journal of Applied Psychology, 85, 587-596.

[364]
Zohar, D., (2002a). The effects of leadership dimensions, safety climate, and assigned
priorities on minor injuries in work groups. Journal of Organizational Behavior, 23, 75-92.
Zohar, D. (2002b). Modifying supervisory practices to improve subunit safety: A leadership-
based intervention model. Journal of Applied Psychology, 87 (1), 156-163.
Zohar, D., & Luria, G. (2004). Climate as a social-cognitive construction of supervisory
safety practices: scripts as proxy of behavior patterns. Journal of Applied Psychology, 89,
322-333.
Zohar, D. (2010). Thirty years of safety climate research: Reflections and future directions.
Accident Analysis and Prevention, 42, 1517-1522.

[365]
11. Appendices
Appendix 1
Company sample: Leader Questionnaire
[Hosted online: LimeSurvey]
Instruction provided prior to starting the survey
Instructions for Respondents: This survey is about the team you lead whilst at work. Please
complete all questions with the answers that come first to your mind; there are no right or
wrong answers. Be sure to read the instructions for each set of questions before you respond.
This survey should take you approximately 10 minutes to complete.
You will need to refer to the e-mail you received from Nishat in order to complete this
survey.
For the survey to display optimally, please maximise your browser window.
I would be grateful if you would allow us to use your data for our research on social
responsibility. If you allow us to do this, we assure you that all information would be treated
in confidence. Participation in the survey is voluntary.
By completing the questionnaire you consent to participation and the use of your data. If you
wish to withdraw consent at a later time, please e-mail Nishat on [email protected].

[366]
Employee Social Responsibility (ESR)
Seven point Likert scale (1=Strongly Disagree/ 7=Strongly Agree)
On behalf of your team, to what extent does this person engage in the following behaviours?
[Social]
Educates at-risk groups in the community about key issues (e.g. health, education, social)
Organises events in the wider community (e.g. fairs, bazaars, fashion show etc.)
Assists in community projects
Provides his/her expertise to people in the wider community for free (e.g. mentoring,
teaching, professional advice)
Participates in events in the wider community
Gets involved in volunteer or social groups in the wider community
[Philanthropy]
Participates in charity events
Raises money for charity
Donates to a charity
Organises charity events and/or fundraisers
Volunteers in charitable initiatives
Supports a local charity

[367]
[Stakeholder]
Is polite towards others
Provides others with transparent and honest information
Listens to the viewpoints of others
Acts fairly towards others
Is helpful towards others
Treats others with respect
[Environmental]
Uses renewable resources where possible
Saves energy
Disposes of waste appropriately
Recycles
Behaves in an environmentally friendly manner
Reduces the environmental impact of his/her travel
[Legal]
Adheres to rules and regulations
Obeys the law

[368]
[Economic]
Looks for ways to cut costs
Is efficient in his/her daily tasks
Completes work to a high standard
Meets deadlines
Achieves his/her goals and objectives
Does his/her fair share of the work

[369]
Appendix 2
Company sample: Team Member Questionnaire
[Hosted online: LimeSurvey]
Instructions provided prior to starting the survey
Instructions for Respondents: This survey is about you whilst at work. Please complete all
questions with the answers that come first to your mind; there are no right or wrong answers.
Be sure to read the instructions for each set of questions before you respond. This survey
should take you approximately 10-15 minutes to complete.
For the survey to display optimally, please maximise your browser window.
I would be grateful if you would allow us to use your data for our research on social
responsibility. If you allow us to do this, we assure you that all information would be treated
in confidence. Participation in the survey is voluntary.
By completing the questionnaire you consent to participation and the use of your data. If you
wish to withdraw consent at a later time, please e-mail Nishat on [email protected].
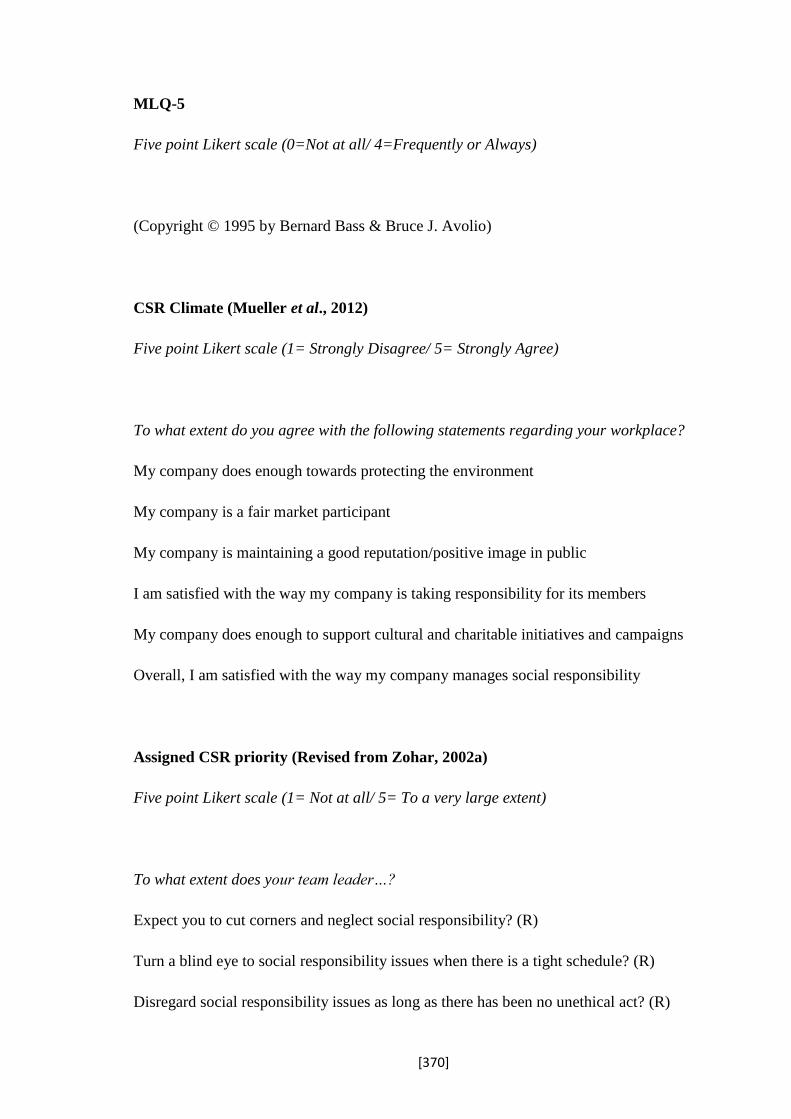
[370]
MLQ-5
Five point Likert scale (0=Not at all/ 4=Frequently or Always)
(Copyright © 1995 by Bernard Bass & Bruce J. Avolio)
CSR Climate (Mueller et al., 2012)
Five point Likert scale (1= Strongly Disagree/ 5= Strongly Agree)
To what extent do you agree with the following statements regarding your workplace?
My company does enough towards protecting the environment
My company is a fair market participant
My company is maintaining a good reputation/positive image in public
I am satisfied with the way my company is taking responsibility for its members
My company does enough to support cultural and charitable initiatives and campaigns
Overall, I am satisfied with the way my company manages social responsibility
Assigned CSR priority (Revised from Zohar, 2002a)
Five point Likert scale (1= Not at all/ 5= To a very large extent)
To what extent does your team leader…?
Expect you to cut corners and neglect social responsibility? (R)
Turn a blind eye to social responsibility issues when there is a tight schedule? (R)
Disregard social responsibility issues as long as there has been no unethical act? (R)

[371]
Comment only on production-related issues? (R)
Get angry when s/he sees a team member performing a socially irresponsible act?
Employee Social Responsibility (ESR)
Seven point Likert scale (1=Strongly Disagree/ 7=Strongly Agree)
Indicate the extent to which you engage in the following behaviours within your team,
I…
[Social]
Educate at-risk groups in the community about key issues (e.g. health, education, social)
Organise events in the wider community (e.g. fairs, bazaars, fashion show etc.)
Assist in community projects
Provide my expertise to people in the wider community for free (e.g. mentoring, teaching,
professional advice)
Participate in events in the wider community
Get involved in volunteer or social groups in the wider community
[Philanthropy]
Participate in charity events
Raise money for charity
Donate to a charity
Organise charity events and/or fundraisers
Volunteer in charitable initiatives

[372]
Support a local charity
[Stakeholder]
Am polite towards others
Provide others with transparent and honest information
Listen to the viewpoints of others
Act fairly towards others
Am helpful towards others
Treat others with respect
[Environmental]
Use renewable resources where possible
Save energy
Dispose of waste appropriately
Recycle
Behave in an environmentally friendly manner
Reduce the environmental impact of my travel
[Legal]
Adhere to rules and regulations
Obey the law

[373]
[Economic]
Look for ways to cut costs
Am efficient in my daily tasks
Complete work to a high standard
Meet deadlines
Achieve my goals and objectives
Do my fair share of the work

[374]
Appendix 3
Business Game Sample: Tutor Questionnaire
[Distributed via paper copies| Consent obtained and instructions provided in person]
Team Productivity (Kirkman and Rosen, 1999)
Five point Likert scale (1=Strongly Disagree/ 5=Strongly Agree)
[General Team Effectiveness]
This group meets or exceeds it goals
This group completes its tasks on time
This group makes sure that products and services meet or exceed quality standards
This group responds quickly when problems come up
This group is a productive team
This group successfully solves problems that slow down their work
[ESR specific Team Effectiveness-these items were specifically generated for the current
thesis]
This group looks out for other groups
This group recycles
This group is a socially responsible group

[375]
Appendix 4
Business Game sample: Leader (i.e. Managing Director) Questionnaire
[Hosted online: LimeSurvey]
Instructions provided prior to starting the survey:
Instructions for Respondents: This survey is about your Business Game group. Please
complete all questions with the answers that come first to your mind; there are no right or
wrong answers. Be sure to read the instructions for each set of questions before you respond.
This should take you approximately 15 minutes to complete, and the resulting feedback can
be utilised in your individual essays.
I would be grateful if you would allow us to use your data for our research into the
relationship between leadership and group and individual performance, which will help us
to generate and share knowledge about effective leadership and team working. This research
will involve matching your questionnaire scores with your assignment marks for the Business
Game module. To do this we need you to give us permission to obtain your demographic and
assignment marks from your student records. If you allow us to do this, we assure you that
all information would be treated in confidence.
By completing the questionnaire you consent to participation and the use of your data. If you
wish to withdraw consent at a later time, please e-mail Nishat on [email protected].

[376]
In-role Behaviours (Williams and Anderson, 1991)
Five point Likert scale (1= Strongly Disagree/ 5= Strongly Agree)
This member…
Adequately completes assigned duties
Fulfils responsibilities specified in their role
Performs tasks that are expected of them
Meets formal performance requirements of the role
Engages in activities that will directly affect their performance
Neglects aspects of the role that they are obligated to perform (R)
Fails to performs essential duties (R)
Pro-environmental Behaviours (Whitmarsh and O’Neill, 2010)
Four point Likert scale (0= Never/ 3=Always)
This member…
Turns off lights they are not using
Uses public transport, cycles and/or walks to University
Buys environmentally friendly products
Eats food which is organic, locally grown or in season
Recycles

[377]
Co-operation Behaviours (Bettencourt & Brown, 1997)
Seven point Likert scale (1= Strongly Disagree/ 7= Strongly Agree)
This member…
Helps other students who have heavy workloads
Is always ready to lend a helping hand to those students around him/her
Voluntarily gives of his/her time to help other students
Willingly helps others who have work related problems
OCB (Podsakoff et al., 1990)
Five point Likert scale (1= Strongly Disagree/ 5= Strongly Agree)
This member…
Is one of my most conscientious members in the group
Always find faults with what the group is doing (R)
Attends functions that are not required, but help the group image
Takes steps to try to prevent problems with other members
Is always ready to lend a helping hand to those around him/her

[378]
Deviant Behaviours (Bennett and Robinson, 2000)
Five point Likert scale (1= Strongly Disagree/ 5= Strongly Agree)
This member has…
Put little effort into their work
Littered their work environment
Neglected to follow my instructions
Intentionally worked slower than they could have
Discussed confidential company information with a student from another group
Employee Social Responsibility (ESR)
Seven point Likert scale (1= Strongly Disagree/ 7= Strongly Agree)
On behalf of the Business Game group, to what extent does this person engage in the
following behaviours?
[Social]
Educates at-risk groups in the community about key issues (e.g. health, education, social)
Organises events in the wider community (e.g. fairs, bazaars, fashion show etc.)
Assists in community projects
Provides his/her expertise to people in the wider community for free (e.g. mentoring,
teaching, professional advice)
Participates in events in the wider community
Gets involved in volunteer or social groups in the wider community

[379]
[Philanthropy]
Participates in charity events
Raises money for charity
Donates to a charity
Organises charity events and/or fundraisers
Volunteers in charitable initiatives
Supports a local charity
[Stakeholder]
Is polite towards others
Provides others with transparent and honest information
Listens to the viewpoints of others
Acts fairly towards others
Is helpful towards others
Treats others with respect
[Environmental]
Uses renewable resources where possible
Saves energy
Disposes of waste appropriately
Recycles
Behaves in an environmentally friendly manner
Reduces the environmental impact of his/her travel

[380]
[Legal]
Adheres to rules and regulations
Obeys the law
[Economic]
Looks for ways to cut costs
Is efficient in his/her daily tasks
Completes work to a high standard
Meets deadlines
Achieves his/her goals and objectives
Does his/her fair share of the work

[381]
Appendix 5
Business Game Sample: Team Member Questionnaire
[Hosted online: LimeSurvey]
Instructions for Respondents: This survey is about your Business Game group. Please
complete all questions with the answers that come first to your mind; there are no right or
wrong answers. Be sure to read the instructions for each set of questions before you respond.
This should take you approximately 15 minutes to complete, and the resulting feedback can
be utilised in your individual essays.
I would be grateful if you would allow us to use your data for our research into the
relationship between leadership and group and individual performance, which will help us
to generate and share knowledge about effective leadership and team working. This research
will involve matching your questionnaire scores with your assignment marks for the Business
Game module. To do this we need you to give us permission to obtain your demographic and
assignment marks from your student records. If you allow us to do this, we assure you that
all information would be treated in confidence.
By completing the questionnaire you consent to participation and the use of your data. If you
wish to withdraw consent at a later time, please e-mail Nishat on [email protected].

[382]
MLQ-5
Five point Likert scale (0=Not at all/ 4=Frequently or Always)
(Copyright © 1995 by Bernard Bass & Bruce J. Avolio)
CSR Climate (Mueller et al., 2012)
Five point Likert scale (1= Strongly Disagree/ 5= Strongly Agree)
To what extent do you agree with the following statements regarding your Business Game
group?
My group does enough towards protecting the environment
My group is a fair market participant
My group is maintaining a good reputation/positive image in public
I am satisfied with the way my group is taking responsibility for its members
My group does enough to support cultural and charitable initiatives and campaigns
Overall, I am satisfied with the way my group manages social responsibility
Assigned CSR priority (Revised from Zohar, 2002a)
Five point Likert scale (1= Not at all/ 5= To a very large extent)
To what extent does your Managing Director…?
Expect you to cut corners and neglect social responsibility? (R)
Turn a blind eye to social responsibility issues when there is a tight schedule? (R)

[383]
Disregard social responsibility issues as long as there has been no unethical act? (R)
Comment only on production-related issues? (R)
Get angry when s/he sees a team member performing a socially irresponsible act?
Employee Social Responsibility (ESR)
Seven point Likert scale (1=Strongly Disagree/ 7=Strongly Agree)
On behalf of the Business Game group, to what extent does this person engage in the
following behaviours?
[Social]
Educates at-risk groups in the community about key issues (e.g. health, education, social)
Organises events in the wider community (e.g. fairs, bazaars, fashion show etc.)
Assists in community projects
Provides his/her expertise to people in the wider community for free (e.g. mentoring,
teaching, professional advice)
Participates in events in the wider community
Gets involved in volunteer or social groups in the wider community
[Philanthropy]
Participates in charity events
Raises money for charity
Donates to a charity

[384]
Organises charity events and/or fundraisers
Volunteers in charitable initiatives
Supports a local charity
[Stakeholder]
Is polite towards others
Provides others with transparent and honest information
Listens to the viewpoints of others
Acts fairly towards others
Is helpful towards others
Treats others with respect
[Environmental]
Uses renewable resources where possible
Saves energy
Disposes of waste appropriately
Recycles
Behaves in an environmentally friendly manner
Reduces the environmental impact of his/her travel
[Legal]
Adheres to rules and regulations
Obeys the law

[385]
[Economic]
Looks for ways to cut costs
Is efficient in his/her daily tasks
Completes work to a high standard
Meets deadlines
Achieves his/her goals and objectives
Does his/her fair share of the work

[386]
Appendix 6
Interview script
Introduction
My research is interested in examining the various ways in which employee behaviours at
work can be socially responsible and contribute to the organisation’s social responsibility
efforts.
The purpose of today’s call is to understand your views on social responsibility, and possible
ways that employees can get involved in an organisation’s social responsibility efforts, whilst
at work. This interview will consist of outlining the definition of social responsibility, and the
five dimensions it is composed of. I will give a behavioural example within each dimension
and will ask for you to generate further examples that you deem to be fitting with the
definition of each dimension.
Definition of Social Responsibility
Social responsibility at work is defined as: employees’ behaviours which account for the
expectations of relevant stakeholders and contribute to the organisation’s economic, social,
philanthropic, stakeholder, and environmental performance.
Five Dimensions
It is suggested that there are 5 dimensions to social responsibility: Economic, environmental,
social, stakeholder and philanthropy. (Below definitions from Mueller et al., 2012)
- The economic dimension focuses on actions which contribute to economic development and
societal wealth such as profitability of the organisation.
-Environmental dimension refers to actions focusing on the protection of the natural
environment and the consideration of environmental concerns in business operations.

[387]
-Social dimension includes concern for and dedication to the communities and individuals
within society.
-Stakeholders-fair and adequate treatment of stakeholders in general such as customers and
employees for example.
-Voluntariness or the philanthropy dimension focuses on voluntary actions which go beyond
minimum legal requirements.
Do you believe this definition of CSR and the different dimensions of it are accurate?
Would you define it any other way?
[388]
Example of an item per dimension
I will now generate an example of a behaviour for the dimensions of employee social
responsibility, one by one, and would like for you to generate further examples of behaviours
within the same dimension.
Economic: completes assigned duties.
Environmental: recycles at work.
Social: takes part in the organization’s community projects.
Stakeholder: is helpful towards others, such as colleagues and customers.
Philanthropy: organizes fundraising events for charitable causes.
Participant Generated Behaviours
-Economic-
-Environmental-
-Social-

[389]
-Stakeholder-
-Philanthropy-
Other questions
Do you believe the five dimensions mentioned (economic, environmental, social, stakeholder,
and philanthropy) are all relevant to social responsibility?
Do you consider any dimension irrelevant? If so why?

[390]
Would you add any further dimensions?
Sample characteristics
Could you please now provide me with some general details?
-Age:
-Gender:
-Ethnicity:
-Occupation:
-Level of position:
-Industry:
-Public or Private sector:
-Company Size (SME, national, global):
Other/ Final comments/Not part of Interview/ Notes

[391]
Appendix 7
Table A7.01: Initial item pool
Employee Social Responsibility: Initial item pool
Generated from interview responses (inductively) and deductively based on prior research
and definitions of CSR
1. Supports local charities
2. Behaves with integrity at work
3. Fulfils his/her promises to others
4. Follows relevant guidelines and protocols at work
5. Uses renewable resources where possible
6. Receives good performance appraisals at work
7. Mentors other employees
8. Encourages others to be environmentally friendly
9. Considers individual needs when communicating
10. Treats their colleagues in the workplace equally
11. Works beyond normal working hours
12. Is loyal towards the company
13. Empathises with others at work
14. Is respectful towards others in the workplace
15. Does not speak ill of others
16. Uses the stairs as opposed to lifts at work
17. Participates in company sponsored events for noteworthy causes (e.g. marathons)
18. Lobby’s for a charity project at work
19. Raises awareness in the community about key work-related issues
20. Caters for any cultural/ religious differences that occur in their workplace
21. Caters for the requirements of others
22. Finds solutions to problems that occur in the workplace
23. Looks for improvements to be made in how their work is done
24. Completes their work duties correctly
25. Purchases goods responsibly at work (e.g. fair-trade, local produce)
26. Is hospitable towards others in the workplace
27. Manages expectations
28. Is welcoming towards new colleagues
29. Identifies new opportunities that can be exploited in their workplace
30. Publicises company events and encourages others to attend
31. Disposes of waste appropriately
32. Preserves confidentiality when required
33. Maintains positive relationships with others
34. Uses more environmentally friendly means of communication as opposed to paper-
based e.g. e-mails
35. Volunteers as part of a workplace initiative
36. Completes assigned duties
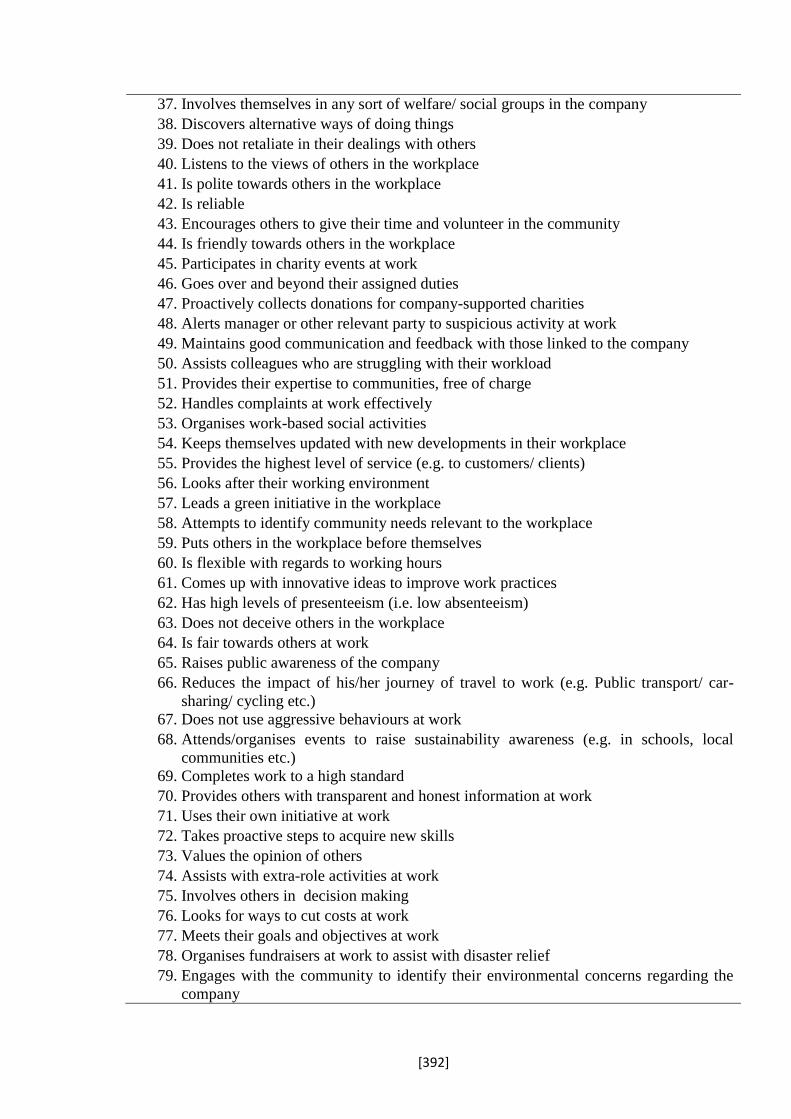
[392]
37. Involves themselves in any sort of welfare/ social groups in the company
38. Discovers alternative ways of doing things
39. Does not retaliate in their dealings with others
40. Listens to the views of others in the workplace
41. Is polite towards others in the workplace
42. Is reliable
43. Encourages others to give their time and volunteer in the community
44. Is friendly towards others in the workplace
45. Participates in charity events at work
46. Goes over and beyond their assigned duties
47. Proactively collects donations for company-supported charities
48. Alerts manager or other relevant party to suspicious activity at work
49. Maintains good communication and feedback with those linked to the company
50. Assists colleagues who are struggling with their workload
51. Provides their expertise to communities, free of charge
52. Handles complaints at work effectively
53. Organises work-based social activities
54. Keeps themselves updated with new developments in their workplace
55. Provides the highest level of service (e.g. to customers/ clients)
56. Looks after their working environment
57. Leads a green initiative in the workplace
58. Attempts to identify community needs relevant to the workplace
59. Puts others in the workplace before themselves
60. Is flexible with regards to working hours
61. Comes up with innovative ideas to improve work practices
62. Has high levels of presenteeism (i.e. low absenteeism)
63. Does not deceive others in the workplace
64. Is fair towards others at work
65. Raises public awareness of the company
66. Reduces the impact of his/her journey of travel to work (e.g. Public transport/ car-
sharing/ cycling etc.)
67. Does not use aggressive behaviours at work
68. Attends/organises events to raise sustainability awareness (e.g. in schools, local
communities etc.)
69. Completes work to a high standard
70. Provides others with transparent and honest information at work
71. Uses their own initiative at work
72. Takes proactive steps to acquire new skills
73. Values the opinion of others
74. Assists with extra-role activities at work
75. Involves others in decision making
76. Looks for ways to cut costs at work
77. Meets their goals and objectives at work
78. Organises fundraisers at work to assist with disaster relief
79. Engages with the community to identify their environmental concerns regarding the
company

[393]
80. Uses environmentally efficient products (e.g. energy saving light bulbs)
81. Makes use of company based initiatives to network
82. Resolves conflicts with others
83. Is warm and welcoming at work
84. Speaks up for injustice at work
85. Is punctual to work
86. Reduces energy wastage by switching off unused lights/ appliances/ electrical
equipment
87. Is efficient in their daily tasks
88. Engages in positive word-of-mouth communication about the company
89. Shares their skills with others in the workplace
90. Is helpful towards others (e.g. colleagues and customers)
91. Is attentive to the needs of others
92. Follows the relevant waste management procedures
93. Recycles at work
94. Educates others at work about environmental sustainability
95. Organises (or assists in) charity events/ fundraisers at work
96. Is not wasteful
97. Fulfils their job role specification
98. Goes the extra mile with others at work
99. Participates in the relevant training and development activities at work
100. Uses recyclable packaging at work
101. Participates in community based company events
102. Organises fetes in the local community
103. Uses resources at work efficiently
104. Educates at-risk groups in the community about key issues
105. Assists in the organisations community projects
106. Donates to company-supported charities
107. Meets deadlines at work
108. Attends relevant meetings at work
109. Ensures that others have access to what they need
110. Teaches others at work about environmental sustainability
111. Maintains professionalism in his/her dealings with others
112. Considers the long-term impact of their activities at work

[394]
Appendix 8
Subject-matter expert ratings: Excel Template
Figure A8.01: Instructions to subject-matter experts
Item Economic Environmental Social Stakeholder Philanthropy Other
8
x/ [name]
Instructions Definitions
Employee does X
Employee does Y
Example
This task is part of the scale development process, in order to develop a scale which can measure employee socially responsible behaviours. Social responsibility at the employee level is defined as employee behaviours which account for the expectations of relevant stakeholders and contribute to the organisation’s economic, social, philanthropic, stakeholder, and environmental performance. The definitions of each dimension are on the right hand side.
On the Main Sheet tab below, you have a table with all possible items for the scale and the five different dimensions, as informed by the above definition, and of the definitions of the individual dimensions. These items refer to socially responsible behaviours which individuals/groups might engage in at work. The task is for you to indicate which dimension you think the item represents, and to what extent on a scale from 1 (not at all) to 10 (completely). See below for an example.
'Other' Category1. If you feel an item belongs to none of the five listed dimensions then insert 'x' under 'other.'2. If you feel an item belongs to none of the five listed dimensions, BUT you can think of another suitable category which it belongs to; indicate your name for this category under 'other'.
Before you start, you may find it helpful to print this sheet out and keep it at hand while you complete the task. This task should take no longer than 15-20 minutes.
- Economic: actions which contribute to economic development and societal wealth such as profitability of the organisation.
-Environmental : actions focusing on the protection of the natural environment and the consideration of environmental concerns in business operations.
-Social : actions which have a concern for and dedication to the communities and individuals within society.
-Stakeholders: fair and appropriate treatment of stakeholders in general such as customers and employees for example.
-Voluntariness /Philanthropy: employee voluntary actions which go beyond minimum legal requirements.

[395]
Figure A8.02: Example of a completed form by a subject-matter expert
Item Economic Environmental Social Stakeholder Philanthropy Other
Supports local charities 8 2
Behaves with integrity at work 5 5
Fulfils his/her promises to others 5 5
Follows relevant guidelines and protocols at work 5
Uses renewable resources where possible 9
Receives good performance appraisals at work 9
Mentors other employees 9
Encourages others to be environmentally friendly 8
Considers individual needs when communicating 6
Treats their colleagues in the workplace equally 7
Works beyond normal working hours 6
Is loyal towards the company 6
Empathises with others at work 6
Is respectful towards others in the workplace 6
Does not speak ill of others 6
Uses the stairs as opposed to lifts at work 7
Participates in company sponsored events for noteworthy causes (e.g. marathons) 6
Lobbys for a charity project at work 7
Raises awareness in the community about key work-related issues 7
Caters for any cultural/ religious differences that occur in their workplace 5
Caters for the requirements of others 6
Finds solutions to problems that occur in the workplace 7
Looks for improvements to be made in how their work is done 7
Completes their work duties correctly 9
Purchases goods responsibly at work (e.g. fairtrade, local produce) 5 5
Is hospitable towards others in the workplace 7
Manages expectations 7 2
Is welcoming towards new colleagues 8

[396]
Appendix 9
CFA Models: BG sample
Figure A9.01: CFA model for leader-ratings-Time 1

[397]
Figure A9.02: CFA model for leader ratings-Time 2

[398]
Figure A9.03: CFA model for leader ratings-Time 3

[399]
Figure A9.04: CFA model for team member ratings-Time 1

[400]
Figure A9.05: CFA model for team member ratings-Time 2

[401]
Figure A9.06: CFA model for team member ratings-Time 3

[402]
Appendix 10
Inter-item correlations
Company Sample
Table A10.01: Inter-item correlations for company sample-leader ratings
Note: N =121; *p<0.05 **p<0.01
Soc = social; phil = philanthropy; stake = stakeholder; env = environmental; econ = economic
Leader
ratings
Item code
1 2 3 4 5 6 7 8 9 10
soc3 -
soc6 .83** -
phil8 .63** .69** -
phil11 .63** .62** .78** -
stake16 .22* .22* .35** .36** -
stake18 .25* .30** .43** .46** .60** -
env22 .06 .09 -.01 .02 .18 .24* -
env23 .26** .27** .20* .16 .32** .31** .61** -
econ29 .17 .10 .22* .20* .42** .55** .27** .28** -
econ32 .14 .09 .17 .13 .28** .46** .23* .25* .76** -

[403]
Table A10.02: Inter-item correlations for company sample-team member self-ratings
Team member
self-ratings
Item code
1 2 3 4 5 6 7 8 9 10
soc3 -
soc6 .76** -
phil8 .54** .58** -
phil11 .62** .67** .65** -
stake16 -.04 -.05 -.02 .10 -
stake18 -.04 -.05 -.02 .12 .94** -
env22 -.10 -.10 .03 .09 .38** .34** -
env23 -.05 .02 .15 .17 .35** .32** .89** -
econ29 .02 -.04 .04 .11 .55** .54** .39** .41** -
econ32 .00 -.08 -.04 .07 .51** .53** .33** .31** .83** -
Note: N =101; *p<0.05 **p<0.01
Soc = social; phil = philanthropy; stake = stakeholder; env = environmental; econ = economic

[404]
Business Game Sample
Table A10.03: Inter-item correlations for BG sample-leader ratings-Time 1
Leader ratings
Time 1
Item code
1 2 3 4 5 6 7 8 9 10
soc3 -
soc6 .53** -
phil8 .48** .59** -
phil11 .59** .48** .69** -
stake16 .11 .23** .17* .145* -
stake18 .10 .24** .16* .12 .84** -
env22 .01 .08 .08 -.03 .39** .40** -
env23 .00 .16* .13 .05 .38** .37** .78** -
econ29 .09 .20** .15* .15* .48** .45** .30** .36** -
econ32 .06 .18** .09 .15* .58** .52** .27** .34** .80** -
Note: N = 196 – 208 (range); *p<0.05 **p<0.01
Soc = social; phil = philanthropy; stake = stakeholder; env = environmental; econ = economic

[405]
Table A10.04: Inter-item correlations for BG sample-leader ratings-Time 2
Leader ratings
Time 2
Item code
1 2 3 4 5 6 7 8 9 10
soc3 -
soc6 .80** -
phil8 .63** .72** -
phil11 .52** .56** .77** -
stake16 .00 .07 .09 .06 -
stake18 .04 .07 .10 .08 .87** -
env22 .24** .24** .24** .21** .43** .37** -
env23 .26** .27** .19** .19** .44** .37** .83** -
econ29 .01 .05 .12 -.05 .68** .58** .33** .28** -
econ32 .05 .07 .13 .09 .70** .60** .36** .35** .79** -
Note: N =214 – 215 (range); *p<0.05 **p<0.01
Soc = social; phil = philanthropy; stake = stakeholder; env = environmental; econ = economic

[406]
Table A10.05: Inter-item correlations for BG sample-leader ratings-Time 3
Leader ratings
Time 3
Item code
1 2 3 4 5 6 7 8 9 10
soc3 -
soc6 .83** -
phil8 .71** .81** -
phil11 .77** .89** .85** -
stake16 .13 .17* .24** .12 -
stake18 .10 .14* .21** .09 .86** -
env22 .16* .30** .15* .21** .48** .45** -
env23 .37** .47** .44** .46** .47** .45** .81** -
econ29 .14* .20** .16* .15* .67** .68** .39** .34** -
econ32 .16* .21** .19** .16* .69** .68** .41** .42** .90** -
Note: N =209 – 212 (range); *p<0.05 **p<0.01
Soc = social; phil = philanthropy; stake = stakeholder; env = environmental; econ = economic

[407]
Table A10.06: Inter-item correlations for BG sample-team member ratings-Time 1
Team member
ratings-Time 1
Item code
1 2 3 4 5 6 7 8 9 10
soc3 -
soc6 .76** -
phil8 .74** .74** -
phil11 .73** .76** .79** -
stake16 .30** .31** .32** .26** -
stake18 .24** .28** .26** .23** .86** -
env22 .39** .41** .49** .48** .42** .40** -
env23 .38** .39** .44** .41** .42** .39** .80** -
econ29 .25** .29** .27** .25** .66** .69** .39** .44** -
econ32 .23** .23** .18** .21** .57** .56** .29** .37** .79** -
Note: N =218 – 219 (range); *p<0.05 **p<0.01
Soc = social; phil = philanthropy; stake = stakeholder; env = environmental; econ = economic

[408]
Table A10.07: Inter-item correlations for BG sample-team member ratings-Time 2
Team member
ratings-Time 2
Item code
1 2 3 4 5 6 7 8 9 10
soc3 -
soc6 .66** -
phil8 .78** .69** -
phil11 .71** .60** .81** -
stake16 .24** .35** .23** .17* -
stake18 .25** .35** .26** .17* .88** -
env22 .34** .53** .44** .40** .53** .50** -
env23 .35** .44** .45** .45** .57** .54** .82** -
econ29 .18** .38** .23** .17* .70** .70** .49** .49** -
econ32 .27** .41** .29** .20** .64** .68** .45** .51** .80** -
Note: N =218 – 220 (range); *p<0.05 **p<0.01
Soc = social; phil = philanthropy; stake = stakeholder; env = environmental; econ = economic

[409]
Table A10.08: Inter-item correlations for BG sample-team member ratings-Time 3
Team member
ratings-Time 3
Item code
1 2 3 4 5 6 7 8 9 10
soc3 -
soc6 .76** -
phil8 .69** .80** -
phil11 .71** .75** .72** -
stake16 .34** .41** .30** .43** -
stake18 .35** .42** .29** .38** .86** -
env22 .50** .57** .52** .51** .57** .58** -
env23 .52** .56** .51** .51** .55** .59** .89** -
econ29 .44** .39** .32** .38** .70** .70** .52** .54** -
econ32 .36** .35** .24** .34** .67** .67** .51** .51** .86** -
Note: N =217 – 218 (range); *p<0.05 **p<0.01
Soc = social; phil = philanthropy; stake = stakeholder; env = environmental; econ = economic


