
The Kentucky Budget OutlookPresentation to the Friedell Committee
November 10, 2013
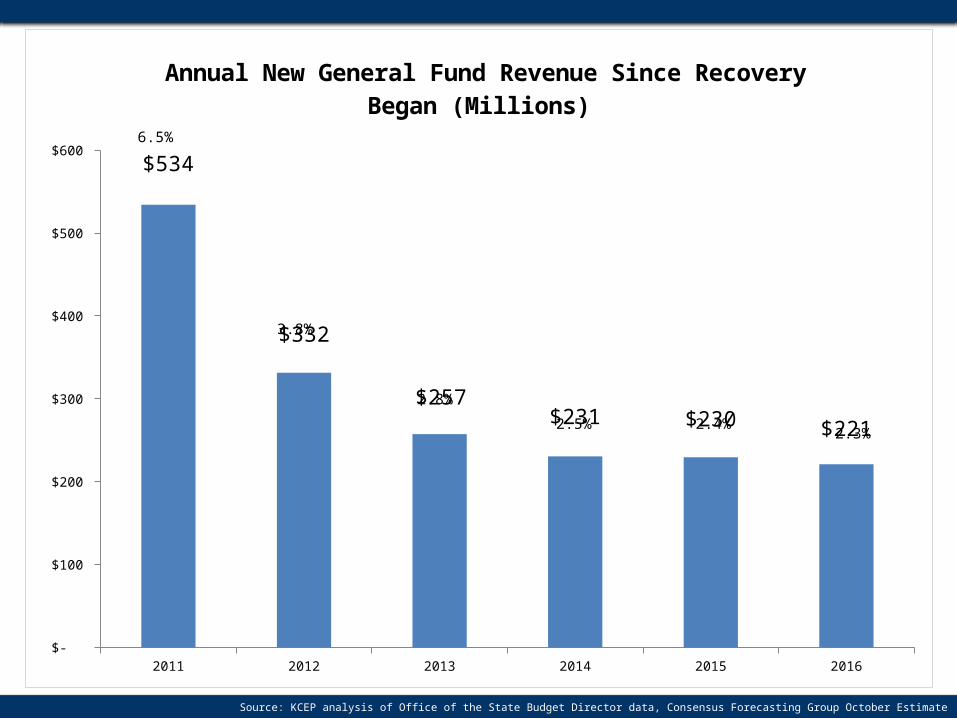
Source: KCEP analysis of Office of the State Budget Director data, Consensus Forecasting Group October Estimate
2011 2012 2013 2014 2015 2016 $-
$100
$200
$300
$400
$500
$600
$534
$332
$257 $231 $230 $221
Annual New General Fund Revenue Since Recovery Began (Millions)
6.5%
2.3%
3.8%
2.4%2.5%
2.8%
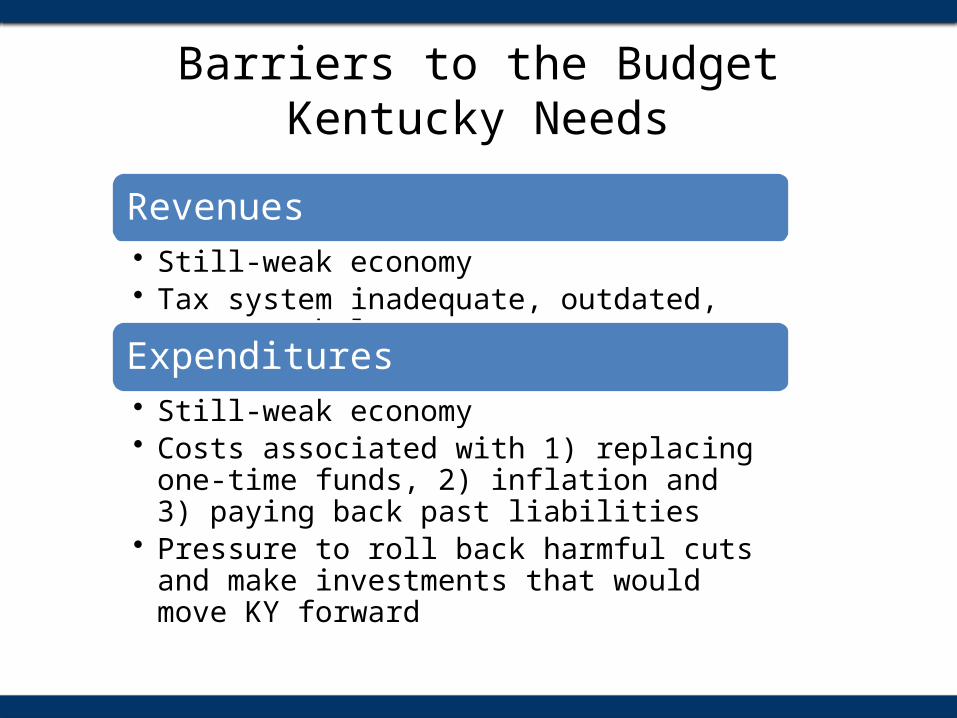
Revenues• Still-weak economy• Tax system inadequate, outdated, too many holes
Expenditures• Still-weak economy• Costs associated with 1) replacing one-time funds,
2) inflation and 3) paying back past liabilities• Pressure to roll back harmful cuts and make
investments that would move KY forward
Barriers to the Budget Kentucky Needs
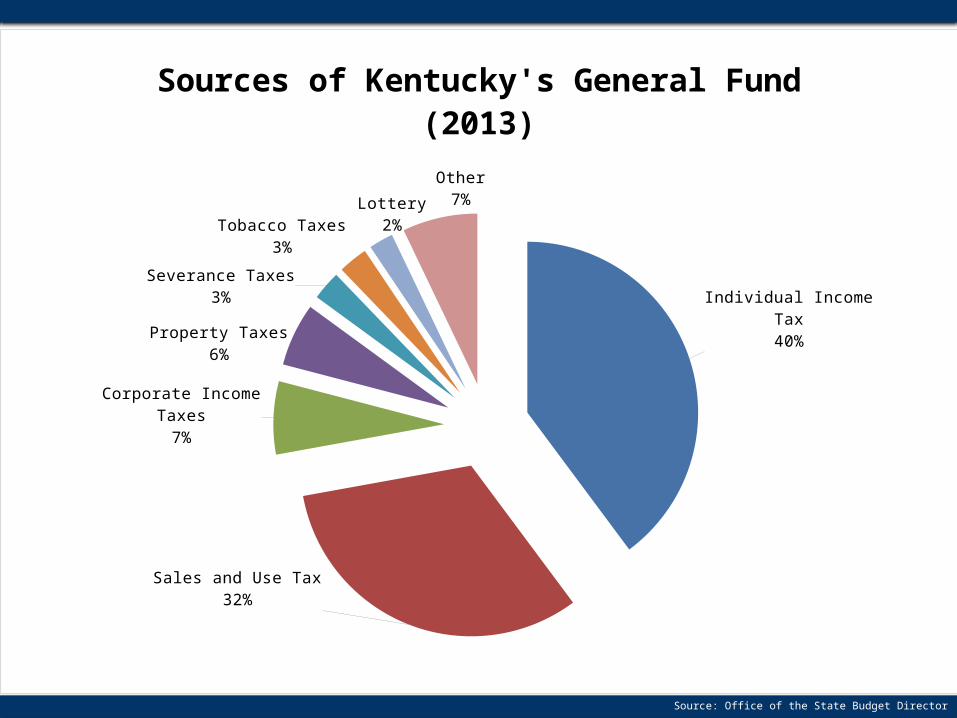
Individual Income Tax40%
Sales and Use Tax32%
Corporate Income Taxes7%
Property Taxes6%
Severance Taxes3%
Tobacco Taxes3%
Lottery2%
Other7%
Sources of Kentucky's General Fund (2013)
Source: Office of the State Budget Director
Jan-
00
Jan-
01
Jan-
02
Jan-
03
Jan-
04
Jan-
05
Jan-
06
Jan-
07
Jan-
08
Jan-
09
Jan-
10
Jan-
11
Jan-
12
Jan-
131650
1700
1750
1800
1850
1900
1950
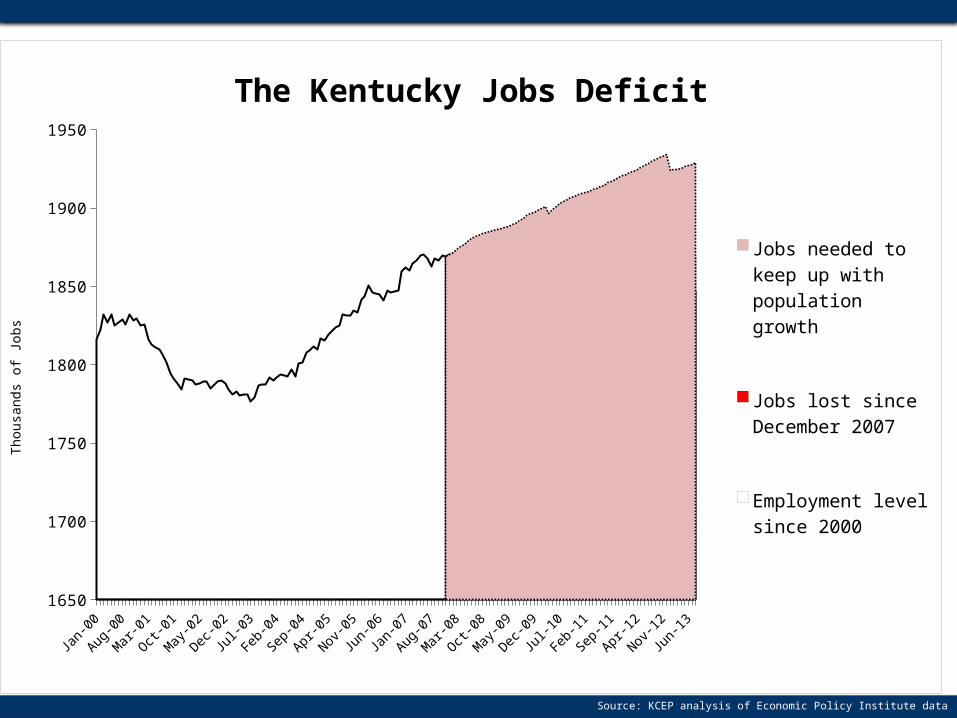
The Kentucky Jobs Deficit
Jobs needed to keep up with popu-lation growth
Jobs lost since December 2007
Employment level since 2000
Tho
usan
ds o
f Jo
bs
Source: KCEP analysis of Economic Policy Institute data

Source: KCEP analysis of Economic Policy Institute data
-3
-2
-1
0 1 2 3 4 5 6 7 8 9 10
11
12
13
14
15
16
17
18
19
20
21
22
23
24
25
26
27
28
29
30
31
32
33
34
35
36
37
38
39
40
41
42
43
44
45
46
47
48
49
50
51
52
53
54
55
56
57
58
59
60
61
62
63
64
65
66
67
0.850
0.900
0.950
1.000
1.050
1.100
1.150
Kentucky Job Recovery From Recession Slower than Previous Re-cessions
1981 Reces-sion1990 Reces-sion2001 Reces-sion2007 Reces-sion
Months from start of recession

Source: KCEP analysis of Economic Policy Institute data
2001 2002 2003 2004 2005 2006 2007 2008 2009 2010 2011 2012$14.00
$14.20
$14.40
$14.60
$14.80
$15.00
$15.20
$15.40
$15.60
$15.80
$16.00
Median Kentucky Workers' Real Wages Are Falling
Source: KCEP analysis of Economic Policy Institute data
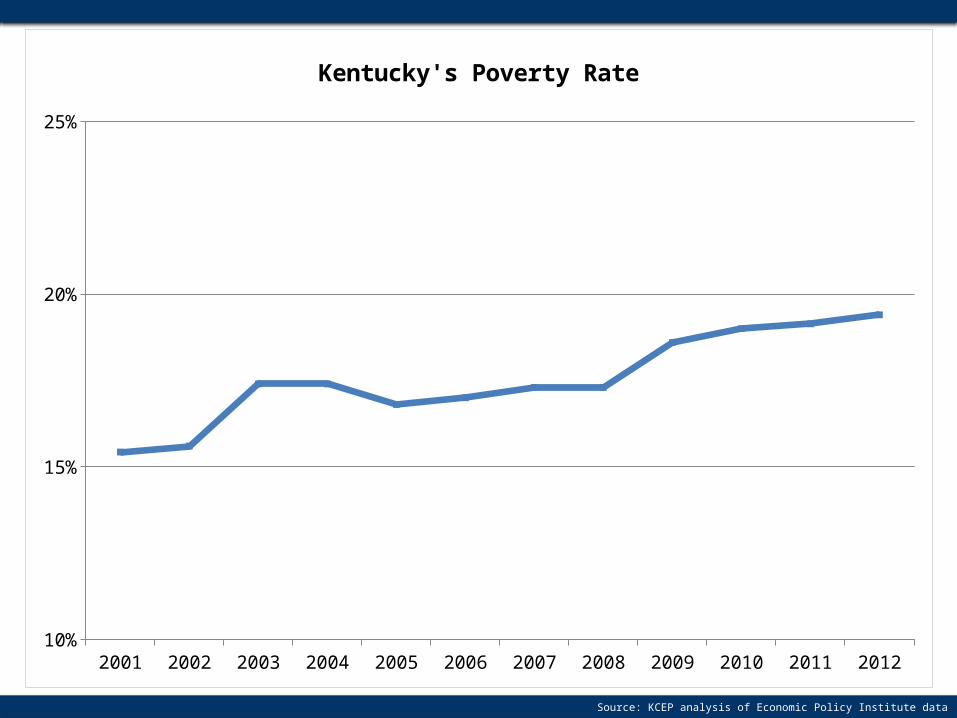
2001 2002 2003 2004 2005 2006 2007 2008 2009 2010 2011 201210%
15%
20%
25%
Kentucky's Poverty Rate
Source: KCEP analysis of Office of the State Budget Director, BEA data
19911992
19931994
19951996
19971998
19992000
20012002
20032004
20052006
20072008
20092010
20112012
20132014
20152016
20172018
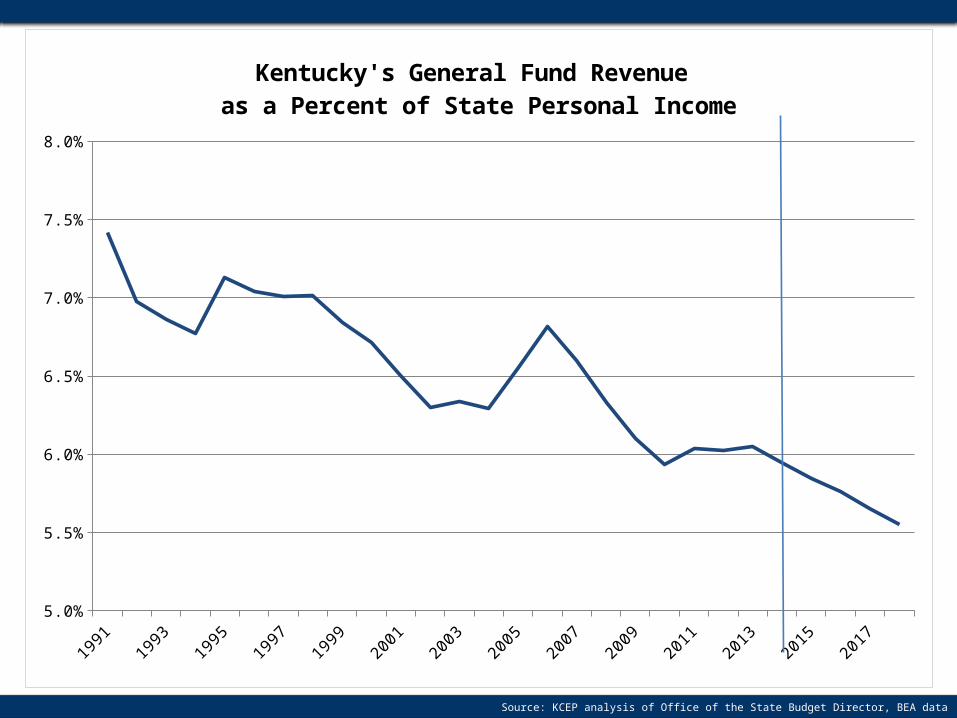
5.0%
5.5%
6.0%
6.5%
7.0%
7.5%
8.0%
Kentucky's General Fund Revenue as a Percent of State Personal Income
Source: Center on Budget and Policy Priorities
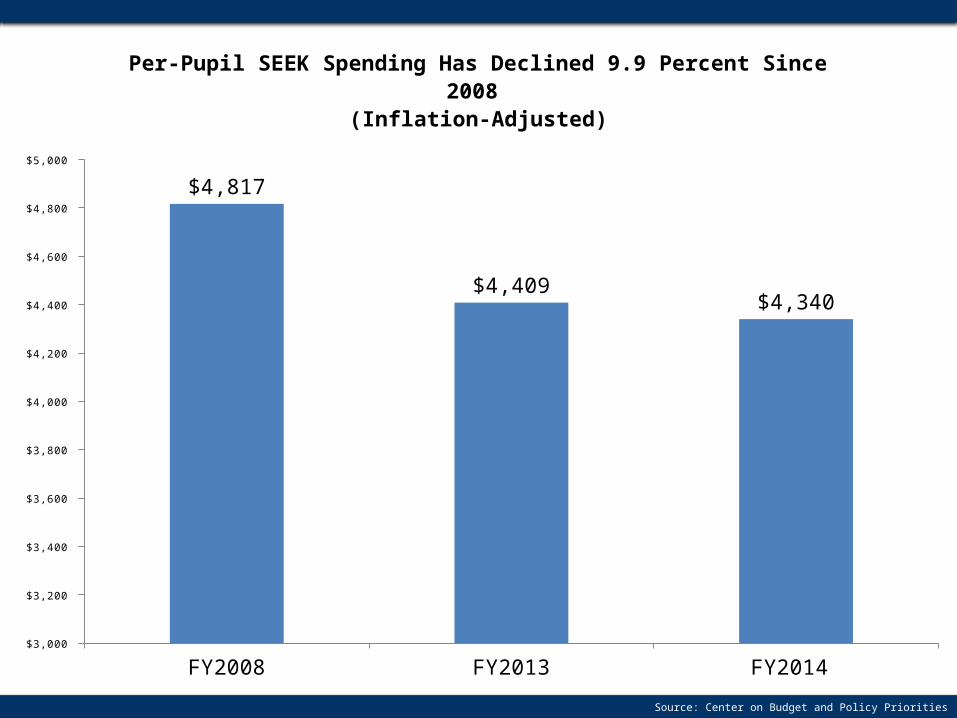
FY2008 FY2013 FY2014 $3,000
$3,200
$3,400
$3,600
$3,800
$4,000
$4,200
$4,400
$4,600
$4,800
$5,000
$4,817
$4,409 $4,340
Per-Pupil SEEK Spending Has Declined 9.9 Percent Since 2008 (Inflation-Adjusted)

Source: KCEP analysis of Office of the State Budget Director data
Cuts to P-12 Education Programs Since 2008
FY 08 FY 13 Dollar Change
Percent Change Inflation-Adjusted Percent Change
Textbooks 21.7 0 -21.7 -100% -100%
Extended School Services 31.8 12.3 -19.5 -61% -65%
Professional Development 15 5.3 -9.7 -65% -68%
School Technology 39.8 31.5 -8.3 -21% -29%
Career & Technical Education 30.3 23.7 -6.6 -22% -29%
Safe Schools 10.4 4.2 -6.2 -60% -64%
Preschool 75.1 71.3 -3.8 -5% -14%
Total 224.1 148.3 -75.8 -34% -40%
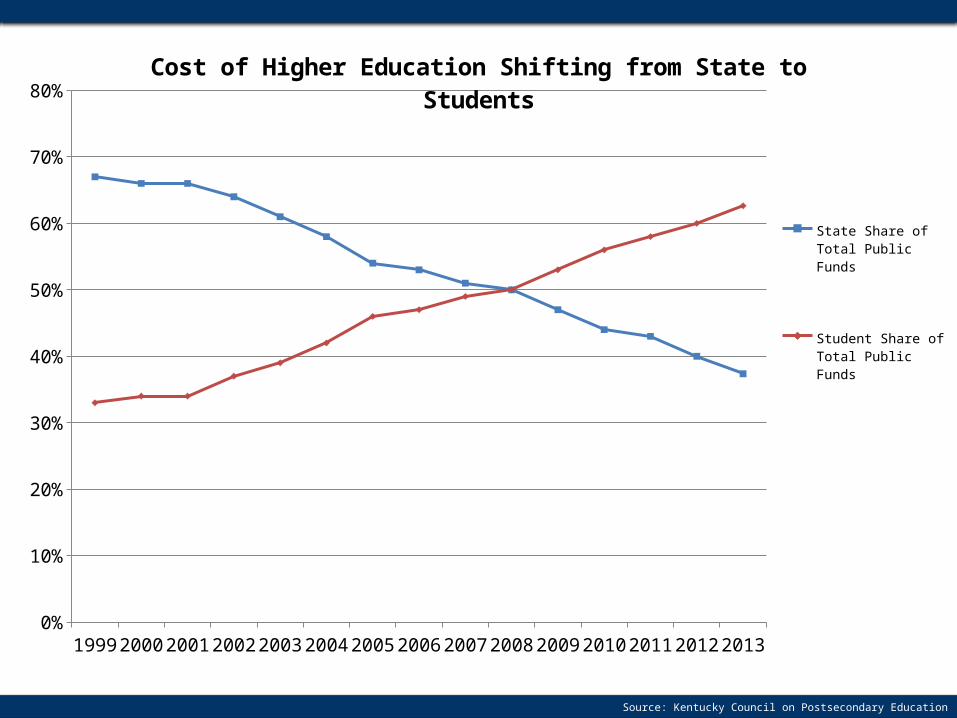
Source: Kentucky Council on Postsecondary Education
1999 2000 2001 2002 2003 2004 2005 2006 2007 2008 2009 2010 2011 2012 20130%
10%
20%
30%
40%
50%
60%
70%
80%Cost of Higher Education Shifting from State to Students
State Share of Total Public Funds
Student Share of To-tal Public Funds
Health & Human Services Cuts
• Rapid transition to Medicaid managed care
• Mental health appropriations not increased for 14 years, Medicaid rates frozen since 2001
• Public health department funding 23% below 2008 level
• Cut to child care subsidies to lowest income eligibility in country
Source: KCEP analysis of the Budget of the Commonwealth
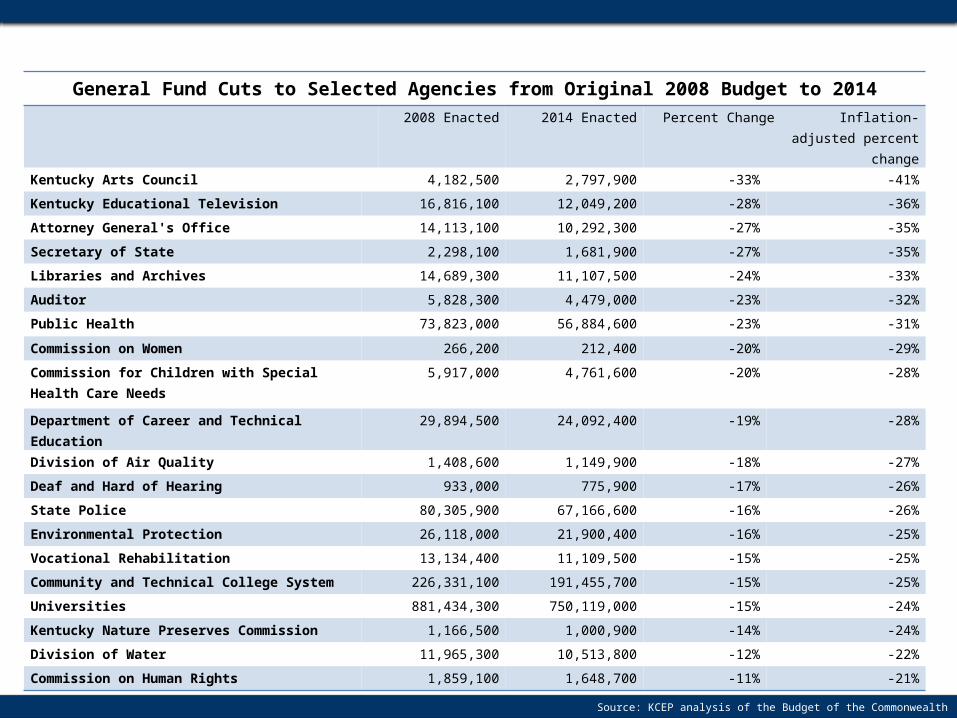
General Fund Cuts to Selected Agencies from Original 2008 Budget to 2014
2008 Enacted 2014 Enacted Percent Change Inflation-adjusted percent change
Kentucky Arts Council 4,182,500 2,797,900 -33% -41%
Kentucky Educational Television 16,816,100 12,049,200 -28% -36%
Attorney General's Office 14,113,100 10,292,300 -27% -35%
Secretary of State 2,298,100 1,681,900 -27% -35%
Libraries and Archives 14,689,300 11,107,500 -24% -33%
Auditor 5,828,300 4,479,000 -23% -32%
Public Health 73,823,000 56,884,600 -23% -31%
Commission on Women 266,200 212,400 -20% -29%
Commission for Children with Special Health Care Needs
5,917,000 4,761,600 -20% -28%
Department of Career and Technical Education 29,894,500 24,092,400 -19% -28%
Division of Air Quality 1,408,600 1,149,900 -18% -27%
Deaf and Hard of Hearing 933,000 775,900 -17% -26%
State Police 80,305,900 67,166,600 -16% -26%
Environmental Protection 26,118,000 21,900,400 -16% -25%
Vocational Rehabilitation 13,134,400 11,109,500 -15% -25%
Community and Technical College System 226,331,100 191,455,700 -15% -25%
Universities 881,434,300 750,119,000 -15% -24%
Kentucky Nature Preserves Commission 1,166,500 1,000,900 -14% -24%
Division of Water 11,965,300 10,513,800 -12% -22%
Commission on Human Rights 1,859,100 1,648,700 -11% -21%
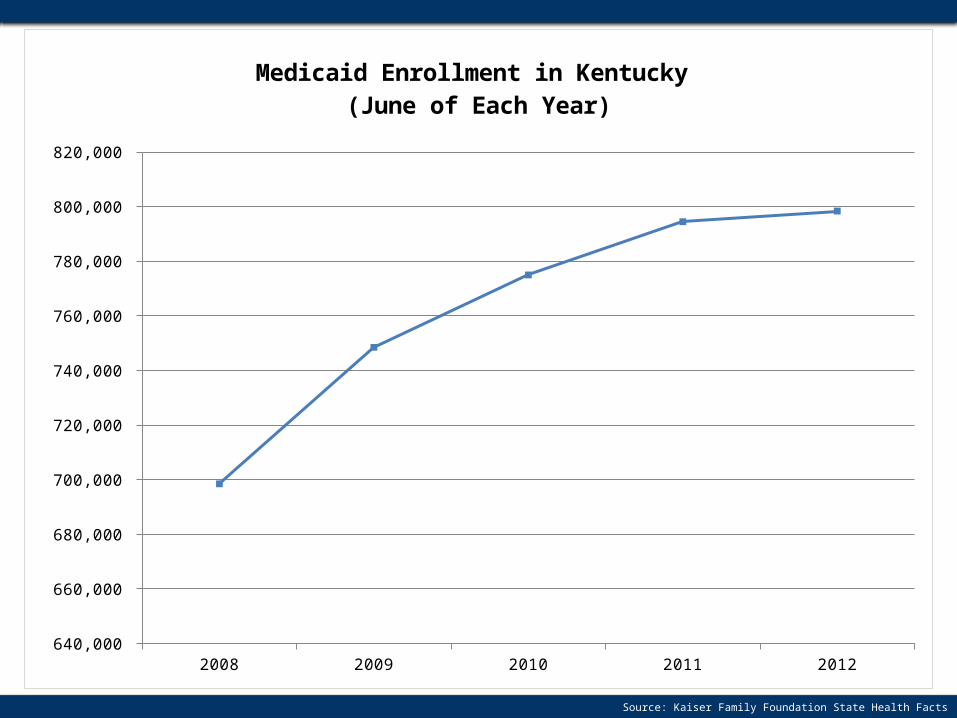
Source: Kaiser Family Foundation State Health Facts
2008 2009 2010 2011 2012 640,000
660,000
680,000
700,000
720,000
740,000
760,000
780,000
800,000
820,000
Medicaid Enrollment in Kentucky (June of Each Year)
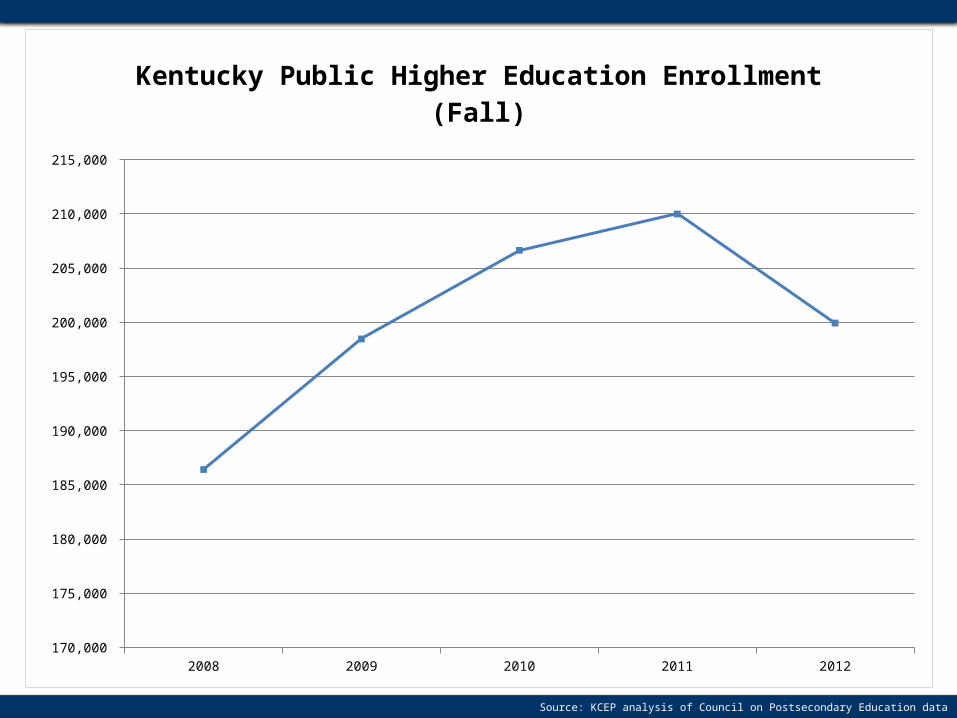
Source: KCEP analysis of Council on Postsecondary Education data
2008 2009 2010 2011 2012 170,000
175,000
180,000
185,000
190,000
195,000
200,000
205,000
210,000
215,000
Kentucky Public Higher Education Enrollment (Fall)
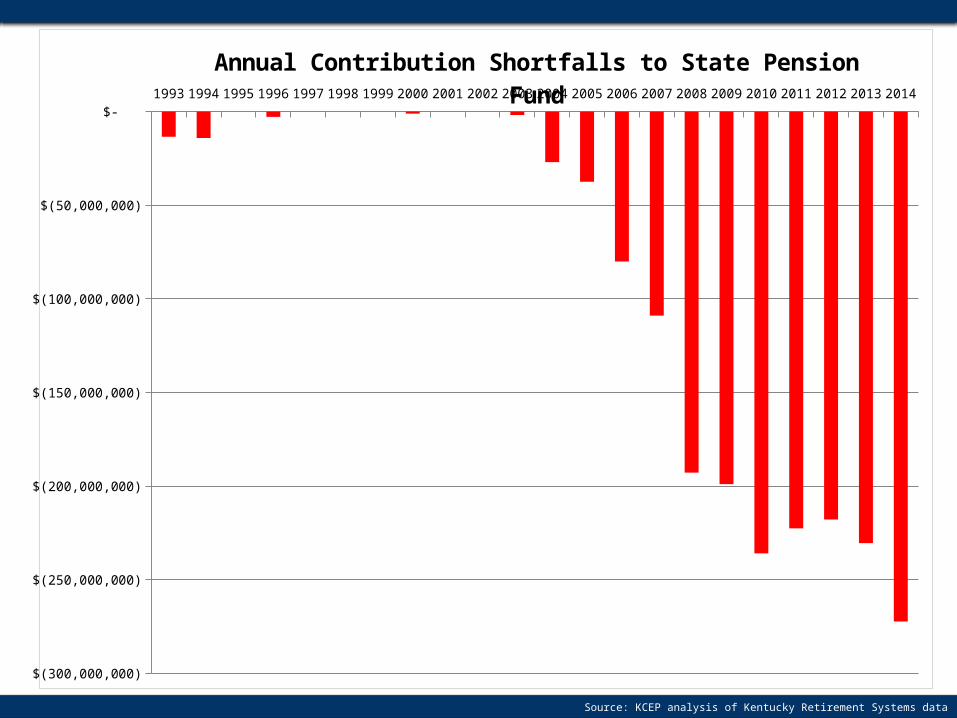
Source: KCEP analysis of Kentucky Retirement Systems data
1993 1994 1995 1996 1997 1998 1999 2000 2001 2002 2003 2004 2005 2006 2007 2008 2009 2010 2011 2012 2013 2014
$(300,000,000)
$(250,000,000)
$(200,000,000)
$(150,000,000)
$(100,000,000)
$(50,000,000)
$-
Annual Contribution Shortfalls to State Pension Fund

Source: CFG October forecast, June 27 Office of the State Budget Director presentation
Additional Revenue Additional Costs$0
$100
$200
$300
$400
$500
$600
$700
October Forecast230 Replace One-Time Funds Used to
Balance the Budget$157
Payment Toward State Pension Sys-tem$148
Inflation in Health Care Prices$115
1% SEEK Funding Increase $29
1% Increase in Teacher Pay $23
Fund Critical Gaps in K-12 Programs Such as Textbooks & Professional Development
$64
Restore Childcare Assistance & Pro-tective Services Cuts
$87
New Revenue Wouldn't Even Cover Basic CostsM
illio
ns o
f Dol
lars
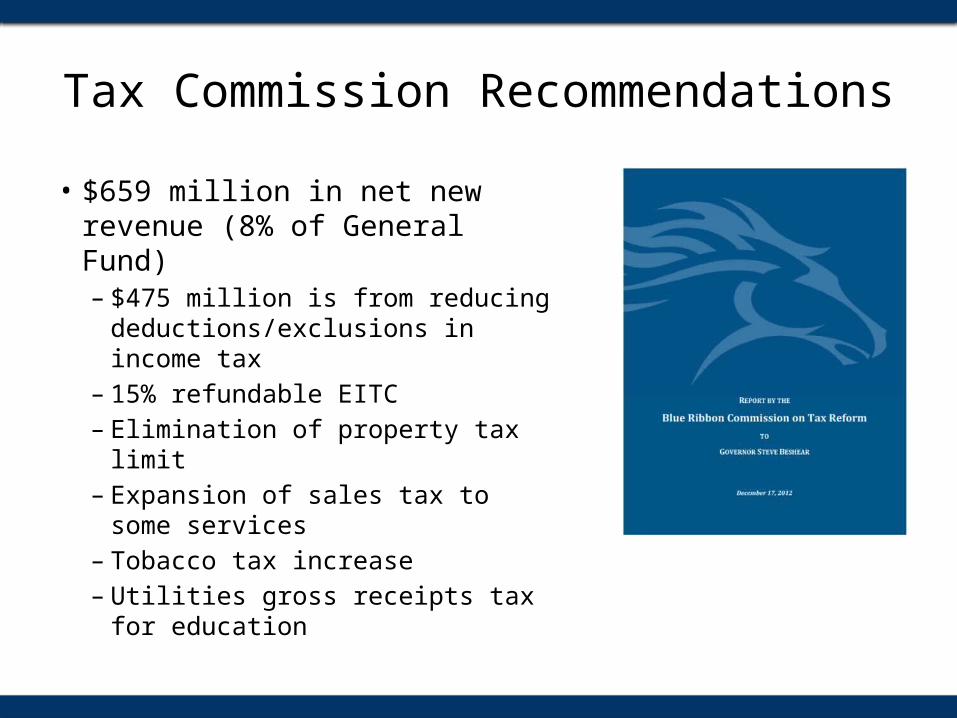
Tax Commission Recommendations
• $659 million in net new revenue (8% of General Fund)– $475 million is from reducing
deductions/exclusions in income tax
– 15% refundable EITC– Elimination of property tax limit– Expansion of sales tax to some
services– Tobacco tax increase– Utilities gross receipts tax for
education
Moving Forward with Tax Reform
Kentucky Center for Economic Policywww.kypolicy.org


