Southall And Brent REvisited (SABRE) cohort
Therese Tillin
Institute of Cardiovascular Science
University College London

….and Brent
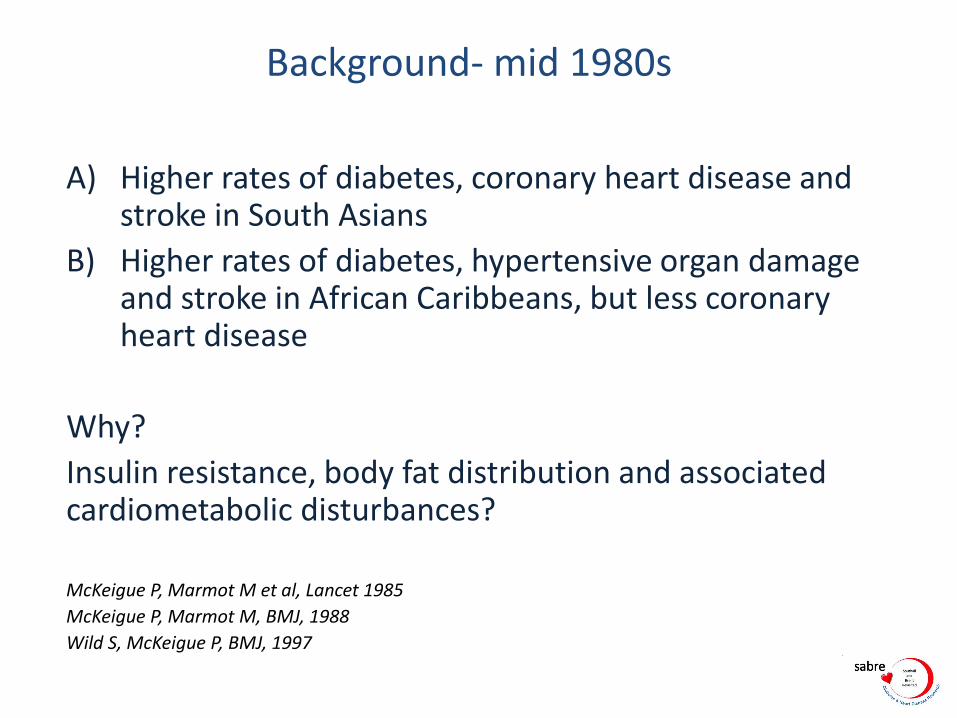
Background- mid 1980s
A) Higher rates of diabetes, coronary heart disease and stroke in South Asians
B) Higher rates of diabetes, hypertensive organ damage and stroke in African Caribbeans, but less coronary heart disease
Why?
Insulin resistance, body fat distribution and associated cardiometabolic disturbances?
McKeigue P, Marmot M et al, Lancet 1985
McKeigue P, Marmot M, BMJ, 1988
Wild S, McKeigue P, BMJ, 1997
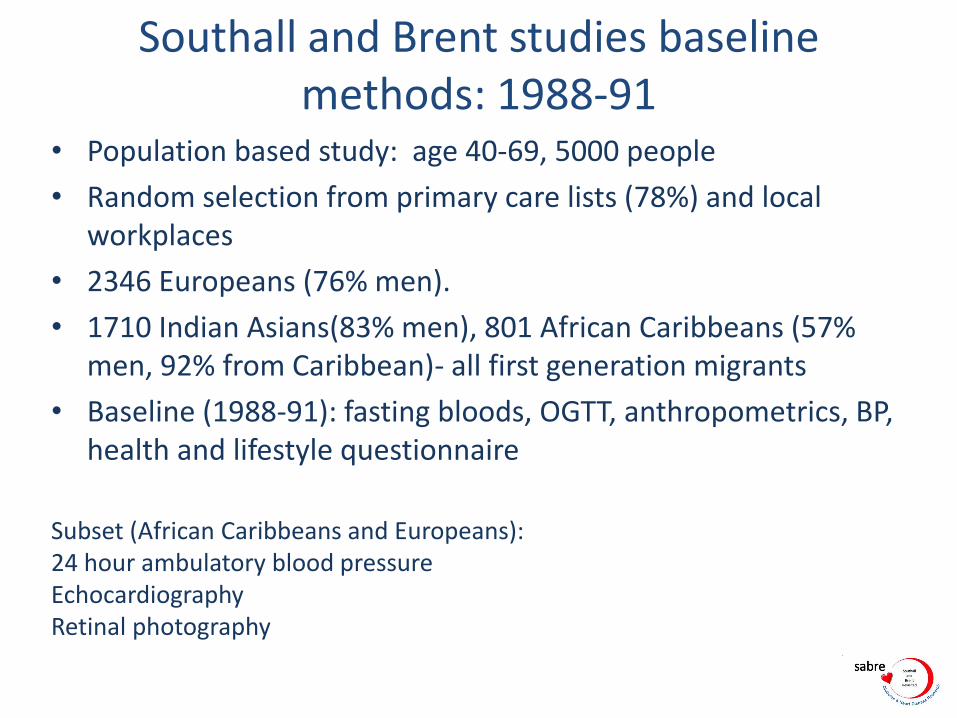
Southall and Brent studies baseline methods: 1988-91
• Population based study: age 40-69, 5000 people
• Random selection from primary care lists (78%) and local workplaces
• 2346 Europeans (76% men).
• 1710 Indian Asians(83% men), 801 African Caribbeans (57% men, 92% from Caribbean)- all first generation migrants
• Baseline (1988-91): fasting bloods, OGTT, anthropometrics, BP, health and lifestyle questionnaire
Subset (African Caribbeans and Europeans): 24 hour ambulatory blood pressure Echocardiography Retinal photography

Southall and Brent baseline study findings (Cross-sectional)
South Asians: central obesity, insulin resistant, dyslipidaemic regardless of ethnic sub-group.

Southall and Brent baseline study findings (Cross-sectional)
South Asians: central obesity, insulin resistant, dyslipidaemic regardless of ethnic sub-group.
Is insulin resistance the underlying explanation for excess CVD risk?
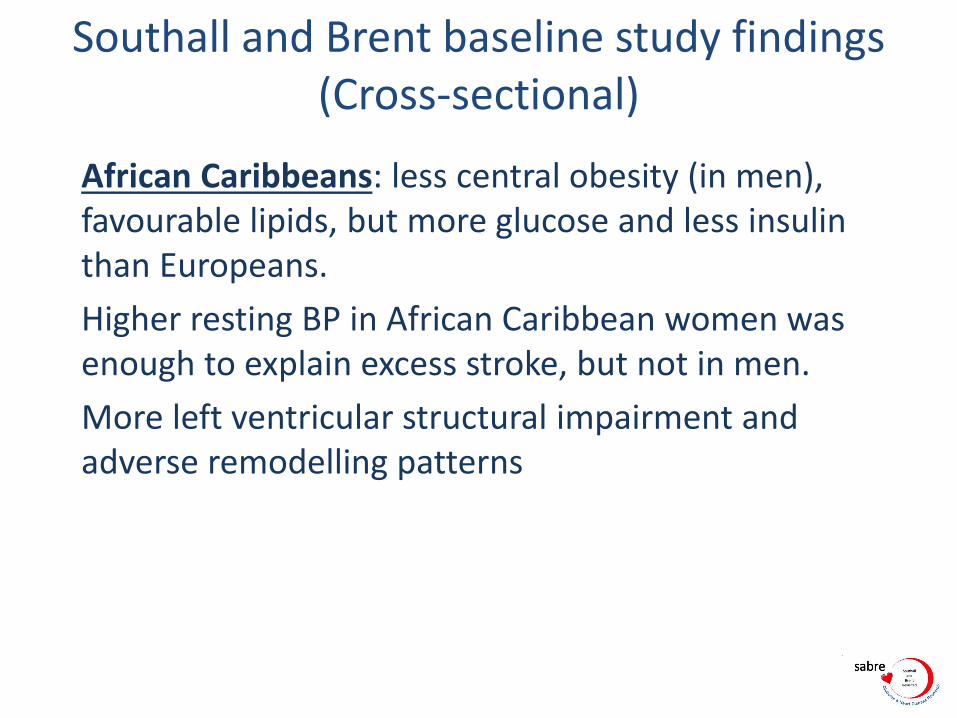
Southall and Brent baseline study findings (Cross-sectional)
African Caribbeans: less central obesity (in men), favourable lipids, but more glucose and less insulin than Europeans.
Higher resting BP in African Caribbean women was enough to explain excess stroke, but not in men.
More left ventricular structural impairment and adverse remodelling patterns
Is diabetes is different in African Caribbeans? Does this lead to protection from CHD? Why more stroke? (24 hour BP was not the whole story)
20 year mortality and morbidity follow-up (V2) Southall and Brent Revisited (SABRE)
• Why more diabetes in both ethnic minorities?
• Why more CHD in South Asians?
• Why more stroke in both ethnic minorities?
• Subclinical circulatory disease?
• Risk factor intervention thresholds?
20 year mortality and morbidity follow-up (V2) Southall and Brent Revisited (SABRE)
• 2008-2011, age 60-90
• Mortality/ cancer registration
• Survivors invited to attend follow-up clinic at St Mary’s Hospital /complete health and lifestyle questionnaire/ consent to primary care medical record review
• Clinic measurements included:
– Fasting and OGTT bloods
– Anthropometrics
– CT: coronary calcium and abdominal and mid-thigh fat depots
– MRI: brain- white matter hyperintensities, infarcts, hippocampal and brain volumes
– Retinal photography
– Cognitive function
– 2D and 3D echocardiography
– Vascular assessment- central, brachial and ankle BP, pulse wave velocity, carotid IMT
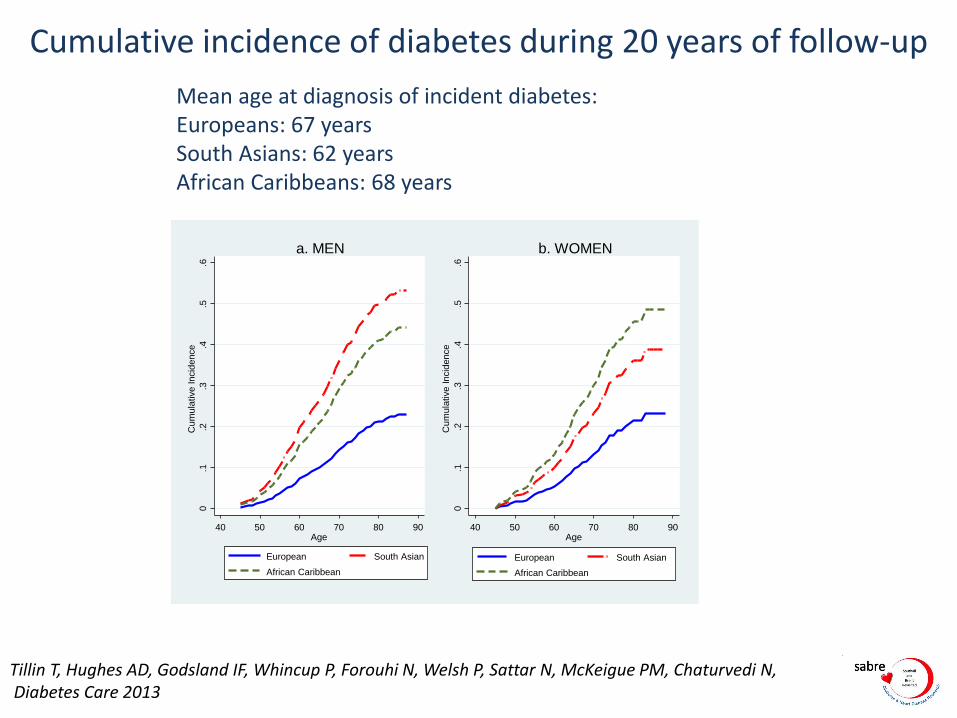
Cumulative incidence of diabetes during 20 years of follow-up
Mean age at diagnosis of incident diabetes: Europeans: 67 years South Asians: 62 years African Caribbeans: 68 years
Tillin T, Hughes AD, Godsland IF, Whincup P, Forouhi N, Welsh P, Sattar N, McKeigue PM, Chaturvedi N, Diabetes Care 2013
0
.1
.2
.3
.4
.5
.6
Cum
ula
tive Incid
ence
40 50 60 70 80 90 Age
European South Asian
African Caribbean
a. MEN
0
.1
.2
.3
.4
.5
.6
Cum
ula
tive Incid
ence
40 50 60 70 80 90 Age
European South Asian
African Caribbean
b. WOMEN
020
60
40
Pre
dic
ted
dia
bete
s incid
en
ce r
ate
/100
0 p
ers
on
ye
ars
20 21 22 23 24 25 26 27 28 29 30 31Body mass index, kg/m2
European South Asian
African Caribbean
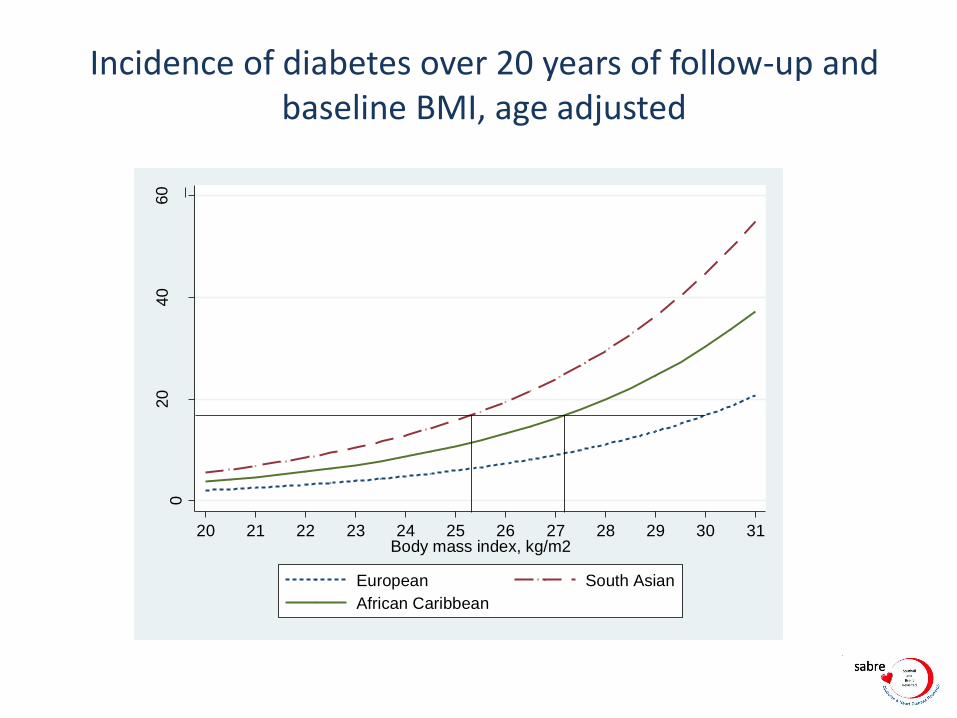
Incidence of diabetes over 20 years of follow-up and baseline BMI, age adjusted

020
60
40
Pre
dic
ted
dia
bete
s incid
en
ce r
ate
/100
0 p
ers
on
ye
ars
20 21 22 23 24 25 26 27 28 29 30 31Body mass index, kg/m2
European South Asian
African Caribbean
Incidence of diabetes over 20 years of follow-up and baseline BMI, age adjusted

CHD and stroke incidence: fatal and non-fatal first events, age and sex adjusted
0.2
.4.6
.8
Cu
mula
tive In
cid
en
ce
40 50 60 70 80 90Age
Europeans South Asians
African Caribbeans
Coronary heart disease incidence
0.1
.2.3
.8
40 50 60 70 80 90Age
Europeans South Asians
African Caribbeans
Stroke incidence

0
5
10
15
20
25
Europeanmen
South Asianmen
AfricanCaribbean
men
Europeanwomen
South Asianwomen
AfricanCaribbean
women
% r
isk
(95
% C
I)
Observed events
QRISK2 predicted
Framingham predicted
Predicting CVD risk over 10 years of follow-up: QRISK2 and Framingham
Tillin T, Hughes AD, Whincup P, Mayet J, Sattar N, McKeigue PM, Chaturvedi N, , Heart Jan 2014

Proportion of observed events which occurred in participants identified as high risk (>20%) by Framingham and QRISK2
% of events predicted by QRISK2>=20%% of events predicted by Framingham >=20%
0
10
20
30
40
50
60
70
Europeanmen
SouthAsian men
AfricanCaribbean
men
Europeanwomen
SouthAsian
women
AfricanCaribbean
women
%
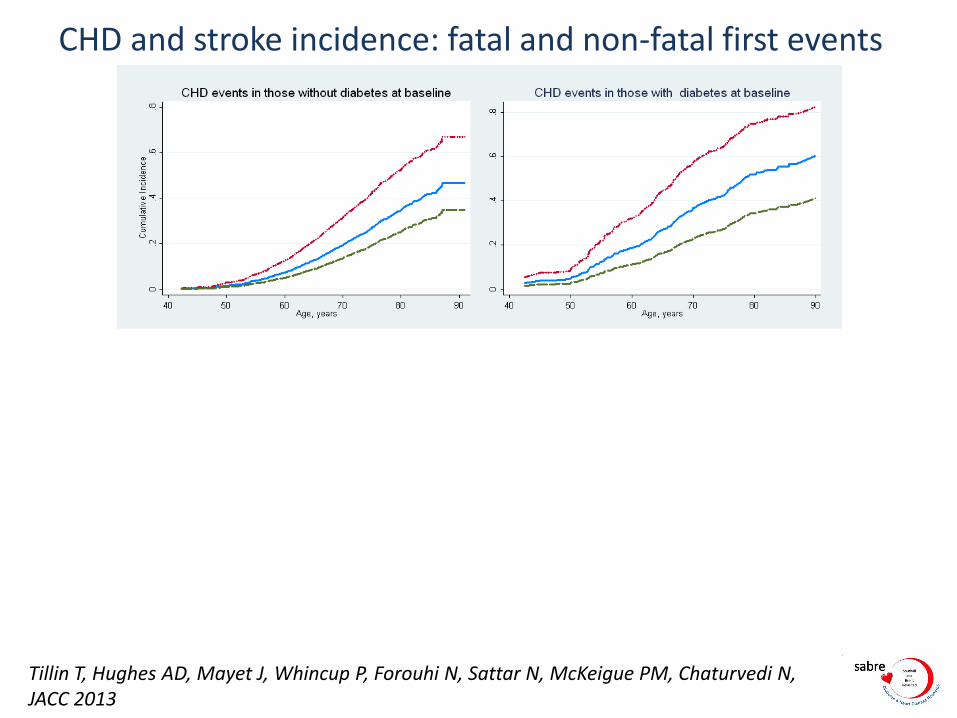
CHD and stroke incidence: fatal and non-fatal first events
Tillin T, Hughes AD, Mayet J, Whincup P, Forouhi N, Sattar N, McKeigue PM, Chaturvedi N, JACC 2013
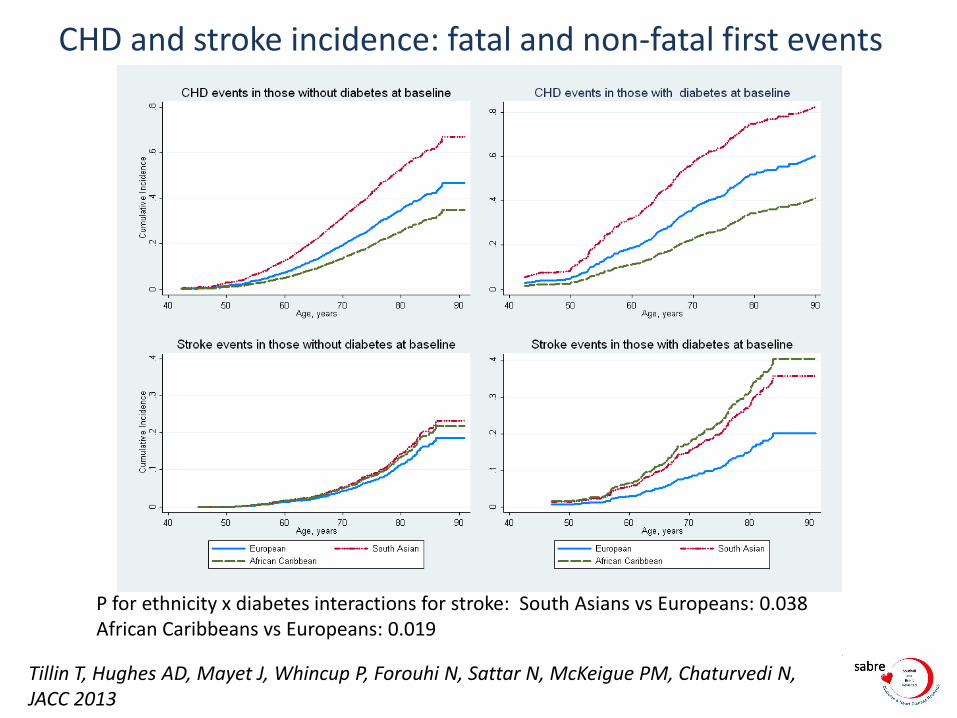
CHD and stroke incidence: fatal and non-fatal first events
Tillin T, Hughes AD, Mayet J, Whincup P, Forouhi N, Sattar N, McKeigue PM, Chaturvedi N, JACC 2013
P for ethnicity x diabetes interactions for stroke: South Asians vs Europeans: 0.038 African Caribbeans vs Europeans: 0.019
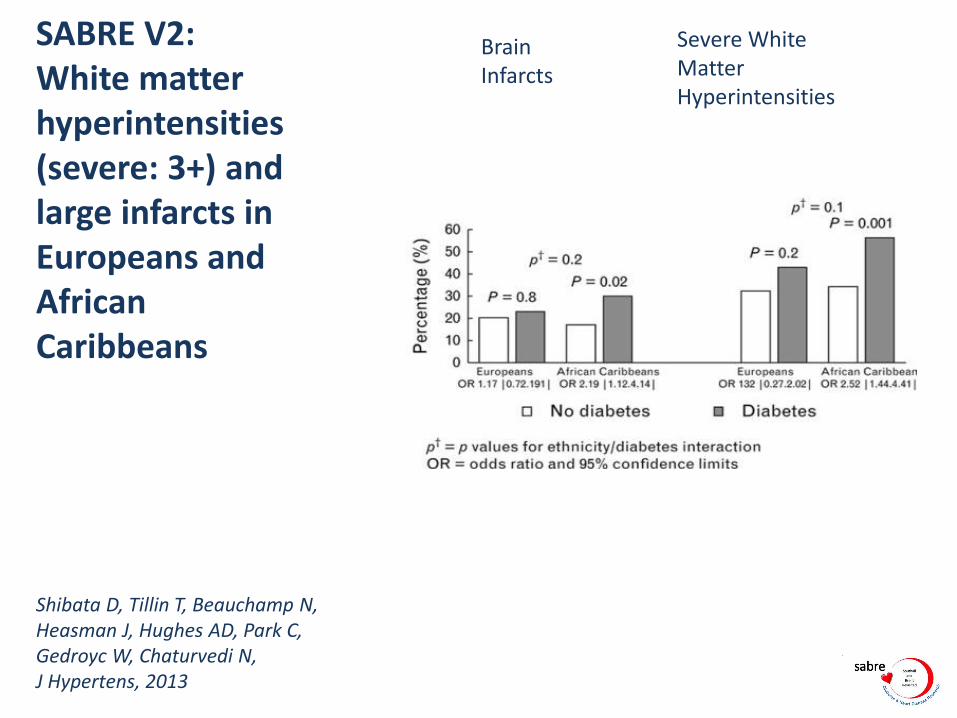
SABRE V2: White matter hyperintensities (severe: 3+) and large infarcts in Europeans and African Caribbeans Shibata D, Tillin T, Beauchamp N, Heasman J, Hughes AD, Park C, Gedroyc W, Chaturvedi N, J Hypertens, 2013
Brain Infarcts
Severe White Matter Hyperintensities
European
South Asian
African Caribbean
Global cognitive function (average z score)
0.31± 0.62
-0.23 ± 0.53**
-0.25 ± 0.58**
Diabetes vs no diabetes Odds ratio for lowest 10% of cognitive function score
1.20(0.66, 2.18)
1.86(1.09, 3.17)
2.80(1.24, 6.32) †
Hippocampal volume (mm)
7.60±0.04
7.06±0.05**
7.29±0.07**
Diabetes vs no diabetes Odds ratio for lowest 10% of hippocampal volume
0.58(0.26, 1.29)
2.47(1.18, 5.18)** §
1.64(0.63, 4.27) ††
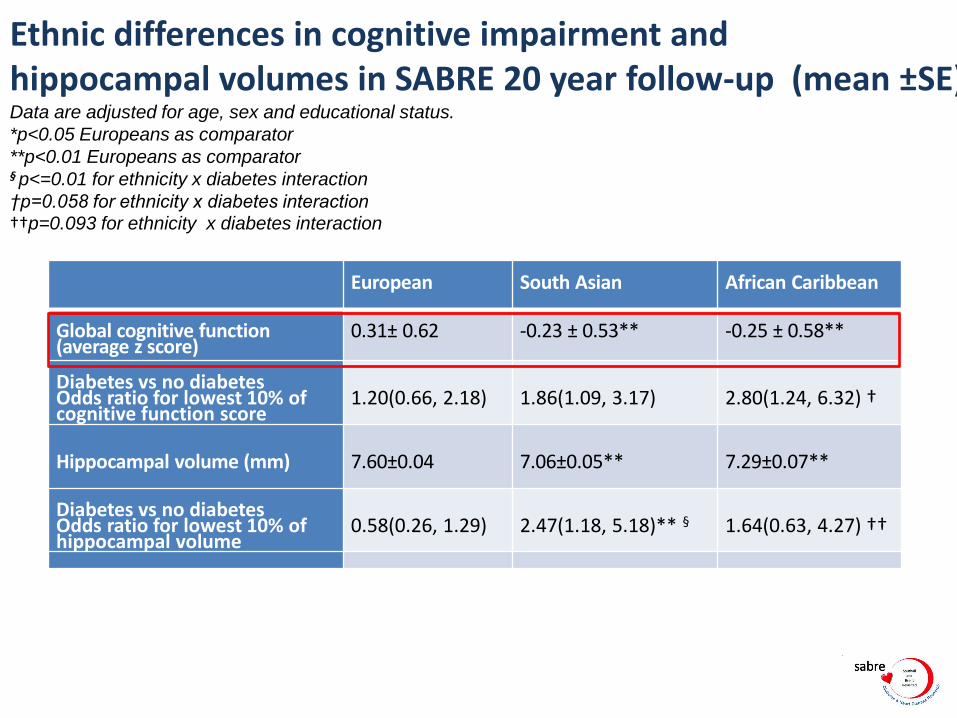
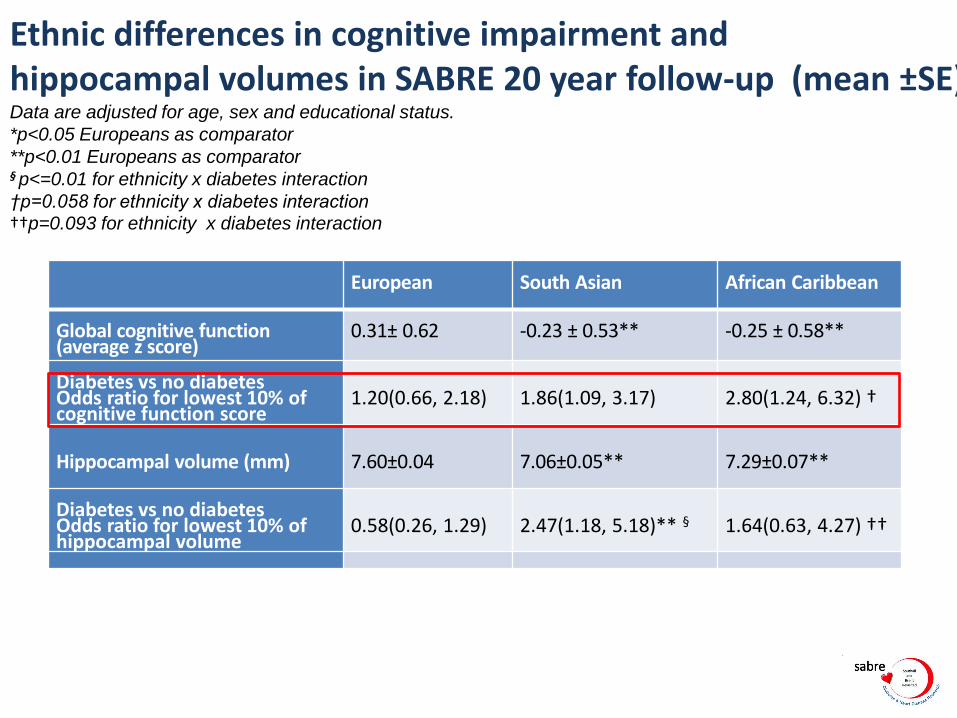
Ethnic differences in cognitive impairment and hippocampal volumes in SABRE 20 year follow-up (mean ±SE) Data are adjusted for age, sex and educational status.
*p<0.05 Europeans as comparator
**p<0.01 Europeans as comparator § p<=0.01 for ethnicity x diabetes interaction
†p=0.058 for ethnicity x diabetes interaction
††p=0.093 for ethnicity x diabetes interaction
European
South Asian
African Caribbean
Global cognitive function (average z score)
0.31± 0.62
-0.23 ± 0.53**
-0.25 ± 0.58**
Diabetes vs no diabetes Odds ratio for lowest 10% of cognitive function score
1.20(0.66, 2.18)
1.86(1.09, 3.17)
2.80(1.24, 6.32) †
Hippocampal volume (mm)
7.60±0.04
7.06±0.05**
7.29±0.07**
Diabetes vs no diabetes Odds ratio for lowest 10% of hippocampal volume
0.58(0.26, 1.29)
2.47(1.18, 5.18)** §
1.64(0.63, 4.27) ††
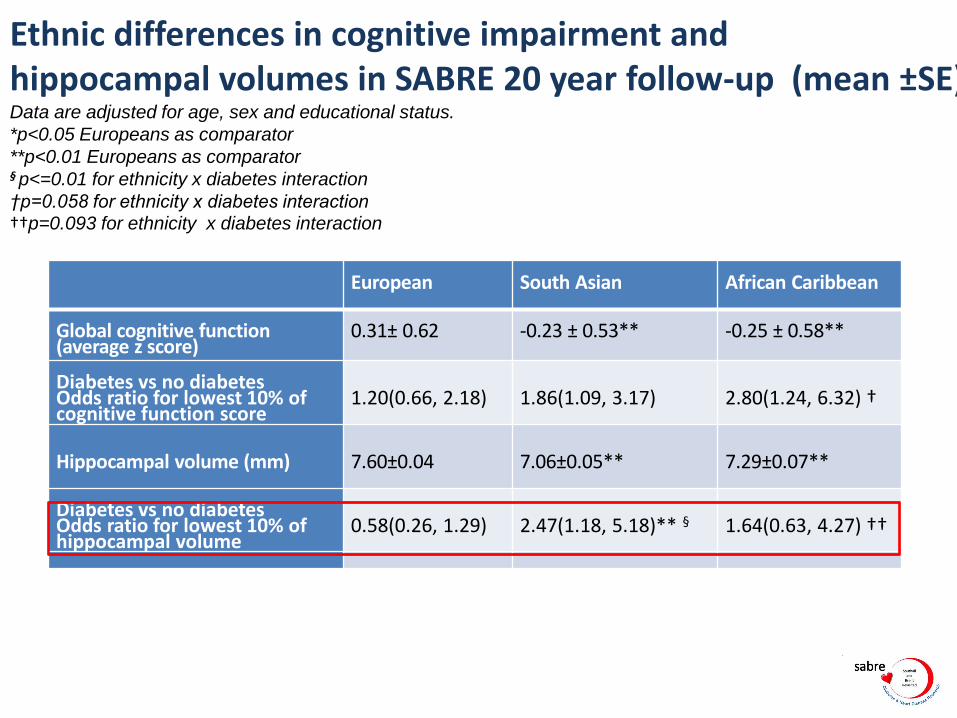
Ethnic differences in cognitive impairment and hippocampal volumes in SABRE 20 year follow-up (mean ±SE) Data are adjusted for age, sex and educational status.
*p<0.05 Europeans as comparator
**p<0.01 Europeans as comparator § p<=0.01 for ethnicity x diabetes interaction
†p=0.058 for ethnicity x diabetes interaction
††p=0.093 for ethnicity x diabetes interaction

European
South Asian
African Caribbean
Global cognitive function (average z score)
0.31± 0.62
-0.23 ± 0.53**
-0.25 ± 0.58**
Diabetes vs no diabetes Odds ratio for lowest 10% of cognitive function score
1.20(0.66, 2.18)
1.86(1.09, 3.17)
2.80(1.24, 6.32) †
Hippocampal volume (mm)
7.60±0.04
7.06±0.05**
7.29±0.07**
Diabetes vs no diabetes Odds ratio for lowest 10% of hippocampal volume
0.58(0.26, 1.29)
2.47(1.18, 5.18)** §
1.64(0.63, 4.27) ††
Ethnic differences in cognitive impairment and hippocampal volumes in SABRE 20 year follow-up (mean ±SE) Data are adjusted for age, sex and educational status.
*p<0.05 Europeans as comparator
**p<0.01 Europeans as comparator § p<=0.01 for ethnicity x diabetes interaction
†p=0.058 for ethnicity x diabetes interaction
††p=0.093 for ethnicity x diabetes interaction

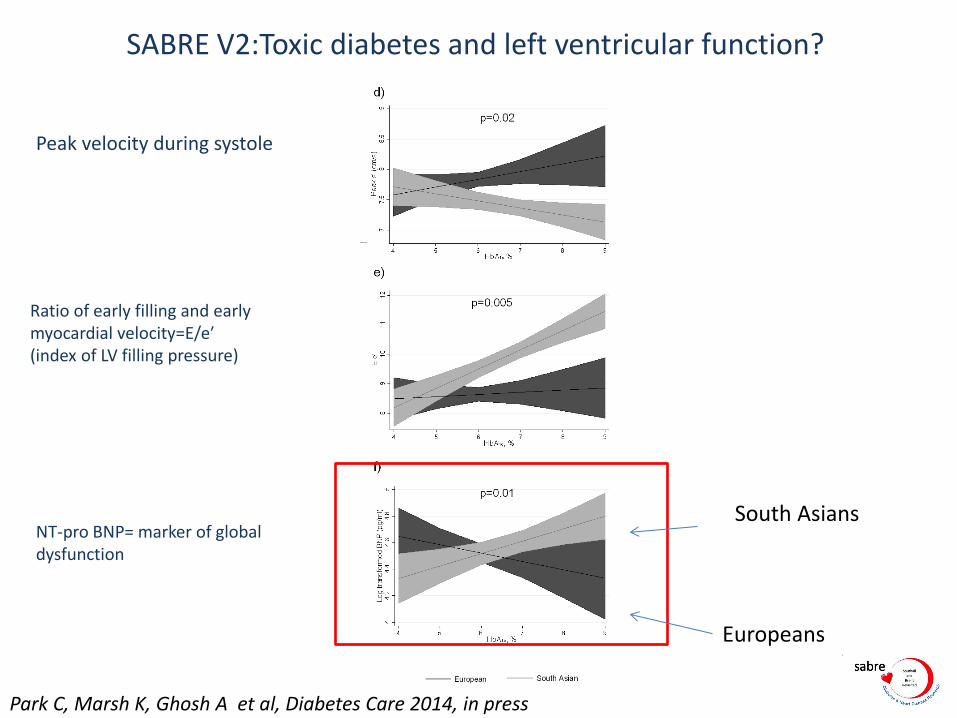
SABRE V2:Toxic diabetes and left ventricular function?
Peak velocity during systole
Ratio of early filling and early myocardial velocity=E/e′ (index of LV filling pressure)
NT-pro BNP= marker of global dysfunction
Park C, Marsh K, Ghosh A et al, Diabetes Care 2014, in press
South Asians
Europeans
SABRE V2:Toxic diabetes and left ventricular function?
Peak velocity during systole
Ratio of early filling and early myocardial velocity=E/e′ (index of LV filling pressure)
NT-pro BNP= marker of global dysfunction
Park C, Marsh K, Ghosh A et al, Diabetes Care 2014, in press
Europeans
South Asians
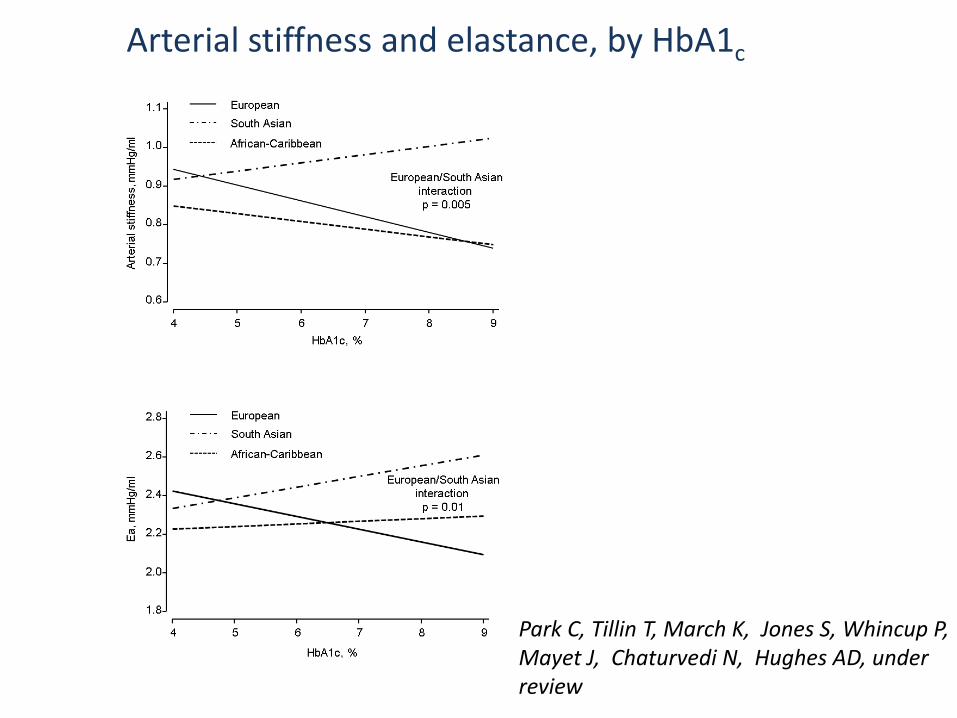
Arterial stiffness and elastance, by HbA1c
Park C, Tillin T, March K, Jones S, Whincup P, Mayet J, Chaturvedi N, Hughes AD, under review
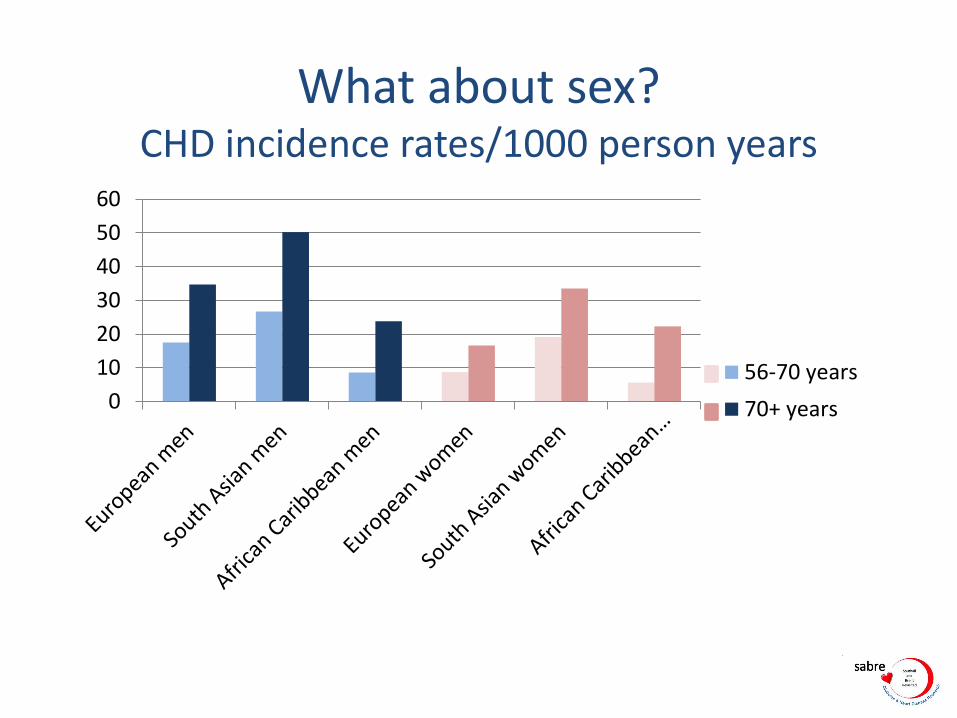
What about sex? CHD incidence rates/1000 person years
0
10
20
30
40
50
60
56-70 years
70+ years
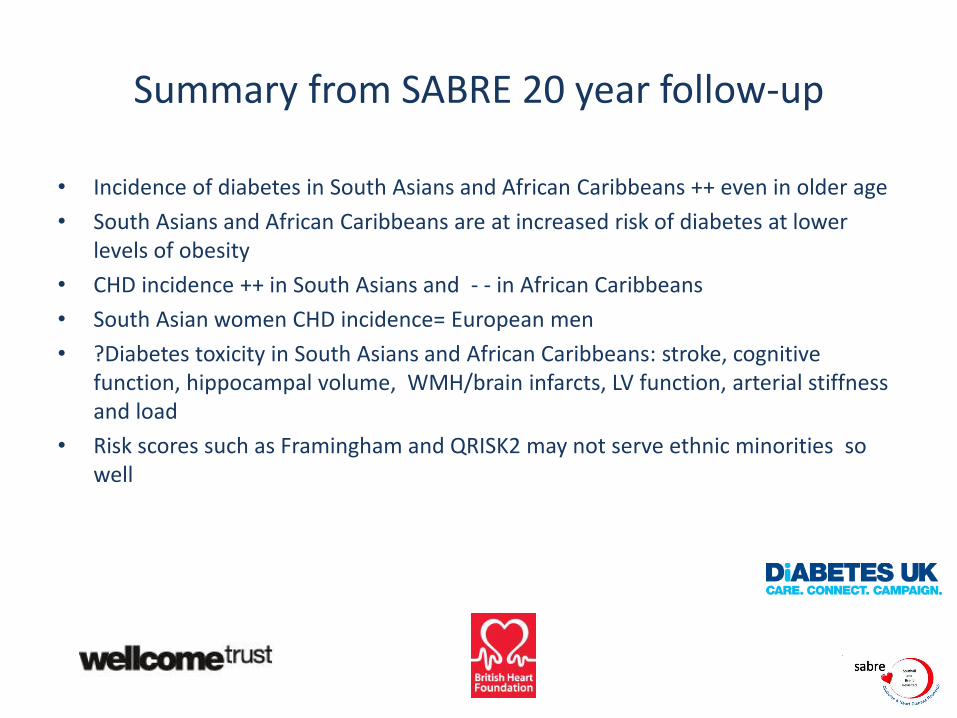
Summary from SABRE 20 year follow-up
• Incidence of diabetes in South Asians and African Caribbeans ++ even in older age
• South Asians and African Caribbeans are at increased risk of diabetes at lower levels of obesity
• CHD incidence ++ in South Asians and - - in African Caribbeans
• South Asian women CHD incidence= European men
• ?Diabetes toxicity in South Asians and African Caribbeans: stroke, cognitive function, hippocampal volume, WMH/brain infarcts, LV function, arterial stiffness and load
• Risk scores such as Framingham and QRISK2 may not serve ethnic minorities so well
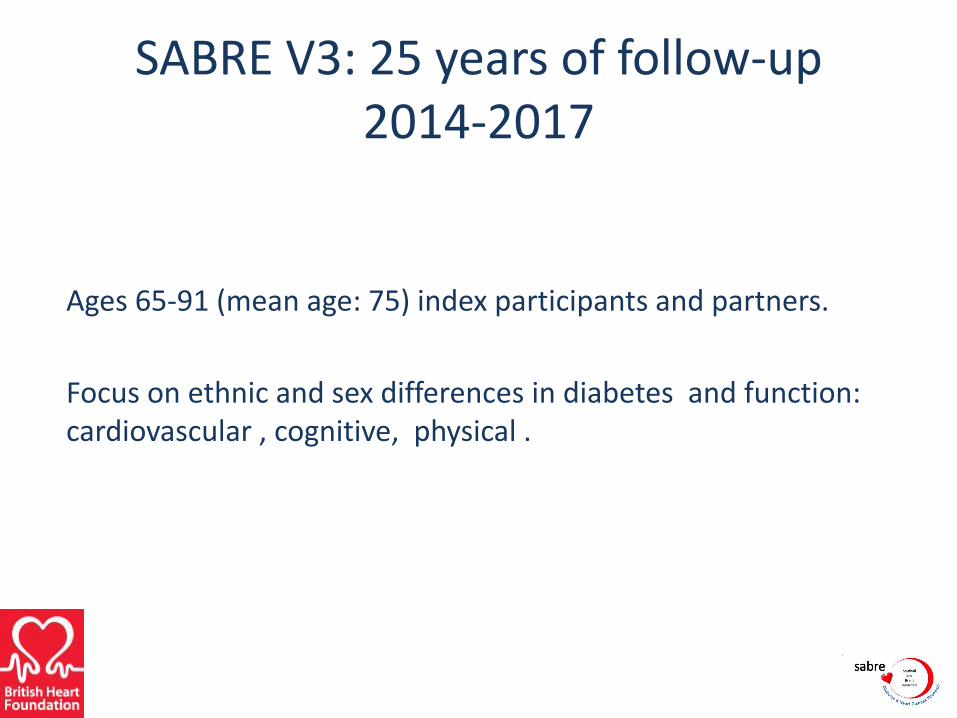
SABRE V3: 25 years of follow-up 2014-2017
Ages 65-91 (mean age: 75) index participants and partners.
Focus on ethnic and sex differences in diabetes and function: cardiovascular , cognitive, physical .
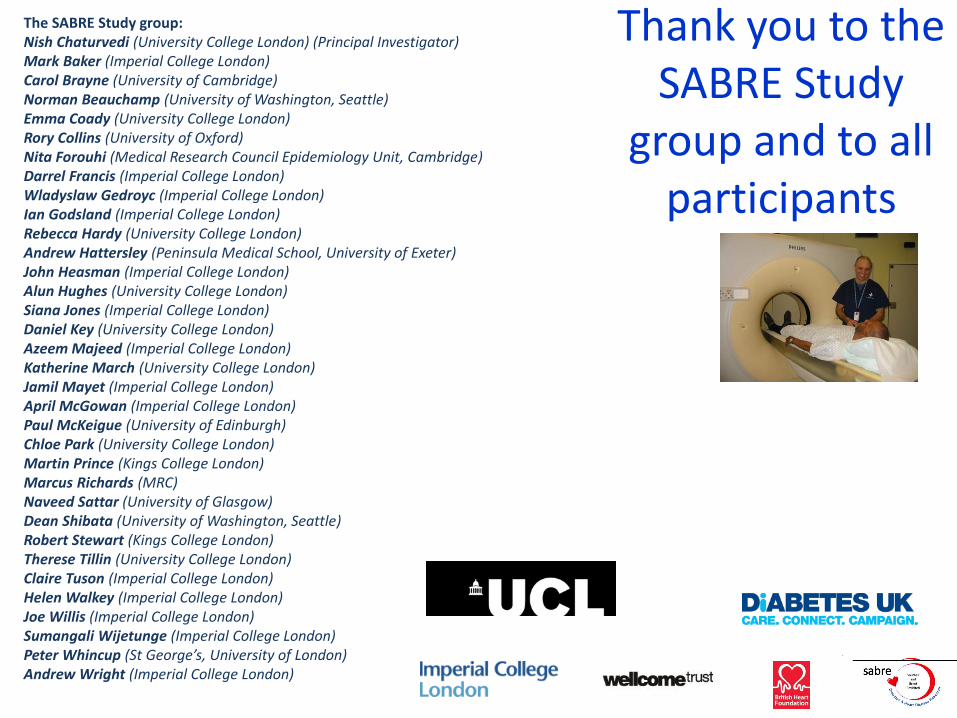
Thank you to the SABRE Study
group and to all participants
The SABRE Study group: Nish Chaturvedi (University College London) (Principal Investigator) Mark Baker (Imperial College London) Carol Brayne (University of Cambridge) Norman Beauchamp (University of Washington, Seattle) Emma Coady (University College London) Rory Collins (University of Oxford) Nita Forouhi (Medical Research Council Epidemiology Unit, Cambridge) Darrel Francis (Imperial College London) Wladyslaw Gedroyc (Imperial College London) Ian Godsland (Imperial College London) Rebecca Hardy (University College London) Andrew Hattersley (Peninsula Medical School, University of Exeter) John Heasman (Imperial College London) Alun Hughes (University College London) Siana Jones (Imperial College London) Daniel Key (University College London) Azeem Majeed (Imperial College London) Katherine March (University College London) Jamil Mayet (Imperial College London) April McGowan (Imperial College London) Paul McKeigue (University of Edinburgh) Chloe Park (University College London) Martin Prince (Kings College London) Marcus Richards (MRC) Naveed Sattar (University of Glasgow) Dean Shibata (University of Washington, Seattle) Robert Stewart (Kings College London) Therese Tillin (University College London) Claire Tuson (Imperial College London) Helen Walkey (Imperial College London) Joe Willis (Imperial College London) Sumangali Wijetunge (Imperial College London) Peter Whincup (St George’s, University of London) Andrew Wright (Imperial College London)


