
Spatial Analysis –
Raster data analysis
Dr. Basheer Obaid

Spatial Analysis –
Raster data analysis


Cost weighted distance

Details
Spatial Analyst extension
Most of the functions in the Spatial
Analyst Tools are also integrated
into the Spatial Analyst extension

Functions (1)
local functions work on single cells
focal functions work on cells within a neighborhood
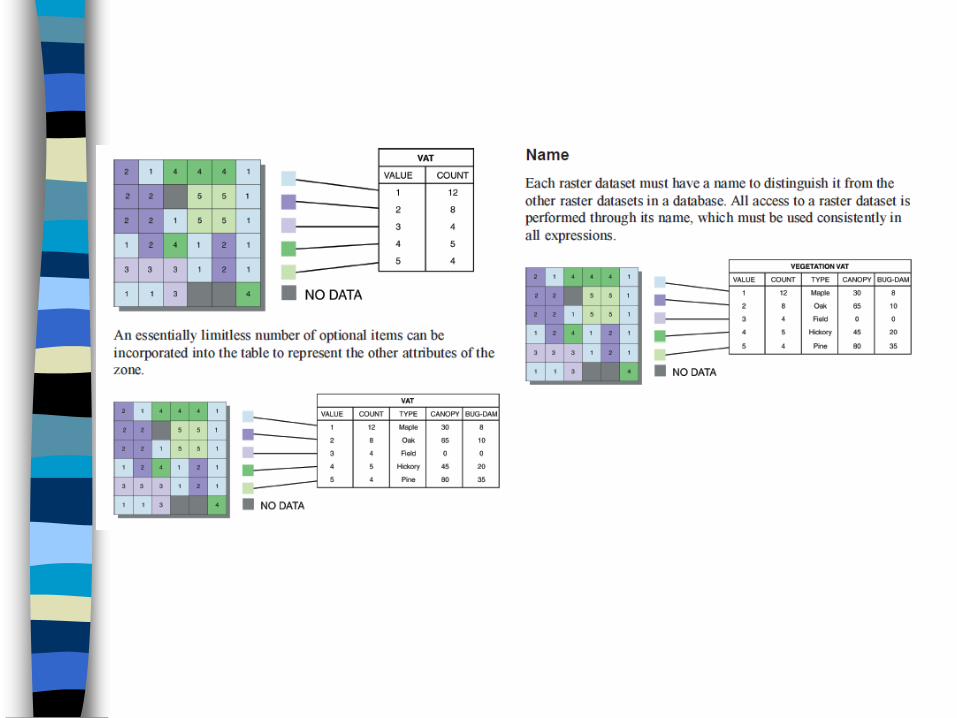
zonal functions work on cells within zones
global functions work on all cells
- Euclidean distance (or straight-line distance)
- Cost Weighted distance
application functions to solve specific applications
density function distributes a measured quantity of an input point layer throughout a landscape to produce a continuous surface.
surface generation functions (or surface interpolators) create a continuous surface from a sampled point values
- Inverse distance weighted (IDW)
- Polynomial trend surface
- Spline
- Kriging
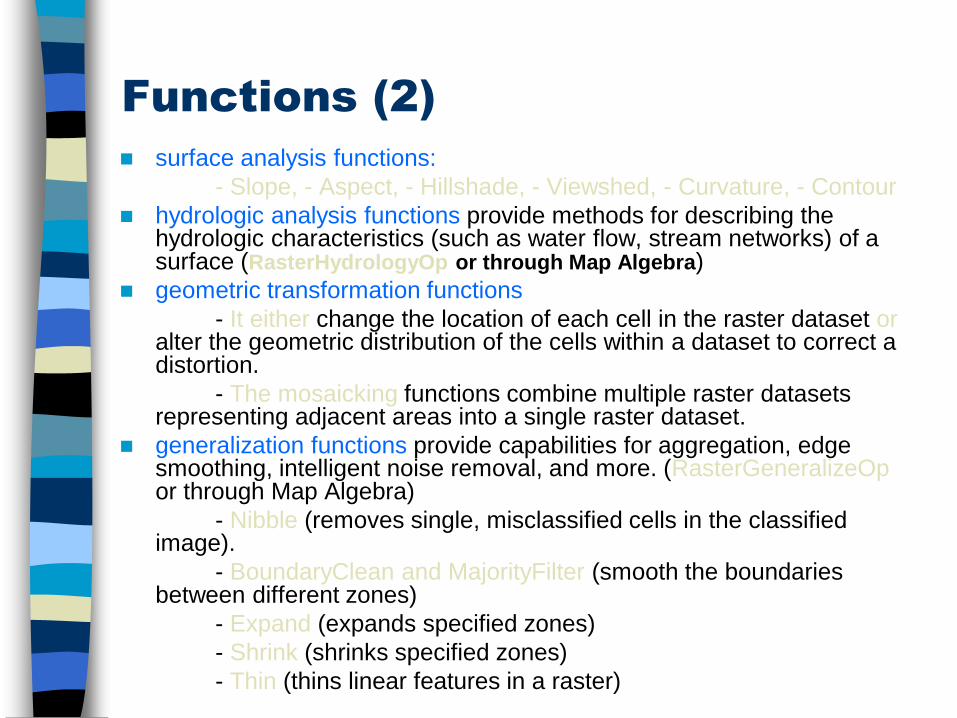
surface analysis functions:
- Slope, - Aspect, - Hillshade, - Viewshed, - Curvature, - Contour
hydrologic analysis functions provide methods for describing the hydrologic characteristics (such as water flow, stream networks) of a surface (RasterHydrologyOp or through Map Algebra)
geometric transformation functions
- It either change the location of each cell in the raster dataset or alter the geometric distribution of the cells within a dataset to correct a distortion.
- The mosaicking functions combine multiple raster datasets representing adjacent areas into a single raster dataset.
generalization functions provide capabilities for aggregation, edge smoothing, intelligent noise removal, and more. (RasterGeneralizeOp or through Map Algebra)
- Nibble (removes single, misclassified cells in the classified image).
- BoundaryClean and MajorityFilter (smooth the boundaries between different zones)
- Expand (expands specified zones)
- Shrink (shrinks specified zones)
- Thin (thins linear features in a raster)
Functions (2)

Types of spatial analysis (1)
Mapping distance
- Straight line (or Euclidean) distance
- Cost Weighted Distance
Mapping density
Interpolating to raster
- Inverse Distance Weighted
- Spline
- Kriging
Performing surface analysis
- Contour
- Slop
- Aspect
- Hillshade
- Viewshed
- cut/fill

Types of spatial analysis (2)
Statistics
- Cell statistics
- Neighborhood statistics
- Zonal statistics
Reclassification
Raster Calculator (map algebra)
Conversion of vector and raster

1. Mapping distance
The Straight Line Distance function measures the straight line distance from each cell to the closest source
The Cost Weighted Distance function modifies the Straight Line Distance by some other factor, which is a cost to travel through any given cell. For example, it may be shorter to climb over the mountain to the destination, but it is faster to walk around it. Cost can be money, time, or preference.
The Distance and Direction raster datasets are normally created from Cost Weighted Distance function to serve as inputs to the pathfinding function, the shortest (or least-cost) path.

The purple line represents a cost distance where each input raster (landuse and slope) had the same influence The red line represents a cost distance where the slope input raster had a weight (or influence) of 66 percent
Cost weighted distance
•Mapping distance

Allocation
function
Allows you to identify which cells belong to which source based on straight line distance function or cost weighted distance function.
1,2 are shopping centers
Straight line distance Cost weighted distance

2. Mapping density
Spread point values over a
surface
The graph gives an example of density surface. when added together, the population values of all the cells equal to the sum of the population of the original point layer

Interpolation to predict values for cells
from a limited number of sample data
points.
– Visiting every location is usually difficult or
expensive.
– Assumption: spatially distributed objects are
spatially correlated. in other words, things
are close together tend to have similar
characteristics (spatial autocorrelation).
3. Interpolating to Raster

Interpolating to Raster
Few sample points – to fill all cells

Point elevation to surface

interpolation techniques
Deterministic and geostatistical.
Deterministic interpolation techniques create
surfaces from measured points. based on
either the extent of similarity (e.g., Inverse
Distance Weighted) or the degree of smoothing
(e.g., radial basis functions).
Geostatistical interpolation techniques (e.g.,
kriging) utilize the statistical properties of the
measured points.

4. Surface analysis: Contours
Contours are polylines that connect points of equal
value, such as elevation, temperature,
precipitation, pollution, or atmospheric pressure.

Slope

Aspect

Hillshade Setting a hypothetical light source and calculating the illumination values for each cell in relation to neighboring cells. It can greatly enhance the visualization of a surface for analysis or graphical display.
Azimuth 315°, altitude 45°

Viewshed
Viewshed identifies the cells in an input raster that can be seen from one or more observation points or lines.
It is useful for finding the visibility. For instance, finding a well-exposed places for communication towers
hillshaded DEM as background

5. Statistics:
Cell statistics (local function)
a statistic for each cell in an output raster is
based on the values of each cell of multiple
input rasters.
– for instance, to analyze the average crop yield
over a 10-year period
Majority, maximum, mean, median,
minimum, minority, range, standard
deviation, sum, variety

If any of the input is NODATA, the output is NODATA


Neighborhood statistics (focal)
A statistic for each cell in an output raster is based on the values of cells within a specified neighborhood: rectangle, circle, annulus, and wedge
Majority, maximum, mean, median, minimum, minority, range, standard deviation, sum, variety
Sum of 3 x 3 cell neighborhood

Moving Windows
Useful for calculating local statistical functions or edge detection
Kernel: a set of constants applied with a function, such as 1/9 being the mean of the center cell.
Other configurations may be used when dealing with diagonal or adjacent cells
© Paul Bolstad, GIS Fundamentals
Zonal statistics
computer statistics for each zone of a
zone dataset based on the information
in a value raster. zone dataset can be
feature or raster, the value raster must
be a raster.


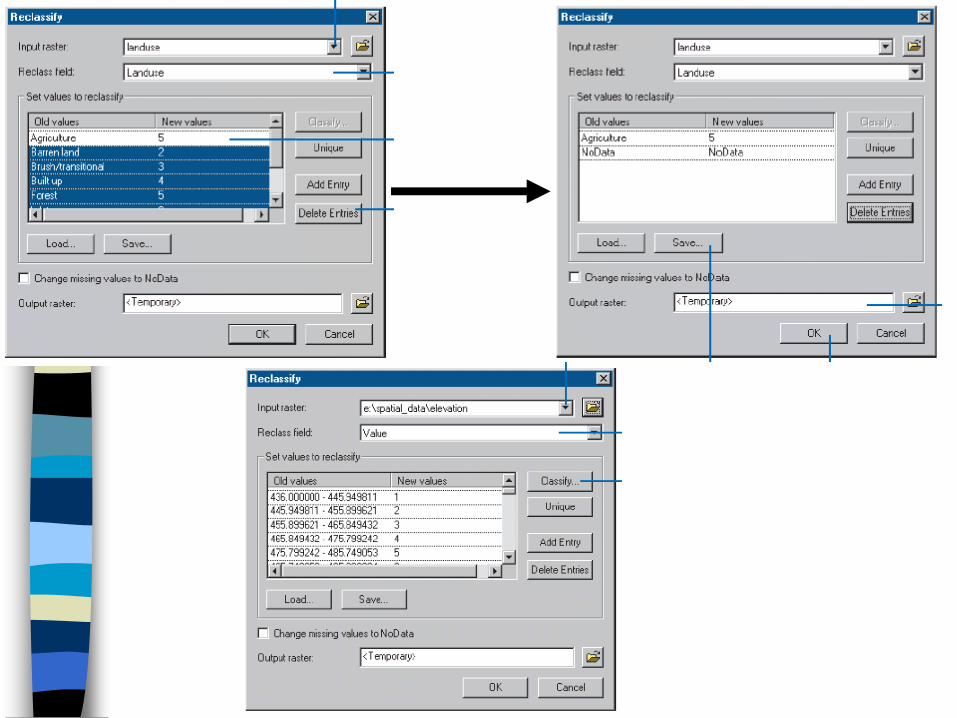
6. Recalssification
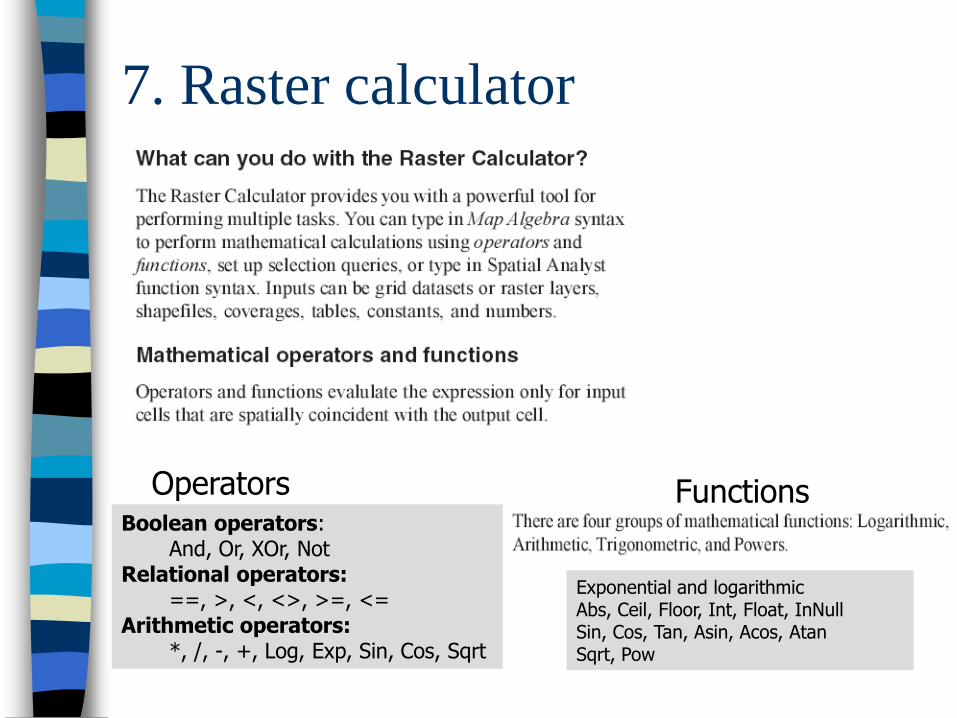
7. Raster calculator
Boolean operators: And, Or, XOr, Not
Relational operators: ==, >, <, <>, >=, <=
Arithmetic operators: *, /, -, +, Log, Exp, Sin, Cos, Sqrt
Operators Functions
Exponential and logarithmic Abs, Ceil, Floor, Int, Float, InNull Sin, Cos, Tan, Asin, Acos, Atan Sqrt, Pow

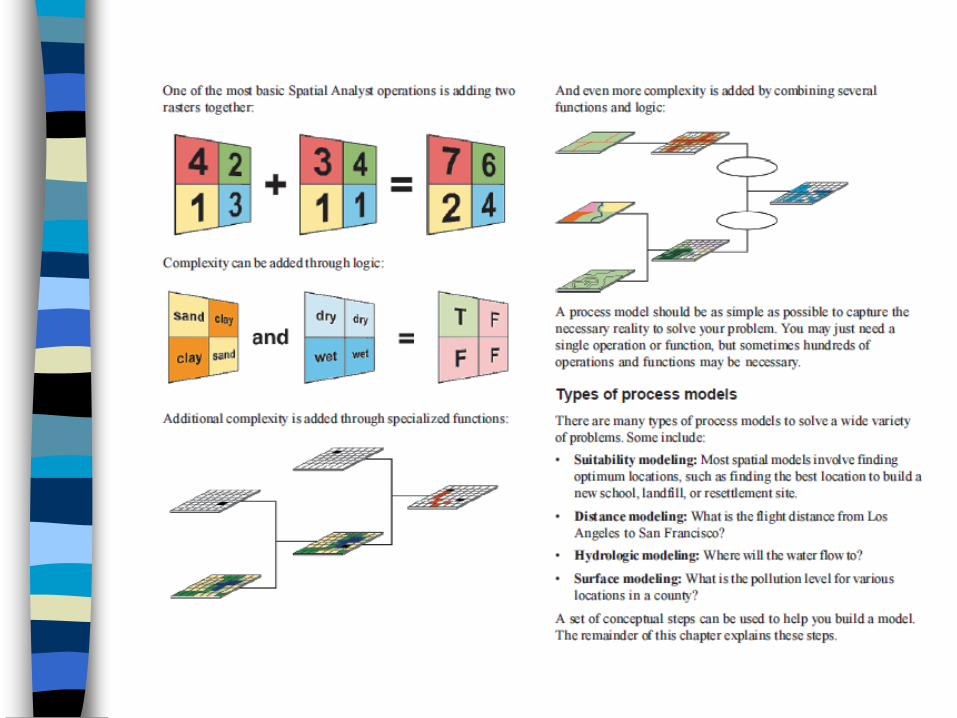
Complex operations
and functions
Sometimes hundreds of operations and functions may be necessary
complex process models

8. Conversion
Feature (polygon, polyline, points) to raster
Raster to feature (polygon, polyline, points)

Main references
ESRI book: Using ArcGIS Spatial
Analyst
ESRI book: Using ArcGIS Geostatistical
Analyst
ESRI book: Using ArcGIS 3D Analyst
ESRI: www.ersi.com


