1
SPATIAL AND TEMPORAL CHANGES IN THE RAINFALL PATTERNS OF
BOTSWANA, 1998-2013
Relotilwe Maboa
A Research Report submitted to the Faculty of Science, University of the Witwatersrand,
Johannesburg, in partial fulfilment of the requirements for the degree of Master of Science.
Johannesburg, October 2016

2
DECLARATION
I declare that this Research Report is my own, unaided work. It is being submitted for the
Degree of Master of Science at the University of the Witwatersrand, Johannesburg. It has not
been submitted before for any degree or examination at any other University.
____________________________________
(Signature of candidate)
__________2016-10-28__________
(Date)
3
ABSTRACT
Rainfall is a complex phenomenon, which has previously been explored by assessing rainfall
patterns in time and space, typically using ground-based weather stations. Rainfall patterns in
southern Africa tend to have a direct impact on vegetation growth and surface water
availability, and an indirect impact on animal movement.
This study investigated rainfall in Botswana by analysing changes in spatial and temporal
patterns from 1998 to 2013, using satellite imagery. Tropical Rainfall Measuring Mission
(TRMM) 3B43 dataset (1998-2013) was used to document monthly rainfall magnitude and
variability over the 15-year period. Additionally, a GIS spatial analysis approach, the Anselin
Local Moran’s I tool, was used to determine changes (i.e. persistence) of rainfall conditions
on a year by year basis during the study period. WorldClim precipitation data (1950-2000)
were utilised as a longer term average reference dataset against which TRMM data could be
compared.
This study found that the rainy season consisted of relatively high rainfall magnitudes and
variability, while the post rainy season consisted of relatively lower rainfall magnitudes and
variability across Botswana. Higher magnitudes persisted into April, indicating the
occurrence of late summer rainfall during this observation period. From a regional
perspective, the Okavango Delta remained a region of relatively higher rainfall magnitude
and variability compared to surrounding regions, regardless of the season. The rainy season
was associated with a high frequency of rainfall events above the long term WorldClim
average, and the post rainy season with a high frequency of rainfall below the long term
WorldClim average. The spatial analysis indicated an annual persistence of high rainfall
clusters in northern Botswana, and a persistence of low rainfall clusters in southern Botswana
throughout the 15-year analysis. In addition, a progressive drying trend towards the end of the
time series was observed.
These findings suggest that Botswana has experienced both wetter conditions and drier
conditions within the 15-year analysis period, than have been historically documented. The
progressive drying trend towards the end of the time series may be indicative of a changing
climate in Botswana. However, due to the length of this analysis period it cannot be proven
conclusively that the detected wetter and drier conditions, than historically documented, are a
signal of climate change.

4
This rainfall analysis provides a comprehensive understanding of recent spatial and temporal
rainfall patterns and changes in Botswana. More specifically, this rainfall study fits into a
bigger research project focused on herbivore conservation in Botswana. Together, these
studies will collectively enable protected areas authorities to better manage herbivore
migration, improving conservation in Botswana over time. Ultimately, this study stands to
make a positive contribution towards the development of existing conservation practices in
Botswana.

5
DEDICATION
This Research Report is dedicated to my parents, for their continuous support and
encouragement. Thank you for teaching me to work hard for the things I aspire to achieve.

6
ACKNOWLEDGEMENTS
First and foremost, I would like to thank God for granting me the capability to complete this
research.
I would like to express my deepest gratitude to my supervisors, Prof. Barend Erasmus and Dr.
Kaera Coetzer, for their untiring guidance, and patience throughout this study.

7
TABLE OF CONTENTS
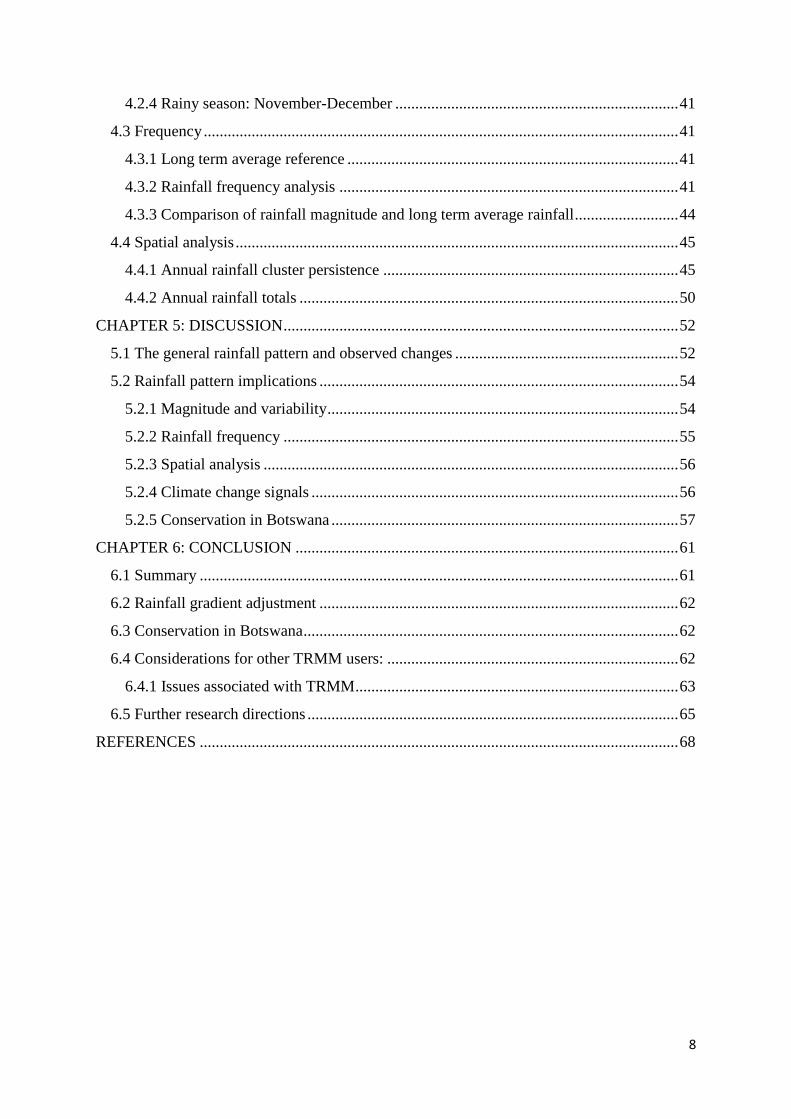
LIST OF FIGURES ................................................................................................................... 9
LIST OF TABLES ................................................................................................................... 11
ABBREVIATIONS ................................................................................................................. 12
CHAPTER 1: INTRODUCTION ............................................................................................ 14
1.1 Rationale......................................................................................................................... 15
1.2 Aim ................................................................................................................................. 17
1.3 Objectives ....................................................................................................................... 17
1.4 Research questions ......................................................................................................... 17
CHAPTER 2: LITERATURE REVIEW ................................................................................. 19
2.1 Climate and vegetation of Botswana .............................................................................. 19
2.2 Herbivore movement ...................................................................................................... 22
2.3 Drivers of rainfall variability.......................................................................................... 24
2.4 Measuring rainfall remotely ........................................................................................... 26
2.5 Spatial analysis ............................................................................................................... 28
CHAPTER 3: MATERIALS AND METHODS ..................................................................... 31
3.1 Data sources ................................................................................................................... 31
3.2 Data analysis .................................................................................................................. 32
3.2.1 Magnitude ................................................................................................................ 32
3.2.2 Variability: ............................................................................................................... 33
3.2.3 Frequency ................................................................................................................ 34
3.2.4 T-Test....................................................................................................................... 34
3.2.5 Spatial analysis ........................................................................................................ 35
CHAPTER 4: RESULTS ........................................................................................................ 37
4.1 Magnitude....................................................................................................................... 37
4.1.1 Rainy season: January-March .................................................................................. 37
4.1.2 Post rainy season: April-August .............................................................................. 37
4.1.3 Pre-rainy season: September-October ..................................................................... 37
4.1.4 Rainy season: November-December ....................................................................... 39
4.2 Rainfall variability.......................................................................................................... 39
4.2.1 Rainy season: January-March .................................................................................. 39
4.2.2 Post rainy season: April-August .............................................................................. 39
4.2.3 Pre-rainy season: October-September ..................................................................... 41
8
4.2.4 Rainy season: November-December ....................................................................... 41
4.3 Frequency ....................................................................................................................... 41
4.3.1 Long term average reference ................................................................................... 41
4.3.2 Rainfall frequency analysis ..................................................................................... 41
4.3.3 Comparison of rainfall magnitude and long term average rainfall .......................... 44
4.4 Spatial analysis ............................................................................................................... 45
4.4.1 Annual rainfall cluster persistence .......................................................................... 45
4.4.2 Annual rainfall totals ............................................................................................... 50
CHAPTER 5: DISCUSSION ................................................................................................... 52
5.1 The general rainfall pattern and observed changes ........................................................ 52
5.2 Rainfall pattern implications .......................................................................................... 54
5.2.1 Magnitude and variability ........................................................................................ 54
5.2.2 Rainfall frequency ................................................................................................... 55
5.2.3 Spatial analysis ........................................................................................................ 56
5.2.4 Climate change signals ............................................................................................ 56
5.2.5 Conservation in Botswana ....................................................................................... 57
CHAPTER 6: CONCLUSION ................................................................................................ 61
6.1 Summary ........................................................................................................................ 61
6.2 Rainfall gradient adjustment .......................................................................................... 62
6.3 Conservation in Botswana .............................................................................................. 62
6.4 Considerations for other TRMM users: ......................................................................... 62
6.4.1 Issues associated with TRMM ................................................................................. 63
6.5 Further research directions ............................................................................................. 65
REFERENCES ........................................................................................................................ 68
9
LIST OF FIGURES
Figure 1: Map of southern Africa illustrating the geographic location of Botswana,
which is the study area for this rainfall analysis.
Figure 2: Map indicating rivers and large surface water bodies in Botswana. The
abundance of rivers and surface water bodies serves as a proxy for displaying
the rainfall gradient, increasing from southwest to northeast.
Figure 3: Map showing the vegetation cover along the rainfall gradient of Botswana,
which increases from a southwest to northeast direction.
Figure 4: Map illustrating the position of national protected areas (parks and reserves)
within the study site.
Figure 5: Maps depicting the spatial comparison of TRMM rainfall measurement points,
and ground-based rainfall points in Botswana.
Figure 6: An annotation of the average monthly magnitude rainfall calculation used for
this study. The January calculation is used as an example.
Figure 7: Diagram illustrating the location of the 5 rainfall points (A-E), along
Botswana’s rainfall gradient, which were chosen for the rainfall frequency
analysis. Point A represents the less arid region and point E the more arid
region of Botswana.
Figure 8: Twelve maps illustrating the average monthly magnitude in Botswana from
January to December for a period of 15 years (1998-2013).
Figure 9: Twelve maps illustrating the rainfall variability in Botswana from January to
December for a period of 15 years (1998-2013).
Figure 10: A line graph showing the rainfall frequency at points A-E in Botswana for a
period of 15 years (1998-2013).
Figure 11: Bar graphs showing the frequency of average monthly magnitude rainfall
above and below the long term average rainfall reference, at spatial location
points A-E in Botswana, for a period of 15 years (1998-2013).
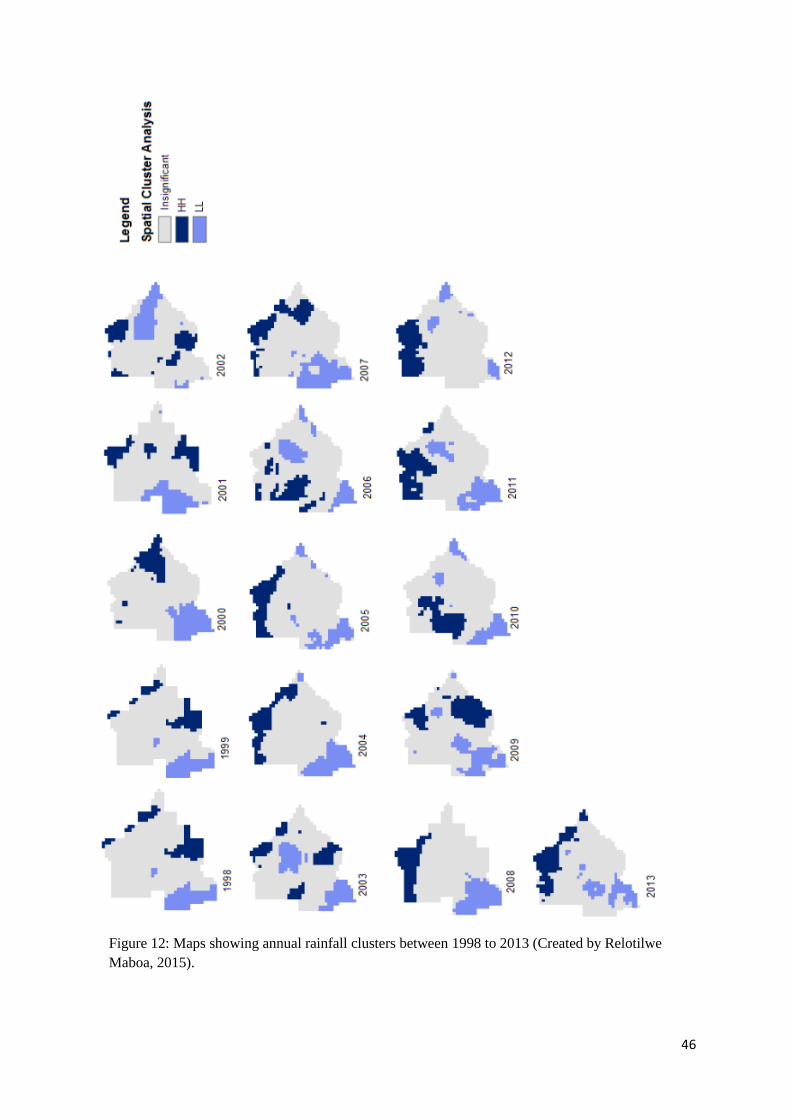
Figure 12: Maps showing annual rainfall clusters between 1998 to 2013.

10
Figure 13: Maps showing annual HH rainfall clusters between 1998 to 2013.
Figure 14: Maps showing annual LL rainfall clusters between 1998 to 2013.
Figure 15: Maps showing the TRMM annual rainfall totals measurements between 1998-
2013.

11
LIST OF TABLES
Table 1: Reclassification codes used to classify TRMM rainfall clusters during the
spatial analysis.
Table 2: T-test results indicating the difference between the TRMM average monthly
magnitude rainfall and long term average rainfall, for rainfall points A- E.
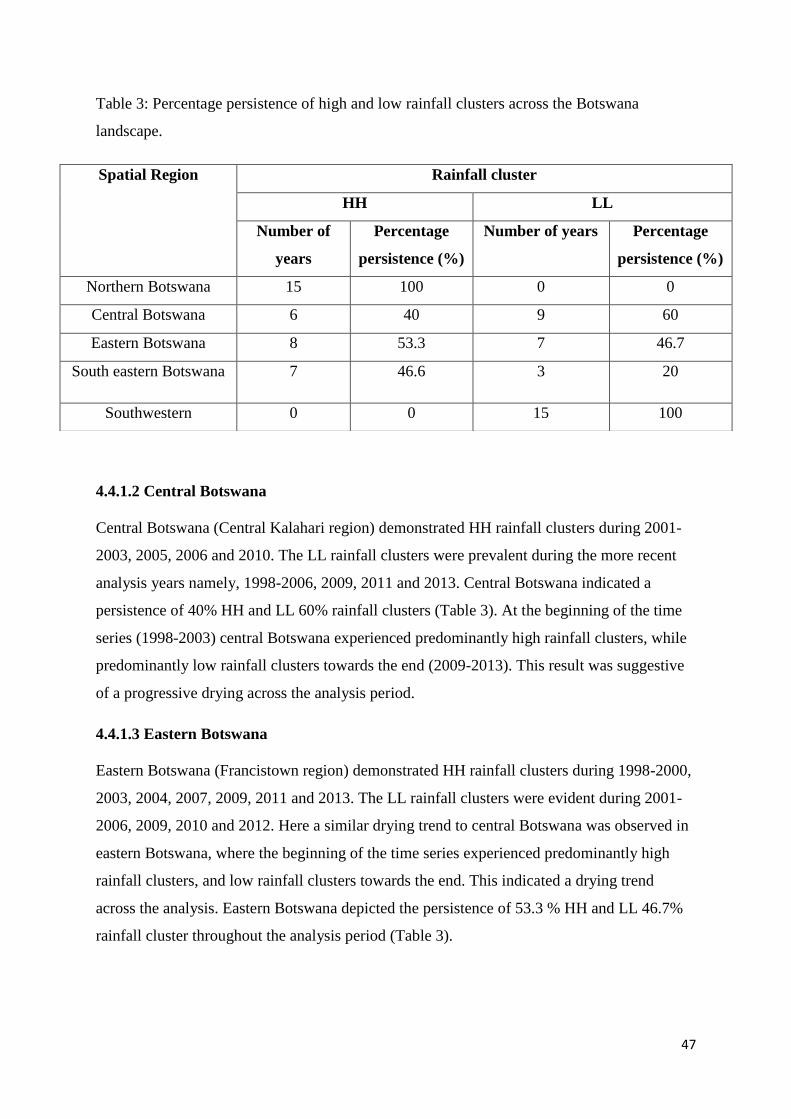
Table 3: Percentage persistence of high and low rainfall clusters across the Botswana
landscape.
12
ABBREVIATIONS
COType Cluster/Outlier type
ENSO El Nino Southern Oscillation
GHCN Global Historical Climatology Network
GIS Geographical Information Systems
GISS Goddard Institute for Space Studies
GPCC Global Precipitation Climatology Centre
GPCP Global Precipitation Climatology Project
HH High-High
HL High-Low
IPCC Intergovernmental Panel on Climate Change
LH Low-High
LISA Local Indicator of Spatial Association
LL Low-Low
NASA National Aeronautical and Space Administration
NDVI Normalized Difference Vegetation Index
NE Northeast
Netcdf Network Common Data Form
NOAA National Oceanic and Atmospheric Administration
PCA Principal Component Analysis
PR Precipitation Radar
RMS Root-Mean-Square
SADC Southern African Development Countries

13
SARVA South African Risk and Vulnerability Atlas
SST Sea-Surface Temperature
SW Southwest
TMI TRMM Microwave Imager
TRMM Tropical Rainfall Measuring Mission
USA United States of America
WMA Wildlife Management Areas
WNV West Nile Virus

14
CHAPTER 1: INTRODUCTION
Variability in rainfall is a significant component of semi-arid regions. Previous research on
rainfall in semi-arid regions has indicated that rainfall can vary from year to year, within a
year, and within a single rainfall event, as well as seasonally (Grist et al. 1997; Veenendaal,
1996; Batisani and Yarnal, 2010). Changes in rainfall influence factors such as the amount,
distribution, timing and frequency of rainfall in time and space. According to the
Intergovernmental Panel on Climate Change (IPCC) climate models have projected a
decrease in average annual precipitation over both northern and southern Africa, during the
mid-late twenty first Century (IPCC, 2014). Similar climate models over southern Africa
have projected an annual rainfall decrease by at least 20% by 2080, accompanied by a
temperature increase of approximately 2-3°C above the global average. These projections
stand to have implications for rain dependent components such as surface water, soil, and
vegetation. Conway et al. (2015) relates these projections to a reduction in regional surface
water availability and soil moisture, and as a result, relatively lower crop yields. The authors
argue that the projections serve as warning systems for global governments to invest in
measures for promoting sustainable water and food security. However, these warning systems
need to be accompanied by a thorough understanding of the distribution of water resources,
water needs, and efficient water use, in time and space (Conway et al. 2015).
With consideration of the above mentioned projections, rainfall studies over southern Africa
(Botswana, Namibia and Zambia) published in the last 20 years over a 30-year period show
evidence of consistently lower rainfall measurements compared to historic rainfall records
(e.g. Adedoyin and Mphale, 2002; Batisani and Yarnal, 2010), suggestive of progressively
drier conditions in time and space in the region. Various authors argue that it is likely for
rainfall variability in Botswana to increase as relatively drier conditions continue to emerge
(Lazaro et al. 2001; Modarres and Rodrigues da Silva, 2007). Recent studies predict the
occurrence of greater local rainfall variability and stronger seasonal rainfall, than previously
anticipated over southern Africa (Conway et al. 2015). These rainfall analyses have been
conducted at a national level, and appear to be sensitive to the time period chosen for
analysis, particularly when there has been large rainfall variability between years. Therefore,
a more detailed analysis conducted at finer scales of observation is required.
Additionally, a more recent assessment of rainfall variability for Botswana would be highly
beneficial for the Botswana government and conservation authorities. Given the known
15
influence of rainfall on vegetation and the indirect influence on animal populations (Bartlam-
Brooks et al. 2011; Birkett et al. 2012), it is of considerable interest to conservation
authorities to comprehend the nature of recent rainfall patterns across the country. During the
last 10 years Botswana has experienced relatively wet conditions (McCarthy et al. 2003;
Molefe et al. 2015). However, there has been a consistent decline in the number of large
grazers in protected areas across Africa, including Botswana, during the same time (e.g.
Ogutu and Owen-Smith, 2003). According to Chase (2011), a trend analysis of wildlife
estimations from aerial surveys in Botswana showed a severe decline in population numbers
during the last 10 years, and an explanation for this serious decline is required.
Rainfall research over southern Africa has determined that rainfall variability influences the
availability of surface water and vegetation cover, and indirectly affects herbivore movement
across the southern African landscape (Dahlberg, 2000; Ogutu and Owen-Smith 2003;
Bartlam-Brooks et al. 2011; Birkett et al. 2012). A more recent rainfall study over Botswana
would be advantageous for the development of sustainable, effective and efficient measures
for on-going water and food security, as well as wildlife conservation in Botswana.
Furthermore, clarification on the complexities and limitations surrounding rainfall in semi-
arid regions makes for valuable research for conservation practices in southern Africa.
Therefore, this report is considered a positive contribution towards on-going conservation
studies in Botswana; by providing a clearer understanding of recent rainfall patterns.
1.1 Rationale
Rainfall is a complex phenomenon, yet a vital component of the earth’s system. Rain has
been previously investigated by analysing rainfall patterns related to timing (i.e. when it
rains), magnitude (i.e. the amount of rainfall), intensity (i.e. the amount of rainfall within a
given time), and frequency (i.e. how often it rains). Traditionally, rainfall studies have been
conducted using rainfall data from ground-based weather stations, which while reliable,
offers spatially incomplete rainfall information. As a consequence of this, detailed research
surrounding rainfall magnitude, frequency, intensity, timing and gaps is limited. Ground-
based weather stations are usually clustered in specific areas with their spatial locations based
on accessibility conditions, and the location of relevant rainfall research needs (http://www.
noaa.gov/features/02_monitoring/weather_stations.html). As such, a lack of rainfall
measurements in areas beyond the immediate localities of ground-based weather stations is
evident. The method of interpolation may be applied to produce complete rainfall datasets,

16
but this approach is associated with a level of uncertainty (Fernandez et al. 2013), and tends
to require further evaluation of the rainfall measurement in order to ascertain the quality of
the data.
In recent years the use of satellite imagery has played a significant role in addressing issues
around access to certain localities and incomplete ground-based data. The use of satellite
imagery has become an increasingly recognised methodology, and a tool for analysing spatial
and temporal rainfall patterns worldwide. Satellite imagery has been extensively used to
detect land cover change, and for assessing the nature and status of vegetation around the
world (Relton, 2015). Since 1997, satellite products like the Tropical Rainfall Measuring
Mission (TRMM) (http://trmm.gsfc.nasa.gov/3b43.html) have been making use of merged
high quality, infrared precipitation data to provide accurate, continuous and comprehensive
measurements of rainfall in the tropics (http://trmm.gsfc.nasa.gov/3b43.html).
The TRMM satellite has been purposely designed to monitor rainfall within the tropics,
which is convective in nature and rains intensively over short durations (Hughes and Collier,
2011). The main objective of the TRMM satellite is to provide complete and continuous
rainfall records over the tropics, at a high spatial resolution (Krummerow et al. 2000; Houze
Jr et al. 2015). Valuable aspects of TRMM include, the satellite’s ability to provide i) rainfall
measurements for locations which were previously regarded as inaccessible; and ii) complete
spatial and temporal rainfall data in areas where standard ground-based rainfall data are
incomplete. The most striking attribute of TRMM, is the satellite’s ability to overcome
historical limitations associated with rainfall measurement over the tropics. TRMM satellite
data are also good for conducting comprehensive rainfall variability studies for specific times
in space, particularly in low latitude (0°-23.5° N/S) convective rainfall regions (Houze Jr et
al. 2015). In addition, the continuous attribute of the satellite data allows for variations in
rainfall patterns to be predicted with reference to time and space.
This research report analyses and describes the spatial and temporal patterns of rainfall in
Botswana from 1998 to 2013. Using satellite imagery, this study seeks to understand the
limitations that go beyond known ground-based rainfall measurements. The Botswana
landscape fulfils many of the requirements for which TRMM was designed, i.e. convective
rainfall. Thus, it is argued that TRMM may provide valuable information for exploring recent
rainfall patterns in Botswana; beyond that which has previously been documented in the
literature. The aim of this study is to fill the knowledge gap concerning complete ground-
17
based rainfall data in Botswana, which results in an incomprehensive understanding of the
spatial extent of rainfall measurements in the country.
Furthermore, this study considers the direct influence of rainfall patterns on rain dependent
factors such as surface water and vegetation, and the indirect influence on animal movement.
This rainfall research feeds into a bigger research project related to herbivore conservation in
Botswana. At present, there are on-going studies assessing the greening of vegetation in
Botswana using NDVI, tracking herbivore movement, as well as the interactions between
these two aspects. An updated evaluation of rainfall patterns in Botswana, specifically one
that captures spatial and temporal changes in recent years, is considered an urgent research
requirement that has yet to be addressed. There appears to be no other recent studies that have
carried out a similar TRMM satellite based study to obtain a comprehensive understanding of
rainfall measurements for the full extent of Botswana, between 1998-2013. Hence, this study
fills the research need for i) extensive and continuous rainfall data monitoring across
Botswana, as well as ii) provision of a more comprehensive understanding of the rainfall
patterns, and their changes in space and time.
1.2 Aim
The aim of this research is to investigate rainfall in Botswana by analysing spatial and
temporal rainfall patterns, and changes in these rainfall patterns, over a 15-year period from
1998 to 2013.
1.3 Objectives
1. To document the spatial and temporal rainfall patterns of Botswana using monthly
TRMM rainfall measurements over the period 1998-2013.
2. To describe changes in spatial and temporal patterns of rainfall in Botswana over
the period 1998-2013.
1.4 Research questions
1. What is the magnitude, variability, frequency and duration of rainfall events in time and
space in Botswana for the period 1998-2013?
2. Have there been any observed changes in magnitude, variability, frequency and duration of
rainfall events in time and space in Botswana during 1998-2013?

18
3. If there have been changes, what are these observed changes in magnitude, variability,
frequency and duration of rainfall events in time and space in Botswana during1998-2013?
4. What are the implications for herbivore movement, and consequently, conservation, in
Botswana?

19
CHAPTER 2: LITERATURE REVIEW
2.1 Climate and vegetation of Botswana
Botswana, the designated study area, is a semi-arid country located in southern Africa
(Nicholson and Fairar, 1994; Veenendaal, 1996; Grist et al. 1997). It is a landlocked country,
bordered by South Africa to the south and southeast, Namibia to the west and northwest,
and Zimbabwe to the northeast (Figure 1). Botswana forms part of the southern African
Development Countries (SADC). The country has a surface area of approximately 600
000km2, and is situated on a flat plateau with an elevation of 1000m.
Figure 1: Map of southern Africa illustrating the geographic location of Botswana, which is the study
area for this rainfall analysis (Created by Relotilwe Maboa, 2014).
20
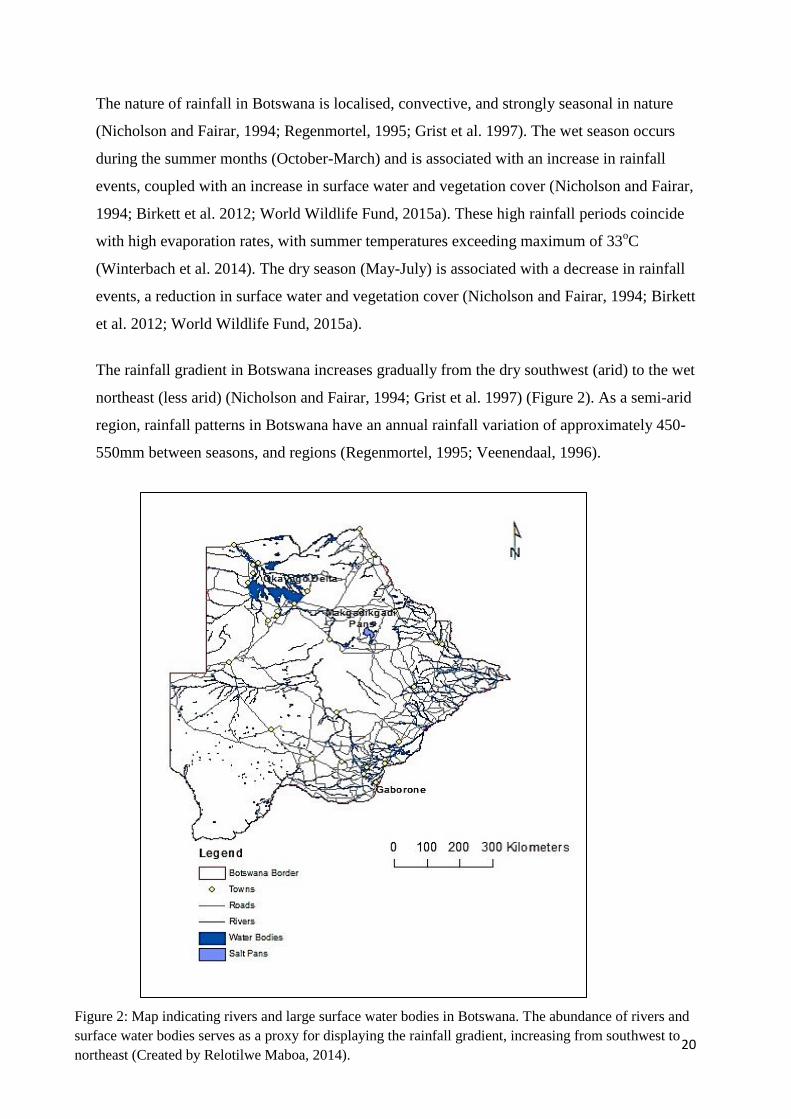
The nature of rainfall in Botswana is localised, convective, and strongly seasonal in nature
(Nicholson and Fairar, 1994; Regenmortel, 1995; Grist et al. 1997). The wet season occurs
during the summer months (October-March) and is associated with an increase in rainfall
events, coupled with an increase in surface water and vegetation cover (Nicholson and Fairar,
1994; Birkett et al. 2012; World Wildlife Fund, 2015a). These high rainfall periods coincide
with high evaporation rates, with summer temperatures exceeding maximum of 33oC
(Winterbach et al. 2014). The dry season (May-July) is associated with a decrease in rainfall
events, a reduction in surface water and vegetation cover (Nicholson and Fairar, 1994; Birkett
et al. 2012; World Wildlife Fund, 2015a).
The rainfall gradient in Botswana increases gradually from the dry southwest (arid) to the wet
northeast (less arid) (Nicholson and Fairar, 1994; Grist et al. 1997) (Figure 2). As a semi-arid
region, rainfall patterns in Botswana have an annual rainfall variation of approximately 450-
550mm between seasons, and regions (Regenmortel, 1995; Veenendaal, 1996).
Figure 2: Map indicating rivers and large surface water bodies in Botswana. The abundance of rivers and
surface water bodies serves as a proxy for displaying the rainfall gradient, increasing from southwest to
northeast (Created by Relotilwe Maboa, 2014).

21
Approximately 70% of the country is covered by the Kalahari Desert and semi-arid plains of
unconsolidated sands (Nicholson and Fairar, 1994). Botswana consists of a predominantly
flat landscape with poorly developed sandy soil, and relatively uniform sandveld vegetation
cover (Regenmortel, 1995; Grist et al. 1997). The vegetation is mainly savanna with grasses,
shrubs and trees in varying proportions (Nicholson and Fairar, 1994; Grist et al. 1997)
(Figure 3). The diversity of groundcover and the abundance of trees increase from southwest
to northeast (Nicholson and Fairar, 1994).
The extremely dry southwest is characterised by sand dunes, separated by grassland with
occasional trees and shrubs. More specifically southwest Botswana consists of Acacia shrub
savanna and Acacia thorn bush savanna. Towards eastern Botswana Croton sp. and
Figure 3: Map showing the vegetation cover along the rainfall gradient of Botswana, which
increases from a southwest to northeast direction (Created by Relotilwe Maboa, 2014).

22
Combretum sp. tree savanna, and dense woodland such as Mopane savanna woodland
(Colophospermum mopane) is apparent. The wet northeast is characterised by high rainfall,
and a canopy forest consisting of Acacia tree savanna (Weare and Yalala, 2009).
It is understood that the seasonal and variable nature of rainfall in Botswana has an influence
on rainfall dependent factors such surface water and vegetation growth, with rainfall events
with a minimum of 10mm known to be conducive for vegetation growth in Botswana
(Knight, 1991).
2.2 Herbivore movement
Comprehension of the impact of the country’s rainfall patterns on herbivore movement is
limited. Previous studies surrounding the causes of herbivore migration in arid landscapes
have related the migration of herbivores in southern Africa to emergence of seasonal
conditions, i.e. change in the availability of surface water and vegetation between rainfall
seasons (Fryxell and Sinclair, 1988; Bergstrom and Skarpe, 1999; Traill, 2004; Fynn et al.
2014). Yet, studies have indicated that during the last 10 years, periods of good rainfall in
Botswana have not resulted in the associated increase in herbivore population as expected
(McCarthy et al. 2003; Ogutu and Owen-Smith, 2003; Molefe et al. 2015). Therefore, further
research on factors related to herbivore conservation is required.
The greater Serengeti grassland ecosystem is well known for impressive animal migrations,
with more than a million blue wildebeest (Connochaetes taurinus), zebra (Equus burchelli)
and Thomson’s gazelle (Eudorcas thomsonii) moving across Eastern Africa (World Wildlife
Fund, 2015b). Various authors argue that the contributing factors towards herbivore
migration in southern Africa are namely seasonal conditions, herbivore physical attributes,
and the development of fencing systems (Fryxell and Sinclair, 1988; Berger, 2004; Traill,
2004; Brooks et al. 2011; Fynn et al. 2014). Some of these studies are discussed below:
Seasonal conditions: Smit (2010) conducted a study on resources driving the migration
patterns of grazers in African savanna, and found that forage quality and surface water are the
main contributors towards herbivore movement within the region. An investigation of
changes in elephant (Loxodonta africana) movement in relation to rainfall patterns over the
Kruger National Park, South Africa, determined that herbivore migration patterns are
influenced by the rainfall patterns (Birkett et al. 2012). Bartlam-Brooks et al. (2011)
completed herbivore migration research in Botswana, which found that zebra first migrate
23
towards the Okavango Delta during the dry season, and thereafter move towards the
Makgadikgadi grasslands during the rainy season.
Physical attributes: Berger (2004) completed research on the sustainability of land distance-
migration in mammals, and found that the physical attributes, (i.e. body size) of terrestrial
mammal influences the distance of the migration. According to this study, the forage quality
threshold for large bodied herbivores is higher than for small bodied herbivore. This means
that large bodied herbivores are more likely to accept a broader range of forage quality,
compared to smaller herbivores during the dry season. This finding is based on the fact that
the metabolic and nutritional requirements for herbivores increase with body size (Smit,
2010).
Fencing: The historic positioning of fencing across the Botswana landscape is another factor
influencing herbivore migration. Veterinary cordon fences in Botswana were erected,
between 1950-1980, as part of the condition (i.e. disease regulation) for the export of
livestock to Europe (Mbaiwa and Mbaiwa, 2006). As a consequence, the migration routes of
migratory wildlife species such as wildebeest, zebras, giraffes (Giraffe camelopardis) and
buffalo (Syncerus caffer) were blocked (Mbaiwa and Mbaiwa, 2006; Bartlam-Brooks et al.
2011). Unfortunately, there was a lack in detailed understanding of impacts of the fences on
the wildlife at the time. These impacts included, i) disturbance to animal migratory patterns,
ii) increased habitat fragmentation, and iii) changes in animal behaviour and population
genetics (Cozzi et al. 2013). Mbaiwa and Mbaiwa (2006) conducted a study on the effects of
veterinary fences on wildlife populations in the Okavango Delta, Botswana. The authors
attributed the observed decline in wildlife numbers over the past decade to the fencing
system, which was associated with the obstruction and restriction of wildlife movements.
Similarly, Rahm et al. (2006) identified that about 99% of the wildebeest population in
Botswana had declined since the establishment of the fencing system in 1954. This decline in
wildlife prompted conservation authorities in Botswana to establish Wildlife Management
Areas (WMA). Thirty-five percent of the land in Botswana is reserved for Wildlife
Management Areas (WMA), for the primary purpose of protecting wildlife heritage and
exercising effective wildlife management (Rahm et al. 2006; Winterbach et al. 2014).
Protected areas in Botswana are located distances apart from each other (Figure 4),
characterised by an open fence system, traversing private farms, ranches and communal lands
(Rahm et al. 2006).

24
With regards to the future development of conservation in Botswana, contributing factors
towards herbivore movement should be investigated further by conservation authorities. This
will provide conservation authorities with a comprehensive understanding of the complexities
and limitations surrounding herbivore migration within the country, as well as how to
improve current conservation practices.
2.3 Drivers of rainfall variability
Climate predictions over southern Africa place emphasis on the occurrence of variable
rainfall patterns, including a decrease in annual rainfall and frequency, as well as an increase
in temperatures (Conway et al. 2015). Richard et al. (2000) related these projections of drier
Figure 4: Map illustrating the position of national protected areas (parks and reserves) within the study
site (Created by Relotilwe Maboa, 2014).

25
climate conditions to the El Nino Southern Oscillation (ENSO) effect. Numerous studies
have investigated the relationship of rainfall variability to climatic phenomena like ENSO
and the Inter Tropical Convergence Zone (ITCZ) (Nicholson and Kim, 1997; Richard et al.
2000; Nicholson et al. 2001; Reason et al. 2006; Collier and Hughes, 2011).
El Nino Southern Oscillation: ENSO is a climatic phenomenon which involves changes in
sea-surface temperature (SST) and the direction of the winds across the oceans (Camberlin et
al. 2001; Kane, 2009). ENSO events are prone to occur approximately every three to seven
years and have been related to distinct differences in temperature and rainfall measurements
worldwide. Thus, ENSO is considered a substantial driver for change in climate, particularly
a change from usual rainfall patterns. Nicholson et al. (2001) carried out a study on the
relationship of ENSO and drought in Botswana, and deduced that ENSO events have an
effect on the magnitude, timing and duration of rainfall. A substantial amount of literature
surrounding rainfall variability in relation to ENSO is available, some of which have been
described below.
Over the last decade various studies in southern Africa have determined that ENSO has a
modulating effect on rainfall, which is coupled by the occurrence of drought conditions
during an ENSO event (Nicholson and Kim, 1997; Richard et al. 2000; Conway, 2008; Kane,
2009; Yeh et al. 2009; Mpheshea, 2014). Richard et al. (2000) support this notion, and
attributes the series of drought occurrences in southern Africa prior to the year 2000
(Camberlin et al. 2001) to the ENSO effect. More recently, 2015 was recorded as the hottest
year globally (Hansen et al. 2016; Otto, 2016). The Goddard Institute for Space Studies
(GISS) conducted a global temperature analysis (GISTEMP), which found 2015 to be the
warmest year to date and exceeded the previous record by more than 0.1oC (Hansen et al.
2016). The analysis correlated the warmer temperatures in 2015 with the strong presence of
El Nino, and indicated that these warm weather conditions were likely to continue in 2016,
even as the impact of El Nino starts to weaken (Hansen et al. 2016). According to Otto
(2016), January 2016 recorded the hottest temperatures on record and based on the observed
global temperatures, 2016 may be the hottest year on record (Hansen et al. 2016).
Furthermore, an observation of long term global warming trends related to ENSO
occurrences, shows that over the past three decades ENSO has had a similar suppressing
effect on rainfall (Reason and Rouault, 2002).
26
Inter Tropical Convergence Zone: The ITCZ is another phenomenon known to influence
rainfall patterns over southern Africa (Reason et al. 2006). The ITCZ is an atmospheric
convergence zone along the equator, where north easterly and south easterly trade winds from
the northern and southern hemisphere converge (Reason et al. 2006; Collier and Hughes,
2011). The location of the ITCZ varies throughout the year as the sun traverses the tropics,
resulting in wet and dry seasons (Tyson and Crimp, 1998; Reason et al. 2004; Zhou et al.
2005; Chikoore and Jury, 2010; Collier and Hughes, 2011). Authors argue that seasonal
rainfall patterns experienced over southern Africa are largely influenced by the ITCZ (Tyson
and Crimp, 1998; Collier and Hughes, 2011). Over the African continent the ITCZ moves
from the equator, and towards either the Tropic of Cancer (northwards) or Tropic of
Capricorn (southwards) in response to the sun’s annual cycle of declination (Reason et al.
2004; Collier and Hughes, 2011). Convergence at the ITCZ is associated with deep
convection which produces intense thunderstorm activity over the tropics (Chikoore and Jury,
2010; Collier and Hughes, 2011).
2.4 Measuring rainfall remotely
The measurement of rainfall is an important aspect for understanding rainfall patterns in time
and space. For decades meteorologists have studied rainfall patterns over the land using
ground-based rainfall data, yet rain gauge data are prone to produce spatially unreliable
measurements (Kummerow, 2000; Javanmard et al. 2010). This issue of spatial unreliability
leads to i) incomplete ground-based data, and ii) an inconsistent representation of rainfall
measurements spatially.
The most recent approach for rainfall research is the use of satellite observations, which
allow for accurate rainfall measurements in areas where ground-based weather stations
cannot detect. The quality of the satellite rainfall measurements is validated and corroborated
using corresponding ground-based rainfall measurements (Adeyewa et al. 2003; Nicholson et
al. 2003; Javanmard et al. 2010). This is an effective method for reducing the occurrence of
meteorological errors, and increases the level of confidence associated with rainfall satellite
products such as the Tropical Rainfall Measuring Mission (TRMM).
Literature shows that TRMM satellite data are considered sufficiently accurate for global use,
due to the extensive validation and corroboration effort associated with the data. TRMM has
carried out a long term (1998-2010) study comparing global TRMM 3B43 data to Global
Rain gauge data (compiled by Global Precipitation Climatology Centre (GPCC) (Huffman
27
and Bolvin, 2014). The study found that TRMM 3B43 and rain gauge data were consistently
similar, with high levels of comparison over both land and ocean. The difference between the
averages for each dataset is as follows: over the land TRMM 3B43 = 3.19mm/day; rain gauge
= 3.16mm/day and over the ocean TRMM 3B43 = 3.00mm/day; rain gauge = 2.79mm/day.
Franchito et al. (2009) validated TRMM precipitation radar monthly rainfall estimates with
rain gauge data over 5 geographic regions in Brazil, from December 1997 to November 2000.
The results show that TRMM correlated with the rain gauge data over most of Brazil, with
significant correlation coefficients at a 99% confidence level. Zhong (2015) conducted a
study evaluating the precipitation climatology (1998-2013) derived from TRMM 3B43 over
land with two rain gauge products (GPCC, and Wilmott and Matsuura (WM)). The results
indicated a strong agreement throughout the study period, although accuracy is shown to
decline in relatively lower rainfall conditions (i.e. rainfall rate regions = <0.5mm/day) such as
the Sahara Desert, Arabian Peninsula and the Andes (Zhong, 2015). However, Nicholson et
al. (2003) conducted rainfall estimates with a high density gauge dataset (Global Precipitation
Climatology Project) for West Africa. The study found that TRMM demonstrated a strong
agreement with the gauge dataset, with a difference of less than 0.5mm/day during May-
September (i.e. the relatively dry season).
The TRMM satellite was developed to produce remote rainfall measurements, and is
considered an important part of the National Aeronautical and Space Administration (NASA)
(http://trmm.gsfc. nasa.gov /3b43.html). TRMM has provided continuous, high quality
rainfall measurements over tropical regions, for more than a decade. The satellite’s data has
been successfully used worldwide, which includes research in Iran, Africa, India and
Bangladesh (Adeyewa et al. 2003; Nicholson et al, 2003; Islam and Uyeda, 2005; Nair et al.
2009; Javanmard et al. 2010).
TRMM is a joint venture between NASA in the United States of America (USA) and
Japanese Space Agency JAXA, with the aim of measuring tropical rainfall. The TRMM
observatory was launched in 1997 into a near circular orbit of approximately 350km altitude,
an inclination of 35 degrees and a period of 92.5 minutes (Sherperd et al. 2000; Tian et al.
2007; Immerzeel et al. 2009; Nair et al, 2009). This circular orbit allows TRMM to record
rainfall at different locations and at different local times each day, which is very useful for
detailed temporal rainfall studies. TRMM rainfall estimates (measurements) are on a 3-hour
temporal resolution and a fine spatial resolution of 0.25 by 0.25 degrees, in a global belt
extending from 50 degrees south to 50 degrees north (Immerzeel et al. 2009;
28
http://trmm.gsfc.nasa.gov/3b43.html). TRMM’s altitude of 350 km is considered low
compared to other satellites. This is attributed to the fact that satellites at lower altitudes
obtain higher resolutions, thus producing high resolution images (Ceccanti and Marcuccio,
2000).
At the present time, TRMM is considered as one of the satellites producing some of the best
available remotely sensed rainfall measurements in global tropical regions (50o N-50
o S, 0-
360o E) (Nair et al. 2009; http://rain.atmos.colostate.edu/CRDC/ datasets/TRMM_3B43.
html). TRMM has a number of rainfall measurement products, produced from passive
microwave and precipitation radar sensors, namely TRMM Microwave Image (TMI) and
Precipitation Radar (PR) (Kummerow and Barnes, 1997; Kummerow et al. 2000; Tian et al.
2007; Immerzeel et al. 2009; http://rain.atmos.colostate.edu/CRDC/datasets/TRMM
_3B43.html). TMI is a microwave sensor for measuring water vapour, cloud water and
rainfall intensity by detecting the energy released by the earth and its atmosphere. PR is used
to locate and calculate the motion of rainfall (http://trmm.gsfc.nasa.gov/3b43. html;
Kummerow, 2000; Sherperd. 2001). This study uses the TRMM 3B43 monthly product,
which is designed to produce reliable precipitation measurements at a monthly temporal
resolution, and a fine spatial resolution of 0.25 by 0.25 degrees. TRMM 3B43 is a
combination product of 3B42 dataset (3-hourly temporal resolution dataset) and monthly
global rain gauge measurements (http://trmm.gsfc.nasa.gov/3b43.html; http://rain.atmos.
colostate.edu/ CRDC/datasets/ TRMM_3B43.html).
2.5 Spatial analysis
There are various approaches for identifying rainfall patterns spatially. In general, a cluster
analysis helps group objects (cases) or datasets into classes (clusters) on the basis of
similarities, and or dissimilarities within different classes (Mostashari et al. 2003; Singh et al.
2004). Clusters can be defined as relative points in space with similar variables or
characteristics (Gong and Richman, 1995; Lyra et al. 2014). For this reason, the cluster
analysis approach has been used in a number of studies (rainfall and risk assessment) as an
effective method of consolidating large amounts of data (Pan et al. 2009). There are a number
of different statistical techniques commonly used for performing cluster analysis namely
Principal Component Analysis (PCA), Euclidean Distance, and Ward’s Method (Gadgil and
Iyengar, 1980; Drosdowsky, 1993; Mu˜noz-D´ıaz and Rodrigo, 2004; Singh et al. 2004; Pan
et al. 2009).

29
Principal Component Analysis (PCA): PCA is a multivariate statistical technique for carrying
out data cluster analyses, by statistically converting a set of observations or variables with
similar characteristics into principal components (clusters) (Drosdowsky, 1993; Mu˜noz-
D´ıaz and Rodrigo, 2004; Singh et al. 2004). This method has been used for grouping and
correlating a vast number of variables and is a preferred approach within rainfall research
(Gadgil and Iyengar, 1980; Ronen and Avinoam, 1999; Mu˜noz-D´ıaz and Rodrigo, 2004).
For example, Ronen and Avinoam (1999) made use of PCA to determine the distribution of
plant species in relation to variable rainfall in Israel, and found that the cluster of plants
species distribution corresponds to the rainfall gradient.
Euclidean Distance: The Euclidean Distance is a cluster technique which indicates data
clusters, based on real or derived measures of distances between variables. This technique
analyses the square root differences between variables and is commonly used in computer
science for data mining, which makes use of hierarchical clustering approach to find patterns
in large datasets (Kardi, 2015).
Ward’s Method: Ward’s Method is another clustering method associated with hierarchical
data clustering. This approach involves the calculation of the distance between clusters, as the
sum of squares between two clusters, and then summed up over all variables (Gadgil and
Iyengar, 1980; Pan et al. 2009). Ward’s method is used when the objective of the analysis is
to build a hierarchy of small clusters.
A cluster analysis is not only useful for grouping variables, but it also useful for interpreting
data and identifying patterns in space. For this reason, the spatial cluster analysis is a widely
used technique for investigating clusters spatially. Where variables have a spatial dimension
with geographic properties; a computational spatial analyses tool within Geographical
Information Systems (GIS) can be used. Motashari et al. (2003) made use of a geographic
cluster analysis, which involved the use of spatial scan statistics to i) represent the
geographical clusters, and ii) to spatially predict dead bird clusters. These bird clusters
indicated regions where people may be at risk of contracting the West Nile Virus (WNV) in
New York (Motashari et al. 2003). The Anselin Local Moran’s I tool is another GIS
approach, which provides i) a ‘by region’ assessment of spatial data, and ii) a comparison of
the regions to surrounding regions (neighbourhood pattern).
A number of studies have used the Anselin Local Moran’s I tool as a method to detect spatial
clusters in rainfall, temperature and pollution, as well as for identifying spatial outliers, i.e.

30
areas surrounded by regions that have opposite or contrasting patterns of rainfall occurrence
(Anselin, 1995; Sugumaran et al. 2009; Fischer and Getis, 2010). Brody et al. (2008) used
Anselin Local Moran’s I to determine clusters of high and low climate risk, in order to inform
local climate change policy in the United States of opportunities to adopt mitigation strategies
against adverse risks of climate change. Zhang et al. (2008), also made use of Anselin Local
Moran’s I to detect pollution hotspots of lead (Pb) concentrations in urban soils of Galway,
Ireland in order to improve environmental management. Although, the literature cited in this
section does not consist of specific rainfall examples using the Anselin Local Moran’s I tool,
it has been used it to illustrate how a similar approach can be applied to TRMM rainfall data.
This particular spatial cluster approach may be used to identify local scale patterns and
variation in recorded rainfall measurements.

31
CHAPTER 3: MATERIALS AND METHODS
This is a desktop study using satellite derived rainfall measurements extending across the full
extent of Botswana. A spatial and temporal analysis has been carried out to investigate
rainfall magnitude, variability, frequency, and the duration of rainfall events in Botswana. In
addition, a GIS spatial analysis approach, the Anselin Local Moran’s I tool was used to
determine the persistence of wet and dry conditions in space and time.
3.1 Data sources
TRMM 3B43 real-time monthly rainfall data with a spatial resolution of 0.25 by 0.25
degrees (0.463km x 0.463km), for the period of 1998 to 2013 was downloaded from the
NASA Goddard Space Flight Centre website (http://disc.sci.gsfc.nasa.gov/TRMM). The
TRMM 3B43 monthly product was particularly good at producing complete spatial coverage
of rainfall measurements in Botswana (Figure 5).
Figure 5: Maps depicting the spatial comparison of TRMM rainfall measurement
points and ground-based rainfall points in Botswana (Created by Relotilwe Maboa,
2014).
WorldClim precipitation data was downloaded from the WorldClim website
(http://www.WorldClim.org). The WorldClim data layers were generated through the
interpolation of average monthly climate data from weather stations on an arc-second
resolution grid (i.e. 1km2) (Hijmans et al. 2005; http://WorldClim.org/methods). WorldClim

32
data are described as interpolated, since it has been generated based on known historical
rainfall data. The data interpolation was initiated using the smoothing spline algorithm from
the ANUSPLIN software. The occurrence of errors in the data was considered, and all
weather stations were checked to ensure correspondence between the recorded data and
mapping (Hijmans et al. 2005). Monthly averages of climate were measured at weather
stations from global, regional, national, and local surfaces for the period 1950-2000 (Hijmans
et al. 2005). Major climate databases were compiled by the Global Historical Climatology
Network (GHCN), the International Centre for Tropical Agriculture and numerous other
databases around the world (Hijmans et al. 2005; http://WorldClim.org/methods).
In this report, WorldClim precipitation data are representative of the global long term rainfall
average between 1950 and 2000 (50-year period). The spatial extent of the WorldClim
precipitation dataset was converted to 0.25 by 0.25 degrees in order to maintain spatial
consistency with the TRMM rainfall data. This study used the WorldClim precipitation
dataset as a ‘long term average rainfall reference’, for determining the frequency of rainfall
events above and below the long term reference, specific to localities across Botswana.
3.2 Data analysis
TRMM 3B43 monthly data were downloaded as rainfall intensities (mm.hr-1
), which were
converted to millimetres (mm) to obtain rainfall total values. The rainfall totals were further
transformed into the relevant rainfall variables for this research. The dataset was then used to
determine rainfall magnitude, variability, frequency and spatial clusters of high and low
rainfall regions across the time series. The software used to process the data includes ArcGIS
10.2 (Esri, 2014) and Microsoft Excel 2010.
3.2.1 Magnitude
The purpose of investigating rainfall magnitude is to understand on average, the amount of
monthly rainfall falling in Botswana during the analysis period. A total of 180 TRMM 3B43
monthly files were downloaded in Network Common Data Form (Netcdf) format and
imported into ArcGIS. The Multi-dimensions tool in ArcGIS was used to convert each Netcdf
file into raster format. The global extent of each data output was clipped, using the Clip tool
in ArcGIS to represent the Botswana landscape. All 180 clipped monthly raster outputs from
1998 to 2013, were used to calculate average monthly magnitude rainfall. The raster

33
Figure 6: An annotation of the average monthly magnitude rainfall calculation used for this
study. The January calculation is used as an example (Created by Relotilwe Maboa, 2014).
calculator tool in ArcGIS was used to calculate the average monthly magnitude rainfall over
the 15-year period. Below is the raster calculator expression, using January as an example:
Average RainfallJanuary: ∑January1998 + January1999 + January2000 + …………
January2013 / 15
Below is a schematic representation of the raster calculator expression used to calculate the
average monthly magnitude rainfall between 1998-2013 (Figure 6). January is used as an
example below:
∑
3.2.2 Variability:
Rainfall magnitudes in the tropics vary both in space (i.e. within a region) and time (i.e.
convective rainfall is episodic in nature). Temporal variability was ascertained by observing
regional (pixel) based average monthly magnitudes values across the time series. In this
study, variability of average monthly magnitudes values across the time series were analysed
by calculating the standard deviation for the average monthly magnitudes values across the
full 15 years. Standard deviation was determined using the Focal statistics tool in ArcGIS.
The standard deviation values provided an assessment for rainfall consistency or
inconsistency across the country. Rainfall standard deviation values close to 0mm represented
little variability in rainfall magnitudes, and temporally consistent rainfall falling in a specific
space, throughout the time series. High standard deviations values represented increased
variability in average monthly magnitudes, and temporally inconsistent rainfall falling in a
specific space, throughout the time series.
34
3.2.3 Frequency
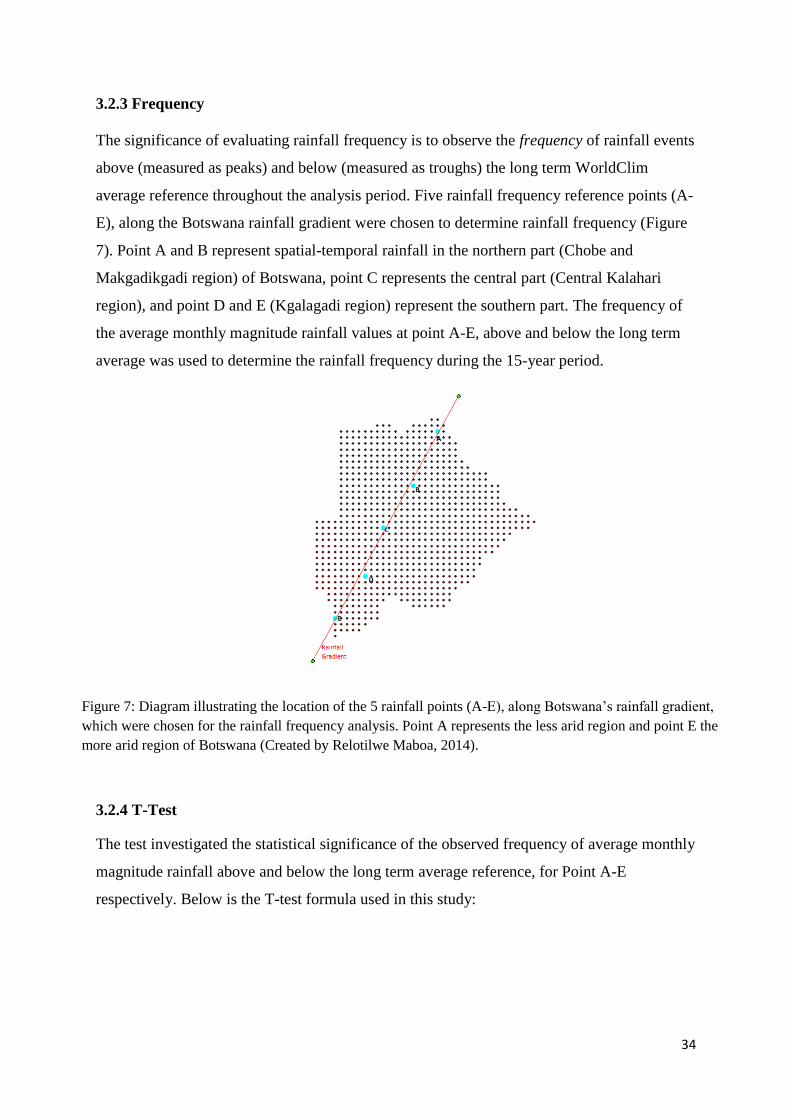
The significance of evaluating rainfall frequency is to observe the frequency of rainfall events
above (measured as peaks) and below (measured as troughs) the long term WorldClim
average reference throughout the analysis period. Five rainfall frequency reference points (A-
E), along the Botswana rainfall gradient were chosen to determine rainfall frequency (Figure
7). Point A and B represent spatial-temporal rainfall in the northern part (Chobe and
Makgadikgadi region) of Botswana, point C represents the central part (Central Kalahari
region), and point D and E (Kgalagadi region) represent the southern part. The frequency of
the average monthly magnitude rainfall values at point A-E, above and below the long term
average was used to determine the rainfall frequency during the 15-year period.
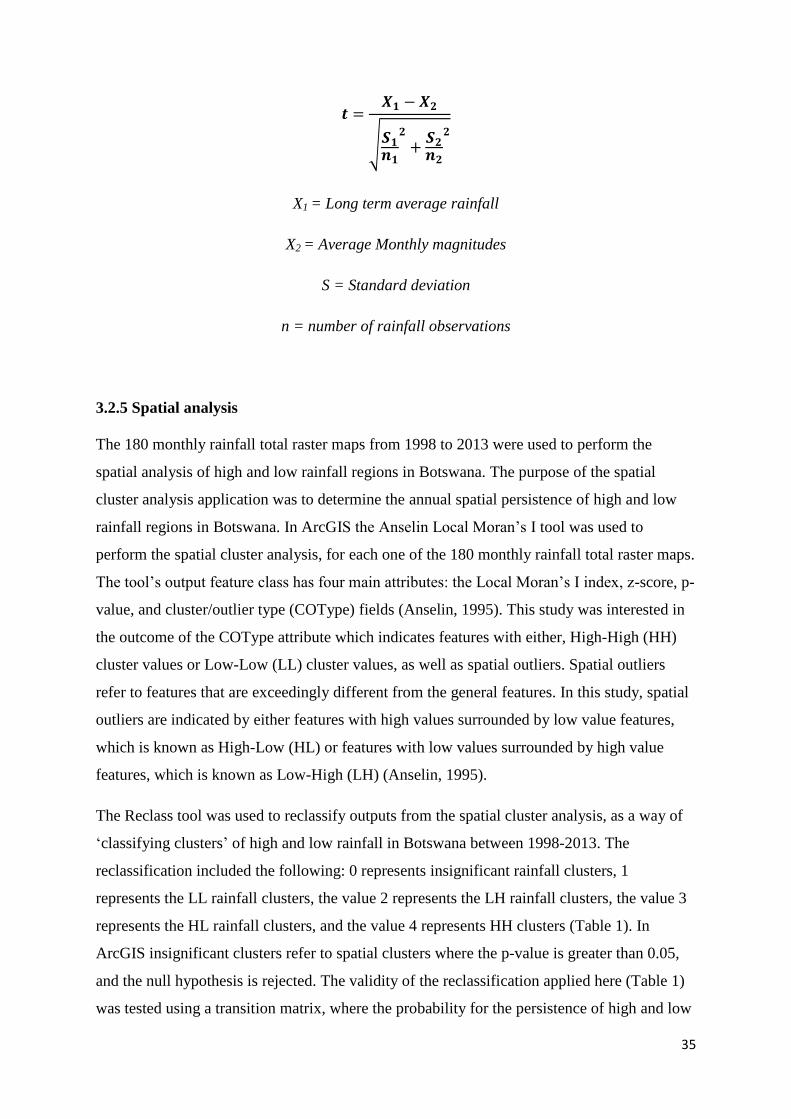
3.2.4 T-Test
The test investigated the statistical significance of the observed frequency of average monthly
magnitude rainfall above and below the long term average reference, for Point A-E
respectively. Below is the T-test formula used in this study:
Figure 7: Diagram illustrating the location of the 5 rainfall points (A-E), along Botswana’s rainfall gradient,
which were chosen for the rainfall frequency analysis. Point A represents the less arid region and point E the
more arid region of Botswana (Created by Relotilwe Maboa, 2014).
35
𝒕 =𝑿𝟏 − 𝑿𝟐
√𝑺𝟏𝒏𝟏
𝟐
+𝑺𝟐𝒏𝟐
𝟐
X1 = Long term average rainfall
X2 = Average Monthly magnitudes
S = Standard deviation
n = number of rainfall observations
3.2.5 Spatial analysis
The 180 monthly rainfall total raster maps from 1998 to 2013 were used to perform the
spatial analysis of high and low rainfall regions in Botswana. The purpose of the spatial
cluster analysis application was to determine the annual spatial persistence of high and low
rainfall regions in Botswana. In ArcGIS the Anselin Local Moran’s I tool was used to
perform the spatial cluster analysis, for each one of the 180 monthly rainfall total raster maps.
The tool’s output feature class has four main attributes: the Local Moran’s I index, z-score, p-
value, and cluster/outlier type (COType) fields (Anselin, 1995). This study was interested in
the outcome of the COType attribute which indicates features with either, High-High (HH)
cluster values or Low-Low (LL) cluster values, as well as spatial outliers. Spatial outliers
refer to features that are exceedingly different from the general features. In this study, spatial
outliers are indicated by either features with high values surrounded by low value features,
which is known as High-Low (HL) or features with low values surrounded by high value
features, which is known as Low-High (LH) (Anselin, 1995).
The Reclass tool was used to reclassify outputs from the spatial cluster analysis, as a way of
‘classifying clusters’ of high and low rainfall in Botswana between 1998-2013. The
reclassification included the following: 0 represents insignificant rainfall clusters, 1
represents the LL rainfall clusters, the value 2 represents the LH rainfall clusters, the value 3
represents the HL rainfall clusters, and the value 4 represents HH clusters (Table 1). In
ArcGIS insignificant clusters refer to spatial clusters where the p-value is greater than 0.05,
and the null hypothesis is rejected. The validity of the reclassification applied here (Table 1)
was tested using a transition matrix, where the probability for the persistence of high and low

36
spatial clusters is investigated, throughout the time series, on a year by year basis. The raster
calculation expression below was used to determine the annual rainfall clusters, from the
monthly cluster outputs. 1998 is used as an example:
Rainfall Cluster1998 = ∑January1998 + February1998 + March1998 + ………… December1998
The annual rainfall cluster regions were validated using annual rainfall totals across the 15-
year period’. The annual rainfall totals were calculated according to the following raster
calculator expression, using 1998 as an example:
Annual Rainfall Total1998 = ∑January1998 + February1998 + March1998 + …………
December1998
On the whole, the analysis of rainfall magnitudes, variability, frequency and annual spatial
cluster provides comprehensive understanding of the rainfall patterns and changes in
Botswana.
Reclassification Raster calculator
output (mm)
Rainfall cluster
0 0 Insignificant
1 0>-15 Low rainfall( LL)
2 >15-30 Low-High rainfall (LH)
3 >30-45 High-Low rainfall (HL)
4 >45-60 High rainfall (HH)
Table1. Reclassification codes used to classify TRMM rainfall clusters during the spatial
analysis.

37
CHAPTER 4: RESULTS
The analysis of rainfall in Botswana exhibited a rainfall pattern that varied by region, and by
season. Figures 8-15 depict the results for the rainfall magnitude, variability, frequency and
spatial analysis respectively.
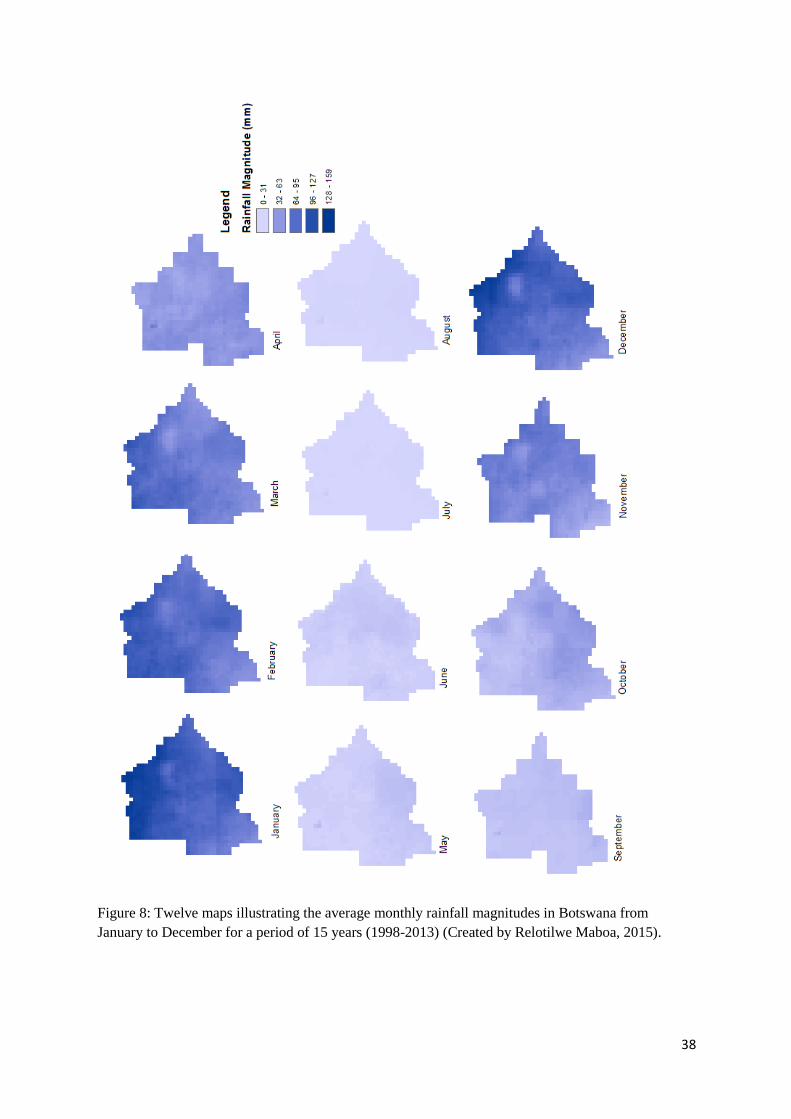
4.1 Magnitude
The average monthly magnitude rainfall results consisted of twelve maps, specific to
Botswana, illustrating the amount of rainfall during 1998-2013 (Figure 8). Hereafter, ‘rainfall
magnitude’ refers to average monthly magnitude rainfall. The pattern of rainfall magnitudes
in space and time is described below.
4.1.1 Rainy season: January-March
A spatial difference in rainfall magnitude amounts was evident during the rainy season.
January, February and March showed high rainfall magnitudes (96-159mm) in the northern,
western and south eastern parts of Botswana (Figure 8). While relatively lower rainfall
magnitudes (32-95mm) were evident in the southwest Kgalakgadi region.
4.1.2 Post rainy season: April-August
The persistence of elevated rainfall magnitudes (32-63mm) until April signified the
occurrence of late summer rainfall conditions. However, these high rainfall magnitudes were
slightly lower than the preceding calendar months (January-March). The Okavango Delta
region experienced the highest rainfall magnitudes during this season, with magnitudes on
average, up to 10mm higher than surrounding regions. May and June (i.e. seasonally
considered the winter months) indicated low rainfall magnitudes (0-32mm) across the
landscape, with the exception of the Okavango Delta and south eastern Botswana, which
maintained elevated magnitudes (32-63mm). Rainfall magnitudes during July and August
were uniformly low (0-31mm) across Botswana, while the Okavango Delta region showed
evidence of elevated rainfall magnitudes (32-63mm) during August.
4.1.3 Pre-rainy season: September-October
A gradual increase in rainfall (32-63mm) from western to eastern Botswana was apparent
during the September and October months. This increase marked the end of the low rainfall
38
Figure 8: Twelve maps illustrating the average monthly rainfall magnitudes in Botswana from
January to December for a period of 15 years (1998-2013) (Created by Relotilwe Maboa, 2015).

39
season in the north, eastern and south eastern parts of country.
4.1.4 Rainy season: November-December
During November and December northern, central eastern and south eastern Botswana
indicated high rainfall magnitudes (96-159mm); while southwestern Botswana indicated
relatively lower rainfall (0-63mm). This rainfall trend is similar to rainfall magnitudes during
January-March (Figure 7). The Okavango Delta experienced higher rainfall magnitudes (96-
127mm) than surrounding region. Surrounding regions like the Makgadikgadi Saltpans
experienced relatively lower rainfall magnitudes (96-159mm).
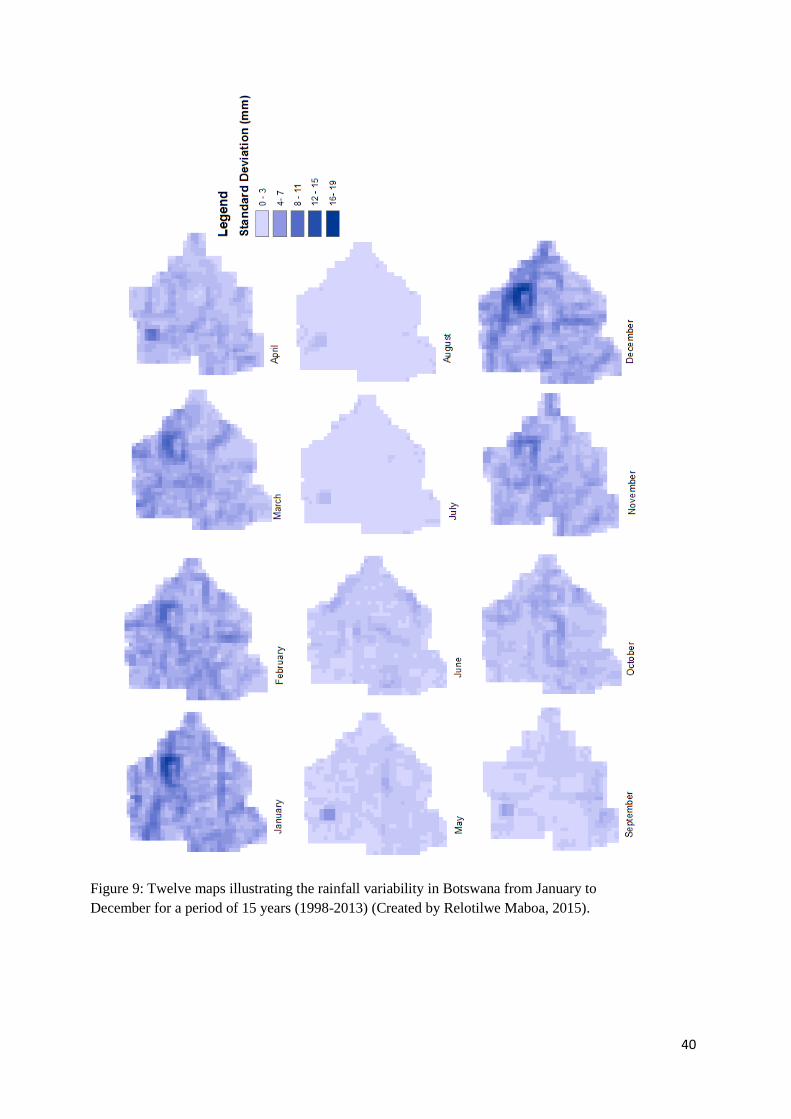
4.2 Rainfall variability
The objective of the rainfall variability analysis was to determine the distribution of the
rainfall magnitude in space throughout the time series. The rainfall variability results are
illustrated by twelve maps reflecting variability in average monthly rainfall in Botswana,
from 1998 to 2013 (Figure 9).
4.2.1 Rainy season: January-March
High rainfall variability (8-19mm) was observed over majority of the Botswana landscape,
during January-March. This result coincided with high rainfall magnitudes observed during
the same season, months and regions. The highest rainfall variability (16-19mm) was
observed in northern, western, eastern and south eastern Botswana.
4.2.2 Post rainy season: April-August
In April low rainfall variability (4-8mm) was experienced in northern, western, eastern and
south eastern Botswana. This rainfall variability was relatively lower than rainfall variability
experienced during previous months (January-March). The low rainfall variability
experienced during April, corresponded with the low rainfall magnitudes observed during the
same season, month and regions. The Okavango Delta experienced the highest rainfall
variability (8-15mm) in Botswana landscape during this season. A decrease in rainfall
variability (0-3mm) was evident across the Botswana landscape during May-August. The
Okavango Delta experienced relatively higher rainfall variability (4-7mm) than the rest of the
landscape (0-3mm) during May-August.
40
Figure 9: Twelve maps illustrating the rainfall variability in Botswana from January to
December for a period of 15 years (1998-2013) (Created by Relotilwe Maboa, 2015).
41
4.2.3 Pre-rainy season: October-September
An increase in rainfall variability (0-11mm) from western to eastern Botswana was evident in
September. This increase coincided with increased rainfall magnitudes observed during the
month. In October, an increase in rainfall variability (4-11mm) was evident in eastern,
central, south east and western Botswana. This increase corresponded with increased rainfall
magnitudes observed during the same during the same time.
4.2.4 Rainy season: November-December
In November, high rainfall variability (8-19mm) in northern, western, eastern and south
eastern region of Botswana was observed. Throughout the season, the Okavango Delta
experienced higher rainfall (8-19mm) variabilities compared to surrounding regions.
Surrounding regions like the Makgadikgadi Saltpans experienced much lower rainfall
variability.
4.3 Frequency
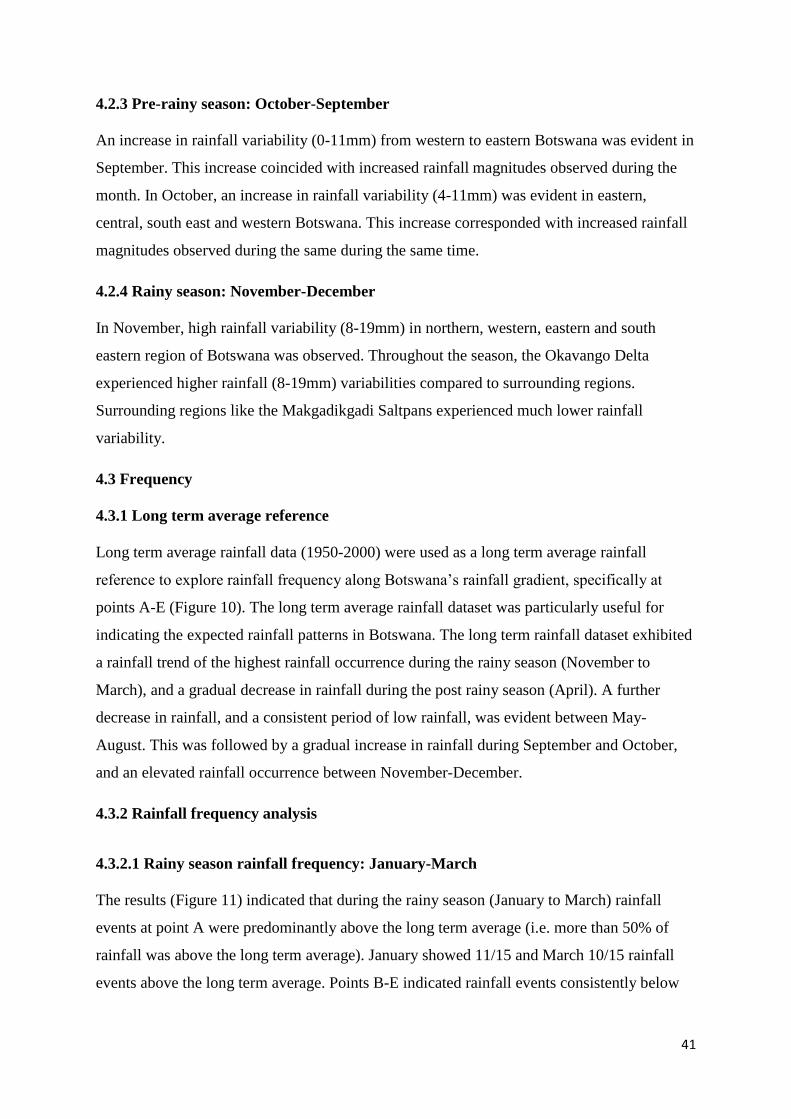
4.3.1 Long term average reference
Long term average rainfall data (1950-2000) were used as a long term average rainfall
reference to explore rainfall frequency along Botswana’s rainfall gradient, specifically at
points A-E (Figure 10). The long term average rainfall dataset was particularly useful for
indicating the expected rainfall patterns in Botswana. The long term rainfall dataset exhibited
a rainfall trend of the highest rainfall occurrence during the rainy season (November to
March), and a gradual decrease in rainfall during the post rainy season (April). A further
decrease in rainfall, and a consistent period of low rainfall, was evident between May-
August. This was followed by a gradual increase in rainfall during September and October,
and an elevated rainfall occurrence between November-December.
4.3.2 Rainfall frequency analysis
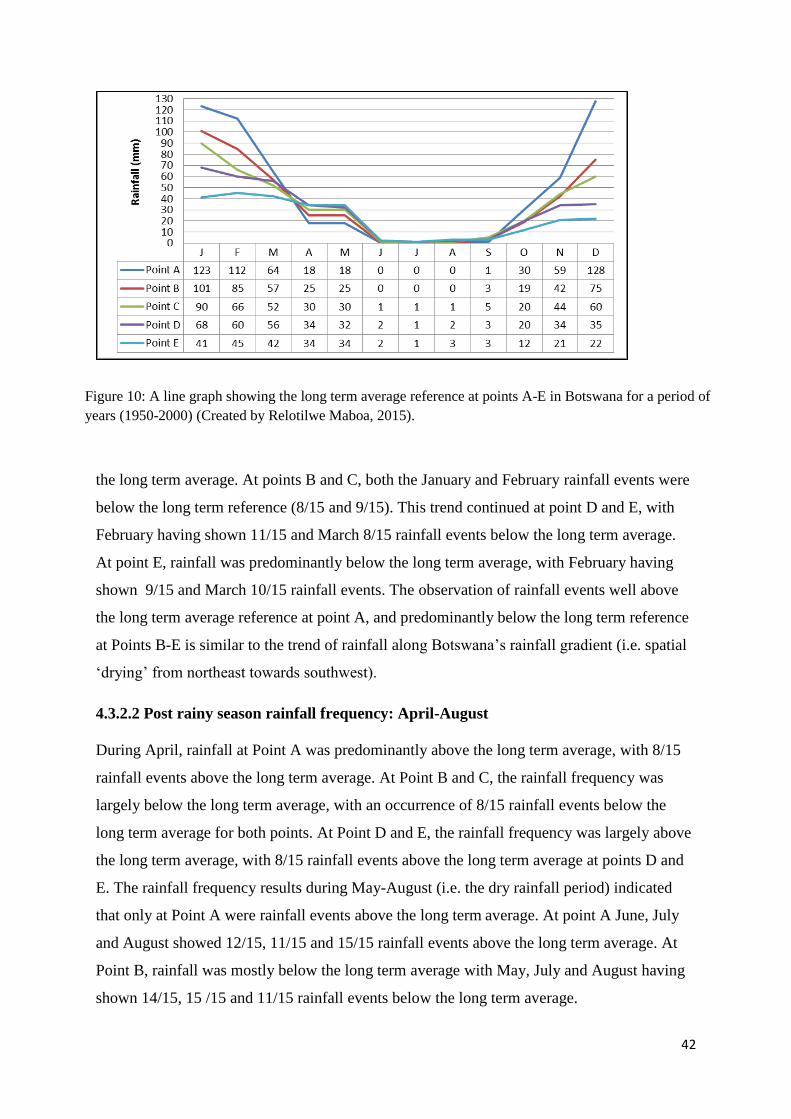
4.3.2.1 Rainy season rainfall frequency: January-March
The results (Figure 11) indicated that during the rainy season (January to March) rainfall
events at point A were predominantly above the long term average (i.e. more than 50% of
rainfall was above the long term average). January showed 11/15 and March 10/15 rainfall
events above the long term average. Points B-E indicated rainfall events consistently below
42
the long term average. At points B and C, both the January and February rainfall events were
below the long term reference (8/15 and 9/15). This trend continued at point D and E, with
February having shown 11/15 and March 8/15 rainfall events below the long term average.
At point E, rainfall was predominantly below the long term average, with February having
shown 9/15 and March 10/15 rainfall events. The observation of rainfall events well above
the long term average reference at point A, and predominantly below the long term reference
at Points B-E is similar to the trend of rainfall along Botswana’s rainfall gradient (i.e. spatial
‘drying’ from northeast towards southwest).
4.3.2.2 Post rainy season rainfall frequency: April-August
During April, rainfall at Point A was predominantly above the long term average, with 8/15
rainfall events above the long term average. At Point B and C, the rainfall frequency was
largely below the long term average, with an occurrence of 8/15 rainfall events below the
long term average for both points. At Point D and E, the rainfall frequency was largely above
the long term average, with 8/15 rainfall events above the long term average at points D and
E. The rainfall frequency results during May-August (i.e. the dry rainfall period) indicated
that only at Point A were rainfall events above the long term average. At point A June, July
and August showed 12/15, 11/15 and 15/15 rainfall events above the long term average. At
Point B, rainfall was mostly below the long term average with May, July and August having
shown 14/15, 15 /15 and 11/15 rainfall events below the long term average.
Figure 10: A line graph showing the long term average reference at points A-E in Botswana for a period of
years (1950-2000) (Created by Relotilwe Maboa, 2015).
43
Figure 11: Bar graphs showing the frequency of average monthly magnitude rainfall above and below
the long term average rainfall reference, at spatial location points A-E in Botswana, for a period of 15
years (1998-2013) (Created by Relotilwe Maboa, 2015).
44
At Point C, rainfall was mostly below the long term average with May, June and August
showing 15/15, 11/15 and 13/15 rainfall events below the long term average. At Point D,
rainfall was mostly below the long term average with May, June, July and August having
shown 14/15, 12/15, 14/15 and13/15 rainfall events below the long term average. At Point E,
rainfall frequency was mostly below the long term average with May, June, July and August
having shown 14/15, 10/15, 12/15 and 12/15 rainfall events below the long term average.
4.3.2.3 Pre-rainy season rainfall frequency: September-October
October signified an exception to Point A’s expected rainfall trend of being above the long
term average regardless of the season. October showed more than 50% of rainfall events
below the long term average (13/15). September showed 100% (15/15) of rainfall events
above long term average in September. At Point B, rainfall remained below the long term
average during both September (15/15) and October (11/15), yet at Point C rainfall events in
October (8/15) were above the long term average. At Point D, rainfall events September were
below the long term average across the 15-year analysis period (10/15), and in October more
than 8/15 rainfall events were above the long term average. Rainfall events at Point E,
remained below the long term average during both September and October, having shown
9/15 and 8/15 rainfall events below the long term average.
4.3.2.4 Rainy season rainfall frequency: November-December
At Point A, November and December showed 9/15 and 10/15 rainfall events below the long
term average. At both points B and D, rainfall events were largely below the long term
average in November (9/15 and 11/15), while largely above the long term average in
December (8/15 and 9/15). At both Point C and E, rainfall events were largely above the long
term average for both November (8/15 and 8/15) and December (9/15 and 10/15).
4.3.3 Comparison of rainfall magnitude and long term average rainfall
The t-test results for the comparison of rainfall magnitudes (i.e. average monthly magnitude
rainfall) and long term average rainfall (Table 2), specifically at points A- E, indicated that
there is no significant difference (i.e. p>0.05). Thus, there is no significant difference
between the observed rainfall (1998-2013), and the long term average rainfall (1950-2000).

45
Table 2: T-test results indicating the difference between the TRMM average monthly
magnitude rainfall and long term average rainfall, for rainfall points A- E.
Statistics
variable
Point A Point B Point C Point D Point E
Degrees
of
freedom
(df)
22 22 22 22 22
t-value 0.1054 -0.474 0.1809 1.0000 0.3089
P-value 0.9170 0.6400 0.8580 0.3282 0.76.02
4.4 Spatial analysis
The spatial analysis results consisted of 15 maps, for each year in the analysis period,
depicting the occurrence and persistence of high and low rainfall clusters in Botswana
(Figure 12). In addition, the isolated clusters of HH (i.e. a high rainfall surrounded by a high
rainfall region) and LL (a low rainfall surrounded by a low rainfall regions) rainfall are
exhibited in Figures 13 and 14, for visualisation purposes. This spatial analysis of rainfall
clusters provided an indication of annual variability of rainfall in Botswana (as opposed to the
monthly rainfall variability analysis investigated earlier).
4.4.1 Annual rainfall cluster persistence
The rainfall clusters maps in Figure 13 and 14 were used to calculate the percentage
persistence of high and low rainfall clusters across Botswana, between 1998-2013 (Table 3).
4.4.1.1 Northern Botswana
The spatial analysis results (Figure 12) showed that, on an annual basis, majority of northern
Botswana experienced insignificant rainfall clusters. However, the Okavango Delta and
Chobe National Park region showed evidence of HH rainfall clusters. Northern Botswana
showed 100% persistence for HH rainfall clusters occurring annually, throughout the analysis
period (Table 3). In contrast, there was zero evidence of LL rainfall clusters occurring
annually, across the time series.
46
Figure 12: Maps showing annual rainfall clusters between 1998 to 2013 (Created by Relotilwe
Maboa, 2015).
47
Table 3: Percentage persistence of high and low rainfall clusters across the Botswana
landscape.
4.4.1.2 Central Botswana
Central Botswana (Central Kalahari region) demonstrated HH rainfall clusters during 2001-
2003, 2005, 2006 and 2010. The LL rainfall clusters were prevalent during the more recent
analysis years namely, 1998-2006, 2009, 2011 and 2013. Central Botswana indicated a
persistence of 40% HH and LL 60% rainfall clusters (Table 3). At the beginning of the time
series (1998-2003) central Botswana experienced predominantly high rainfall clusters, while
predominantly low rainfall clusters towards the end (2009-2013). This result was suggestive
of a progressive drying across the analysis period.
4.4.1.3 Eastern Botswana
Eastern Botswana (Francistown region) demonstrated HH rainfall clusters during 1998-2000,
2003, 2004, 2007, 2009, 2011 and 2013. The LL rainfall clusters were evident during 2001-
2006, 2009, 2010 and 2012. Here a similar drying trend to central Botswana was observed in
eastern Botswana, where the beginning of the time series experienced predominantly high
rainfall clusters, and low rainfall clusters towards the end. This indicated a drying trend
across the analysis. Eastern Botswana depicted the persistence of 53.3 % HH and LL 46.7%
rainfall cluster throughout the analysis period (Table 3).
Spatial Region Rainfall cluster
HH LL
Number of
years
Percentage
persistence (%)
Number of years Percentage
persistence (%)
Northern Botswana 15 100 0 0
Central Botswana 6 40 9 60
Eastern Botswana 8 53.3 7 46.7
South eastern Botswana 7 46.6 3 20
Southwestern 0 0 15 100

48
Figure 13: Map showing annual HH rainfall clusters between 1998-2013 (Created by Relotilwe Maboa,
2015).

49
Figure 14: Map showing annual LL rainfall clusters between 1998 to 2013 (Created by Relotilwe Maboa,
2015).
50
4.4.1.4 South eastern Botswana
South eastern Botswana (Gaborone and Lobatse) showed HH rainfall clusters during 1998-
2004 and 2009. The LL rainfall clusters were evident during 2002, 2005 and 2012. A similar
drying trend to central and Botswana was observed in south eastern, which was suggestive of
a drying trend across the analysis period. The HH rainfall clusters persisted for 46.6% of the
analysis period, while LL rainfall clusters persisted 20% (Table 3). The remainder of the
rainfall clusters were insignificant for 33.4% of the analysis period, indicating where and
when (2000, 2006-2008, 2010-2011 and 2013), there was a low level of confidence for
rainfall cluster classification.
4.4.1.5 Southwestern Botswana
Southwestern Botswana, typically considered the driest region, showed zero evidence of HH
rainfall clusters, occurring annually, throughout the time series. Southwestern Botswana
demonstrated 100% persistence for LL rainfall clusters, occurring annually, between 1998-
2013 (Table 3). This result agreed with the expected rainfall conditions along Botswana’s
rainfall gradient (i.e. the lowest rainfall conditions are experienced in southwest Botswana)
(Figure 7).
4.4.2 Annual rainfall totals
The annual rainfall totals values between 1998-2013 are depicted by 15 maps, specific to
Botswana (Figure 15). It is evident that across the 15-year analysis the annual rainfall totals
ranged between 0-1025mm, which corresponds with the annual rainfall totals observed both
in the rainfall literature and historical rainfall records for Botswana (Regenmortel, 1995;
Veenendaal, 1996). The annual rainfall totals were used validate the occurrence of high and
low rainfall clusters across Botswana. These annual rainfall totals agreed with the observed
regions of high and low rainfall clusters, during this rainfall analysis.
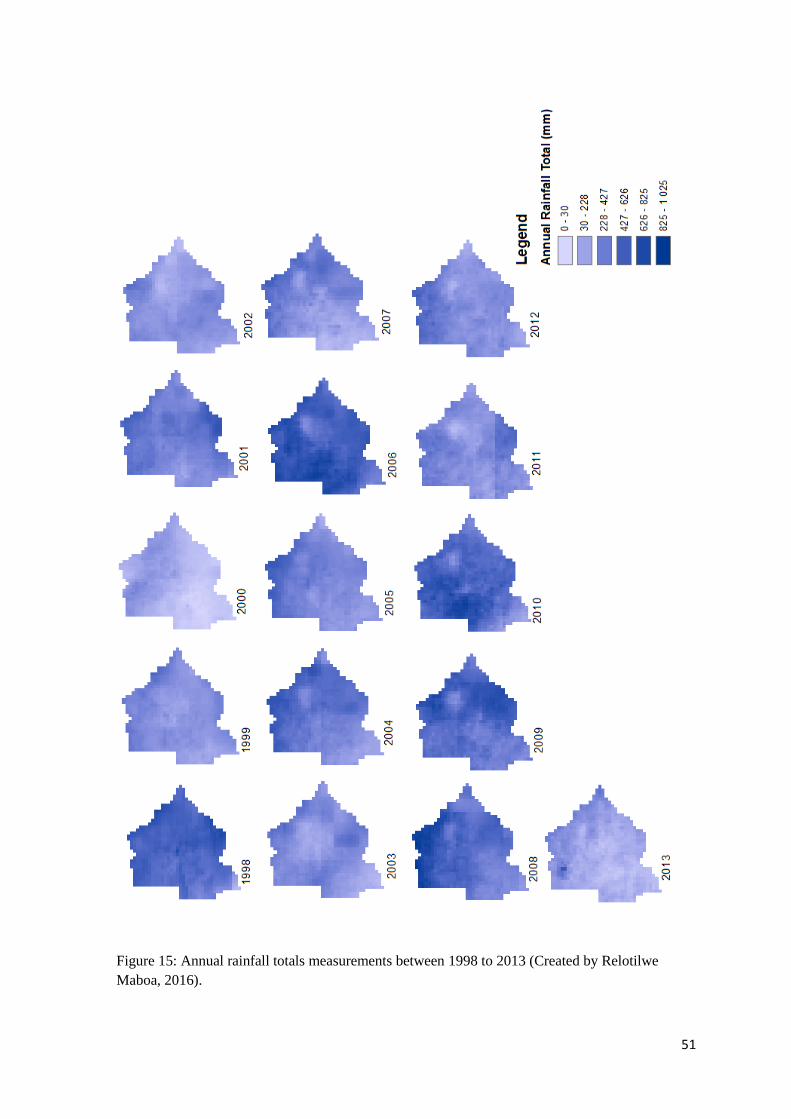
51
Figure 15: Annual rainfall totals measurements between 1998 to 2013 (Created by Relotilwe
Maboa, 2016).

52
CHAPTER 5: DISCUSSION
Rainfall is a complex subject matter that is most understood by analysing patterns of rainfall
in space and time. Semi-arid regions have spatially complex and seasonal rainfall patterns,
which contribute towards the nature of climate conditions across semi-arid landscapes
Veenendaal, 1996; Batisani and Yarnal, 2010).
5.1 The general rainfall pattern and observed changes
This study has obtained a better understanding of the spatial and temporal rainfall patterns in
Botswana. The use of satellite imagery provided a unique analysis approach, and as a result
has produced highly detailed rainfall information for conservation authorities in Botswana.
Magnitude: The highest rainfall magnitudes (96-59mm) occurred in the northern, western and
south eastern parts of Botswana during the rainy season (January-March and November-
December) (Figure 8). These high rainfall magnitude events were likely to promote relatively
wet conditions conducive for increased vegetation growth and surface water. The lowest
rainfall magnitudes (0-32mm) occurred across majority of Botswana, during May and June
(i.e. post rainy season). These low rainfall magnitude events were likely to promote relatively
dry conditions, decreased vegetation growth and surface water during May and June. The
Okavango Delta remained a region of relatively higher magnitude (32-159mm) compared to
surrounding regions throughout the time series. This marks the Okavango Delta region as a
spatially reliable location for surface water and vegetation growth, at any point in time (1998-
2013). A deviation from the expected rainfall pattern was observed in April where elevated
rainfall magnitudes, typical of the rainy season, extended to April throughout the time series.
This indicated the occurrence of high rainfall events (i.e. late summer rainfall) until April and
an extended period for relatively wet conditions, throughout the analysis period.
Variability: The highest rainfall variability (8-19mm) occurred in the northern, western and
south eastern parts of Botswana, during the rainy season (January-March and November-
December) (Figure 9). This high rainfall variability is indicative of the most temporally
inconsistent rainfall events distributed variably across Botswana. The lowest rainfall
variability (0-3mm) occurred across most of the Botswana landscape during May-August
(post rainy season). This observation of low rainfall variability is indicative of less temporally
inconsistent rainfall events distributed across Botswana.
53
The increased magnitudes corresponded with increased variability, spatially and temporally.
The rainy season (i.e. January-March and November-December) consisted of relatively high
rainfall magnitudes and variability; high rainfall magnitude events were inconsistently
distributed across Botswana throughout the analysis period. In contrast, the post rainy (May-
August) season consisted of relatively lower magnitudes and variability. Low rainfall
magnitude events were less inconsistently distributed across Botswana, spatially and
temporally. It must be noted that the observed trend of increased magnitudes corresponding
with increased variability is not due to a general association of increased magnitudes with
increased variability. Rather, it is because of the nature of the rainfall in Botswana, which is
strongly seasonal, convective and episodic (i.e. variable timing of rainfall events) in nature.
Thus rainfall, particularly during the rainy season, is unlikely to fall consistently in the same
place or in same amounts, through time.
Rainfall frequency: The rainy season had a high frequency of rainfall events above the
average long term rainfall reference (along rainfall gradient), meaning relatively wetter
conditions, than the years preceding this study, were experienced across Botswana.
According to the results, Point A was the known ‘wettest’ area in Botswana during the
rainfall analysis period. This trend continues until a change in season emerges, with point A
remaining wetter than historically documented. The post rainy season consisted of a high
frequency of rainfall events below the long term average rainfall reference (along rainfall
gradient), suggesting that relatively drier conditions, than the years preceding this study, were
experienced across Botswana. Points B-E was consistently drier than previously observed in
the post rainy season. The observation of these spatially wetter and drier conditions than the
long term average rainfall suggests the steepening slope of the rainfall gradient (Figure 7) in
Botswana. This may be an environmental indicator for a changing climate in Botswana.
While differences between the rainfall magnitudes (i.e. average monthly rainfall magnitudes)
(1998-2013) and the long term average (1950-2000) rainfall exist, statistically there is no
significant difference between these rainfall aspects (Table 2).
Spatial analysis: The 100% persistence of annually high rainfall events in northern Botswana
means relatively wet conditions persisted in this region, throughout the analysis period. The
100% persistence of annual low rainfall events towards southern Botswana, means relatively
dry conditions persisted in southern Botswana, throughout the analysis period. Similar to the
rainfall gradient (Figure 7), the persistence of annual, high rainfall events decreased from
northeast to southwest. This suggests the likely occurrence of decreasing surface water and

54
vegetation conditions (i.e. if one assumes all rainfall collects as surface flow), from northeast
to southwest throughout the analysis period. In addition, it was observed that from central
Botswana towards southwestern Botswana high rainfall clusters persist at beginning of the
time series (1998-2003), while low rainfall clusters persist towards the end of the time series
(2009-2013). This observation is suggestive of a progressive drying across the analysis
period. This detected progressive drying trend, indicates relatively increasing drying
conditions across the time series, spatially and temporally. This observation may be another
environmental indicator for a changing climate in Botswana.
5.2 Rainfall pattern implications
This study found that the observed rainfall patterns largely agree with rainfall literature for
Botswana. It is understood that November-March marks the rainy season, April-May is the
post rainy season, and September-October is the pre-rainy season. The variability of rainfall
patterns by season and region is likely to have had consequences for the climate conditions in
Botswana, during the analysis period.
5.2.1 Magnitude and variability
The high rainfall magnitudes and variability during the rainy season (January-March) are
suggestive of inconsistent wet conditions during this season. A decrease in rainfall
magnitudes and variability during the post rainy season (April-August) indicates less
inconsistent, but relatively dry conditions during this season. The rainfall literature supports
this finding indicating that rainfall events in Botswana are seasonal, unevenly distributed and
prone to drought conditions (Reason et al. 2004).
As discussed in the literature review, the seasonal rainfall patterns over southern African are
attributed to the ITCZ phenomenon (Tyson and Crimp, 1998; Reason et al. 2004; Chikoore
and Jury, 2010; Collier and Hughes, 2011). Thus, seasonally variable rainfall events observed
during this study can be attributed to the ITCZ. The ITCZ causes enhanced convective
conditions that are episodic in nature, contributing to the observed variability results (Tyson
and Crimp, 1998; Zhou et al. 2005; Collier and Hughes, 2011; Blamely and Reason, 2012).
The ITCZ typically moves south during November-March resulting in intense convective
rainfall, cumulus and cumulonimbus clouds, and wet conditions over southern Africa (Collier
and Hughes, 2011). This suggests that the rainfall events observed during the rainy season,
consisted of intense convective rainfall events (i.e. thunderstorms), and spatially inconsistent
55
wet conditions across Botswana. When the ITCZ moves north during May-October a strong
high pressure system is evident over southern Africa. This results in subsidence, minimum
cloud cover, little or no rainfall and dry conditions over southern Africa (Tyson and Crimp,
1998; Chikoore and Jury, 2010). Movement of the ITCZ towards the north is likely
responsible for the low rainfall variability observed during the post rainy season.
5.2.2 Rainfall frequency
Given the rainfall gradient in Botswana (Figure 7), relatively wet conditions were anticipated
in the northern parts of Botswana, and dry conditions in the southern parts. The rainfall
frequency results showed that rainfall events during the rainy season (January-March) were
predominantly above the long term average rainfall reference, suggesting relatively wetter
conditions than in years preceding this study. Rainfall events during the post rainy season
(April-August) were predominantly above the long term average rainfall reference,
suggesting relatively drier conditions than in years preceding this study. The observation of
these spatially wetter and drier conditions compared to the long term average rainfall,
suggests the steepening slope of the rainfall gradient in Botswana. This may be considered an
environmental indicator for a changing climate in Botswana.
During 2008, flooding activity prompted by a high frequency of rainfall events in Botswana,
resulted in the continuous flow of water into the Savuti Channel, the Boteti River, and the
Makgadikgadi pans. The point of interest is that these water resources (Savuti Channel and
Boteti River) do not typically flow throughout the year (McCarthy et al. 2003). This
suggested an elevated frequency of rainfall events in 2008, compared to previous years. The
flooding during 2008 may be related to the observation of a larger spatial extent of HH
rainfall clusters across northern Botswana, during this year. This particular extent was
spatially larger than the previous (i.e. 2006 and 2007) and subsequent (i.e. 2009-2010) years.
The flooding may also be attributed to the observation of high frequency values for months
July to September, at point A. This suggests relatively wetter conditions, than historically
documented in the literature, were experienced during this analysis period. Similar flooding
conditions may have been apparent during 2004-2005 and 2011-2012, due to the observation
of i) the larger spatial extent of HH rainfall clusters across northern, and ii) high frequency
values for months July to September at point A. McCarthy et al. (2003) conducted a study on
flooding patterns in the Okavango Delta Wetland in Botswana, which explains that flooding
is influenced by the frequency of rainfall events in time and space. The Okavango Delta is
56
one of Africa’s largest wetlands, and the floodplain forms a gentle slope in the shape an
alluvial fan. It takes flood waters approximately four months to reach the southern part of the
delta, and peak flooding is known to occur in the month of July or August, well after the
rainy season (McCarthy et al. 2003; McCarthy, 2006). These flood waters ultimately
discharge into the Thamalakane River which flows along the scarp of the Delta, discharging
into the Boteti River (McCarthy et al. 2003; McCarthy, 2006).
The literature also indicates that flooding in Botswana is known to be influenced by the
arrival of flood waters from the Angolan Highlands. After 3-4 months of leaving the Angolan
Highlands, the flood waters arrive (i.e. August-September) at the Okavango Delta (McCarthy
et al. 2003). This may explain the availability of water and greener vegetation at the
Okavango Delta during the dry season. The velocity of the flood water is contingent on
factors such as the quantity of the local rainfall, and water table height when the flood water
arrives. Therefore, it is understood that a large component of flooding and water availability
in northern Botswana is to a large extent affected by precipitation originating from beyond
Botswana’s borders, i.e. rainfall events in the Angolan Highlands.
5.2.3 Spatial analysis
It is clear from the spatial cluster analysis that annual rainfall events were spatially and
temporally variable from year-to-year. Northern Botswana experienced the persistence of HH
rainfall clusters throughout the rainfall season, while southern Botswana experienced the
persistence of LL rainfall clusters. The literature indicates that ENSO has an effect on annual
and regional rainfall patterns in southern Africa and may account for rainfall variability
during certain years (Tyson and Crimp, 1998; Reason et al. 2004; Reason et al. 2006). Thus,
the observed progressive drying trend could be attributed to ENSO. Richard et al. (2000)
conducted a study investigating the modification of southern African rainfall variability by
ENSO, which is related to the emergence of dry climate conditions to ENSO. According to
Nicholson et al. (2001), ENSO events have the capacity to strongly influence rainfall
patterns, in relation to rainfall magnitude, timing and duration, ultimately causing variable
rainfall events.
5.2.4 Climate change signals
This study has detected two environmental indicators which may be indicative of a changing
climate in Botswana. Due to the length of the analysis period it cannot be proven
57
conclusively whether the observation of relatively wetter and drier conditions during this
analysis; as well as the observed progressive drying trend across the time series, is indeed
indicative of a changing climate in Botswana. However, this drying trend supports the
climate projections of a decrease in rainfall events and increased rainfall variability in future
(Batisani and Yarnal, 2010; Conway et al. 2015). Whether this drying trend will continue
beyond this 15-year analysis period, is uncertain. Regenmortel (1995) conducted a study on
the regionalisation of Botswana rainfall, which found that rainfall events in Botswana are
spatially variable, and convectional in nature, and even in good rainfall years certain parts of
the country experience below normal rainfall events. Thus, an extended rainfall analysis
period is required to determine whether this drying trend is indicative of a changing climate
in Botswana.
5.2.5 Conservation in Botswana
This study fits into a bigger research project that is focused on herbivore conservation in
Botswana. Rainfall is known to have a direct influence on water, vegetation, and food
resources throughout Africa, as well as an indirect influence on herbivore movement.
5.2.5.1 Surface water and vegetation resources
The seasonal nature of rainfall events in Botswana results in a variable quality of surface
water and vegetation resources, between seasons (Brooks and Harris, 2008). It is clear from
the analysis that rainfall in Botswana varies by season and by region. The rainy season
(November-March) consisted of relatively wetter conditions than historically documented,
which may have been conducive to an increased quantity of surface water and vegetation
resources in Botswana, during this season. Beyond the rainy season, a relative decrease in
wet conditions was evident. The post rainy (April-August) season consisted of relatively drier
conditions, than historically documented, which may have been conducive to a decreased
quantity of surface water and vegetation resources during this season. According to
Mwafulirwa (1999), understanding rainfall variability and predictability is important for
surface water, vegetation and wildlife conservation management in southern Africa. Given
that the objective of this study was to provide an analysis of recent spatial and temporal
rainfall patterns in Botswana, the observed trends can be used to predict the occurrence of
surface water, vegetation, and also indirectly, predict conditions likely to promote herbivore
movement in Botswana.

58
From a vegetation cover perspective, the occurrence of vegetation cover in Botswana is based
on the rainfall gradient (Figure 7), which produces dense vegetation cover in the northeast
and less dense vegetation cover towards the southwest (Figure 3) (Nicholson and Fairar,
1994; Weare and Yalala, 2009; Chikoore and Jury, 2010). This study has exhibited evidence
of relatively seasonally wetter and drier conditions than historically documented. This
suggests the occurrence of denser or less dense vegetation in Botswana, than the years
preceding this study, between seasons. The extension of rainy season conditions to April
throughout the time series suggests dense and or denser vegetation conditions, occurring until
April (i.e. later than previously expected). Similarly, the drying trend towards the end of the
time series may have implications for vegetation, like a progressive trend of decreasing
vegetation quality and quantity in Botswana in future.
5.2.5.2 Animal movement and conservation
The literature indicates that animal movement is usually prompted by the need for an
environment that is conducive for survival (i.e. being in close proximity to surface water and
vegetation resources) (Cushman et al. 2005; Owen-Smith et al. 2010). Regions of permanent
surface water are known to be home to large amounts of wildlife (Child, 1970; Campbell,
1973). Northern and Central Botswana are considered the natural habitats for surface water
loving species such as hippopotamus (Hippopotamus amphibious), crocodile (Crocodylus
niloticus), elephants (Loxodonta Africana) and wildebeest (Connochaetes taurinus). The
Okavango delta in Botswana is a permanent surface water point for wildlife throughout the
year (Child, 1970). Southwest Botswana is home to species which survive with little access to
surface water such as gemsbok (Oryx gazelle) and springbok (Antidorcas marsupialis)
(Campbell, 1973; Cushman et al. 2005).
The observations of relatively wetter conditions than historically documented during the
rainy season, suggests that animals were likely exposed to sufficient surface water and
vegetation resources. The consequences of these wetter conditions may be increased forage
quantity and a longer period of forage persistence, compared to preceding years. In turn,
these conditions could have prompted a delay or reduction in animal movement, which may
be a change from the expected animal movement during the rainy season. In contrast, the
relatively drier conditions than historically documented during the post rainy season, suggest
that animals were exposed to relatively less surface water and vegetation resources, compared
to the rainy season. The consequences of these drier conditions may be decreased forage
59
quantity and a shorter period of forage persistence, compared to the years preceding this
study. In turn these conditions could have prompted increased and or earlier animal
movement than expected, due to the animals need for suitable forage resources given the
drier conditions. Furthermore, based on the rainfall trends observed during this study, it may
be predicted that water and or plant dependent animals are likely to migrate towards northern
Botswana during dry seasons (i.e. post rainy season).
The extension of rainy season conditions to April means that the period of relatively wet
conditions was extended. The consequence of an extended period of wet conditions is that
forage may have lasted longer, beyond the typical rainy season. In turn, this may have
prompted a change from the expected animal migration during April, i.e. a delay in animal
movement until the emergence of drier conditions in the following month (i.e. May). In
addition, the progressive drying trend may result in a change in the availability of forage and
water resources, as well as a progressive decrease in forage quantity and surface water
resources through time. This may prompt increased and or earlier animal migration than
expected, between seasons.
This study has conducted a comprehensive rainfall analysis for the full extent of Botswana,
providing valuable information for conservation authorities. Conservation authorities, prior to
this study, had developed national parks and reserves areas (Figure 4) for protecting wildlife
in the country. The Botswanan Government recognises the value of wildlife and its
contribution to the national economy, and thus it is committed to ensuring that wildlife is
adequately managed (Child, 1970; Mwafulirwa, 1999). Wildlife management in Botswana
includes maintenance of the national parks and game reserves, as well as controlling and
improving recreational hunting activities and facilities (Child, 1970). An important
component of conservation and management of wildlife is ensuring that surface water
resources are available for water dependent animals, and vegetation resources available for
plant dependent animals.
The progressive drying trend detected during this analysis could create a challenge for
conservation authorities in Botswana, due to the associated reduction in surface water and
vegetation resources. This finding requires the attention of conservation authorities in order
for them to establish a comprehensive response plan or strategy that would help sustain
current conservation priorities in the country. Updated conservation or animal migration
plans and strategies may be required in Botswana. These improved plans would help ensure

60
that given the expected drying trend, the national parks and game reserves fencing does not
hinder or prevent access to surface water and vegetation resources. A lack of adequate
conservation planning against this drying trend could result in wildlife deaths from
dehydration and starvation (Mbaiwa and Mbaiwa, 2006). However, there is uncertainty,
whether this drying trend will continue beyond this 15-year analysis period.
61
CHAPTER 6: CONCLUSION
Rainfall in Botswana is notably variable by season and by region, and is a contributing factor
to surface water and vegetation availability. This study has documented and described rainfall
patterns in Botswana from 1998 to 2013, using TRMM satellite data. The analysis revealed
that spatial and temporal rainfall patterns in Botswana, in recent years, are similar to the
literature. However, there are notable shifts observed in the 15-year analysis period.
6.1 Summary
In summary, the highest rainfall magnitudes occurred in northern Botswana, during the rainy
season. While the lowest rainfall magnitudes occurred in southern Botswana, during the post
rainy season. High rainfall magnitudes corresponded with high rainfall variability, indicating
regions of inconsistent rainfall events distributed variably. Low rainfall magnitudes
corresponded with low rainfall variability, indicating regions of less inconsistent rainfall
events. The occurrence and persistence of rainy season conditions (i.e. elevated rainfall
magnitudes and variability) until April is a change from the expected rainfall pattern, which
indicated an extended period of wet conditions. In terms of rainfall frequency, rainfall during
the rainy season consisted of a high frequency of rainfall events above the long term average
rainfall reference. This indicated relatively wetter conditions, than in the years preceding this
study, during the rainy season. In contrast, the post rainy season consisted of a high frequency
of rainfall events below the long term average rainfall reference, indicating relatively drier
conditions, than the years preceding this study. These spatially wetter and drier conditions
compared to the long term average rainfall may be an environmental indicator for a changing
climate in Botswana.
Based on the spatial analysis, annual high rainfall clusters persisted in northern Botswana,
indicating the annual persistence of wet conditions. Low rainfall clusters persisted in southern
Botswana, indicating the annual persistence dry conditions. A deviation from the expected
annual rainfall pattern, was the observation of a progressive drying trend towards the end of
the time series, which may indicate a signal of a changing climate in Botswana. An extended
period of rainfall analysis is required to confirm this climate change trend, and the associated
consequences thereof. The observed drying trend during analysis period can be considered an
important environmental indicator for conservationists in Botswana. This finding requires the
attention of conservation authorities in Botswana in order for them to establish a
62
comprehensive response strategy that would support conservation under changing rainfall
patterns in future.
6.2 Rainfall gradient adjustment
The observed rainfall patterns in Botswana are not changing dramatically in time and space.
The spatially wet and dry conditions remain in the same place, and are similar to that reported
by the literature. It was observed that northern Botswana became relatively wetter and wetter,
compared to historical records, while areas from central towards southwest Botswana got
relatively drier and drier. This suggests that although the rainfall gradient remains in the same
position (i.e. from northeast and southwest Botswana); it has become steeper in terms of the
observed rainfall pattern. This steepening is accompanied by greater contrasts between
traditionally ‘wet’ and ‘dry’ areas. This may be considered as another signal of a changing
climate in Botswana.
6.3 Conservation in Botswana
This study contributes towards the overarching conservation project in Botswana. The
contribution made by this study entails the ability to suggest spatial regions where vegetation
growth is likely to occur, and as such, associated herbivore migration, in response to rainfall.
The findings will be compared with those obtained by other students observing vegetation
and herbivore movements in time and space in Botswana. Together, these studies will
collectively enable protected areas authorities to better manage herbivore migration,
improving conservation in Botswana over time. Based on the 15-year analysis of rainfall, the
results predict that water and plant dependent animals are prone to move towards northern
Botswana during the dry season. This prediction should be complimented by further studies
related to this subject matter.
6.4 Considerations for other TRMM users
Accurate rainfall measurement at different temporal and spatial scales is a pertinent aspect for
rainfall studies. The objective of TRMM is to provide accurate rainfall measurements over
the tropics (Oki and Sumi, 1994; Habib and Krajewski, 2001). The accuracy of TRMM data
are calibrated and validated by comparing TRMM rainfall measurements with rainfall
measurements from surface sensors, precipitation radar and rain gauge data (Habib and
Krajewsk, 2001; Adeyewa et al. 2003; Nicholson et al. 2003; Javanmard et al. 2010). This
process is instrumental for providing an adequate level of confidence for use of TRMM
63
measurements. As a point of interest, Almazroui (2010) conducted a calibration study for
TRMM rainfall climatology over Saudi Arabia during 1998-2009, focusing on annual and
seasonal rainfall patterns. This calibration study found that TRMM overestimated rainfall
measurements during certain years, seasons and within certain regions in Saudi Arabia, a
semi-arid region with a largely flat landscape. According to Oke et al. (2009), who conducted
a TRMM satellite predictor study in Australia, a poor relationship between rain gauge data
and TRMM data can lead to large errors. The fact that TRMM has i) a significant positive
bias for inland elevated altitudes, and ii) does not capture orographic effects at the low spatial
resolution of TRMM at 0.25 (i.e. localised storms and rain shadow) contributes to a weak
relationship between rain gauge and TRMM data, which leads to error in rainfall
measurements (Oke et al. 2009). Therefore, although TRMM is considered as one of the
satellites producing some of the best available rainfall measurements in tropical regions, the
literature indicates there are certain issues related to TRMM.
6.4.1 Issues associated with TRMM
The error of overestimation is a relevant issue, which has been supported by the literature and
anecdotal evidence in discussions with other TRMM users. There are several possible reasons
for rainfall overestimation from TRMM products. These reasons are most frequently related
to i) quality of TRMM composite rainfall estimation, ii) sensitivity to rain droplet size, iii)
TRMM sensitivity to frontal rainfall, and iv) the size of the confidence interval between
ground-based data and TRMM satellite data (i.e. comparison between ground-based data and
satellite data). Below, these factors have been expanded upon:
TRMM composite rainfall estimation: The TRMM composite Climatology (TCC) is a
TRMM product which provides annual average rainfall data over a period of time. This
product is made up of the merging of various TRMM rainfall products, over both the land
and the ocean, providing an accurate composite rainfall measurement. TRMM products over
the ocean include TRMM Microwave Imager (TMI) 2A12, Precipitator Radar (PR) 2A25,
and TMI-PR 2B31 (http://www.disc.gsfc.nasa.gov). TRMM products over land consist of the
TRMM Multi-satellite Precipitation Analysis product (TMPA 3B43)
(http://www.disc.gsfc.nasa.gov ).
Nicholson et al. (2003) conducted a study on the validation TRMM rainfall product
estimations with gauge data in West Africa. The study found that the TRMM merged
products were associated with rainfall overestimation. According to Adler (2008) different
64
TRMM products produce rainfall measurements with biases towards certain regions or
surfaces, such as towards land or elevated altitudes. Gebremichael and Romilly (2010)
conducted a study on satellite derived rainfall measurements over Ethiopian river basins. The
study detected that a bias in satellite rainfall measurements existed in relation to elevation,
and the rainfall regime. Additionally, the Ethiopian study found that at low elevations TRMM
overestimated rainfall, while producing relatively accurate rainfall measurements at higher
elevations.
TRMM sensitivity to frontal rain: There are limited studies surrounding TRMM satellite
sensitivity to mid-latitude rainfall. Nonetheless, frontal rain is known to provide more
consistent and concentrated TRMM rainfall measurements (Vaughn, 1986). Han et al. (2009)
conducted a study on mid-latitude rainfall variability using TRMM, which found that TRMM
satellite sensitivity was elevated for regions experiencing frontal rain. However, according to
the literature there are certain discrepancies or inconsistences (i.e. rainfall overestimation),
surrounding TRMM rainfall measurements in convective rainfall regions. It is deduced that
TRMM may perform better in frontal rain regions, compared to convective rainfall regions.
Sensitivity to droplet size: Variation in rainfall droplet size influences scattering and
absorption of clouds, for instance large rainfall droplets are associated with short wave
absorption (Wetzel, 1990). Large rainfall droplets often lead to the establishment of
atmospheric instability, promoting rainfall formation. Understanding Rainfall Droplet Size
Distribution (DSD) is an important aspect of rainfall measurement, because variability in
rainfall droplet size can be a source of inaccuracy for rainfall measurement. A study sampling
the rainfall in China found that, increased convection rainfall rates are related to increased
rain droplet size and concentration, which can result in rainfall overestimation (Liu et al.
2010). This means droplet size may be a physical issue influencing rainfall measurement in
the tropics.
Confidence interval between ground-based data and TRMM satellite data: Both ground-
based data and TRMM satellite data have been associated with rainfall measurement errors.
Ground-based data errors are considered to be smaller than TRMM satellite data (Nicholson
et al. 2003). With regards to rainfall measurement accuracy, this creates a trade-off between
ground-based data accuracy and comprehensive TRMM satellite spatial coverage. Rain gauge
data consists of spatially limited measurements for rainfall, and also a lack of spatial

65
consistency for rainfall measurements. In contrast, TRMM provides more consistent and
spatially continuous rainfall measurements.
A study evaluating TRMM rainfall measurements using ground-based rainfall measurements
over Central Florida, found that at high rainfall rates ground-based rainfall measurements and
TRMM rainfall measurements are more likely to differ (Wang and Wolf, 2011). This may
result in less precise rainfall measurements. While at low rainfall rates the ground-based
rainfall measurements and TRMM rainfall measurements are less likely to differ (Wang and
Wolf, 2011). At high rainfall rates the possibility of TRMM rainfall overestimation increases
and the confidence interval between ground and TRMM rainfall measurements also
increases. This places emphasis on the importance of understanding the relationship between
ground-based rainfall data and TRMM rainfall data, in order to avoid less precise rainfall
measurements or overestimation.
6.5 Further research directions
This study is one of the first rainfall studies in Botswana conducted using TRMM 3B43
monthly rainfall data. This 15-year rainfall analysis, in addition to other studies on vegetation
and herbivore migration, has used satellite data to explore spatial and temporal patterns in
Botswana. I argue that the observed rainfall trends are credible and justify the conclusions
made. The methods and approach used in this study, are considered feasible, and are in line
with appropriate scientific methodology required for a detailed rainfall study. Ultimately, this
study is a building block for ensuring accurate use of TRMM data over semi-arid regions
going forward, and the implementation of increasingly effective conservation planning and
management in Botswana. Yet, there is still scope for future research across southern Africa
and within Botswana. The key areas for further research include:
The use of TRMM rainfall measurements in this study has allowed for the
comprehensive spatial analysis of rainfall in Botswana. The TRMM satellite’s ability
to provide spatially consistent rainfall data has been illustrated in this study,
addressing the typical historical limitations associated with ground-based rainfall
measurements. However, the use of satellite data does not replace ground-based data,
and it is not this study’s intention to suggest this. Rather, satellite data as shown by
this study might be considered a useful complement to ground-based rainfall
measurements, particularly in areas where rain gauge measurements are scarce. Based
66
on the anecdotal evidence in discussions with other TRMM users regarding TRMM
overestimation, it is recommended that increased local validation of TRMM is
conducted subsequent to TRMM calibration. This will assist with the rectification of
TRMM overestimation in convective rainfall regions.
The determination of localised spatial rainfall patterns and changes beyond Botswana,
i.e. Angola, particularly with reference to climate change is a point of interest. A
study of this nature would provide more recent information, regarding the
consequences of climate change for countries neighbouring Botswana.
The TRMM satellite dataset used in this study did not include detailed information
about the conditions of the landscape, for which each rainfall measurement was
recorded. This made it difficult to predict, with great certainty, how the observed
rainfall patterns impacted Botswana on the surface (ground level). Consequently,
further studies investigating the impact of these rainfall patterns at ground level are
required nonetheless. TRMM satellite data combined with various other statistical
methods could be highly valuable, in predicting the spatial and temporal response of
vegetation and surface water resources, as well as herbivores migration in Botswana.
An extension of the time series for this rainfall analysis to 30 years, would confirm
whether the observed drying trend is indeed a signal of a changing climate in
Botswana. An extended time series would be valuable for making long term
predictions regarding the response of surface water and vegetation resources, as well
as animal migration.
Although TRMM was developed for rainfall measurement in the global tropics at a
spatial resolution of 0.25 x 0.25, it might be a point of interest to assess how TRMM
satellite responds to non-tropical regions, and measurements at different spatial
resolutions (Lunetta et al. 1991).
A hydrological analysis concerning two big rivers in Botswana (i.e. Boteti and Savuti
rivers) may be valuable for comprehending the effect of the variable rainfall
frequency events, on surface water bodies in the country. Both the Boteti and Savuti
rivers derive their flow from the Okavango Delta (McCarthy et al. 2003; McCarthy,
2006). The river flows are seasonal and influence the abundance of surface water

67
resources and vegetation cover in Botswana. Assessing the hydrology in Botswana is
a sustainable way of indirectly, but continuously monitoring rainfall patterns in the
country.
An assessment on the performance of TRMM with other satellites or remote sensing
products (NOAA and STAR satellite rainfall estimates) also used for rainfall
measurement, is recommended. This assessment will provide more recent information
regarding quality and reliability of the TRMM product on a broader scale. The
standard of the TRMM compared other satellites should be indicated, and areas of
improvement for TRMM products highlighted.
68
REFERENCES
Adedoyin, J. A., Mphale, K., 2002. Climate Variability: Its impacts and mechanism within
the Kalahari Transect of southern Africa, Department of Physics, University of Botswana.
[Online], Available: http://link.springer.com/article/10.1007/s00704-013-0907-z (20 February
2015).
Adeyewa, Z.D., Nakamura, K., 2003.Validation of TRMM radar rainfall data over major
climatic regions in Africa. Journal of Applied Meteorology, 42, 331-347.
Adler, R., Gu, G., Wang, J-J., Huffman, G., 2008. Estimates of Mean Climatological
Precipitation and Bias Errors. [Online], available:
http://adsabs.harvard.edu/abs/2008AGUSM.U41B..05A (27 November 2015).
Aganga, A. A., Mthetho, J. K., Tshwenyane, S., 2003. Atriplex Nummularia (Old man
saltbush): A potential forage crop for arid regions of Botswana. Pakistan Journal of Nutrition
2, 72-75.
Almazroui, M., 2010. Calibration of TRMM rainfall climatology over Saudi Arabia during
1998-2009. Atmospheric Research. [Online], Available:
https://www.researchgate.net/publication/228372394_Calibration_of_TRMM_rainfall_climat
ology_over_Saudi_Arabia_during_1998-2009 (9 February 2016).
Anselin, L., 1995. Local Indicators of Spatial Association—LISA. Geographical Analysis,
27, 3-115.
Araújo, M. B., Thuiller, W., Williams, P. H., Reginster, I., 2005. Downscaling European
species atlas distributions to a finer resolution: implications for conservation planning. Global
Ecology and Biogeography, 14, 17-30.
Archibald, S., Lehmann, C. E. R., Gómez-Dans, J. L., Bradstock, R.A., 2013. Defining
pyromes and global syndromes of fire regimes. Proceedings of the National Academy of
Sciences (PNAS), 110, 6442-6447.
A´vila, E.E., Burgesser, R.E., Castellano, N.E., Collier, A.B., Compagnucci, R.H., Hughes,
A.R.W., 2010. Correlations between deep convection and lightning activity on a global scale.
Journal of Atmospheric and Solar-Terrestrial Physics, 72, 1114-1121.
Barnes, M.E., 2001. Effects of large herbivores and ¢re on the regeneration of Acacia
Erioloba woodlands in Chobe National Park Botswana. African Journal of Ecology, 39, 340-
350.
Batisani, N., Yarnal, B., 2010. Rainfall variability and trends in semi-arid Botswana:
Implications for climate change adaptation policy. Applied Geography, 30, 483-489.
Bartlam-Brooks, H. L. A., Beck, P.S.A., Gil Bohrer, G., Harris, S., 2013. In search of

69
greener pastures: Using satellite images to predict the effects of environmental change on
zebra migration. Journal of Geophysical Research: Biogeosciences, 118, 1427-1437.
Bartlam-Brooks, H.L.A., Bonyongo, M. C., Harris, S., 2011,Will reconnecting ecosystems
allow long-distance mammal migrations to resume? A case study of a zebra Equusburchelli
migration in Botswana. Fauna & Flora International, Oryx, 45, 210-216.
Beest, F. M., Mysterud, A., Loe, L.E., Milner, J.M., 2010, Forage, quantity, quality and
depletion as scale dependent mechanisms driving habitat selection of large browsing
herbivore. Journal of Animal Ecology,79, 910-922.
Ben-Gail, T., Bitan, R A., Manes, A., Alpert, P., Rubin, S., 1998. Spatial and temporal
changes in rainfall frequency distribution patterns in Israel. Theoretical and Applied.
Climatology, 61, 177-190.
Berger. J., 2004.The last mile: How to sustain land distance-migration in mammals,
Conservation . Biology, 18, 320-331.
Bergstrom., Skarpe, C., 1999. The abundance of large wild herbivores in a semi-arid
savanna in relation to seasons, pans and livestock. African Journal of Ecology, 37, 12-26.
Birdlife International., 2012. A comparative study of costs and benefits of soda ash mining
and promotion of ecotourism and sustainable use of natural resources in Lake Natron Basin,
Tanzania. BirdLife Africa Partnership Secretariat, Nairobi, Kenya. [Online], Available:
https://www.rspb.org.uk/Images/Lake_Natron_cba_tcm9-349050.pdf (10 March 2015).
Birkett, P. J.,Vanak, A. T., Muggeo, V. M. R., Ferreira, S. M., Slotow, R., 2012. Animal
Perception of Seasonal Thresholds: Changes in Elephant Movement in Relation to Rainfall
Patterns, PLoSONE,vol. 7, no. 6: e38363. doi:10.1371/journal.pone.0038363. [Online],
Available: http://journals.plos.org/plosone/article?id=10.1371/journal.pone.0038363(15
March 2014).
Blamely, R.C., Reason, J.C., 2012. Mesoscale Convective Complexes over southern Africa.
Journal of Climate, 25, 753-766.
Boone,R. B., Thirgood, S.J., Hopcraft, J. G.C., 2006. Serengeti wildebeest migratory patterns
modeled from rainfall and new vegetation growth. Ecology, 87, 1987-1994.
Brody, S. D., Zahran, S., Grovera, H., Vedlitz, A., 2008. A spatial analysis of local climate
change policy in the United States: Risk, stress, and opportunity. Landscape and Urban
Planning, 87, 33-41.
Brooks, C.J., Harris, S., 2008. Directed movement and orientation across a large natural
landscape by zebras, Equus burchelli antiquorum. Animal Behaviour, 76, 277-285.

70
Cain III, J. W., Owen-Smith, N., Macandza, V. A., 2012. The costs of drinking: comparative
water dependency of sable antelope and zebra. Journal of Zoology, 286, 58-67.
Camberlin, P., Janicot, S., Poccard, I., 2001. Seasonality and atmospheric dynamics of the
teleconnection between African rainfall and tropical sea-surface temperature: Atlantic VS.
ENSO. International Journal of Climatology, 21, 973-1005.
Campbell, A.C., 1973. The National Park and Reserve System in Botswana. Journal of
Biological Conservation, 5, 7-14.
Ceccanti, F., Marcuccio, S., 2000. Earth observation from elliptical orbits with very low
altitude Perigee. [Online], available:
http://www.dlr.de/Portaldata/49/Resources/dokumente/archiv4/IAA-B4-0805P.pdf (25
March 2015).
Chase, M., 2011. Dry season fixed-wing aerial survey of elephants and wildlife in northern
Botswana. Elephants without Borders, San Diego Zoological Society, Department of Wildlife
and National Parks. Report, 138. Online [Online], Available:
http://elephantswithoutborders.org/downloadspapers/EWB%202010%20BW%20Survey.pdf
(17 October 2016).
Chikoore, H. and Jury, M.R., 2010. Intraseasonal Variability of Satellite-Derived Rainfall and
Vegetation over southern Africa. Earth Interactions, 14, 1-26.
Child, G., 1970. Wildlife utilization and management in Botswana. Biological Conservation,
3, 18-22.
Chirima, G. J., Owen - Smith, N., Erasmus, B. F. N., Parrini, F., 2013. Distributional
niche of relatively rare sable antelope in a South African savanna: Habitat versus biotic
relationships. Ecography, 36, 68-79.
CIP (Climate Information Platform). [Online], Available:
http://cip.csag.uct.ac.za/webclient2/app/ (10 September 2016).
Coakley, G. J., 2003. The mineral industry of Botswana, Botswana. [Online], Available:
https://minerals.usgs.gov/minerals/pubs/country/2003/bcmyb03.pdf (10 March 2015).
Coetzer, K.L., 2014. Spatio-temporal dynamics of land-cover change in a multi-use
conservation landscape: The case of the Kruger to Canyons Biosphere Reserve, South Africa.
PhD thesis, University of the Witwatersrand, South Africa.
Collier, A.B., Hughes, A.R.W., 2011. Lightning and the African ITCZ. Journal of
Atmospheric and Solar-Terrestrial Physics, 73, 2392-2398.
71
Conway, D., Archervan Garderen, E., Deryng D., Dorling, D., Krueger, T., Landman, W.,
Lankford, B., 2015. Climate and southern Africa’s water-energy-food nexus. Nature Climate
Change, 5, 837-846.
Conway, D., Perschino, A., Ardoin-Bardin, S., Hamandawana, H., Dieulin & Gil Mahe, C.,
2009. Rainfall and water resources in sub-saharan Africa during the twentieth century.
Journal of hydrometeorology, 10, 41-59.
Conway, G., 2008.The Science of Climate Change in Africa: Impacts and Adaptation,
Department for International Development, UK. [Online], Available:
http://www.ask-force.org/web/Global-Warming/Convay-Science-Climate-Change-Africa-
2008.pdf (25 October 2014).
Costa, H., Foley, J.A., 1998. A comparison of precipitation dataset for the Amazon basin,
Geophysical Research Letters, 25, 2, 155-158.
Cozzi,G., Broekhuis, F., McNutt, J.W., Schmid, B., 2013. Comparison of the effects of
artificial and natural barriers on large African carnivores: Implications for interspecific
relationships and connectivity. Journal of Animal Ecology, 82, 707-715.
Cushman, S. A., Chase, M., Griffin, C., 2005. Elephants in space and time. OIKOS, 109, 331-
341.
D’Amore, L., Kalifungwa, P., 2013. Meeting the challenges of climate change to tourism
case studies of best practice, Liutebm University. [Online], Available:
http://www.cambridgescholars.com/download/sample/59567 (24 February 2015).
Dahlberg, A.C., 2000. Vegetation diversity and change in relation to land use, soil and
rainfall-a case study from Northeast District, Botswana. Journal of Arid Environments, 44,
19-40.
Deblauwe, V., Droissart, V., Bose, R., Sonke, B., Blach-Overgaard, A., Svenning, J-C.,
Wierings, J.J., Ramesh, B.R., Stevart., Couvreur, T.L.P., 2016. Remotely sensed temperature
and precipitation data improve species distribution modelling in the tropic. Global; Ecology
and Biogeography, 25, 443-454.
Department of Atmospheric Sciences: Interannual Variability. University of Washington.
[Online], Available:
http://www.atmos.washington.edu/~salathe/AR4_Climate_Models/StdDev/ (13 March 2015).
DIVA-GIS: Free, simple & effective. [Online], Available: http://www.diva-gis.org/ (23
March 2014).
Drosdowsky, W., 1993. An analysis of Australian seasonal rainfall anomalies: 1950-1987. I:
spatial Patterns. International Journal of Climatology, 13, 1-30.

72
Engelbrecht, F., 2005. Simulations of climate and climate change over southern and tropical
Africa with the conformal-cubic atmospheric model (Chapter 4). In: Schulze RE (ed.)
Climate Change and Water Resources in southern Africa: Studies on Scenarios, Impacts,
Vulnerabilities and Adaptation. WRC Report No. 1430/1/05. Water Research Commission,
Pretoria, South Africa, 57-74.
ESRI., 2014. ArcGIS Version 10.2 [software]. ESRI: Redlands, CA.
Fauchereau, N., Trzaska, S., Rouault, M., Richard, Y., 2003. Rainfall variability and changes
in southern Africa during the 20th Century in the Global Warming Context. Natural Hazards,
29,139-154.
Fernandez, M., Hamilton, H., Kueppers, L.M., 2013. Characterizing uncertainty in species
distribution models derived from interpolated weather station data. Ecosphere, 4, no 5, 1-17.
Fischer, M.M., Getis, A (eds.)., 2010. Handbook of Applied Spatial Analysis: Software
Tools, Methods and Applications, Springer-Verlag Berlin Heidelberg, London New York.
[Online], Available:
http://www.spatialcapability.com/Library/Handbook_of_Applied_Spatial_Analysis.pdf (5
November 2014).
Franchito, S.H., Rao, V.B., Vasques, A. C., Santo, C. M.E., Conforte, J.C., 2009. Validation
of TRMM precipitation radar monthly rainfall estimates over Brazil. Journal of Geophysical
Research, 114, 1-9.
Fryxell, J.M., Sinclair, A.R.E., 1988. Causes and consequences of migration by large
herbivores. TREE, 3, 237-241.
Funk, C., Michaelsen, J., 2004. A simplified diagnostic model of orographic rainfall for
enhancing satellite-based rainfall estimates in data-poor regions. Journal of Applied
Meteorology, 43,1366-1378.
Fynn, R.E.S., Chase, M., Röder, A., 2014. Functional habitat heterogeneity and large
herbivore seasonal habitat selection in northern Botswana. South African Journal of Wildlife
Research, 44, 1-15.
Gadgil, S., Iyengar, R. N., 1980. Cluster analysis of rainfall stations of the Indian peninsula,
Quart. Journal of the Royal Meteorological Society, 106, 873-886.
Gebremichael, M., Romilly, T.G., 2011. Evaluation of satellite rainfall estimates over
Ethiopian river basins. Hydrology and Earth System Sciences,15, 1505-1514.
Gereta, E., Mwangomo, E., Wolanski, E., 2009. Ecohydrology as a tool for the survival of the
threatened Serengeti ecosystem. Ecohydrology Hydrobiology, 9, 115-124.

73
Goddard Earth Sciences Data and Information Services Centre (GES DISC). [Online],
Available: http://disc.sci.gsfc.nasa.gov/TRMM (25 November 2015).
Goddard Space Flight Center. Precipitation measurement missions: Ground validation.
[Online], Available: https://pmm.nasa.gov/science/ground-validation. (7 September 2016).
Gong, X. and Richman, M. B. (1995) On the application of cluster analysis to growing
season precipitation data in North America east of the rockies. Journal of Climate, 8, 897-
931.
Graham, C.,1970. Wildlife Utilization and Management in Botswana. Journal of Biological
Conservation, 3, 18-22.
Grist, J., Nicholson, S.E., Mpolokang, A., 1997. On the use of NDVI for estimating rainfall
fields in the Kalahari of Botswana. Journal of Arid Environment, 35, 195-214.
Habib, E., Krajewski, A.F., 2001. Uncertainty Analysis of The TRMM Ground-Validation
Radar-Rainfall Products: Application to the TEFLUN-B Field Campaign. Journal of applied
Meteorology, 41, 558-572.
Han, M., Braun, S.A., Persson, P. O., Bao, J-W., 2009. Alongfront Variability of
Precipitation Associated With A Midlatitude Frontal Zone: TRMM Observations and MM5
Simulation. Amercian Meteorological Society,137, 1008-1028.
Hansen, J., Sato, M., Ruedy,R., Schmidt, G. A, Lo, K., 2016. Global temperatures in 2015.
[Online], Available: http://mahb.stanford.edu/wp-
content/uploads/2016/01/20160120_Temperature2015.pdf (10 September 2016).
Harbert, R.S., Nixon, K.C., 2015. Climate reconstruction analysis using coexistence
likelihood estimation (CRACLE): A method for the estimation of climate using vegetation.
American Journal of Botany, 102 (8), 1277-1289.
Hensman, M.C., Owen-Smith, N., Parrini, F., Bonyongo, C. M., 2013. Home range
occupation and habitat use of sable antelope in the Okavango Delta region of northern
Botswana. African Journal of Ecology, 52, 237-245.
Hensman, M.C., Owen-Smith, N., Parrini, F., Erasmus, B. F.N., 2012. Dry season browsing
by sable antelope in northern Botswana. African. Journal of Ecology, 50, 513-516.
Hijmans, R.J., Cameron, S. E., Parra, J. L., Jones, P.G., Jarvis, A. 2005. Very high resolution
interpolated climate surfaces for global land areas. International Journal of Climatology, 25,
1965-1978.
74
Hoerling, M., Hurrell, J., Eischeid, J., Phillips, A., 2006. Detection and attribution of
twentieth-century Northern and southern African rainfall change. Journal Of Climate,19,
3989-4008.
Holdo, R.M., Fryxell, J.M., Sinclair, A. R. E., Dobson, A., Holt, R.D., 2011. Predicted impact
of barriers to migration on the Serengeti Wildebeest Population, PLoS ONE 6(1): e16370.
doi:10.1371/journal.pone.0016370. [Online], Available: https://journals.plos.org/plosone/
article?id=10.1371/journal.pone.0016370 (22 February 2015).
Houze Jr, R. A., Rasmussen, K,L Zuluaga, M.D., Brodzik, S.R., 2015. The variable nature of
convection in the tropics and subtropics: A legacy of 16 years of the Tropical Rainfall
Measuring Mission satellite. American Geophysical Union Journal, 3, 994-1021.
HSU, K-L, Gao, X., Sorooshian, S., Gupta, H.V., 1997. Precipitation estimation from
remotely sensed information using Artificial Neural Networks. Journal of Applied
Meteorology, 36, 1176-1190.
Huffman, G.J., Bolvin., 2014. TRMM and Other Data Precipitation Data set Documentation.
[Online]. Available: http://docplayer.net/226818-Trmm-and-other-data-precipitation-data-set-
documentation-george-j-huffman-1-david-t-bolvin-1-2.html (4 September 2016).
Immerzeel , W.W., Rutten, M.M., Droogers, P., 2009. Spatial downscaling of TRMM
precipitation using vegetative response on the Iberian Peninsula. Remote Sensing of
Environment,113, 362-370.
IPCC, 2014: Barros, V.R., Field, C.B., Dokken, D.J., Mastrandrea, M.D., Mach, K.J., Bilir,
T.E., Chatterjee, M., Ebi, K.L., Estrada, Y.O., Genova, R.C., Girma, B., Kissel, E.S., Levy,
A.N., MacCracken, S.,. Mastrandrea, P.R.,White, L.L., (eds.)., 2014. Climate Change 2014:
Impacts, adaptation, and vulnerability. Part B: Regional aspects. Contribution of Working
Group II to the Fifth Assessment Report of the Intergovernmental Panel on Climate Change
(IPCC), Cambridge University Press, Cambridge, United Kingdom and New York, NY,
USA, pp. 688.
Islam, M. N. and Uyeda, H. (2005) Comparison of TRMM 3B42 products with surface
rainfall over Bangladesh. [Online], Available:
https://www.researchgate.net/publication/4183456_Comparison_of_TRMM_3B42_products_
with_surface_Rainfall_over_Bangladesh (15 March 2014).
Jagadeesh, P., Anupama, P., 2014. Statistical and trend analyses of rainfall: a case study of
Bharathapuzha river basin, Kerala, India. Indian Society for Hydraulics. Journal of Hydraulic
Engineering, 20, 119-132.
Janhom, A., Van Ginkel, F.C., Van Amerongen, J.P., Van der Stelt, P. F., 2001. Scanning
resolution and the detection of approximal caries. Dentomaxillofacial Radiology, 30, 166-
171.

75
Javanmard, S., Yatagai, A., Nodzu, M. I., BodaghJamali, J., Kawamoto, H., 2010. Comparing
high-resolution gridded precipitation data with satellite rainfall estimates of TRMM 3B42
over Iran. Advances in Geosciences, 25, 119-125.
Jeffrey, S. J., Carter, J. O., Moodie, K.B., Beswick, A.R., 2001. Using spatial interpolation to
construct a comprehensive archive of Australian climate data. Environmental Modelling &
Software, 16, 309-330.
Kane, R.P., 2009. Periodicities, ENSO effects and trends of some South African rainfall
series: an update. South African Journal of Science,105, 199-207.
Kardi, T., 2015. Similarity Measurement: Euclidean Distance. [Online], Available:
http://people.revoledu.com/kardi/tutorial/Similarity/EuclideanDistance.html (22 July 2015).
Khalili, A., Rahimi, J., 2014. High-resolution spatiotemporal distribution of precipitation in
Iran: a comparative study with three global-precipitation datasets. Theoretical and Applied
Climatology, 118, 211-221.
Knight, M. H., 1991. Ecology of the Gemsbok Oryx gazella gazelle (Linnaeus) and blue
Wildebeest Connochaetestaurinus (Burchell) in southern Kalahari, PhD thesis, University of
Pretoria, South Africa.
Kummerow, C., Simpson, J., Thiele, O., Barnes, W., Chang, A. T. C., Stocker, E., Adler, R.
F., Hou, A., Kakar, R.,Wentz, F., Ashcroft, P., Kozu, T., Hong, Y., Okamoto, K., Iguchi, T.,
Kuroiwa, H., Im, E., Haddad, Z., Huffman, G., Ferrier, B., Olson, W. S., Zipser, E., Smith, E.
A.,Wilheit, T. T., North, G., Krishnamurti, T., Nakamura, K., 2000. The status of the Tropical
Rainfall Measuring Mission (TRMM) after two years in orbit. Journal of Applied
Meteorology, 39, 1965-1982.
Kummerow, C., Barnes, W., Kozu, T., Shiue, J., Simpson, J., 1998. The Tropical Rainfall
Measuring Mission (TRMM) sensor package. Journal of Atmospheric and Oceanic
Technology, 15, 809-817.
Lazaro. R., Rodrigo, F. S., GutieHrrez . L., Domingo, F., PuigdefaHbregas , J., 2001.
Analysis of a 30-year rainfall record (1967-1997)in semi-arid SE Spain for implications on
vegetation. Journal of Arid Environments, 48, 373-395.
Library and Learning Support: The Standard Deviation. University of Surrey. [Online],
Available: http://www.surrey.ac.uk/discover/library (12 March 2015).
Loarie, S.R., Duff, P.B., Hamiliton, H., Asner, G.P., Field, C.B., Ackerly, D.D., 2009.The
velocity of climate change. International Weekly Journal of Science, 462, 1052-1057.
76
Lonfat. M., 2004. Precipitation distribution in tropical cyclones using the Tropical Rainfall
Measuring Mission (TRMM) Microwave Imager: A global perspective. American
Meteorological Society, 132, 1645-1660.
Lui, Y., Lui , X., Lu, C., Sang, J., Jia,X., Niu, S., 2010. Distributions of raindrop sizes and
fall velocities in a semi-arid plateau climate: Convective versus stratiform rains. Journal of
Applied Meteorology and Climatology, 49, 632-645.
Lunetta, R.S., Congalton, R.G., Fernstermaker, L., Tinney, L., 1991. Remote sensing and
Geographic Information Systems: Error sources and research issues. Photogrammetri
Engineering and Remote Sensing, 57,1-12.
Lyra, G. B., Oliveira-J´unior, J. F., Zeri, M., 2014. Cluster analysis applied to the spatial and
temporal variability of monthly rainfall in Alagoas state, Northeast of Brazil. International
Journal of Climatology. [Online],
http://www.academia.edu/16037090/Cluster_analysis_applied_to_the_spatial_and_temporal_
variability_of_monthly_rainfall_in_Alagoas_state_Northeast_of_Brazil (22 March 2014).
Marshal , J. P., Owen-Smith, N., Whyte, I. J., Nils Chr. Stenseth. N.C., 2011. The role of
El Ni ñ o - Southern Oscillation in the dynamics of a savanna large herbivore population.
Oikos,120, 1175-1182.
Mateo, R. G, Vanderpoorten, A., Munoz, J., Laenen, B., Desamore, A., 2013. Modeling
species distributions from heterogeneous data for the biogeographic regionalization of the
European Bryophyte Flora. Plos ONE, 8 (2), 1-11.
Mbaiwa, J. E. and Mbaiwa, O.I., 2006. The effects of veterinary fences on wildlife
populations in Okavango Delta, Botswana. International Journal of Wilderness, 12, 17-41.
McCarthy, T.S., 2006. Groundwater in the wetlands of the Okavango Delta, Botswana, and
its contribution to the structure and function of the ecosystem. Journal of Hydrology, 320,
264-282.
McCarthy, J.M., Gubricht, T., McCarthy, T., Frost, P., Wesels, K., Seidel, F., 2003. Flooding
patterns of the Okavango Wetland in Botswana between 1972 and 2000. A Journal of the
Human Environment, 32, 453-457.
Messner, S,F., Anselin, L., Robert D. Baller, R.D., Hawkins, D.F., Deane, G., Tolnay,
S.T.,1999. The spatial patterning of county homicide rates: An application of exploratory
spatial data analysis. Journal of Quantitative Criminology, 15, 423-450.
Modarres, R., Rodrigues da Silva, V. P., 2007. Rainfall trends in arid and semi-arid regions
of Iran. Journal of Arid Environments, 70, 344-355.
77
Moleele, N. M.,1998. Encroacher woody plant browse as feed for cattle. Cattle diet
composition for three seasons at Olifants Drift, southeast Botswana. Journal of Arid
Environments, 40, 255-268.
Molefe, C., Cassidy, L., Magole, L., Chimbar, M.J., 2015. Spatial and temporal variation in
flooding of rural floodplain farming areas in the Okavango Delta, Botswana. WIT
Transactions on Ecology and The Environment, 197, 71-79.
Mostashari, F., Kulldorff,M., Hartman,J.H., Miller,J.R., Kulasekera, V., 2003. Dead bird
clusters as an early warning system for WEST NILE VIRUS activity. Emerging Infectious
Diseases, 9, 641-646.
Mphale, K. M., Dash, S. K. A., Adedoyin., Panda, S. K., 2014. Rainfall regime changes and
trends in Botswana Kalahari Transect’s late summer precipitation. Theoetical and Applied
Climatology,116, 75-91.
Mpheshea, L. E., 2014. An investigation into the relative contributions of ENSO,Benguela
Niño and the sub-tropical Indian Ocean dipole on summer rainfall over southern Africa.
[Online], Available:
https://open.uct.ac.za/bitstream/handle/11427/9211/thesis_sci_2014_mpheshea_l.pdf?sequen
ce=1 (11 March 2015).
Mu˜noz-D´ıaz , D., Rodrigo, F. S., 2004. Spatio-temporal patterns of seasonal rainfall in
Spain (1912-2000) using cluster and principal component analysis: comparison. Annales
Geophysicae, 22,1435-1448.
Mwafulirwa, N.D., 1999. Climate variability and predictability in tropical southern Africa
with a focus on dry spells over Malawi. [Online], Available:
http://196.21.83.35/xmlui/bitstream/handle/10530/898/Climate%20variability%20and%20pre
dictability%20in%20tropical%20Southern%20Africa%20with%20a%20focus%20on%20dry
%20spells%20ove.pdf?sequence=1 (4 May 2016).
Nair, S., Srinivasan, G., Nemani, R., 2009. Evaluation of multi-satellite TRMM derived
rainfall estimates over a Western State of India. Journal of the Meteorological Society of
Japan, 87, 927-939.
National Oceanic and Atmospheric Administration (NOAA), (2015). Determining Global
Temperature, United States Department of Commerce. [Online], Available:
http://www.noaa.gov/climate (20 February 2015).
National Oceanic and Atmospheric Administration (NOAA), (2015). Latest news and
features, United States Department of Commerce. [Online], Available:
http://www.noaa.gov/features/02_monitoring/weather_stations.html (20 February 2015).
78
Neukom, R., Nash, D.J ., Endfield, G. H., Grab , S. W., Craig A. Grove, C.A., Kelso, C.,
Vogel, C.H., Zinke, J., 2014. Multi-proxy summer and winter precipitation reconstruction for
southern Africa over the last 200 years. Climate Dynamics, 42, 2713-2726.
Newmark, W. D., 2008. Frontiers in ecology and the environment. Ecological Society of
America, 6, 321-328.
Nicholson, S. E., Some, B., Mccollum, J., Nelkin, E., Klotter, D., Berte,Y., Diallo, B. M.,
Gaye, I., Kpabeba, G., Ndiaye, O., Noukpozounkou, J. N., Tanu, M. M., Thiam, A., Toure,
A. A. Traore, A. K., 2003. Validation of TRMM and Other Rainfall Estimates with a High-
Density Gauge Dataset for West Africa. Part II: Validation of TRMM Rainfall Products.
Journal of Applied Meteorology, 42, 1355-1368.
Nicholson, S.E., Leposo, D., Grist, J., 2001. The Relationship between El Nin˜o and Drought
over Botswana. Journal of Climate, 14, 323-335.
Nicholson, S. E., Kim, J., 1997. The relationship of the El Nin˜ o-Southern Oscillation to
African rainfall. International Journal of Climatology, 17, 117-135.
Nicholson, S.E and Farrar, T.J.,1994. The influence of soil type on the relationships between
NDVI, rainfall, and soil moisture in semi-arid Botswana. I. NDVI response to rainfall.
Remote Sensing of Environment, 50, 107-120.
Obled, C.H., Wendling, J .and Beven, K., 1994. The sensitivity of hydrological models to
spatial rainfall patterns: an evaluation using observed data. Journal of Hydrology, 159, 305-
333.
Ogutu, J. O., Owen-Smith, N., 2003. ENSO, rainfall and temperature influences on extreme
population declines among African savanna ungulate. Ecology Letters, 6, 412-419.
Oke, A. M. C., Frost, A. J., Beesley, C. A., 2009. The use of TRMM satellite data as a
predictor in the spatial interpolation of daily precipitation over Australia. In Proceedings of
the 18th World IMACS/MODSIM Congress. [Online], Available:
http://www.mssanz.org.au/modsim09/I10/oke.pdf (25 May 2016).
Oki, R., Sumi, A., 1994. Sampling simulation of TRMM rainfall estimation using Radar-
AMeDAS composites. Journal of Applied Meteorology, 33,1597-1608.
Orange-Senqu Awareness Kit., 2008. Climatic Patterns and Variability in the Orange-Senqu
River basin. [Onliine], Available:
www.orangesenqurak.com/river/climate/basin/patterns.aspx (4 May 2016).
Otto, F.R.L., 2016. Extreme events: The art of attribution. Nature Climate Change, 6, 342-
343.
Owen-Smith, N. Fryxell, J.M., Merrill, E.H. , 2010. Foraging theory upscaled: The
79
behavioural ecology of herbivore movement. Philosophy Transactions of the Royal Society B,
365, 2267-2278.
Owen-Smith, N., 1994. Responses of kudus to seasonal changes in food resources: Elasticity
in constraints. Ecology, 75, 1050-1062.
Pan, J.J., Li, S.and Cong, S., 2009. Multiscale study of the variability in the cluster analysis
of rainfall. [Online], Available:
http://amazon.nws.noaa.gov/articles/HRL_Pubs_PDF_May12_2009/HRL_PUBS_381-
443/390_MULTISCALE_STUDY_OF_THE_SPATIAL.pdf (16 March, 2014).
Parida, B. P., Moalafhi, D.B., 2008. Regional rainfall frequency analysis for Botswana
using L-Moments and radial basis function network. Physics and Chemistry of the Earth, 33,
614-620.
Partal, T., Kahya, E., 2006. Trend analysis in Turkish precipitation data. Hydrological
Processes, 20,
2011-2026.
Phillips, J.G., Cane, M.A., Rosenzweig, C., 1998. ENSO, seasonal rainfall patterns and
simulated maize yield variability in Zimbabwe. Agricultural and Forest Meteorology, 90, 39-
50.
Pitt, M. D., Heady, H. F., 1978. Responses of annual vegetation to temperature and rainfall
patterns in Northern California. Ecology, 59, 336-350.
Pohl, B., Fauchereau, N., Richard, Y., Rouault, M., C. J. C. Reason, C.J.C., 2009.
Interactions between synoptic, intraseasonal and interannual convective variability over
southern Africa. Climate Dynamics, 33, 1033-1050.
Protected Planet.net., 2014. [Online], Available: https://www.protectedplanet.net/ (24 March
2014).
Quintana, J. M., Aceituno, P., 2012. Changes in the rainfall regime along the extratropical
west coast of South America (Chile): 30-43º S. Atmósfera, 25 (1 ), México ene,
versión impresa ISSN 0187-6236. [Online], Available:
http://www.scielo.org.mx/scielo.php?script=sci_arttext&pid=S0187-62362012000100001 (22
March, 2014).
Rahm, D., Swatuk, L., Matheny, E., 2006. Water resource management in Botswana:
balancing sustainability and economic development. Environment, Development and
Sustainability, 8, 157-183.

80
Rautenbach .C.J. deW., Smith, I. N., 2001. Teleconnections between global seas-surface
temperatures and the interannual variability of observed and model simulated rainfall over
southern Africa. Journal of Hydrology, 254, 1-15.
Reason, C. J. C., Landman.,Tennant, W., 2006. Seasonal to decadal prediction of
southern African climate and its links with variability of the Atlantic Ocean. Bulletin of the
American Meteorological Society, 87, 941-955.
Reason, C.J.C., Landman, W., Tadross, M., Tennant, W., Kgatuke, M-J, (2004). Seasonal to
decadal predictability and prediction of southern African climate. [Online], Available:
www.oceandocs.org/handle/1834/403 (4 May 2016).
Reason, C. J. C., Rouault., 2002. ENSO-like decadal variability and South African rainfall.
Geophysical Research Letters, 29, 1638. [Online], Available:
http://iri.columbia.edu/~blyon/REFERENCES/P71.pdf (4 May 2016).
Regenmortel, G.V., 1995. Regionalization of Botswana rainfall during the1980s using
principal component analysis. International Journal of Climatology, 15, 313-323.
Relton, C., 2015. Movement ecology of Gemsbok in the central Kalahari in response to
vegetation greenness as assessed by satellite imagery, Centre of African Ecology, Animals
Plants and the Environmental Sciences, University of the Witwatersrand, Johannesburg.
[Online], Available:
http://wiredspace.wits.ac.za/bitstream/handle/10539/19368/MScDissertation_ClaireRelton.pd
f?sequence=1&isAllowed=y (30 May 2016).
Richard, y., Trzaska,s., Roucou, P., Rouault, M., 2000. Modification of the Southern African
rainfall variability/ENSO relationship since the late 1960s. Climate Dynamics, 16, 883-895.
Richard, Y., Poccard, I., 1998. A statistical study of NDVI sensitivity to seasonal and
interannual rainfall variations in southern Africa. International Journal of Remote Sensing,
19, 2907-2920.
Rochlin, I, Ninivaggi, D.V., Hutchinsom, M.L., Farajollahi, A., 2013. Climate change range
expansion of the Asian Tiger Mosquito (Aedes albopictus) in Northeastern USA:
Implications for public health practioners. Plos ONE, 8 (4), 1-9.
Roever, C.L., Van Aarde R.J., Leggett, K., 2013. Functional connectivity within
conservation networks: Delineating corridors for African elephants. Biological
Conservation,157, 128-135.
Ronen, K., Avinoam, D., 1999. Distribution of plant species in Israel in relation to spatial
variation in rainfall. Journal of Vegetation Science, 10, 421-432.
Rozante, J. R., Demerval Soares Moreira, D. S., Gustavo G. de Goncalves, L.,Vila, D. A.,

81
2010. Combining TRMM and surface observations of precipitation: technique and validation
over south America. Weather and Forecasting, 25, 885-894.
Serneels, S., Lambin, E. F., 2001. Land-use changes on the wildebeest migration in the
northern part of the Serengeti-Mara ecosystem. Journal of Biogeography, 28, 391-407.
Sharon D., 1965.Variability of rainfall in Israel: a map of the relative standard deviation of
the annual amounts. Israel Exploration Journal, 15, 169-176.
Shepherd, J. M., Pierce, H., Negri, A. J., 2000. Rainfall modification by major urban areas:
observations from space borne rain radar on the TRMM Satellite. Journal of Applied
Meteorology, 41, 689-701.
Siers, S., Merkerl, J., Bataille, A., Vargas., F.H., Parker, P.G., 2010. Ecological correlates of
microfilariae prevalence in endangered Galapagos Birds. Journal of Parasitology, 96, 259-
272.
Singh, K.P., Malik, A., Mohan, D., Sinha, S., 2004. Multivariate statistical techniques for the
evaluation of spatial and temporal variations in water quality of Gomti River (India)—a case
study. Water Research, 38, 3980-3992.
Singh, N., Mulye, S. S., 1991. On the relations of the rainfall variability with the mean
rainfall Over India and distribution. Theoretical and Applied Climatology, 44, 209-221.
Siyabona Africa., 2016. Flooding of the Okavango Delta. [Online], Available:
http://www.itravelto.com/flooding-of-okavango-delta.html (3 September 2016).
Siyabona Africa., 2016. Flooding of the Okavango Delta Botswana Seasons Guide. [Online],
Available: http://www.botswana.co.za/Botswana_FAQ-travel/okavango-delta-botswana-
seasons.html (3 September 2016).
Smit, I. P. J., 2011. Resources driving landscape-scale distribution patterns of grazers in an
African Savanna. Ecography, 34, 67-74.
Solomon, S., D., Qin, M., Manning, Z., Chen, M., Marquis, K.B., Averyt, M., Tignor , H.L.,
Miller (eds.)., 2007. Contribution of Working Group I to the Fourth Assessment Report of the
Intergovernmental Panel on Climate Change, Cambridge University Press, Cambridge,
United Kingdom and New York, NY, US.[Online], Available:
https://www.ipcc.ch/publications_and_data/ar4/wg1/en/contents.html (20 March, 2014).
Sorooshian, S., Hsu,K., Gao,X.,Gupta, H.V., Imam, B., Braithwaite, D., 2000. Evaluation of
Persiann System satellite-based estimates of tropical rainfall. Bulletin of the American
Meteorology Society, 81, 2035-2046.

82
Southern African Development Countries (SADC): Geo Network. [Online], Available:
http://www.sadc.int/ (23 March 2014).
South African Risk and Vulnerability Atlas (SARVA). [Online], Available:
http://rava.qsens.net/ (11 March 2015).
Sugumaran, R., Scott, R., Larson, S. R., DeGroote, J.P., 2009. Spatio-temporal cluster
analysis of county-based human West Nile virus incidence in the continental United States.
International Journal of Health Geographics, 8, 1-19.
Szekely, G.J., 2005. Hierarchical clustering via joint between-within distances: Extending
Ward’s minimum variance method. Journal of Classification, 22, 151-183.
Szyniszewska, A. M., Waylen, P.R., 2012. Determining the daily rainfall characteristics from
the monthly rainfall totals in central and northeastern Thailand. Applied Geography, 35, 377-
393.
Tao, W-K.., Lang,S., Olson, W. S., Meneghini, R., Yang, S., Simpson, J., Kummerow,C.,
Smith, E., Halverson, J., 2001. Retrieved vertical profiles of latent heat release using
TRMM rainfall products for February 1998. Journal of Applied Meteorology, 40, 957-982.
Tian, Y., Peters-Lidard, C. D., Choudhury, B., Garcia, M., 2007. Multi-temporal analysis of
TRMM-Based satellite precipitation products for land data assimilation applications. Journal
of Hydrometeorology, 8, 1165-1183.
The R Project for Statistical Computing. [Online], Available: https://www.r-project.org (24
March, 2014).
Traill, L. W., 2004. Seasonal Utilization of habitat by large grazing herbivores in semi-arid
Zimbabwe. South African Journal of Wildlife Research, 34, 13-24.
TRMM 3B43: TRMM and Other Data Sources. [Online], Available:
http://rain.atmos.colostate.edu/CRDC/datasets/TRMM_3B43.html (24 March, 2014).
Tropical Rainfall Measuring Mission (TRMM) Home: Algorithm 3B43: TRMM and Other
Data Precipitation. [Online], Available: http://trmm.gsfc.nasa.gov/3b43.html (24 March,
2014).
Tyson, P.D., Preston-Whyte, R.A., 2000. The weather and climate of southern Africa. Oxford
University Press southern Africa, South Africa.
Tyson, P. D., Crimp, S.J., 1998. The climate of the Kalahari transect. Transactions of the
Royal Society of South Africa, 53, 93-112.
Turkes, M ., 1996. Spatial and temporal analysis of annual rainfall variations in Turkey.
International Journal of Climatology, 16, 1057-1076.
83
Turner, M. G., O'Neill, R. V., Gardner, R. H., Milne, B. T., 1989. Effects of changing spatial
scale on the analysis of landscape pattern. Landscape Ecology, 3, 53-162.
Vaughn, R.A., 1986. Remote Sensing applications in meteorology and climatology.
University Of Dundee, Scotland, Uk.
Veenendaal, E.M., Ernst, W. H. O., Modise, G. S., 1996. Effect of seasonal rainfall pattern
on seedling emergence and establishment of grasses in a savanna in south-eastern Botswana.
Journal of Arid Environments, 32, 305-317.
Verlinden, A., 1998. Seasonal movement patterns of some ungulates in the Kalahari
ecosystem of Botswana between 1990 and 1995. African Journal Ecology, 36, 117-128.
Venter, J. A., Watson, L.H., 2008. Feeding and habitat use of buffalo (Synceruscaffercaffer)
in the Nama-Karoo, South Africa. South African Journal of Wildlife Research, 38, 42-51.
Wald, L., Ranchin, T., Mangolini, M., 1997. Fusion of satellite images of different spatial
resolutions: Assessing the quality of resulting images. Photogrammetric engineering and
remote sensing, Asprs American Society for Photogrammetry, 63 (6), 691-699.
Wang, J., Wolff, D.B., 2011. Evaluation of TRMM rain estimates using ground
measurements over central Florida. Journal of Applied Meteorology and Climatology, 51,
926-940.
Weare, P.R., Yalala, A., 2009. Provisional vegetation map of Botswana. [Online], Available:
http://journals.co.za/docserver/fulltext/botnotes/3/1/719.pdf?expires=1476969954&id=id&ac
cname=guest&checksum=EF2CACBD8F1274193C22FA4C1657D1AE (7 May 2015).
Weng, F., Ferraro, R.R., Grody, N.C., 1994. Global precipitation estimations using Defense
Meteorological Satellite Program F10 and F11 special sensor microwave image data. Journal
of Geophysical Research, 99, 14493-14502.
Wetzel, M. A., 1990. Investigation of a remote sensing technique for droplet effective radius.
[Online], Available: https://dspace.library.colostate.edu/handle/10217/15 (27 November
2015).
Williamson, D., Williamson, J., Ngwamotsoko, K. T., 1988. Wildebeest migration in the
Kalahari. African Journal of Ecology, 26, 269-280.
Winterbach, H. E. K., Winterbach, C.W., Somers, M.J., 2014. Landscape suitability in
Botswana for the conservation of its six large African carnivores, PLoS ONE 9(6): e100202.
doi:10.1371/journal.pone.0100202. [Online], Available:
http://journals.plos.org/plosone/article?id=10.1371/journal.pone.0100202 (21 February
2015).
84
WorldClim - Global Climate Data: Free climate data for ecological modeling and GIS.
[Online], Available: http://www.worldclim.org/ (20 March 2014).
World Weather Online., 2015. Gaborone monthly climate average, Botswana . [Online],
Available: http://www.worldweatheronline.com/gaborone-weather-averages/south-
east/bw.aspx (12 March 2014).
World Wildlife Fund., 2015a. Eastern Africa: The greater Serengeti grassland ecosystem in
northern Tanzania. [Online], Available: http://www.worldwildlife.org/ecoregions/at0714 (5
March 2015).
World Wildlife Fund., 2015b. southern Africa: Northern Botswana. [Online], Available:
http://www.worldwildlife.org/ecoregions/at0908 (5 March 2015).
Yeh, S-W., Kug, J-S., Boris Dewitte, B., Min-Ho Kwon, M-H., Kirtman, B. P., Jin, F-F.,
2009. El Niño in a changing climate. Nature, 461, 511-514.
Zhao, F., Zhang, L., Chiew, F.H.S., Vaze, J., Cheng, L., 2013. The effect of spatial
rainfall variability on water balance modeling for south eastern Australian catchments.
Journal of Hydrology, 493, 16-29.
Zhanga, C., Luob, L., Xub, W., Ledwitha, V., 2008. Use of Local Moran's I and GIS to
identify pollution hotspots of Pb in urban soils of Galway. Ireland. Science of the Total
Environment, 398, 212-221.
Zhong, L., 2015. Evaluation of precipitation climatology derived from TRMM multi-satellite
precipitation analysis (TMPA) monthly product over land with two gauge-based products.
Climate, 3, 964-982.
Zhou, X., Persaud, N.,Wang, H., 2005. Periodicities and scaling parameters of daily rainfall
over semi-arid Botswana. Ecological Modelling, 182, 371-378
Ziv, B., Saaroni, H., Pargament, R., Harpaz, T., Pinhas A., 2013.Trends in rainfall regime
over Israel, 1975-2010, and their relationship to large-scale variability. Reg Environ Change,
DOI 10.1007/s10113-013-0414-x . [Online], Available:
http://link.springer.com/article/10.1007/s10113-013-0414-x (18 March 2014).


