
Spatio-temporal Indoor Human Exposures in
Homes Affected by Chemical-contaminated
Soil and Groundwater
Leonid Turczynowicz
A thesis submitted in fulfilment of the requirements for the degree of
Doctor of Philosophy
November 2017
School of Public Health
Faculty of Health and Medical Sciences
University of Adelaide, South Australia

i
TABLE OF CONTENTS
Page
TABLE OF CONTENTS .............................................................................................................................. i
CONTRIBUTION TO KNOWLEDGE ....................................................................................................... v
ABSTRACT ................................................................................................................................................. v
DECLARATION ..................................................................................................................................... xiii
ACKNOWLEDGMENTS ........................................................................................................................ xiv
LIST OF TABLES .....................................................................................................................................xv
LIST OF FIGURES .................................................................................................................................. xvi
LIST OF ABBREVIATION, ACRONYMS AND SYMBOLS............................................................... xix
LIST OF APPENDICES ........................................................................................................................ xxvi
THESIS OVERVIEW .......................................................................................................................... xxvii
1 GENERAL INTRODUCTION 1
1.1 VAPOUR INTRUSION 1
1.1.1 Background to the issue of vapour intrusion ................................................ 1
1.1.2 Vapour intrusion modelling .......................................................................... 5
1.2 HUMAN HEALTH RISK ASSESSMENT 9
1.2.1 Introduction ................................................................................................... 9
1.2.2 Identifying concerns (problem formulation and scoping) ........................... 18
1.2.3 Hazard assessment ...................................................................................... 19
1.2.4 Exposure assessment ................................................................................... 21
1.2.5 Environmental and chemical-specific parameters, and exposure factors ... 23
1.2.6 Risk characterisation ................................................................................... 25
1.2.7 Biological monitoring ................................................................................. 26
1.2.8 Environmental epidemiology ...................................................................... 28
1.3 PUBLIC HEALTH SIGNIFICANCE OF VAPOUR INTRUSION 28
1.3.1 Nature and extent of the problem ................................................................ 28
1.3.2 Toxicology of vapour intrusion contaminants ............................................ 30
1.3.3 Epidemiological evidence of health concerns ............................................. 36
1.4 CONCLUDING COMMENTS 38
ii
2 CRITICAL LITERATURE REVIEW 39
2.1 READER NAVIGATION 39
2.2 OBJECTIVES OF THE LITERATURE REVIEW 39
2.3 LITERATURE SEARCH STRATEGY 41
2.3.1 Summary of key relevant papers ................................................................. 42
2.3.2 Critical review of key relevant papers ........................................................ 56
2.4 CURRENT AUSTRALIAN REGULATORY GUIDANCE ON VAPOUR INTRUSION
ASSESSMENT 76
2.4.1 National Environment Protection (Assessment of Site Contamination)
Measure (1999) (NEPM) ........................................................................................ 76
2.4.2 State Environment Protection Authorities (EPAs) ...................................... 78
2.5 INTERNATIONAL GUIDANCE ON VAPOUR INTRUSION 83
2.5.1 Canada ......................................................................................................... 83
2.5.2 European Environment Agency .................................................................. 84
2.5.3 New Zealand ............................................................................................... 84
2.5.4 The Netherlands .......................................................................................... 85
2.5.5 United Kingdom .......................................................................................... 86
2.5.6 United States of America ............................................................................ 88
2.6 CONCLUDING COMMENTS ON THE REGULATORY ENVIRONMENT 92
2.7 UNCERTAINTIES AND GAPS IN KNOWLEDGE IN RELATION TO VAPOUR INTRUSION
ASSESSMENT 93
2.8 PROPOSED DIRECTION FOR THE CURRENT RESEARCH 95
2.9 AIMS AND RESEARCH QUESTIONS 97
2.9.1 Phase 1 – critical literature review .............................................................. 97
2.9.2 Phase 2 – Case Study 1 ............................................................................... 98
2.9.3 Phase 3 – Case Study 2 ............................................................................... 98
2.10 WHAT IS NOT ADDRESSED IN THIS RESEARCH 99
3 CASE STUDY 1 - EVALUATION OF A SUSPENDED-FLOOR HOUSE 101
3.1 PURPOSE OF CASE STUDY 101
3.2 INTRODUCTORY BACKGROUND 102
3.3 EXPERIMENTAL METHODS 104
3.3.1 Description of property and location ........................................................ 104

iii
3.3.2 General experimental approach................................................................. 105
3.3.3 Description of chemical application procedure......................................... 105
3.3.4 Soil sampling and testing methods ............................................................ 106
3.3.5 Dwelling features, ventilation and meteorological assessments ............... 110
3.4 VAPOUR INTRUSION MODELLING 111
3.5 RESULTS 114
3.5.1 Indoor air concentrations of xylene........................................................... 114
3.5.2 Air exchange rates and meteorological variables...................................... 117
3.5.3 Evaluation of measured against predicted air xylene concentrations and
ventilation observations ........................................................................................ 122
3.6 CONCLUDING COMMENTS 128
4 CASE STUDY 2A AND 2B – EVALUATION OF A SLAB-ON-GROUND
HOUSE 133
4.1 CASE STUDY 2A 133
4.1.1 Purpose of the case study .......................................................................... 133
4.1.2 Introductory background ........................................................................... 134
4.1.3 Description of property and location......................................................... 137
4.1.4 Experimental summary ............................................................................. 139
4.1.5 Data preparation, calculations and statistical methods ............................. 151
4.1.6 Results ....................................................................................................... 159
4.1.7 Concluding comments ............................................................................... 198
4.2 CASE STUDY 2B 201
4.2.1 Purpose of case study ................................................................................ 201
4.2.2 Introductory background ........................................................................... 201
4.2.3 Experimental methods ............................................................................... 203
4.2.4 Results and observations ........................................................................... 207
4.2.5 Concluding comments ............................................................................... 212
5 GENERAL DISCUSSION 215
5.1 READER NAVIGATION 215
5.2 NOVELTY OF THE RESEARCH 215
5.3 MAJOR FINDINGS OF THE STUDIES 216
iv
5.3.1 Time-dependent changes in indoor air concentrations ............................. 216
5.3.2 Environmental factors affecting indoor air TCE concentrations .............. 221
5.3.3 Exposure assessment and biological monitoring ...................................... 226
5.4 SUMMARY IMPLICATIONS 228
5.5 GENERALISABILITY OF RESULTS 229
5.6 STRENGTHS AND LIMITATIONS OF THE OVERALL RESEARCH 230
5.6.1 Strengths.................................................................................................... 230
5.6.2 Limitations ................................................................................................ 231
6 CONCLUSIONS AND RECOMMENDATIONS 233
6.1 CONCLUSIONS 233
6.2 RECOMMENDATIONS 236
6.3 FUTURE RESEARCHERS 236
6.4 REGULATORY AGENCIES, SITE CONTAMINATION CONSULTANTS, AUDITORS AND
COMMUNITIES 237
7 REFERENCES 240
APPENDIX 1 PUBLISHED PAPERS 270
APPENDIX 2 PAPER BY TURCZYNOWICZ AND ROBINSON (2001) 271
APPENDIX 3 CASE STUDY 1 STATA® LOG FILE 272
APPENDIX 4 HOBO U30 STATION TECHNICAL DETAILS 273
APPENDIX 5 RADIELLO® ANALYTICAL METHOD 274
APPENDIX 6 CASE STUDY 2A EXAMPLE DATA FILE 275
APPENDIX 7 SGS LEEDER CONSULTING LABORATORY REPORTS 276
APPENDIX 8 CASE STUDY 2A STATA® LOG FILES AND PLOTS 277
APPENDIX 9 CASE STUDY 2B ETHICS APPROVAL AND FORMS 278
APPENDIX 10 ENVIROLAB SERVICES BLOOD TCE ANALYTICAL
METHOD 279
APPENDIX 11 BIOLOGICAL MONITORING REPORTS 280
APPENDIX 12 EXAMPLE OF BLOOD TCE CHROMATOGRAM 281
APPENDIX 13 E-COPY OF THESIS AND DATA ON DISC 282

v
CONTRIBUTION TO KNOWLEDGE
This research provides new insights concerning indoor air contaminant exposure
assessment associated with vapour intrusion (VI).
A summary position from the literature, identifies knowledge gaps. Case studies
explore these gaps and provide quantitative data related to volatile organic compound
(VOC) concentrations in terms of within-building spatial and temporal variance and the
factors that influence that variance. The findings can be used to establish a new
evidence-based indoor air sampling strategy that represents ‘worst case’ conditions,
consistent with the public health precautionary principle. Furthermore, this enables an
improved understanding of the human health effects of volatile substances from ground
contamination and identifies the need to develop a dynamic, time-dependent model of
vapour intrusion in buildings. In addition, the research explores a biological monitoring
approach, with end-exhaled breath sampling and testing under environmental
conditions. This approach shows promise as a non-invasive means of assessing
exposure and uptake.
ABSTRACT
INTRODUCTION
Public health problem statement
Vapour intrusion is a process that involves the migration of volatile chemicals from
contaminated soil and/or groundwater into dwellings or other confined structures where
inhalational exposure may occur. The process is exemplified by naturally occurring soil
radon, which is considered a major risk factor for lung cancer in a number of countries.
However, the extensive use of industrial chemicals and fuels over many years has left a
legacy of soil and groundwater contamination potentially posing an even wider variety
of disease endpoints. Volatile substances such as benzene and trichloroethylene (TCE)
have also been shown to intrude into buildings from single or multiple sources off site.
Limited environmental epidemiological studies have reported increased risks of cancer
and non-cancer effects. Owing to the number of people potentially exposed including
vulnerable subpopulations, regulatory agencies have developed frameworks for risk
assessment based on environmental sampling and predictive models.
These approaches, however, are based on idealized contaminant source and migration

vi
characteristics, and have been found to have limited predictive value for health risk
assessment. Further research is required to provide more confidence in risk assessment
outcomes.
Initial literature review
In Australia, the federal enHealth’s human health risk assessment framework and a
National Environment Protection Measure provide the basis for site contamination
assessment. These documents, although recognizing the complexity of vapour intrusion,
provide limited guidance on exposure assessment and have a focus on petroleum
hydrocarbons.
The human health risk assessment of vapour intrusion can be structured into three key
areas:
• Sub-surface fate and transport models and vapour measurement that establishes
the vapour concentration at the building boundary.
• Ventilation models and measurement which consider indoor air concentrations
in space and over time within the building; and
• Human inhalation dosimetry which considers absorbed doses over time.
The peer-reviewed scientific literature on vapour intrusion over the past thirty years
combined with the international regulatory documentation is extensive. However, the
majority of this literature is oriented towards the initial phase of sub-surface transport to
the building boundary. There has been limited focus on ventilation dynamics and less
so on inhalation dosimetry. In the past five years, however, increasing attention has
focused on spatial and temporal indoor air contaminant changes with one public health
publication on residential indoor air spatio-temporal variability and another on linking
indoor air contaminant concentrations to biological markers. In terms of considering
inhalation dosimetry, however, there is as yet, no discourse on how these indoor
environments may result in differing inhalation doses. This may be particularly
important where high level peak doses due to environmental effects on the distribution
of an indoor volatile, result in adverse pathologies. Indeed, there is some evidence, for
example, in the case of TCE, for peak tissue concentrations precipitating acute
neurotoxic effects.

vii
Gap in knowledge
The gaps in knowledge in vapour intrusion exposure assessment include the following:
• Models of dynamic and time-dependent (non-steady state) vapour migration
processes and their validation.
• An understanding of spatio-temporal variability in indoor concentrations and the
correlates of the variability that might lead to an evidenced-based indoor air sampling
protocol.
• The time dependence of absorbed dose, especially tissue concentrations, that
results from time-dependent inhaled air concentrations.
PURPOSE STATEMENT
Through a critical review of the literature and a series of empirical case studies, this
research seeks to:
• Elucidate the nature of spatial-temporal changes in indoor contaminant
concentrations within houses affected by vapour intrusion and the factors that may
influence those changes.
• Provide an evidence base for a time-dependent vapour intrusion model with
empirical evaluation, applicable to Australian conditions.
• Explore the utility of biological monitoring for risk assessment in a common
vapour intrusion scenario.
GENERAL RESEARCH QUESTIONS
• What is the short- and long-term spatio-temporal variability of indoor air
contaminants arising from vapour intrusion?
• Which factors are significantly associated with indoor air concentration
variability?
• What is the relationship between biological monitoring data and indoor TCE
concentrations?

viii
METHODS
A critical literature review and experimental case study approach were used. The
experimental case studies were opportunistic and reflected real-life conditions. Case
Study 1 was a termiticide treatment (including xylene) in a suspended floor home and
Case Study 2 was a slab-on-ground house in a TCE-affected area.
Critical literature review
Computerised searches of the published literature were conducted using the Web of
Science, Scopus and PubMed. The logic grid included “vapour intrusion”;
“ventilation”; “inhalation dosimetry” and “exposure”. The yields were complemented
with author searching and forwards and backwards searching. The literature on vapour
intrusion was critically reviewed in terms of its utility for human health risk assessment.
Case Study 1 – Suspended timber floor home construction - Indoor air concentrations
The upper portion of the soil in the subfloor of a 1950’s home was treated with technical
grade xylene containing m-, p- and o-xylenes as part of a termiticide treatment.
Analyses were conducted of soil xylene and moisture concentrations; subfloor and
indoor air xylene concentrations; and air exchange rates in the subfloor space and
occupied space. Concurrent meteorological data were collected from a weather station.
A published Australian non-steady state model, developed in previous national
guidance, was used to estimate (and compare with) indoor air concentrations based on
the empirical measurements.
Case Study 2a – Concrete slab on ground home construction - Indoor air
concentrations
A four-bedroom public housing property in a residential area impacted by chlorinated
hydrocarbon contaminated groundwater was used over a period of 14 months to assess
indoor air TCE levels. Passive TCE sampling occurred at five indoor and two outdoor
locations over various time intervals. Air exchange rates were calculated at front and
rear indoor sampling locations. Detailed local meteorological data were gathered from a
weather station. Indoor temperature and indoor relative humidity were measured at 30
minute intervals over a 3-month period at each of five indoor air sampling locations.
Soil vapour, sub-slab vapour and flux chamber measurements were carried out during

ix
one week concurrent with 6 hour passive sampling.
Case Study 2b - Slab on ground home construction - Human exposure experiments:
A biological monitoring pilot study was conducted with 5 volunteer adults who
occupied the TCE-contaminated house for 12 hours. End-exhaled breath samples and
blood samples were collected. Participants were also asked to provide urine samples at
baseline, at the end of the exposure period and on three subsequent occasions. Passive
indoor air sampling and surface flux testing was undertaken. Sub-slab TCE samples
were also collected inside and outside the house.

x
RESULTS
Critical literature review
Papers on vapour intrusion mainly focused on issues associated with the sub surface.
These included areas such as development of one- and three-dimensional steady-state
models; estimation of attenuation factors; lateral exclusion distances; factors affecting
subsurface migration such as moisture levels and oxygen concentrations and
reconsideration of the United States (US) Environment Protection Agency vapour
intrusion database. There have, however, been some new areas of focus in the last five
years, which have included the use of new real-time measurement techniques; an
increased focus of the role of pressure differences on indoor air contaminant
concentrations; seasonal and diurnal differences and spatio-temporal variability in
homes across an affected community. One recent study examined indoor air TCE
concentrations and blood TCE levels. The recent literature has increasingly examined
the above-ground and indoor environment but has not further considered within-
building spatial differences nor a more detailed examination of short-term indoor air
average concentration changes and associated influencing variables. In addition, the
literature is silent on the issue of inhalation dosimetry in vapour intrusion and the
potential for non-invasive methods of biological monitoring.
Case Study 1– Suspended floor home construction - Indoor air concentrations
Xylene air concentrations decayed to non-detectable levels within two weeks. Subfloor
xylene air concentrations were greater than living space xylene air concentrations, and
the decay of the concentrations following a generally consistent pattern. Air exchange
rates between the sub-floor and living space differed by up to an order of magnitude and
demonstrated the influence of subfloor ventilation on vapour intrusion. Statistically
significant associations were found for air exchange in the sub-floor space and locally
measured minimum and average wind speed.
Site-specific variables in a non-steady state model showed general consistency with
measured data, but the modelling estimated a greater shorter-term initial peak with more
rapid decay of xylene concentrations than those measured.
xi
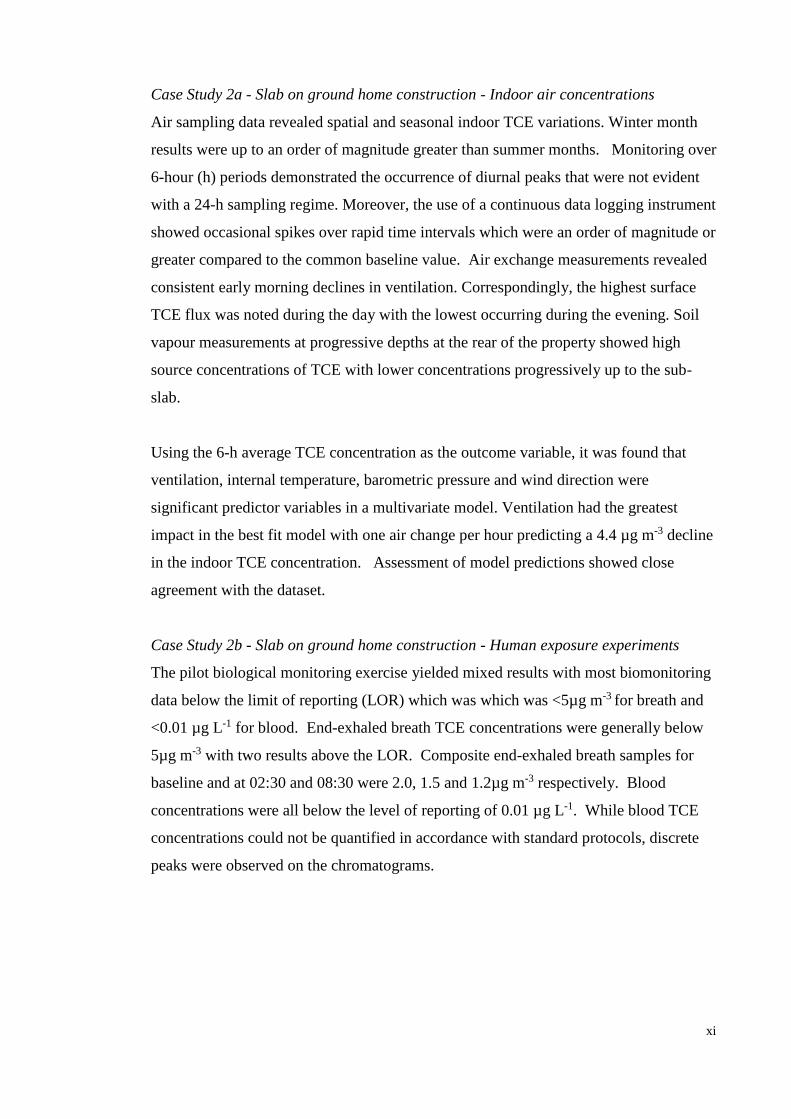
Case Study 2a - Slab on ground home construction - Indoor air concentrations
Air sampling data revealed spatial and seasonal indoor TCE variations. Winter month
results were up to an order of magnitude greater than summer months. Monitoring over
6-hour (h) periods demonstrated the occurrence of diurnal peaks that were not evident
with a 24-h sampling regime. Moreover, the use of a continuous data logging instrument
showed occasional spikes over rapid time intervals which were an order of magnitude or
greater compared to the common baseline value. Air exchange measurements revealed
consistent early morning declines in ventilation. Correspondingly, the highest surface
TCE flux was noted during the day with the lowest occurring during the evening. Soil
vapour measurements at progressive depths at the rear of the property showed high
source concentrations of TCE with lower concentrations progressively up to the sub-
slab.
Using the 6-h average TCE concentration as the outcome variable, it was found that
ventilation, internal temperature, barometric pressure and wind direction were
significant predictor variables in a multivariate model. Ventilation had the greatest
impact in the best fit model with one air change per hour predicting a 4.4 µg m-3 decline
in the indoor TCE concentration. Assessment of model predictions showed close
agreement with the dataset.
Case Study 2b - Slab on ground home construction - Human exposure experiments
The pilot biological monitoring exercise yielded mixed results with most biomonitoring
data below the limit of reporting (LOR) which was which was <5µg m-3 for breath and
<0.01 µg L-1 for blood. End-exhaled breath TCE concentrations were generally below
5µg m-3 with two results above the LOR. Composite end-exhaled breath samples for
baseline and at 02:30 and 08:30 were 2.0, 1.5 and 1.2µg m-3 respectively. Blood
concentrations were all below the level of reporting of 0.01 µg L-1. While blood TCE
concentrations could not be quantified in accordance with standard protocols, discrete
peaks were observed on the chromatograms.

xii
CONCLUSIONS AND RECOMMENDATIONS
The recent literature has increasingly examined the above-ground and indoor
environment but has not further considered within-building spatial differences nor short-
term indoor air average concentration changes and their influencing variables. In
addition, the literature is silent on the issue of inhalation dosimetry in vapour intrusion
and the potential for non-invasive methods of biological monitoring.
Case Study 1 confirmed the influence of dwelling features and that of ventilation and
meteorological variables such as wind speed for a suspended-floor dwelling.
Case Study 2 captured greater resolution across all measurements and although the
extent of the variables measured varied, sufficient data were captured to provide a more
detailed examination of time-dependent change. Statistically significant spatial
differences were observed suggesting the need to account for prevailing wind direction
in worst case indoor sampling strategies. Mixed-effects regression models were
consistent with the observed seasonal and diurnal differences. The two case studies
provide evidence for a worst-case sampling strategy, that is, sampling in winter and
during the evening and accounting for spatial variance.
Overall, the results demonstrate the complexity of indoor ventilation dynamics and that
spatial and temporal influences are important to understand for exposure assessment
purposes. Short term, peak TCE exposure periods were observed and may be of
toxicological significance based on information suggesting TCE exhibits a non-
monotonic dose-response relationship for foetal malformations.
On the basis of the research the following recommendations are made:
• More detailed and extensive (>1 year) longitudinal studies capturing time-
dependent changes in indoor air concentrations and all influencing variables
including air pressure changes, should be undertaken.
• A human volunteer biological monitoring study using end-exhaled breath and
blood TCE analyses should be undertaken, using sensitive analytical techniques
such as Selected Ion Flow Tube Mass Spectrometry.
• A retrospective epidemiological study in TCE-affected areas should be
conducted in Adelaide.

xiii
DECLARATION
I certify that this work contains no material which has been accepted for the award of
any other degree or diploma in my name, in any university or other tertiary institution
and, to the best of my knowledge and belief, contains no material previously published
or written by another person, except where due reference has been made in the text. In
addition, I certify that no part of this work will, in the future, be used in a submission in
my name, for any other degree or diploma in any university or other tertiary institution
without the prior approval of the University of Adelaide and where applicable, any
partner institution responsible for the joint-award of this degree.
I give consent to this copy of my thesis when deposited in the University Library, being
made available for loan and photocopying, subject to the provisions of the Copyright
Act 1968.
I acknowledge that copyright of published works contained within this thesis resides
with the copyright holder(s) of those works.
I also give permission for the digital version of my thesis to be made available on the
web, via the University’s digital research repository, the Library Search and also
through web search engines, unless permission has been granted by the University to
restrict access for a period of time.
I acknowledge the support I have received for my research through the provision of an
Australian Government Research Training Program Scholarship.
Signed: _____________________________________________________________
Date: _______________________________________________________________
Leonid Turczynowicz BAppSc MPH
Adelaide, South Australia
xiv
ACKNOWLEDGMENTS
This research would not have been possible without the support of a number of
companies and individuals.
To my principal supervisor, Professor Dino Pisaniello and co-supervisor, Associate
Professor Terry Williamson, a special thank you for your continuing direction,
thoughtful advice, and sustained support and understanding over the years of this
research.
I would like to thank Dr. Richard Evans, for his advice, support and tireless efforts in
completing the testing of the passive samples, and also to the volunteers who committed
their time to the biological monitoring pilot program. A special thankyou also to
Suzanne Edwards who provided statistical support and to Lefty Morias of HousingSA
who provided access to a vacant house for research.
I would like to acknowledge the financial support of Australian Environmental Auditors
Pty Ltd (AEA) who provided funding for blood testing and SGS Leeder Consulting
(SGS) for providing support services and in-kind testing of the breath, flux and soil
vapour samples. Mick Barta (formerly of AEA) and Kristian Hanson (SGS) are
particularly recognised for their support to this research and David Williams of
Envirolab Services Pty Ltd for his enthusiasm in undertaking the blood sampling.
To my colleague, Dr Neville Robinson, a grateful acknowledgement of his sustained
support over many years and for his thoughtful insights into many aspects of this
research.
To my partner Felicity, and to my daughter Jade, a thank you for your patience,
understanding, love and support over the years of this research without which it would
have been difficult to complete.
[Thank you also to Kayla Friedman and Malcolm Morgan of the Centre for Sustainable
Development, University of Cambridge, United Kingdom (UK) for producing the
Microsoft Word thesis template used to produce this document.]

xv
LIST OF TABLES
TABLE 1-1: TOTAL PETROLEUM HYDROCARBON FRACTIONS AND DATA ......................... 31
TABLE 2-1: LOGIC GRID ADOPTED FOR LITERATURE SEARCH STRATEGY .......................... 42
TABLE 2-2: SUMMARY OF KEY RELEVANT PAPERS – OBJECTIVE ................................... 144
TABLE 2-3: SUMMARY OF KEY RELEVANT PAPERS – OBJECTIVE ................................... 249
TABLE 3-1: GENERAL PROTOCOL ................................................................................... 108
TABLE 3-2: SOIL PROPERTIES FOR MODELLING PURPOSES ............................................. 109
TABLE 3-3: PHYSICO-CHEMICAL AND BUILDING CHARACTERISTICS USED IN
MODELLING ............................................................................................................ 112
TABLE 4-1: SUMMARY TCE DATA FOR FLUX CHAMBER MEASUREMENTS ...................... 183
TABLE 4-2: SUMMARY SOIL VAPOUR (SV)/SUB-SLAB (SS) RESULTS (µG M-3) ................ 186
TABLE 4-3: RESULTS FOR MULTIVARIATE LINEAR MIXED-EFFECTS MODEL .................... 196
TABLE 4-4: URINE SAMPLING PROCEDURE ..................................................................... 207
TABLE 4-5: ALL RESULTS FOR PILOT BIOLOGICAL MONITORING EXPERIMENT ................ 208

xvi
LIST OF FIGURES
FIGURE 1-1: ENVIRONMENTAL HEALTH PARADIGM AND RISK ASSESSMENT ..................... 11
FIGURE 1-2: FRAMEWORK FOR HEALTH RISK ASSESSMENT DECISION-MAKING ................ 12
FIGURE 1-3: ENHEALTH RISK ASSESSMENT FRAMEWORK ................................................. 14
FIGURE 1-4: REVISED OUTLINE OF THE INTERLINKED PROCESSES OF EHRA .................... 15
FIGURE 1-5: HUMAN HEALTH AND VAPOUR RISK ASSESSMENT FRAMEWORK ................... 17
FIGURE 1-6: EXPOSURE AND THE ENVIRONMENTAL HEALTH FRAMEWORK ...................... 22
FIGURE 1-7: REDUCTIVE DE-CHLORINATION OF TETRACHOROETHYLENE......................... 33
FIGURE 2-1: CONCEPTUAL STRUCTURE OF AIRWAY COMPARTMENT MODEL .................... 70
FIGURE 3-1: CASE STUDY 1 FLOOR PLAN ....................................................................... 104
FIGURE 3-2: CASE STUDY 1 - FRONT OF HOUSE .............................................................. 104
FIGURE 3-3: AUSTRALIAN NON-STEADY-STATE VAPOUR MODEL SCENARIO ................... 113
FIGURE 3-4: SUBFLOOR XYLENE CONCENTRATIONS ....................................................... 115
FIGURE 3-5: INDOOR AIR XYLENE CONCENTRATIONS ..................................................... 115
FIGURE 3-6: SUBFLOOR SPACE PID, DAY 1 TO DAY 12 .................................................. 116
FIGURE 3-7: INDOOR AIR PID, DAY 1 TO DAY 12........................................................... 116
FIGURE 3-8: SUBFLOOR AIR CHANGES WITH TIME .......................................................... 117
FIGURE 3-9: BOM WIND SPEED VS SUBFLOOR ACH ...................................................... 119
FIGURE 3-10: BOM WIND DIRECTION VS SUBFLOOR ACH ............................................. 119
FIGURE 3-11: SUBFLOOR ACH VS TEMPERATURE .......................................................... 120
FIGURE 3-12: SUBFLOOR ACH VS AVE RH % .............................................................. 120
FIGURE 3-13: SUBFLOOR ACH VS WIND DIRECTION ...................................................... 121
FIGURE 3-14: SUBFLOOR ACH VS WIND SPEEDS ............................................................ 121
FIGURE 3-15: VAPOUR MODELLING OUTPUTS ................................................................ 125
FIGURE 3-16: MEASURED INDOOR AIR XYLENE CONCENTRATIONS ................................ 126
FIGURE 3-17: MODEL OUTPUTS VERSUS PID MEASUREMENTS IN INDOOR AIR ............... 126
FIGURE 3-18: PID MEASUREMENTS IN INDOOR AIR ........................................................ 127
FIGURE 3-19: PID MEASUREMENTS SHOWING DIURNAL INFLUENCES ............................ 127
FIGURE 4-1: VAPOUR MIGRATION TRANSPORT PATHWAYS............................................. 136
FIGURE 4-2: FRONT OF HOUSE USED IN CASE STUDY 2 .................................................. 137
FIGURE 4-3: RESEARCH HOUSE FLOOR PLAN WITH SAMPLING LOCATIONS (TO SCALE) .. 138
FIGURE 4-4: HOBO U30 WEATHER STATION ................................................................. 139

xvii
FIGURE 4-5: PASSIVE SAMPLING, VENTILATION ASSESSMENT, PID (1_IN)..................... 144
FIGURE 4-6: RAE SYSTEMS LP1200 AND MEASUREMENT INSTRUCTIONS ..................... 147
FIGURE 4-7: FLUX CHAMBER SAMPLING LAYOUT .......................................................... 149
FIGURE 4-8: INDOOR FLUX CHAMBER INDOOR OPERATION AT LOCATION F5 .................. 150
FIGURE 4-9: FLUX CHAMBER OPERATION OUTDOORS ADJACENT SV3-14M ................... 150
FIGURE 4-10: INDOOR TEMPERATURE (OC) DISTRIBUTION .............................................. 159
FIGURE 4-11: INDOOR RELATIVE HUMIDITY DISTRIBUTION ............................................ 160
FIGURE 4-12: OUTDOOR TEMPERATURE DISTRIBUTION (OC) .......................................... 162
FIGURE 4-13: BAROMETRIC PRESSURE DISTRIBUTION (MBAR) ....................................... 162
FIGURE 4-14: RELATIVE HUMIDITY DISTRIBUTION (%) .................................................. 162
FIGURE 4-15: WIND SPEED DISTRIBUTION (M S-1) ........................................................... 163
FIGURE 4-16: GUST SPEED DISTRIBUTION (M S-1) ........................................................... 163
FIGURE 4-17: WIND DIRECTION DISTRIBUTION ............................................................... 163
FIGURE 4-18: SOLAR RADIATION DISTRIBUTION (W M-2) ................................................ 164
FIGURE 4-19: WIND ROSE, 24-31 AUGUST 2015 ............................................................ 164
FIGURE 4-20: PID FOR 24-31 AUGUST 2015 AT LOCATION R4 ...................................... 165
FIGURE 4-21: PID FOR 01-08 SEPTEMBER 2015 AT LOCATION R1 ................................. 166
FIGURE 4-22: PID INCREASE 26 AUGUST 2015 AT LOCATION R4 ................................... 166
FIGURE 4-23: PID INCREASE 27 AUGUST 2015 AT LOCATION R4 ................................... 167
FIGURE 4-24: PID INCREASE 27-28 AUGUST 2015 AT LOCATION R4 ............................. 167
FIGURE 4-25: PID INCREASE 29 AUGUST 2015 AT LOCATION R4 ................................... 168
FIGURE 4-26: PID INCREASE 30 AUGUST 2015 AT LOCATION R4 ................................... 168
FIGURE 4-27: PID INCREASE 31 AUGUST 2015 AT LOCATION R4 ................................... 169
FIGURE 4-28: PID INCREASE MORNING OF 1 SEPTEMBER 2015 AT R4 ............................ 169
FIGURE 4-29: PID INCREASE AFTERNOON OF 1 SEPTEMBER 2015 AT R4 ........................ 170
FIGURE 4-30: PID INCREASE 5 SEPTEMBER 2015 AT LOCATION R1 ............................... 170
FIGURE 4-31: 4-H AVERAGE RESULTS ON 15 JULY 2015 ................................................. 171
FIGURE 4-32: 7-D AVERAGE RESULTS FOR WEEK 15-22 JULY 2015 ................................ 172
FIGURE 4-33: 6-H AVERAGE AT LOCATION 1_IN, 24-31 AUGUST 2015 .......................... 173
FIGURE 4-34: 6-H AVERAGES AT LOCATION 2_IN, 24-31 AUGUST 2015 ........................ 173
FIGURE 4-35: 6-H AVERAGES AT LOCATION 3_IN, 24-31 AUGUST 2015 ........................ 174
FIGURE 4-36: 6-H AVERAGES AT LOCATION 4_IN, 24-31 AUGUST 2015 ........................ 174
FIGURE 4-37: 6-H AVERAGES AT LOCATION 5_IN, 24-31 AUGUST 2015 ........................ 175

xviii
FIGURE 4-38: 6-H AVERAGES, ALL LOCATIONS, 24-31 AUGUST 2015 ............................. 175
FIGURE 4-39: 24-H AVERAGES, BY LOCATION, 24-31 AUGUST 2015 .............................. 176
FIGURE 4-40: 7-D AVERAGES, BY LOCATION, 24-31 AUGUST 2015 ................................ 177
FIGURE 4-41: 12-H AVERAGES, LOCATION 1_IN, 9-16 AUGUST 2015 ............................ 178
FIGURE 4-42: 24-H AVERAGES, LOCATION 1_IN, 9-16 AUGUST 2015 ............................ 178
FIGURE 4-43: 7-D AVERAGES, BY LOCATION, 9-16 AUGUST 2015 .................................. 179
FIGURE 4-44: 24-H AVERAGES, OCTOBER 2014 TO NOVEMBER 2015 ............................ 180
FIGURE 4-45: 7-D AVERAGES, OCTOBER 2014 TO NOVEMBER 2015 .............................. 181
FIGURE 4-46: INDOOR FLUX RESULTS 25-31 AUGUST 2015 ........................................... 184
FIGURE 4-47: 6-H AVERAGES AND INDOOR FLUX MEASUREMENTS AT R5/F5 ................. 184
FIGURE 4-48: ACH, LOCATION 1_IN, 15-16 JULY 2015 ................................................ 187
FIGURE 4-49: 12-H ACH, LOCATION 1_IN, 9-16 AUGUST 2015 ..................................... 188
FIGURE 4-50: 12-H ACH, LOCATION 4_IN, 9-16 AUGUST 2015 ..................................... 188
FIGURE 4-51: 6-H ACH, LOCATION 1_IN, 42-31 AUGUST 2015 ..................................... 190
FIGURE 4-52: 6-H ACH, LOCATION 4_IN, 24-31 AUGUST 2015 ..................................... 190
FIGURE 4-53: 24-H ACH, 1_IN/4_IN, 9-16 AUGUST 2015 ............................................ 191
FIGURE 4-54: 24-H ACH, 1_IN/4_IN, 24-31 AUGUST 2015 .......................................... 191
FIGURE 4-55: COMPARISON OF MODEL-PREDICTED AND MEASURED VALUES ................ 197
FIGURE 4-56: PARTICIPANTS AT THE REAR OF THE HOUSE .............................................. 204
FIGURE 4-57: BREATH SAMPLING SETTING..................................................................... 205
FIGURE 4-58: A HAPPY PARTICIPANT DURING BLOOD SAMPLING! .................................. 206
FIGURE 4-59: INDOOR AIR TCE CONCENTRATIONS (BIOLOGICAL MONITORING) ............ 211
FIGURE 4-60: PID (PPB) RESULTS OVER 12 HOURS (BIOLOGICAL MONITORING) ............. 211

xix
LIST OF ABBREVIATIONS, ACRONYMS AND SYMBOLS
θG Air-filled porosity or volumetric air content
α Alpha = attenuation factor (AF)
~ Approximately
µT Degradation rate constant of contaminant in soil
µa Degradation rate constant of contaminant in air oC Degrees Centigrade
ρB Dry bulk density
4-h Four hour
> Greater than
1_IN Location one inside also referred to as R1
2_IN Location two inside also referred to as R2
3_IN Location three inside also referred to as R3
4_IN Location four inside also referred to as R4
5_IN Location five inside also referred to as R5
6_OUT Location six outside
µg L-1 Micrograms per litre
µg m-3 Micrograms per cubic metre
µg m-2 min-1 Micrograms per square metre per minute
ε n-by-1 observation error vector
1-D One-dimensional
β p-by-1 fixed-effects vector
P Particle density
% Percentage
% v/v Percentage by volume
® Registered trademark
7-d Seven day
7_OUT Radiello location 7 outside
6-h Six hour
6_OUT Radiello location 6 outside
3-D Three-dimensional
ϕ Total soil porosity
3-D Three-dimensional
12-h Twelve hour
24-h Twenty-four hour
ΩD Volume of interior of the house
ΩCS Volume of subfloor space
θL Water-filled porosity or volumetric water content
A Area
ACH Air changes per hour
ACH_1_IN Ventilation variable for air exchange at location R1/1_IN (6-h average)
ACH_1_IN30min Ventilation variable for air exchange at location R1/1_IN (30min average)
ACH_4_IN Ventilation variable for air exchange at location R4/4_IN (6-h average)

xx
LIST OF ABBREVIATIONS, ACRONYMS AND SYMBOLS (CONTD.)
ACH_4_IN30min Ventilation variable for air exchange at location R4/4_IN (30min average)
AEA Australian Environmental Auditors Pty Ltd
AF Attenuation factor
AHTA Adelaide Health Technology Assessment
AMTB Air-Mucous-Tissue-Blood
ASC-NEPM Australian Site Contamination National Environment Protection Measure
ASL Arterial Spin Labelling
AS/NZS Australian Standard/New Zealand Standard
ASTM American Society for Testing and Materials
ATSDR Agency for Toxic Substances and Disease Registry
AUC Area Under Curve
AVE RH Average relative humidity
AVE temp oC Average temperature degrees celsius
AVE WD Average wind direction
b q-by-1 random-effects vector
BOM Bureau of Meteorology
bp Barometric pressure variable
BRAC Base Realignment and Closure (Act)
BSI British Standards Institute
BTEX Benzene, Toluene, Ethyl benzene and Xylene
CARACAS Concerted Action on risk Assessment for Contaminated Sites in the
European Union
bp Barometric pressure variable
c Concentration
CCME Canadian Council of Ministers of the Environment
CFD Computational Fluid Dynamic
CFD-PBPK Computational Fluid Dynamic-Physiologically-Based Pharmaco-Kinetic
CI Confidence Interval
CIHD Cumulative Indoor Human Dose
CIRIA Construction Industry Research and Information Association
CL:AIRE Contaminated Land: Applications in Real Environments
CLEA Contaminated Land Exposure Assessment model
CLM Act Contaminated Land Management Act
cm Centimetre
cm3 Centimetre cubed
cm3 cm-3 Centimetre cubed per centimeter cubed
Cmax Maximum concentration
C0 Initial concentration of soil contaminant
CO2 Carbon Dioxide
CO Carbon Monoxide
COPC Chemicals of Potential Concern
CPM Controlled Pressure Method
CRC CARE Cooperative Research Centre for Contamination and Remediation of the
Environment

xxi
LIST OF ABBREVIATIONS, ACRONYMS AND SYMBOLS (CONTD.)
CSIRO Commonwealth Scientific and Industrial Research Organisation
CSM Conceptual Site Model
CVI Chemical Vapour Intrusion
C x t Concentration multiplied by time
dair Depth of the soil/atmosphere boundary layer air
GD
Volatile diffusivity in air
water
LD
Volatile diffusivity in water
Day-1 Per day
DCE Cis-1,2-dichloroethylene/trans-1,2-dichloroethylene
DEFRA Department for Environment, Food and Rural Affairs
deg Degrees
DER Department of Environmental Regulation
DHHS Department of Health and Human Services
DoD Department of Defence
DT Effective diffusion co-efficient
DTSC Department of Toxic Substances Control
DV Dependent Variable
E East
EC Equivalent Carbon
ECOS Environmental Council of the States
EDC Endocrine Disruptor
EEA European Environment Agency
EHRA Environmental health risk assessment
EPA Environment Protection Authority or Agency
Epi Epithelium
ERIS Environmental Research Institute of the States
ESCALE Etude Sur les Cancers et les Leucémies de l’Enfant
EU European Union
F2 A notation for twice the stimulation frequency
F5 Flux sampling location 5
foc Organic carbon fraction
Fout Flux monitoring location outside
FRC Functional Residual Capacity
FRLI Federal Register of Legislative Instruments
FUDS Formerly Used Defence Sites
g/100g Grams per hundred grams
g m-3 Grams per cubic metre
GC/ECD Gas chromatography/Electron Capture Detection
GC/FID Gas Chromatography/Flame Ionisation Detection
GC/MS Gas chromatography/Mass Spectrometry
HI Hazard Index
g/100g Grams per hundred grams
HIL Health Investigation Levels
HNF4a A transcription factor

xxii
LIST OF ABBREVIATIONS, ACRONYMS AND SYMBOLS (CONTD.)
HQ Hazard Quotient
I Average air exchange rate
IABR International Association for Breath Research
IARC International Agency for Research on Cancer
IAQ Indoor Air Quality
Indoor_Temp_0C Indoor temperature variable
IPCS International Programme on Chemical Safety
IRIS Integrated Risk Information System
ITRC Interstate Technology and Regulatory Council
J&E Johnson and Ettinger
JEM Johnson and Ettinger Model
JRC Joint Research Centre
KD Distribution coefficient
kg Kilogram
KH Henry’s Constant
KOC Organic carbon partition coefficient
L Depth (of contamination in modelling)
L Litre
LBW Low Birthweight
LEL Lower Explosive Limit
LME Linear Mixed Effects
lnC Natural logarithm of carbon dioxide concentration
Location Location variable (R1/1_IN to R5/5_IN)
LOR Limit of Reporting
m Metre
m2 Metre squared
m3 Metre cubed
m d-1 Metres per day
mBar Millibar
AHTA Massachusetts Department of Environmental Protection
MfE Ministry for the Environment
m g-1 Metre cubed per gram
m2 d-1 Metre squared per day
m3 g-1 Metre cubed per gram
m3 m-3 Metre cubed per metre cubed
mg m-3 Milligram per cubic metre
mg kg-1 d-1 Milligram per kilogram per day
ml Millilitre
mm Millimetre
ms Millisecond
m s-1 Metres per second
MTBE Methyl-t-butyl ether
N North
NASA National Aeronautical Space Administration

xxiii
LIST OF ABBREVIATIONS, ACRONYMS AND SYMBOLS (CONTD.)
NATA National Association of Testing Authorities
NE North-east
NEE North-east-east
NES National Exposure Standard
NEPC National Environment Protection Council
NEPM National Environment Protection Measure
ng nanogram
NIOSH National Institute of Occupational Safety and Health
NJDEP New Jersey Department of Environment Protection
NMDR Non-Monotonic Dose Response
NNE North-north-east
NNW North-north-west
NRC National Research Council
NSW New South Wales
NSW EPA New South Wales Environment Protection Authority
NSW DECCW New South Wales Department of Environment, Climate Change and Water
NT EPA Northern Territory Environment Protection Authority
NW North-west
NWW North-west-west
NYSDoH New York State Department of Health
O2 Oxygen
OECD Organisation for Economic Co-operation and Development
OEH Office of Environment and Heritage
OEH laboratory Occupational and Environmental Hygiene laboratory
OR Odds Ratio
OSWER Office of Solid Waste and Emergency Response
Outdoor_Temp_0C Outdoor temperature variable
PBPK Physiologically-Based Pharmaco-Kinetic
PCE Perchloroethylene also known as tetrachloroethylene
PID Photo-ionisation Detector
Po-214 Polonium-214 isotope
Po-218 Polonium 218 isotope
ppb Parts per billion
ppm Parts per million
PTFE Polytetrafluoroethylene
QCD Volumetric flow rate from subfloor to dwelling interior
QLD EPA Queensland Environment Protection Authority
R1 Radiello location 1 inside, same as 1_IN
R2 Radiello location 2 inside, same as 2_IN
R3 Radiello location 3 inside, same as 3_IN
R4 Radiello location 4 inside, same as 4_IN
R5 Radiello location 5 inside, same as 5_IN
Relative_Humidity Relative humidity variable
Resultc Passive sampling results corrected for outdoor concentrations
RfC Reference Concentration

xxiv
LIST OF ABBREVIATIONS, ACRONYMS AND SYMBOLS (CONTD.)
RfD Reference Dose
RAGS Risk Assessment Guidance for Superfund
RCRA Resource Conservation and Recovery Act
RG Partition coefficient
RI Response Index
RIVM Dutch National Institute for Public Health and the Environment
RR Rate ratio
RT Response Time
RT100 100ms increase in Response Time
s Second
S South
SA EPA South Australian Environmental Protection Authority
Sagittal Sagittal plane which divides the body into left and right
SAQP Sampling and Analysis Quality Plan
SE South-east
SGV Soil guideline values
SI Sensitivity Index
SI0.1 0.1 unit decrease in Sensitivity Index
Solar_radiation Solar radiation variable
SS3 Sub-slab location 3
SS4 Sub-slab location 4
SSE South-south-east
SSW South-south-west
STEL Short-Term Exposure Limit
Sub Submucosal tissue
SVQGIAQ Soil Vapour Quality Guidelines for Indoor Air Quality
SWW South-west-west
SV3-2m Soil vapour location 3 at 2m depth
SV3-7m Soil vapour location 3 at 7m depth
SV3-2m Soil vapour location 3 at 14m depth
t Time
t1 Time one
t2 Time two
TAS EPA Tasmanian Environment Protection Authority
TCA Trichloroethane
TCA Tolerable Concentration in Air
TCAA Trichloroacetic acid
TCE Trichloroethylene
TCOH Trichloroethanol
™ Trademark
TPH Total Petroleum Hydrocarbons
TPHCWG Total Petroleum Hydrocarbon Criteria Working Group
TRV Toxicological Reference Value
TWA Time-Weighted Average

xxv
LIST OF ABBREVIATIONS, ACRONYMS AND SYMBOLS (CONTD.)
UK United Kingdom
UPSS Underground Petroleum Storage Systems
US United States
USA United States of America
US DOD United States Department of Defence
US EPA United States Environmental Protection Agency
UST Underground Storage Tank B
LV
Volumetric soil water flux
VIF Variance Inflation Factor
VC Vinyl Chloride
VEP Visual Evoked Potential
VI Vapour Intrusion
Vic EPA Victorian Environment Protection Authority
VEP Visual Evoked Potentials
VOC Volatile Organic Compound
VT Effective solute velocity
W West
WA EPA West Australian Environment Protection Authority
WCA WorkCover Australia
WHO World Health Organisation
Wind_direction Wind direction variable
Wind_directionC Wind direction variable, by quadrant of 22.5o each (16 quadrants)
W m-2 Watts per square metre
X n-by-p fixed-effects design matrix
XCS Ventilation rate of subfloor space
XD Ventilation rate of dwelling interior
y n-by-1 response vector
Z n-by-q random-effects design matrix

xxvi
LIST OF APPENDICES
APPENDIX 1 PUBLISHED PAPERS ..................................................................................... 270
APPENDIX 2 PAPER BY TURCZYNOWICZ AND ROBINSON (2001)...................................... 271
APPENDIX 3 CASE STUDY 1 STATA® LOG FILE ................................................................ 272
APPENDIX 4 HOBO U30 STATION TECHNICAL DETAILS .................................................... 273
APPENDIX 5 RADIELLO® ANALYTICAL METHOD ............................................................ 274
APPENDIX 6 CASE STUDY 2A EXAMPLE DATA FILE ......................................................... 275
APPENDIX 7 SGS LEEDER CONSULTING LABORATORY REPORTS....................................... 276
APPENDIX 8 CASE STUDY 2A STATA® LOG FILES AND PLOTS .......................................... 277
APPENDIX 9 CASE STUDY 2B ETHICS APPROVAL AND FORMS .......................................... 278
APPENDIX 10 ENVIROLAB SERVICES BLOOD TCE ANALYTICAL METHOD ......................... 279
APPENDIX 11 BIOLOGICAL MONITORING REPORTS.......................................................... 280
APPENDIX 12 EXAMPLE OF BLOOD TCE CHROMATOGRAM .............................................. 281
APPENDIX 13 E-COPY OF THESIS AND DATA ON DISC ...................................................... 282
xxvii
THESIS OVERVIEW
The purpose of this overview is to provide a summary of the key elements of the
individual chapters of the thesis. The thesis has been structured in a traditional sense
with an introduction followed by a literature review, research questions, methodology,
empirical research findings, discussion, conclusions and recommendations. A case
study approach has been used, providing an increased understanding and direction for
the experimentation undertaken, based on the premise that time-dependence is a key
factor in understanding exposure assessment. This commenced with a preliminary
program investigating xylene application and site-specific evaluation of an Australian
non-steady-state vapour intrusion model in a suspended floor dwelling. This was
followed by a more detailed experiment from the knowledge gained which examined a
real-life setting where soil and groundwater TCE contamination had impacted a house
resulting in occupant evacuation. The empirical investigation included both
environmental and biological monitoring and produced information which can lead to
an indoor sampling protocol and a non-invasive biological monitoring method.
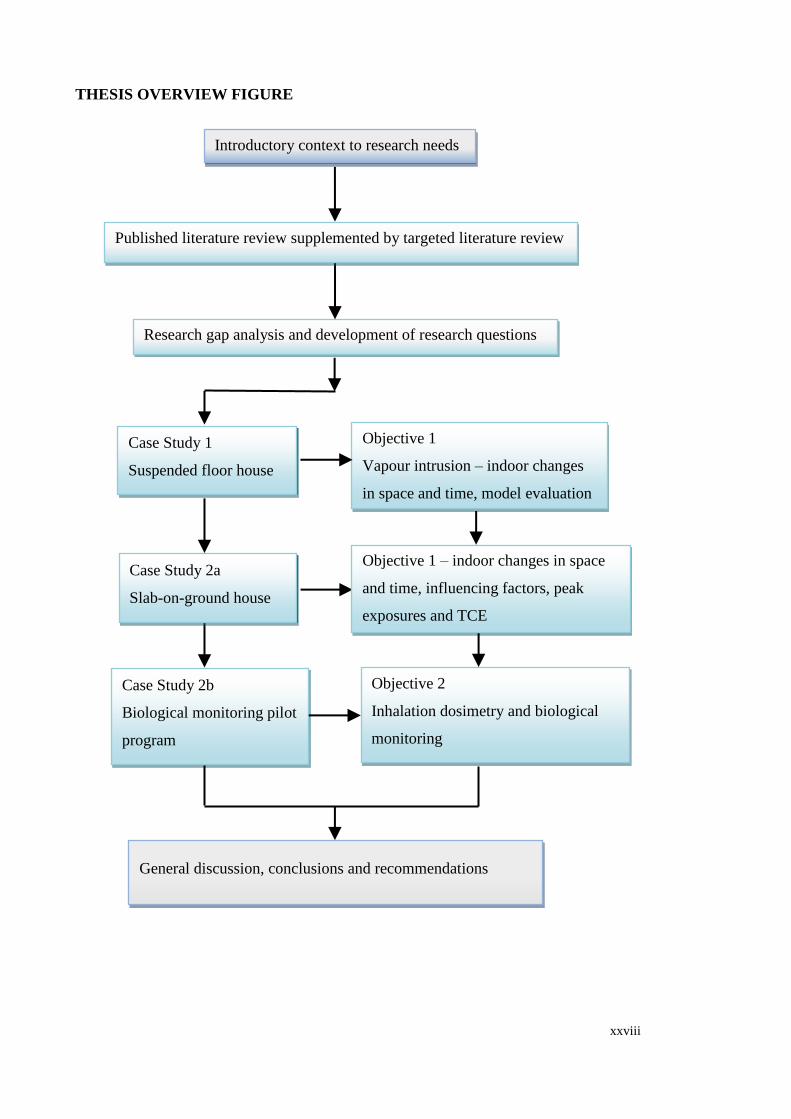
This thesis comprises six chapters, with a flow diagram of the structure presented in the
following figure and the content and key messages presented in the subsequent table.
xxviii
THESIS OVERVIEW FIGURE
Research gap analysis and development of research questions
Introductory context to research needs
Published literature review supplemented by targeted literature review
Objective 1
Vapour intrusion – indoor changes
in space and time, model evaluation
Objective 1 – indoor changes in space
and time, influencing factors, peak
exposures and TCE
Objective 2
Inhalation dosimetry and biological
monitoring
Case Study 1
Suspended floor house
Case Study 2b
Biological monitoring pilot
program
General discussion, conclusions and recommendations
Case Study 2a
Slab-on-ground house
xxix
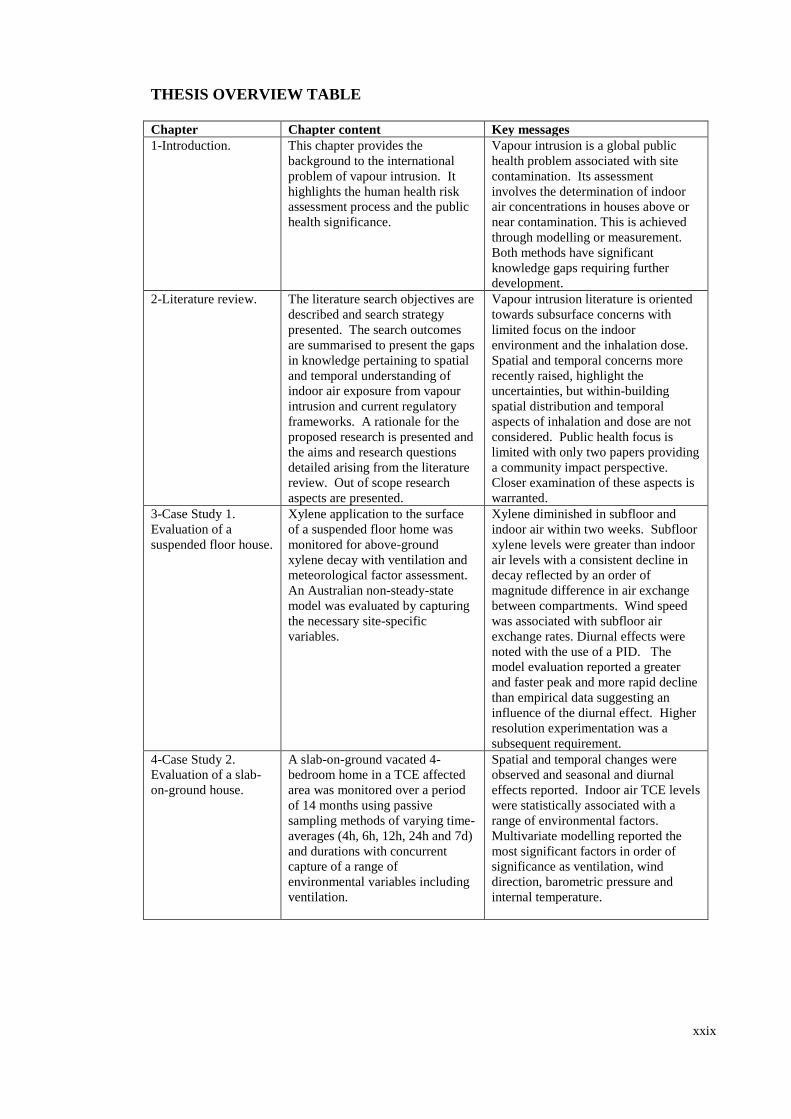
THESIS OVERVIEW TABLE
Chapter Chapter content Key messages
1-Introduction. This chapter provides the
background to the international
problem of vapour intrusion. It
highlights the human health risk
assessment process and the public
health significance.
Vapour intrusion is a global public
health problem associated with site
contamination. Its assessment
involves the determination of indoor
air concentrations in houses above or
near contamination. This is achieved
through modelling or measurement.
Both methods have significant
knowledge gaps requiring further
development.
2-Literature review. The literature search objectives are
described and search strategy
presented. The search outcomes
are summarised to present the gaps
in knowledge pertaining to spatial
and temporal understanding of
indoor air exposure from vapour
intrusion and current regulatory
frameworks. A rationale for the
proposed research is presented and
the aims and research questions
detailed arising from the literature
review. Out of scope research
aspects are presented.
Vapour intrusion literature is oriented
towards subsurface concerns with
limited focus on the indoor
environment and the inhalation dose.
Spatial and temporal concerns more
recently raised, highlight the
uncertainties, but within-building
spatial distribution and temporal
aspects of inhalation and dose are not
considered. Public health focus is
limited with only two papers providing
a community impact perspective.
Closer examination of these aspects is
warranted.
3-Case Study 1.
Evaluation of a
suspended floor house.
Xylene application to the surface
of a suspended floor home was
monitored for above-ground
xylene decay with ventilation and
meteorological factor assessment.
An Australian non-steady-state
model was evaluated by capturing
the necessary site-specific
variables.
Xylene diminished in subfloor and
indoor air within two weeks. Subfloor
xylene levels were greater than indoor
air levels with a consistent decline in
decay reflected by an order of
magnitude difference in air exchange
between compartments. Wind speed
was associated with subfloor air
exchange rates. Diurnal effects were
noted with the use of a PID. The
model evaluation reported a greater
and faster peak and more rapid decline
than empirical data suggesting an
influence of the diurnal effect. Higher
resolution experimentation was a
subsequent requirement.
4-Case Study 2.
Evaluation of a slab-
on-ground house.
A slab-on-ground vacated 4-
bedroom home in a TCE affected
area was monitored over a period
of 14 months using passive
sampling methods of varying time-
averages (4h, 6h, 12h, 24h and 7d)
and durations with concurrent
capture of a range of
environmental variables including
ventilation.
Spatial and temporal changes were
observed and seasonal and diurnal
effects reported. Indoor air TCE levels
were statistically associated with a
range of environmental factors.
Multivariate modelling reported the
most significant factors in order of
significance as ventilation, wind
direction, barometric pressure and
internal temperature.

xxx
Chapter Chapter content Key messages
4-Case Study 2. Evaluation
of a slab-on-ground house
(contd).
A short-term human exposure
study of 12 hours with biological
monitoring explored TCE in end-
exhaled breath, blood and urine in
five participants.
Biological monitoring showed
mixed results due to a decline in
the indoor air TCE concentrations
but composite end-exhaled breath
and indoor air averages showed
general consistency with
published f values. Blood TCE
concentrations were below the
LOR of 0.01µg/L but TCE peaks
were reported on chromatograms.
5-General discussion. The novelty and significance of the
research is highlighted and
findings discussed in the context of
international literature.
Generalisability is discussed and
the strengths and limitations
explored.
The public health focus has been
on exposure assessment hence the
assessment of within-building
spatial and temporal variability
was the key determinant not
considered elsewhere. The
qualitative and quantitative nature
of this evaluation enabled
statistical model development.
While the findings are supported
on the qualitative level the
literature is limited on the
quantitative level. For example,
the quantitative relationships of
the significant predictors for
indoor TCE concentrations and
the evidence of intermittent short-
term peak elevations in TCE
exposure. The latter potentially
being of consequence for a
substance exhibiting a non-
monotonic dose-response
relationship.
End-exhaled breath TCE sampling
and analysis show promise for
environmental biological
monitoring.
6-Conclusions and
Recommendations
Conclusions from the research
findings are presented with
recommendations for researchers,
government and industry.
The application of this knowledge
will improve confidence in
exposure assessment.
This enables development of an
evidence-based “worst case”
indoor air sampling framework
which is currently unavailable.
Recommendations include
extension research work with
further time-dependent data
capture over a year or longer; a
biological monitoring study using
end-exhaled breath with more
robust methods and a
retrospective epidemiological
study in TCE-affected areas of
Adelaide.

xxxi
General Research Questions
The following questions were developed from the literature review and include:
What spatial and temporal changes are associated with indoor inhalation exposures
arising from vapour intrusion and what factors may influence that change?
What inhalation dosimetry understanding is required and what methods of exposure
assessment for vapour intrusion need to be considered?
These questions comprise a series of sub-questions structured across three phases of
investigation:
• Critical literature review
• Case Study 1 – suspended floor dwelling
• Case Study 2 – slab-on-ground floor dwelling
Each of these sub-questions are raised at the start of each chapter and addressed at the
end of each chapter. They are detailed below.
Specific research sub-questions
Critical literature review
RQ1 How important is it to know the variance in spatial and temporal indoor air
concentrations for exposure assessment?
RQ2 How relevant is time-dependent vapour intrusion modelling and exposure
assessment to health risk assessment?
RQ3 What are the key elements in the current Australian and international regulatory
status on this issue?
In the case of a suspended floor dwelling design:
RQ4 How do subfloor and indoor air exchange rates impact on sub-floor and indoor
air concentrations?
RQ5 What are the implications associated with sub-floor housing design for vapour
intrusion?
RQ6 Is there a relationship between wind speed and air exchange rate?
RQ7 Is there a relationship between wind speed and temperature?
RQ8 Is there a relationship between wind speed and relative humidity?

xxxii
RQ9 Is there a difference between the local weather station readings and the Bureau
of Meteorology (BOM) station?
RQ10 How does temporality compare with the literature?
RQ11 What assessment protocols (time-averaged or continuous) proved most useful?
RQ12 Is the model output consistent with empirical observations?
RQ13 What were the trends in the empirical measurements of indoor air
concentrations?
RQ14 How do the measurements support non-steady-state vapour model
improvements?
RQ15 What were the key findings in Case Study1?
In the case of a slab-on-ground dwelling design:
RQ16 Are there any significant differences across indoor testing locations?
RQ17 Are there any differences across seasons?
RQ18 Are there any diurnal differences?
RQ19 Are short-term peak exposures observed?
RQ20 Are short-term peak exposures masked by longer-term average measurements?
RQ21 Which environmental factors were significantly associated with the indoor
concentrations?
RQ22 Which environmental factors had the greatest influence on indoor TCE
concentrations?
In terms of the biological monitoring pilot program:
RQ23 What are reported TCE concentrations in end-exhaled breath?
RQ24 What are TCE concentrations in blood samples?
RQ25 What indoor TCE concentrations are observed?
RQ26 Are TCE concentrations in end-exhaled breath and indoor air consistent with
published data?
RQ27 Is the use of end-exhaled breath as a biological marker for TCE exposure for an
environmental setting, a suitable method?
RQ28 What improvements are required to structure a feasible technique?


