
Speaker: Creties Jenkins, Rose and Associates Speech Title: “Appraising & Developing Your Unconventionals: How to Avoid Squandering Billions of Dollars Next Time” When: 03/09/2017 Where: Brookhaven College Geotechnology Institute 3939 Valley View Lane, Bldg H Farmer’s Branch, TX 75244 Luncheon starts: 11:30am Presentation Begins: 12:00pm Cost: $25 per person. Members and guests are cordially invited to attend. Please RSVP by Noon 03/08/2017 (This is important so we will have a correct lunch count) Link to RSVP and simultaneously pay by credit card: Insert Link here If the above link does not work, alternatively go to https://secure.spee.org/ then select ‘Local Chapters’, the ‘Dallas’, the ‘Click Here to Register’. Abstract: Over the past two years, more than 100 oil and gas companies in North America with almost $70B in debt have filed for bankruptcy. While these companies would like you to believe they were all victims of low commodity prices, many failed because of the way they approached appraising and developing opportunities. Two of the most common mistakes have been focusing on production attainment instead of value creation, and incorrectly thinking that enough was understood about a given reservoir to push ahead with development. To mitigate these errors, unconventional reservoirs need to be evaluated in a series of stages. In each stage, we need to (1) identify the key uncertainties and risks, (2) collect the data needed to quantify these, and (3) generate a probabilistic assessment of potential outcomes and their associated values. Only then can a good decision be made whether to advance to the next stage or exit. A key aspect in this evaluation is not only using rock and fluid data to identify the area with the greatest potential, but drilling enough wells to understand the production variance (irreducible uncertainty) in this area and whether the average well will be economic. This process requires discipline, including maintaining consistent drilling and completion practices so variations in reservoir quality can be understood. To help ensure this process is followed, an assurance procedure consisting of 1) guidelines and workflows, 2) peer reviews and assists, and 3) post-project lookbacks is critical and must be effectively implemented throughout the entire organization. The time to do this is NOW, before prices rise again and we revert to our old habits. Bio: Creties Jenkins (P.E., P.G.) is a Partner with Rose and Associates where he specializes in the characterization of unconventional reservoirs. Creties has carried out integrated studies, peer reviews, training, and resource assessment work for more than 50 companies around the world. He has also conducted more than 100 industry courses and workshops over the past decade focused on tight oil and gas reservoirs. Creties has served as a technical editor, distinguished lecturer, and distinguished author for SPE and is also a past president of the Energy Minerals Division of AAPG. He is a co-author of SPEE Monograph 4: Estimating Ultimate Recovery of Developed Wells in Low-Permeability Reservoirs and serves on the steering committee for the 2017 multi-disciplinary Summit: Building and Applying the Universal Workflow for Low Permeability Oil and Gas Reservoirs. Creties received a BSc in Geological Engineering and a MSc in Geology from the South Dakota School of Mines. Russell Romoser Secretary SPEE Dallas Chapter [email protected] 972-668-0862

Creties Jenkins & Mark McLaneRose and Associates
Appraising and Developing Your Mudrocks: How to Avoid Squandering Billions of Dollars Next Time
SPEE Dallas ChapterMarch 9, 2017

Development Value in Unconventional Plays
SPE 174925
• Period is from 2004-2013
• The 23 companies shown here acquired acreage in 30+ North American plays. • Only half of these companies delivered significant value.

U.S. Shale Plays
From the American Petroleum Institute, 2014
• What percentage of U.S. Shale Plays have been commercially developed?
Aneth (AZ)Antelope (CA)Aptian (MS)Atoka (OK)Brown Dense (AR-MS)Cane Creek (UT)Chainman (NV)Chimney Rock (UT)Collingwood (MI)Cumnock (NC)
Eaglebine (TX)Gothic (NM-CO)Hovenweep (UT)McLure (CA)Rhinestreet (PA)Skull Creek (WY)Waltman (WY)
WolfcampSpraberry

Capital at Risk
Stage 1:Exploration
Stage 2:Appraisal
Stage 3:Demonstration
Stage 4:Development
The Staged Approach
Exploration Success
Exploration Failure
Appraisal Success
Appraisal Failure
Demonstration Success
Demonstration Failure
Development Success
Development Failure
Exit
Exit
Exit
Exit
PDev
PDem
PA
PG

General Workflow
• Identify the stage the project is in
• Assess the key uncertainties and risks in that stage
• Define the data and analyses required to make a good decision whether to proceed to the next stage or exit
• Design a work plan, timeline and budget to acquire this information
Exploration
Appraisal
Demonstration
Development

Discovery Well (V)
Delineation Well (V)
Appraisal Well (H)
Development (Pads)
Demonstration (Pad)
Project Stages
Screening

Project Stage: ExplorationScreening
Exploration
Appraisal
Demonstration
Development
• Target basins with prospectivity and rank opportunities
• Apply criteria for identifying sweetspots
• Collect all existing relevant information– Cast a wide net and be resourceful – Look for data to fill-in the gaps – Evaluate the entire stratigraphic column
• Build maps and spatially composite them
• Identify potential analogs
• Determine chance of geologic success (Pg) for defined play segments

Spatial Compositing of Maps• Organic richness (TOC)• Thermal maturity (%Ro)• Structure/tectonics• Gross/net thickness• Lithofacies/mineralogy• Acoustic impedance • Geomechanical properties• Seeps/slicks • Surface geochemistry• Porosity/Permeability• Fluid saturations (Sg, So, Sw)• Evidence of overpressure• Overburden thickness• Seal thickness/rheology• Reservoir temperature• Paleogeography• Key wells• Acreage held/open• Restricted/inaccessible areas• Pipelines, other infrastructure
Play Segment

Project Stage: ExplorationDiscovery
Exploration
Appraisal
Demonstration
Development
• Locate a significant quantity of producible hydrocarbons that has the potential for commercial development
• Drill multiple wells if failure is local and not regional
• Determine how many targets to investigate
• Decide what data to gather
• Integrate newly-acquired and existing data
• Acquire open acreage, build land position
• Determine failure criteria & what outcomes trigger an exit
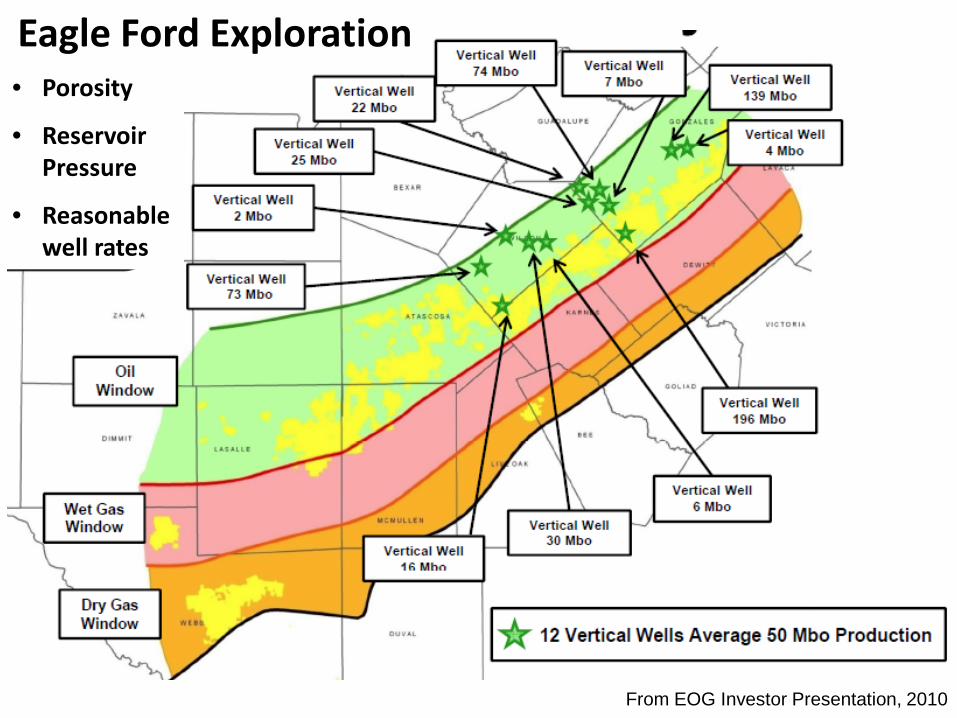
From EOG Investor Presentation, 2010
• Porosity
• Reservoir Pressure
• Reasonable well rates
Eagle Ford Exploration

Project Stage: ExplorationDelineation
Exploration
Appraisal
Demonstration
Development
• Validate materiality—that the potential is sufficient to justify further investment
• Show that successive wells are as good or better than the discovery well.
• Confirm thickness, lateral continuity, and internal character with 2D seismic, well data
• Demonstrate that wells can be fracced and produce fluids with desirable characteristics
• Determine well count needed to meet a defined percent confidence of achieving some minimum average well rate
• Determine failure criteria & what outcomes trigger an exit

From EOG Investor Presentation, 2010
• Vertical wells cored, logged and used for microseismic
• Vertical wells offset by horizontal wells for appraisal
Eagle Ford Delineation

Project Stage: Appraisal
Exploration
Appraisal
Demonstration
Development
• Validate the ability to drill, complete, and produce hydrocarbons from individual horizontal wells at a rate/decline above some predetermined threshold
• Use consistent drilling/completion practices
• Identify areas of greatest productivity--will become the sites for demonstration projects
• Obtain key reservoir data (rates, pressures) to help quantify performance variability
• Determine well count needed to meet a defined percent confidence of achieving an average well rate that exceeds the threshold
• Determine failure criteria & what outcomes trigger an exit

P10
P50
P90
Initial Rate (BOPD)
P10
P50
P90
10 100 1000Initial Rate (BOPD)
Prob
abili
ty
10 100 1000 10 100 1000
High-Grading with Appraisal Wells
0.700.650.60
0.55Area 1 Area 2
Area 3
50 miles
P10
P50
P90
Initial Rate (BOPD)
Rate Distribution Rate Distribution by Area Mean Values by Area
Pressure Gradient (psi/ft)
Threshold
Modified from Brad Berg’s 2013 SPE Distinguished Lecture Presentation
Mean Value

Examples of 5-Well Drilling ProgramsAssuming P90 = 80, P10 = 800, Pmean = 350 (threshold)
- 50
100 150 200 250 300 350 400 450
1 2 3 4 5 6 7 8 9 10
Wel
l IP
-stb
/d
Program Wells
Drilling Program RateWell IPAvg IPTarget IP
- 50
100 150 200 250 300 350 400 450
1 2 3 4 5 6 7 8 9 10
Wel
l IP
-stb
/d
Program Wells
Drilling Program RateWell IPAvg IPTarget IP
- 50
100 150 200 250 300 350 400 450 500
1 2 3 4 5 6 7 8 9 10
Wel
l IP
-stb
/d
Program Wells
Drilling Program RateWell IPAvg IPTarget IP
-
100
200
300
400
500
600
1 2 3 4 5 6 7 8 9 10
Wel
l IP
-stb
/d
Program Wells
Drilling Program RateWell IPAvg IPTarget IP

Confidence Curves
Confidence of Attaining an average rate of 350
BOPD by drilling 5 wells

Project Stage: Demonstration
Exploration
Appraisal
Demonstration
Development
• Validate that you have a commercially viable project above a prescribed confidence level
• May need multiple demonstration projects
• Determine the well count required to meet the prescribed confidence level
• Confirm type curve(s) and ensure that expected cost improvements are achievable
• Determine the well spacing that maximizes project value
• Use sequential aggregation plots to track performance vs forecast for major elements
• Determine failure criteria & what outcomes trigger an exit

Sequential Aggregation PlotShowing Best 3 Month Average Gas Rate for 31 Wells
Compared to Forecasts

Project Stage: Development
Exploration
Appraisal
Demonstration
Development
• Proceed if the expected results are competitive with other opportunities in your company’s portfolio
• As development drilling expands, ensure that results from new wells continue to meet expectations
• Use continuous learning and KPIs to reduce costs, optimize well spacing and maximize production & reserves
• Synchronize pad construction, well drilling, completion, fluid gathering and processing to maximize profitability

• Produced Volumes (9000 ft)• 6 wells: > 300 M bbls• 8 wells: 200-300 M bbls• 8 wells: 100-200 M bbls• 10 wells: 50-100 M bbls• 30 wells < 50 M bbls• P10/P90 ~ 15
Hereford Field AreaNiobrara Formation
Mean Cumulative OilPer Well ~ 115 M bbls Jake 2-01H
Elmer 8-31H
Red Poll 10-16H
191
197
198
200
269
220201
198
354 199
304368
346
355240
198
309
8086
114 77 39 128
28 36 42 31 26
77 28 87 109 25 59 27 42
80192
186 41
13 17
3140 15
39 85 2
23
28 29
21124
53 40 112
99 18 44
42
194 8
From Anderson et al, “A Short History of the “Jake” Niobrara Horizontal Oil Discovery…”, Mountain. Geologist, July 2015From P. Lawless, “Niobrara EUR Estimates for the Powder River and DJ Basins”, AAPG RMS-PS meeting, Oct 2016

Capital at Risk
Stage 1:Exploration
Stage 2:Appraisal
Stage 3:Demonstration
Stage 4:Development
Why is it so difficult to consistently implement this process?
The Staged Approach
Exploration Success
Exploration Failure
Appraisal Success
Appraisal Failure
Demonstration Success
Demonstration Failure
Development Success
Development Failure
Exit
Exit
Exit
Exit
PDev
PDem
PA
PG
Recover Cost
Commercial(PV > 0)
Portfolio Competitive

The Assurance Process
• Standards such as minimum economic metrics and project size
• Guidelines including use of the staged approach
• Workflows that are discipline specific and tied to the staged decision tree, sets of deliverables, and KPIs
• Peer assists conducted with an independent external prospective to help ensure projects are properly focused
• Documentation to create a record of what was planned, predicted, and actually achieved
• Lookbacks to calibrate the outcomes and make changes that result in closer correspondence between what’s promised and delivered in the future

Independent Risk &
Uncertainty Assessment
Appraisal Demonstration Development
Proj
ect
Team
Exec
utiv
eTe
amM
gmt
Team
Assu
ranc
eTe
am
Technical Assessment
Independent Risk &
Uncertainty Assessment
Post Develop. Assessment & Look Back
Project Selection and
Funding
Feedback to Technical
Teams
Feedback to Commercial &
Exec Teams
Technical Assessment &
Calibration
Independent Risk &
Uncertainty Assessment
Project Selection and
Funding
Y/N Y/N
The Role of the Assurance Team in a Staged Evaluation
Technical Assessment &
Calibration
Independent Risk &
Uncertainty Assessment
Exploration
Project Selection and
Funding
Implem
ent
Implem
ent
Technical Assessment &
Calibration
Y/N
Project Selection and
Funding
Implem
ent
Implem
ent
Y/N
Proposal Review & Approval
Proposal Review & Approval
Proposal Review & Approval
Proposal Review & Approval

Key Questions for Decision Makers to Ask
• What is the source of the numbers that justify the recommendation?
• Does the recommendation assume that an approach that is successful in one area will be just as successful in another?
• Is there an over-attachment to a history of past decisions or to a rare but memorable success?
• Is the base case too optimistic? Too pessimistic?
• Were there dissenting opinions leading up to the recommendation? How was this resolved?
• If we delay a decision on this project for one year, what data would you gather in the interim and what impact could this have?

A Concluding Thought
“If I had one wish, it is to see organizations dedicating some effort to study their own decision processes and their own mistakes, and keep track so as to learn from those mistakes.”
Daniel Kahneman – “Thought Leader” by Michael Scrage

Creties Jenkins & Mark McLaneRose and Associates
Appraising and Developing Your Mudrocks: How to Avoid Squandering Billions of Dollars Next Time
Thank You! Questions?
[email protected]@roseassoc.com


