
LUND UNIVERSITY
PO Box 117221 00 Lund+46 46-222 00 00
Specific autoantibody profiles and disease subgroups correlate with circulating micro-RNA in systemic sclerosis.
Wuttge, Dirk; Carlsen, Anting Liu; Teku, Gabriel; Steen, Samantha O; Wildt, Marie; Vihinen,Mauno; Hesselstrand, Roger; Heegaard, Niels H HPublished in:Rheumatology
DOI:10.1093/rheumatology/kev234
Published: 2015-01-01
Document VersionPeer reviewed version (aka post-print)
Link to publication
Citation for published version (APA):Wuttge, D., Carlsen, A. L., Teku, G., Steen, S. O., Wildt, M., Vihinen, M., ... Heegaard, N. H. H. (2015). Specificautoantibody profiles and disease subgroups correlate with circulating micro-RNA in systemic sclerosis.Rheumatology, 54(11), 2100-2107. DOI: 10.1093/rheumatology/kev234
General rightsCopyright and moral rights for the publications made accessible in the public portal are retained by the authorsand/or other copyright owners and it is a condition of accessing publications that users recognise and abide by thelegal requirements associated with these rights.
• Users may download and print one copy of any publication from the public portal for the purpose of privatestudy or research. • You may not further distribute the material or use it for any profit-making activity or commercial gain • You may freely distribute the URL identifying the publication in the public portal

Take down policyIf you believe that this document breaches copyright please contact us providing details, and we will removeaccess to the work immediately and investigate your claim.
Download date: 06. Sep. 2018

1
Published in: Rheumatology (2015) 54 (11): 2100-2107. doi: 10.1093/rheumatology/kev234 First published online: July 10, 2015
Specific autoantibody profiles and disease subgroups correlate with circulating
micro-RNA in systemic sclerosis
Dirk M. Wuttge1, Anting Liu Carlsen2, Gabriel Teku3, Samantha O. Steen2, Marie Wildt1,
Mauno Vihinen3, Roger Hesselstrand1 and Niels H. H. Heegaard2,4,5
1Section of Rheumatology, Department of Clinical Sciences, Lund University and Skåne
University Hospital, Lund, Sweden,
2Department of Autoimmunology & Biomarkers, Statens Serum Institut, Copenhagen S,
Denmark,
3Department of Experimental Medical Science, Protein Structure Bioinformatics, Lund
University, Lund, Sweden,
4Department of Clinical Biochemistry and Pharmacology, Odense University Hospital and
5Institute of Clinical Research, Clinical Biochemistry, University of Southern Denmark,
Odense, Denmark
Correspondence to: Dirk M. Wuttge, Section of Rheumatology, Department of Clinical
Sciences, Lund University and Skåne University Hospital, SE-221 85 Lund, Sweden. E-mail:
Key messages
SSc has a highly variable clinical presentation that may reflect different disease
entities.
Specific plasma miRNA profiles are present in the different SSc subtypes and
autoantibody groups.
Circulating micro-RNAs are epigenetic regulators that may be important for the
pathogenesis of SSc.

2
Abstract Objective. To evaluate the expression profiles of cell-free plasma miRNAs in SSc and to
characterize their correlation with disease subgroups (lcSSc and dcSSc) and with
autoantibody profiles.
Methods. Using quantitative RT-PCR, the abundance of 45 mature miRNAs in plasma was
determined in 95 patients (lcSSc = 63; dcSSc = 32), representing the following autoantibody
subgroups: ACA, anti-DNA topoisomerase I, anti-RNA polymerase III and anti-U1-
ribonucleoprotein. MiRNA data were correlated with clinical and paraclinical data. Multiple
regression was used to model membership of the lcSSc, dcSSc and autoantibody subgroups,
based on miRNA expression profiles.
Results. Thirty-six miRNAs were measurable in all samples. Four (miRNA-223, -181b, -342-
3p and -184) were differently expressed in lcSSc and dcSSc (false discovery rate < 0.05). Ten
miRNAs exhibited statistically significantly different levels in one or more autoantibody
groups, and five (miRNA-409, -184, -92a, -29a and -101) remained significant after
correction for multiple comparisons. Multiple regression models accurately predicted ACA
and anti-DNA topoisomerase I antibody–positive patients (area under the curve (AUC) = 0.97
and 0.93, respectively) as well as membership of the dcSSc and lcSSc groups (AUC = 0.88).
Conclusion. Circulating miRNA profiles differ between lcSSc and dcSSc patients and
between patients with different autoantibodies. This is the first time autoantibody profiles,
disease phenotypes and plasma miRNA profiles have been shown to correlate in an
autoimmune disease. The data support a pathobiological role of miRNAs because specific
miRNAs associate with autoantibody profiles of known diagnostic and prognostic value.
Key words
systemic sclerosis, scleroderma, micro-RNA, autoantibody, plasma

3
Introduction
SSc is a rare but serious autoimmune disease of unknown cause. It is characterized by
excessive fibrosis in connective tissues, vasculopathy and immunological anomalies such as
the occurrence of disease- and prognosis-associated circulating autoantibodies [1]. SSc is
heterogeneous in its presentation. Based on the extent of skin involvement, it is divided into
lcSSc and dcSSc [2]. Both groups are characterized by mutually exclusive autoantibody
profiles, with a preponderance of ACA in lcSSc and anti-DNA topoisomerase I (scl-70, ATA)
or anti-RNA polymerase III (ARA) autoantibodies in dcSSc patients. A subgroup of lcSSc has
anti-U1 ribonucleoprotein (RNP) autoantibodies. This antibody may indicate overlap with
other CTDs.
miRNAs are recently discovered post-transcriptional regulators of protein expression [3], and
miRNA may therefore provide disease diagnostic and activity markers [4]. In a Danish
cohort, we have previously shown that specific expression profiles of circulating miRNAs
associate with the SSc diagnosis compared with healthy controls and SLE patients [5].
However, SSc is a heterogeneous disease with a broad range of symptoms, disease severities
and outcomes. It is not yet known whether circulating plasma miRNAs vary between SSc
patients with different clinical phenotypes or between autoantibody-defined subgroups of
SSc.
In the present study, we therefore examined a Swedish cohort of SSc patients to explore
correlation of plasma miRNAs with phenotype and autoantibody profiles. Our hypothesis is
that patient subsets with different prognoses, for example, represented by different
autoantibody profiles, are characterized by specific miRNA profiles.
Previous SectionNext Section
Patients and methods
Patients
We included 95 SSc patients (82 women, 13 men) who received care at the Systemic
Sclerosis Unit, Department of Rheumatology, Skåne University Hospital in Lund, Sweden.
The patients were enrolled between 31 March 1989 and 1 January 2012. The clinical data are
shown in Table 1. The patients were chosen at random from the whole cohort in order to fulfil
the distribution of four groups (n = 20 each for ATA/ARA/RNP and n = 35 for ACA) defined

4
by the presence of specific autoantibodies that are relevant for SSc and regularly analysed in
our cohort. No patient had more than one type of autoantibody detected. The patients had a
median (interquartile range, IQR) age of 51 years [interquartile range (IQR) 43–63] and a
median disease duration of 20 months (IQR 10–37). All patients fulfilled the criteria of a
definitive diagnosis of SSc according to the ACR [6] or the 2013 classification criteria for
SSc [7]. Sixty-three patients (59 women, 4 men) had lcSSc, and 32 (23 women, 9 men)
fulfilled the criteria for dcSSc [2]. Twenty-five patients were on treatment with median 10 mg
(IQR 5–15) of prednisolone daily. Seven patients were on treatment with CYC. Three patients
received MMF. One patient each received penicillamine, MTX, AZA or HCQ. Four patients
with RNA polymerase III antibodies were on dialysis. The Regional Ethics Review Board
Lund, Sweden, approved the study (Dnr590/2008, Dnr2010/32), and written informed consent
was obtained from all patients according to the Declaration of Helsinki.
Clinical assessment
Clinical and routine paraclinical data were obtained under identical conditions and as close as
possible (usually within 1 week) to the blood sampling date as previously described [8,9]. The
modified Rodnan skin score was evaluated by standardized palpation of the skin [10].
Oesophageal involvement was defined as distal hypomotility on cine-radiography.
Radiological lung involvement was defined as basal interstitial fibrosis on plain chest X-ray
or high-resolution CT [9]. Lung function tests included assessment of vital capacity by dry
spirometry and diffusing capacity for carbon monoxide by single-breath test. Values are listed
as percentage of predicted (p%). Cardiac involvement was assessed by radiological
examination, 12-lead ECG and Doppler cardiography and defined as pericarditis, abnormal
ECG or cardiomegaly. Systolic pulmonary artery pressure of ≥40 mmHg by Doppler
cardiography was regarded as pathologically raised. Muscle involvement was defined as
proximal muscle weakness or serum creatinine kinase levels ≥3 times above the upper limit of
normal (3.3 µkat/l). Joint involvement was defined as palpable synovitis. Renal involvement
was defined as decreased glomerular filtration rate (GFR, <70% of predicted) either by
[51Cr]EDTA- and iohexol clearance [11] or calculated from serum cystatin C [12] or
creatinine levels.
Autoantibody analyses
Analysis for ANAs including ACAs was performed by indirect immunofluorescence using
HEp-2 or HEp-20-10 cells (Euroimmun, Lübeck, Germany). Autoantibodies against

5
extractable nuclear antigens, including DNA topoisomerase I (ATA), SS antigens SSA and
SSB, nuclear U1-RNP, Sm-antigen and Jo-1 were determined by immunoblotting
(Euroimmun) at the accredited local clinical immunology laboratory (University and Regional
Laboratories, Region Skåne, Lund, Sweden). ARA autoantibodies were determined by
immunoprecipitation (MVZ Laboratory, Professor Seelig, Karlsruhe, Germany).
Analysis of plasma miRNAs
Plasma samples were collected in EDTA-containing tubes and stored in aliquots at −70°C.
None of the plasma samples had visible haemolysis. Total RNA was purified, and a panel of
miRNAs was analysed after reverse transcription using stem–loop primers, pre-amplification
and quantitative RT-PCR (qRT-PCR) using specific assays from Applied Biosystems (Foster
City, CA, USA). For the qRT-PCR, a microfluidic platform from Fluidigm Corp (South San
Francisco, CA, USA) allowing duplicate assays for 48 miRNAs in 96 samples in one
operation was used [4]. The 48 miRNA assays included 45 human and 3 Caenorhabditis
elegans miRNAs (cel-miR-39, -54 and -238) (supplementary Table S1, available at
Rheumatology Online). The mixture of three synthetic cel-miRNAs was spiked into the lysis
buffer for use as technical normalization [4].
Data handling and statistical analyses
The demographic and paraclinical data were analysed for differences within patient groups
with STATISTICA v.12 (StatSoft, Tulsa, OK, USA). Data are depicted as median (IQR).
Pearson’s Chi-square test was used when applicable. Differences in frequencies between
groups were evaluated by Fisher’s exact test. For the qRT-PCR data average, quantitation
cycle (Cq) values >30 were removed from the dataset. The Cq values were then normalized
using levels of spike-in controls and row means as described [4] (supplementary data,
available at Rheumatology Online). The normalized miRNA Cq variables were used for
autoantibody group comparisons (Kruskal–Wallis with Dunn’s post-test for comparing
between the four antibody groups) and in univariate comparisons (Mann–Whitney), with P =
0.05 as the significance threshold using GraphPadPrism v. 5.0 (GraphPad Software Inc., San
Diego, CA, USA). Correction for multiple comparisons was achieved by the false discovery
rate method [13]. Heat maps were generated by Genesis, release 1.7.6 [14].
For further statistical analyses, data were converted to Z-scores (mean = 0, s.d. = 1) and
analysed in R, a statistical programming environment (http://www.r-project.org). All
variables and groups, as well as residuals in multiple linear regression analyses, were
6
analysed for normal distribution and tested by the Shapiro–Wilk test. W-values >0.93 were
accepted as normally distributed. Regression analyses were performed with the exclusion of
data from 17 patients who were either on dialysis or had treatment other than prednisolone,
leaving n = 78 patients for the analyses. The miRNA expression profiles that were associated
with the two SSc disease subgroups and the four autoantibody groups (dependent variables)
were used for modelling, based on logistic regression. We assessed multicollinearity
(variables that do not significantly contribute further to the model fit) by variance inflation
factor analysis. Variables with variance inflation factor >10 were eliminated from further
analysis. Finally, the remaining explanatory variables were used to build and analyse the
logistic regression models. We applied the mean difference in miRNA expression for each of
the clinical phenotypes and autoantibody groups as a means of removing uninformative
miRNA expression profiles from our model and of identifying interesting miRNAs to be used
for our model. We included independent variables that had a P-value of 0.5 when regressed,
individually, with the dependent variable (variable to be predicted) in the model, leading to a
broader miRNA expression panel than the univariate analysis.
Results
Circulating miRNAs and patient set-up
For this study, a Swedish cohort of 95 patients with SSc was employed. The demographic
data are depicted in Table 1. A total of 45 mature miRNAs were chosen for analysis, based on
previous studies and reports of circulating miRNAs in SSc and SLE patients [4,5,15]. Based
on the criterion that the miRNA should be detectable in every one of the 95 samples, 36 of
these miRNAs were included in the final data analysis. The normalized miRNA expression
levels were scrutinized for associations with sample age, since a possible link between
miRNA expression level and sample age had been suggested in our previous study [5]. No
statistically significant associations between miRNA expression level and sample age,
however, were detectable in the present cohort. The normalized miRNA data were analysed
for associations with SSc disease phenotype and autoantibody groups. In a second step, data
analyses relating miRNA expression to organ involvement as well as logistic regression
analysis were performed on 78 patients without DMARD or dialysis treatment. We reasoned
that miRNA levels in DMARD-naive individuals would mirror disease-related conditions in a
more straightforward way. Initial enquiries did not show any significant effect of

7
prednisolone on miRNA expression. Patients on concomitant prednisolone treatment were
therefore admitted to the logistic regression analysis.
miRNA profiles and disease phenotype
Six miRNAs were significantly different between the lcSSc and dcSSc groups in the
univariate analysis (Fig. 1). Four of these miRNAs (miR-223, -181b, -342-3p and -184)
remained significant after correcting for multiple comparisons (false discovery rate <0.05)
(Table 2). MiR-101, -184 and -223 were differentially expressed in analysis of both the
clinical phenotype and the antibody subgroups (see below).
miRNA expression levels in SSc subgroups
The expression level of miRNAs varies between the SSc subgroups (lcSSc and dcSSc). The
values of six miRNAs that differed significantly between the groups in univariate tests
(Mann–Whitney U-test) are depicted for the total cohort of 95 samples. Univariate P-values
are included in the figure.
Differences in plasma miRNA expression in patients with SSc (n = 95)a
Logistic regression and receiver operating characteristic (ROC) curve analyses showed an
area under the curve (AUC) of 0.88 (95% CI 0.87, 0.96) for the SSc disease phenotype,
indicating a good predictive power for dcSSc vs lcSSc (based on miR-29b, -101, -106a, -
181b, -184, -223, -342-3p and -409-3p; supplementary Table S2).
miRNA profiles and autoantibodies
A principal components analysis based on the 36 miRNAs and the 95 samples did not reveal
grouping according to the autoantibody groups (data not shown). However, by hierarchical
clustering we observed grouping of more than half (19/35) of the ACA-positive patients
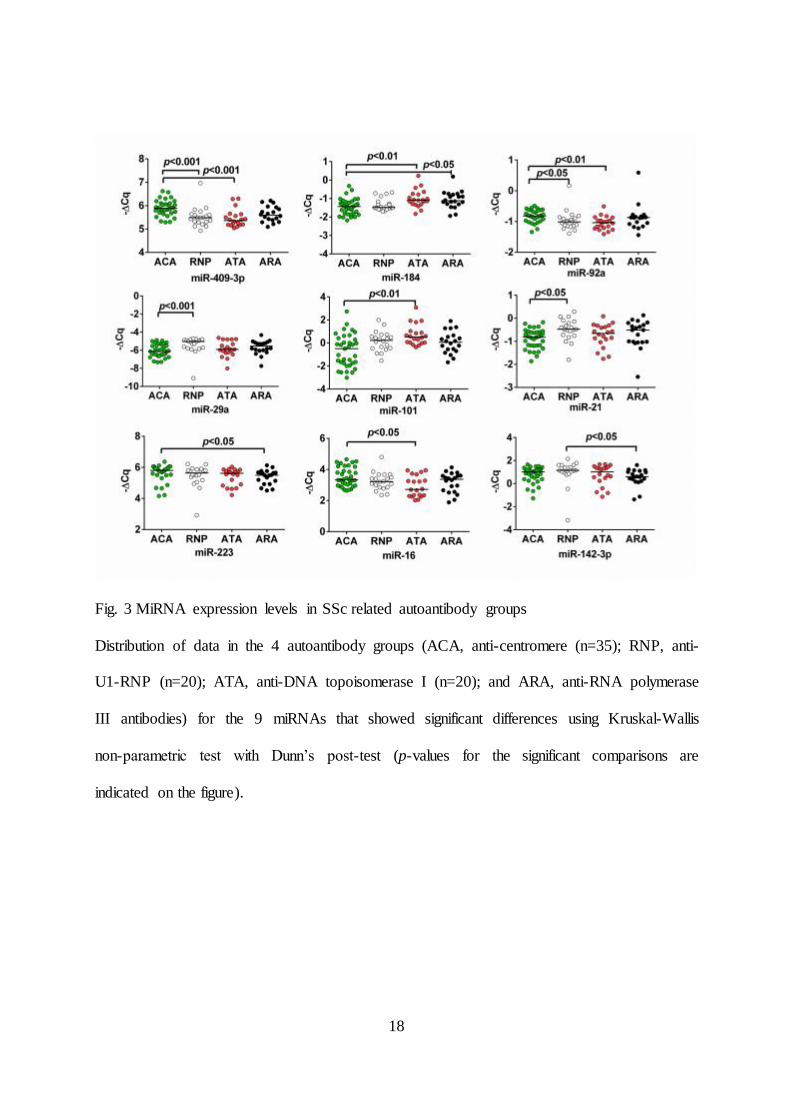
according to their miRNA expression pattern (Fig. 2). Also, 11 miRNAs were differently
expressed between the antibody groups (Table 2). Nine of these 11 miRNAs showed
significant differential expression using Dunn’s post-test to compare pairs of groups (Table
2Fig. 3) and 5 miRNAs (miR-409-3p, -184, -92a, -29a and -101) remained significantly
differently expressed after adjusting for multiple comparisons (Table 2).
Autoantibody and miRNA levels show correlations. Heat map (unsupervised hierarchical
clustering after Z-score transformation of data) of samples (horizontal axis, ACA samples are
highlighted in a box) and the distribution of expression levels of 36 miRNAs (vertical axis).
8
Distribution of data in the four autoantibody groups (ACA (n = 35); RNP, anti-U1-RNP (n =
20); ATA, anti-DNA topoisomerase I (n = 20); and ARA, anti-RNA polymerase III
antibodies) for the nine miRNAs that showed significant differences using the Kruskal–Wallis
non-parametric test with Dunn’s post-test (P-values for the significant comparisons are
indicated on the figure).
Logistic regression and ROC curve analyses resulted in an AUC of 0.97 (95% CI 0.94, 0.99)
for the ACA group (based on let-7c, miR-16, -21, -29a, -92a, -101, -184, -223 and -409-3p)
and of 0.93 (95% CI 0.86, 0.99) for the ATA group (based on miR-16, -92a, -101, -155, -184
and -409-3p), suggesting high predictive power of circulating miRNA levels. AUCs were
weaker for the RNP group (AUCRNP = 0.79, 95% CI 0.67, 0.90; based on miR-29a, -29c-3p,
-92, 409-3p and 423-5p) and the ARA group (AUCARA = 0.68, 95% CI 0.55, 0.81; based on
miR-184 and 342-3p), (supplementary Table S3, available at Rheumatology Online). In
addition, reanalysis of the logistic regression calculations for all 95 patients with regard to
either clinical phenotype or autoantibody group also resulted in the miRNA combinations
shown above in connection with the AUC values.
miRNA and organ involvement
We tested whether organ involvement would be associated with specific miRNA profiles in
DMARD-naive patients. Univariate analysis showed an association of increased miR-101 and
decreased miR-92a levels with pulmonary fibrosis (P = 0.01 and 0.027, respectively).
However, none of the associations remained significant after adjustment for multiple
comparisons.
Discussion
Our study shows that miRNAs are differentially expressed between lcSSc and dcSSc
subgroups and that the presence of specific autoantibodies is accompanied by the occurrence
of particular miRNA profiles. The major findings are summarized in Fig. 4.
SSc is recognized to be a heterogeneous disease, and the notion has been put forward that SSc
possibly consists of distinct disease entities [16]. In agreement with this, our results show that

9
the levels of specific circulating miRNAs clearly differ between the clinical phenotypes and
autoantibody groups, as confirmed by a number of statistical methods. In particular, patients
with ACA stand out. Half of the ACA-positive patients were grouped together in the cluster
analysis. ROC analysis showed a high predictive value for ACA patients, suggesting a robust
miRNA expression profile in relation to the presence of ACAs. In addition, ROC analysis
showed good predictive values for patients with ATA and for the disease phenotypes. Specific
miRNA profiles are therefore suggested to mirror the grouping of patients according to these
classifications. Further, correlation analyses showed clear miRNA co-expression patterns
beyond antibody grouping. This suggests that patients may also be linked at a molecular level
through their circulating miRNA profiles in addition to their clinical phenotypes and
autoantibody profiles.
MiR-409-3p expression levels are increased in ACA, compared with the other three
autoantibody groups. We have previously shown that miR-409-3p levels were higher in
another cohort of SSc patients (of which 41% were ACA positive) vs normal controls [5].
Thus, the combined information suggests an increase of this miR-409-3p in lcSSc. However,
it is not possible to determine the absolute levels of specific miRNAs in comparison with
healthy controls in the present study because healthy controls were not included. Also, there is
no interstudy standardization and no standard curves included in the miRNA assays, and the
row mean normalization is based on different sets of miRNAs in the two studies. No data are
yet available on the biological effect of miR-409-3p with regard to pathogenesis in SSc.
MiR-184 expression levels were higher in dcSSc and in the autoantibody groups ATA and
ARA. Proinflammatory cytokines such as IL-22 induce keratinocytic miR-184 expression
(which in turn inhibits argonaute-2, a protein that is important for mRNA repression by
miRNAs) and thus potentially lead to increased protein expression [17]. So far, however, no
data can be found on miR-184 with regard to fibrosis development or angiogenesis in general
and to SSc in particular.
MiR-92a levels were lower in patients with ATA and RNP compared with the ACA and ARA
groups. Patients with ATA and RNP have an increased risk of developing pulmonary fibrosis
compared with patients with ACA and ARA. Indeed, the presence of ACA predicts an
absence of pulmonary fibrosis [18]. Interestingly, miR-92a was decreased in patients with
pulmonary fibrosis. Even though the association was not significant when adjusted for
multiple comparison, low miR-92a levels may be associated with pulmonary fibrosis, as our

10
inclusion criteria of visible fibrosis on high-resolution CT was not adjusted for the extent of
fibrosis. Patients with mild fibrosis may dilute the analysis. MiR-92a is downregulated in lung
tissue of patients with idiopathic pulmonary fibrosis [19]. Hypothetically, low miR-92 levels
could therefore play a part in the development of pulmonary fibrosis in patients with ATA
and RNP. In our previous study, miR-92a levels in plasma were decreased in SSc compared
with healthy controls [5], whereas, in contrast, one other previous study presented increased
miR-92a levels in sera of SSc patients [20].
A limitation of this explorative study is the cross-sectional design. Data should therefore be
interpreted with some caution until future verification in validation cohorts. A second
limitation is the comparatively small number of patients analysed for miRNA expression.
However, the cohort is well characterized and includes analysis of 78 patients without
DMARD treatment. Expression of miRNAs in this group should therefore reflect disease
pathogenesis.
Conclusion
To the best of our knowledge, this is the first study to link expression levels of specific
circulating plasma miRNAs to clinical phenotypes and autoantibody profiles in SSc.
Circulating miRNAs may be involved in the pathogenesis and manifestations of the various
SSc subtypes.
Funding
This study was supported by The Danish Rheumatism Association (grants R99-A1937 and
R97-A1028) and by the Apotekare Hedbergs fund; the Crafoord foundation; the Greta and
Johan Kock foundation; the Alfred Österlund foundation; King Gustaf V's 80th Birthday
Fund; the Donation fund at the Department of Rheumatology, Lund University Hospital,
Sweden; the Swedish Heart and Lung Foundation; the Medical Faculty of the University of
Lund, Sweden and the Swedish Rheumatism Association.
Disclosure statement
The authors have declared no conflicts of interest.

11
References
1 Hesselstrand R, Scheja A, Shen GQ, Wiik A, Akesson A. The association of
antinuclear antibodies with organ involvement and survival in systemic sclerosis.
Rheumatology (Oxford) 2003;42(4):534-40.
2 LeRoy EC, Black C, Fleischmajer R, et al. Scleroderma (systemic sclerosis):
classification, subsets and pathogenesis. J Rheumatol 1988;15(2):202-5.
3 Tili E, Michaille JJ, Costinean S, Croce CM. MicroRNAs, the immune system
and rheumatic disease. Nature clinical practice. Rheumatology 2008;4(10):534-41.
4 Carlsen AL, Schetter AJ, Nielsen CT, et al. Circulating microRNA expression
profiles associated with systemic lupus erythematosus. Arthritis Rheum 2013;65(5):1324-34.
5 Steen SO, Iversen LV, Carlsen AL, et al. The Circulating Cell-free microRNA
Profile in Systemic Sclerosis Is Distinct from Both Healthy Controls and Systemic Lupus
Erythematosus. J Rheumatol 2014.
6 Masi AT. Preliminary criteria for the classification of systemic sclerosis
(scleroderma). Subcommittee for scleroderma criteria of the American Rheumatism
Association Diagnostic and Therapeutic Criteria Committee. Arthritis Rheum
1980;23(5):581-90.
7 van den Hoogen F, Khanna D, Fransen J, et al. 2013 classification criteria for
systemic sclerosis: an American college of rheumatology/European league against
rheumatism collaborative initiative. Ann Rheum Dis 2013;72(11):1747-55.
8 Wuttge DM, Wildt M, Geborek P, Wollheim FA, Scheja A, Akesson A. Serum
IL-15 in patients with early systemic sclerosis: a potential novel marker of lung disease.
Arthritis Res Ther 2007;9(5):R85.
9 Wuttge DM, Bozovic G, Hesselstrand R, et al. Increased alveolar nitric oxide in
early systemic sclerosis. Clin Exp Rheumatol 2010;28(5 Suppl 62):S5-9.
10 Clements PJ, Lachenbruch PA, Seibold JR, et al. Skin thickness score in
systemic sclerosis: an assessment of interobserver variability in 3 independent studies. J
Rheumatol 1993;20(11):1892-6.
11 Krutzen E, Back SE, Nilsson-Ehle I, Nilsson-Ehle P. Plasma clearance of a new
contrast agent, iohexol: a method for the assessment of glomerular filtration rate. J Lab Clin
Med 1984;104(6):955-61.
12 Grubb A, Nyman U, Bjork J, et al. Simple cystatin C-based prediction equations
for glomerular filtration rate compared with the modification of diet in renal disease

12
prediction equation for adults and the Schwartz and the Counahan-Barratt prediction
equations for children. Clin Chem 2005;51(8):1420-31.
13 Benjamini Y, Hochberg Y. Controlling the false discovery rate: A practical and
powerful approach to multiple testing. J R Statist Soc, Ser B 1995;57:289-300.
14 Sturn A, Quackenbush J, Trajanoski Z. Genesis: cluster analysis of microarray
data. Bioinformatics 2002;18(1):207-8.
15 Maurer B, Stanczyk J, Jungel A, et al. MicroRNA-29, a key regulator of
collagen expression in systemic sclerosis. Arthritis Rheum 2010;62(6):1733-43.
16 Steen VD, Powell DL, Medsger TA, Jr. Clinical correlations and prognosis
based on serum autoantibodies in patients with systemic sclerosis. Arthritis Rheum
1988;31(2):196-203.
17 Weng C, Dong H, Chen G, et al. miR-409-3p inhibits HT1080 cell proliferation,
vascularization and metastasis by targeting angiogenin. Cancer letters 2012;323(2):171-9.
18 Roberts JC, Warren RB, Griffiths CE, Ross K. Expression of microRNA-184 in
keratinocytes represses argonaute 2. Journal of cellular physiology 2013;228(12):2314-23.
19 Moinzadeh P, Nihtyanova SI, Howell K, Ong VH, Denton CP. Impact of
hallmark autoantibody reactivity on early diagnosis in scleroderma. Clinical reviews in
allergy & immunology 2012;43(3):249-55.
20 Berschneider B, Ellwanger DC, Baarsma HA, et al. miR-92a regulates TGF-
beta1-induced WISP1 expression in pulmonary fibrosis. Int J Biochem Cell Biol
2014;53:432-41.
21 Sing T, Jinnin M, Yamane K, et al. microRNA-92a expression in the sera and
dermal fibroblasts increases in patients with scleroderma. Rheumatology (Oxford)
2012;51(9):1550-6.

13
Table 1 Demographic characteristics of the patients with systemic sclerosis grouped according to antibody specificities§
ACA (n = 35) RNP (n = 20) ATA (n = 20) ARA (n = 20)
Female/male, no. (%) 33/2 (94/6) 18/2 (90/10) 15/5 (75/25) 16/4 (80/20)
Age at blood sampling, year 54 (45 to 63) 44 (38 to 52) 52 (33 to 65) 53 (45 to 68) Disease duration, month, ** 30 (20 to 39) 12 (7.5 to 26) 20 (12 to 51) 13 (8 to 22)
Raynauds duration, month, ** 64 (27 to 128) 38 (15 to 130) 32 (12 to 63) 17 (6 to 48)
mRss, points,*** 5 (3 to 9) 5 (3 to 6.5) 17 (14 to 29) 23 (13 to 31)
dcSSc/lcSSc, c 0/35 (0/100) 1/19 (5/95) 16/4 (80/20) 15/5 (75/25) Esophagus 27 (77) 15 (75) 17 (85) 12 (60)
Pulmonary fibrosis, a 13 (37) 12 (60) 15 (75) 6 (30) Pulmonary hypertension 3 (9) 4 (20) 4 (20) 1 (5) Heart 11 (31) 9 (45) 7 (35) 13 (65)
Kidney 7 (20) 2 (10) 3 (15) 6 (30) Muscle, c 5 (14) 10 (50) 1 (5) 2 (10)
Joint 9 (26) 6 (30) 2 (10) 3 (15)
Hemoglobin, g/L, ** 135 (125 to 145) 124 (118 to 131) 125 (113 to 133) 119 (111 to 136)
Leukocytes, x109/L, *** 7.2 (5.9 to 8.8) 5 (4.1 to 5.8) 7.3 (6.3 to 9) 7.4 (6.3 to 8) Platelets, x109/L, * 284 (228 to 331) 255 (228 to 279) 282 (257 to 352) 303 (251 to 349)
ESR, mm/h 12 (7 to 22) 22 (18 to 32) 19 (12 to 24) 17 (11 to 40) ANA positive 35 (100) 20 (100) 20 (100) 18 (90)
Prednisolone, a 7 (20) 10 (50) 3 (15) 5 (25) DMARD, b 1 (3) 8 (40) 3 (15) 3 (15)
Dialysis, b 0 (0) 0 (0) 0 (0) 4 (20) § Data are shown as median (inter quartile range; IQR) or as number (percent; %). ACA = anti-centromer antibodies; ANA = anti-nuclear
antibodies; ARA = anti-RNA polymerase III antibodies; ATA = anti-DNA topoisomerase 1 antibodies, dcSSc = diffuse cutaneuos SSc; DMARD
14
= disease modifying anti rheumatic drug; ESR = erythrocyte sedimentation rate; lcSSc = limited cutaneous SSc; IgG = immunoglobulin G; mRss
= modified Rodnan skin score; Pearson Chi-square: a P < 0.05, b P < 0.01, c P < 0.001; Kruskal Wallis: * P < 0.05, ** P < 0.01, *** P < 0.001

15
Table 2 Differences in plasma miRNA expression in patients with systemic sclerosis (n = 95)§
dcSSc vs. lcSSc p-value FDR (direction of change (Fold Change))
miR-223 0.0014 0.028 ↓ (0.82)
miR-181b 0.0026 0.028 ↑ (1.45)
miR-342-3p 0.0026 0.028 ↓ (0.59)
miR-184 0.0031 0.028 ↑ (1.24)
miR-101 0.0373 0.226 ↑ (1.54)
miR-106a 0.0376 0.226 ↓ (0.86)
Autoantibody-group p-value FDR (p-value, direction of change)
miR-409-3p <0.0001 0.0018 (<0.001, ACA↑ vs. ATA&RNP)
miR-184 0.0006 0.0072 (<0.05, ACA↓ vs. ATA&ARA)
miR-92a 0.0006 0.0072 (<0.05, ACA↑ vs. RNP&ATA)
miR-29a 0.0021 0.0173 (<0.001, ACA↓ vs. RNP)
miR-101 0.0024 0.0173 (<0.01, ACA↓ vs. ATA)
miR-21 0.0148 0.0888 (<0.05, ACA↓ vs. RNP)
miR-223 0.0229 0.0992 (<0.05, ACA↑ vs. ARA)
miR-16 0.0240 0.0992 (<0.05, ACA↑ vs. ATA)
miR-155 0.0248 0.0992 (NS)
miR-142-3p 0.0383 0.1379 (<0.05, RNP↑ vs. ARA)
let-7c 0.0439 0.1437 (NS)
§ Data were analyzed with Mann Whitney U test (lcSSc/dcSSc) or with Kruskal-Wallis test
(autoantibody groups). The p-values were adjusted for multiple comparisons using false-
discovery rate (FRD). For the four autoantibody groups Dunn's post test was used to estimate
the p-values in parentheses for each miRNA experiment. The miRNAs in bold represent
miRNAs that display unadjusted significant differences in both the lcSSc/dcSSc and the
antibody subgroups. The p-values in bold are significant after FDR adjustment. NS = not
significant.

16
Fig. 1 MiRNA expression levels in SSc subgroups
The expression level of miRNAs varies between the SSc subgroups (lcSSc and dcSSc). The
values of six miRNAs that were significantly different between the groups in univariate tests
(Mann Whitney U-test) are depicted for the total cohort of 95 samples. Univariate p-values
are included in the figure.

17
Fig. 2 Cluster analysis according to miRNA expression and autoantibody status
Autoantibody and miRNA levels show correlations. Heat map (unsupervised hierarchical clustering after Z-score transformation of data) of
samples (horizontal axis, ACA samples are highlighted ) and the distribution of expression levels of 36 miRNAs (vertical axis).
18
Fig. 3 MiRNA expression levels in SSc related autoantibody groups
Distribution of data in the 4 autoantibody groups (ACA, anti-centromere (n=35); RNP, anti-
U1-RNP (n=20); ATA, anti-DNA topoisomerase I (n=20); and ARA, anti-RNA polymerase
III antibodies) for the 9 miRNAs that showed significant differences using Kruskal-Wallis
non-parametric test with Dunn’s post-test (p-values for the significant comparisons are
indicated on the figure).

19
Fig. 4 Summary of plasma miRNA expression in SSc
The figure summarizes relations between microRNAs and antibody subgroups and disease
phenotypes that were identified in this study.

20
SUPPLEMENTARY DATA 1
Supplementary Table S1. miRNAs and primers
Assay Name Assay ID miRBase ID Mature miRNA sequence
hsa-let-7a-5p 000377 hsa-let-7a-5p UGAGGUAGUAGGUUGUAUAGUU
hsa-let-7c 000379 hsa-let-7c UGAGGUAGUAGGUUGUAUGGUU
hsa-let-7d 002283 hsa-let-7d-5p AGAGGUAGUAGGUUGCAUAGUU
hsa-miR-15a 000389 hsa-miR-15a UAGCAGCACAUAAUGGUUUGUG
hsa-miR-16 000391 hsa-miR-16 UAGCAGCACGUAAAUAUUGGCG
hsa-miR-17 002308 hsa-miR-17-5p CAAAGUGCUUACAGUGCAGGUAG
hsa-miR-20a 000580 hsa-miR-20a UAAAGUGCUUAUAGUGCAGGUAG
hsa-miR-21 000397 hsa-miR-21 UAGCUUAUCAGACUGAUGUUGA
hsa-miR-24 000402 hsa-miR-24 UGGCUCAGUUCAGCAGGAACAG
hsa-miR-27a-3p 000408 hsa-miR-27a-3p UUCACAGUGGCUAAGUUCCGC
hsa-miR-29a 002112 hsa-miR-29a UAGCACCAUCUGAAAUCGGUUA
hsa-miR-29b-3p 000413 hsa-miR-29b-3p UAGCACCAUUUGAAAUCAGUGUU
hsa-miR-29c-3p 000587 hsa-miR-29c-3p UAGCACCAUUUGAAAUCGGUUA
hsa-miR-34a 000426 hsa-miR-34a UGGCAGUGUCUUAGCUGGUUGU
hsa-miR-92a 000431 hsa-miR-92a UAUUGCACUUGUCCCGGCCUGU
hsa-miR-101 002253 hsa-miR-101 UACAGUACUGUGAUAACUGAA
hsa-miR-106a 002169 hsa-miR-106a AAAAGUGCUUACAGUGCAGGUAG
hsa-miR-122-5p 002245 hsa-miR-122-5p UGGAGUGUGACAAUGGUGUUUG
hsa-miR-125b 000449 hsa-miR-125b UCCCUGAGACCCUAACUUGUGA
hsa-miR-132 000457 hsa-miR-132-3p UAACAGUCUACAGCCAUGGUCG
hsa-miR-142-3p 000464 hsa-miR-142-3p UGUAGUGUUUCCUACUUUAUGGA
hsa-miR-145-5p 002278 hsa-miR-145-5p GUCCAGUUUUCCCAGGAAUCCCU
hsa-miR-146a 000468 hsa-miR-146a UGAGAACUGAAUUCCAUGGGUU
hsa-miR-146b 001097 hsa-miR-146b-5p UGAGAACUGAAUUCCAUAGGCU
21
hsa-miR-150 000473 hsa-miR-150 UCUCCCAACCCUUGUACCAGUG
Supplementary Table S1 (continued). miRNAs and primers
Assay Name Assay ID miRBase ID Mature miRNA sequence
hsa-miR-154 000477 hsa-miR-154-5p UAGGUUAUCCGUGUUGCCUUCG
hsa-miR-155 002623 hsa-miR-155 UUAAUGCUAAUCGUGAUAGGGGU
hsa-miR-199a 000498 hsa-miR-199a-5p CCCAGUGUUCAGACUACCUGUUC
hsa-miR-181b 001098 dre-miR-181b AACAUUCAUUGCUGUCGGUGGG
hsa-miR-184 000485 hsa-miR-184 UGGACGGAGAACUGAUAAGGGU
hsa-miR-192-5p 000491 hsa-miR-192-5p CUGACCUAUGAAUUGACAGCC
hsa-miR-196a 247010_mat hsa-miR-196a UAGGUAGUUUCAUGUUGUUGGG
hsa-miR-200a 000502 hsa-miR-200a-3p UAACACUGUCUGGUAACGAUGU
hsa-miR-200b 002251 hsa-miR-200b-3p UAAUACUGCCUGGUAAUGAUGA
hsa-miR-203 000507 hsa-miR-203 GUGAAAUGUUUAGGACCACUAG
hsa-miR-208 000511 hsa-miR-208a AUAAGACGAGCAAAAAGCUUGU
hsa-miR-221 000524 hsa-miR-221 AGCUACAUUGUCUGCUGGGUUUC
hsa-miR-223 002295 hsa-miR-223 UGUCAGUUUGUCAAAUACCCCA
hsa-miR-342-3p 002260 hsa-miR-342-3p UCUCACACAGAAAUCGCACCCGU
hsa-miR-375 000564 hsa-miR-375 UUUGUUCGUUCGGCUCGCGUGA
hsa-miR-383 000573 hsa-miR-383 AGAUCAGAAGGUGAUUGUGGCU
hsa-miR-409-3p 002332 hsa-miR-409-3p GAAUGUUGCUCGGUGAACCCCU
hsa-miR-423-5p 002340 hsa-miR-423-5p UGAGGGGCAGAGAGCGAGACUUU
hsa-miR-590-5p 001984 hsa-miR-590-5p GAGCUUAUUCAUAAAAGUGCAG
hsa-miR-638 001582 hsa-miR-638 AGGGAUCGCGGGCGGGUGGCGGCCU
Cel-miR-39 000200 Cel-miR-39 UCACCGGGUGUAAAUCAGCUUG
Cel-miR-54 001361 cel-miR-54-3p UACCCGUAAUCUUCAUAAUCCGAG
Cel-miR-238 000248 Cel-miR-238 UUUGUACUCCGAUGCCAUUCAGA
22
Supplementary Table S2. The logistic regression of Systemic sclerosis disease type §
Predictor β S.E. β Wald’s χ2 p-value OR 2.5% CI 97.5% CI
lcSSc vs dcSSc
(Intercept) -0,82 0,34 5,81 0,02 0,44 0,21 0,83
hsa.miR.29b.3p -1,57 0,99 2,48 0,12 0,21 0,02 1,24
hsa.miR.101 -0,56 0,57 0,93 0,33 0,57 0,17 1,74
hsa.miR.106a -0,80 0,97 0,69 0,41 0,45 0,06 2,82
hsa.miR.181b -2,48 1,10 5,10 0,02 0,08 0,01 0,61
hsa.miR.184 -0,53 0,44 1,48 0,22 0,59 0,24 1,35
hsa.miR.223 -2,13 1,14 3,49 0,06 0,12 0,01 0,99
hsa.miR.342.3p 1,07 0,62 3,02 0,08 2,92 0,94 10,91
hsa.miR.409.3p 2,72 0,92 8,77 3,1E-03 15,20 3,25 1,3E+02
23
Supplementary Table S3. The logistic regression of Systemic sclerosis disease type §
Predictor β S.E. β Wald’s χ2 p-value Odds ratio 2.5% CI 97.5% CI
ACA
(Intercept) 1,44 0,56 6,57 0,0104 4,20 1,574 15,06
hsa.let.7c 1,30 0,96 1,82 0,1774 3,67 0,621 32,28
hsa.miR.16 2,36 1,05 5,08 0,0242 10,56 1,825 128,42
hsa.miR.21 0,50 0,71 0,48 0,4868 1,64 0,401 7,17
hsa.miR.29a -3,72 1,51 6,10 0,0135 0,02 0,001 0,30
hsa.miR.92a 0,98 0,97 1,02 0,3118 2,66 0,441 22,56
hsa.miR.101 -1,95 1,01 3,75 0,0529 0,14 0,012 0,79
hsa.miR.184 0,35 0,79 0,20 0,6565 1,42 0,316 7,43
hsa.miR.223 1,44 1,06 1,84 0,1751 4,23 0,607 45,02
hsa.miR.409.3p 3,31 1,21 7,52 0,0061 27,42 3,446 468,24
RNP
(Intercept) 2,36 0,51 21,61 0,0000 10,59 4,539 35,13
hsa.miR.29a 1,47 1,42 1,08 0,2993 4,36 0,279 78,52
hsa.miR.29c.3p -0,63 1,32 0,23 0,6350 0,53 0,041 7,86
hsa.miR.92a -0,33 0,54 0,37 0,5439 0,72 0,231 2,01
hsa.miR.409.3p -0,54 0,56 0,93 0,3361 0,58 0,177 1,70
hsa.miR.423.5p -0,64 0,54 1,40 0,2364 0,53 0,175 1,56
ATA
(Intercept) 3,46 0,91 14,52 0,0001 31,94 7,145 277,02
hsa.miR.16 -0,51 0,50 1,03 0,3090 0,60 0,210 1,56
hsa.miR.92a -0,65 0,61 1,14 0,2848 0,52 0,148 1,73
hsa.miR.101 3,68 1,31 7,88 0,0050 39,50 4,525 864,44
hsa.miR.155 -3,50 1,57 4,99 0,0254 0,03 0,001 0,52
hsa.miR.184 0,51 0,54 0,89 0,3447 1,67 0,591 5,26
hsa.miR.409.3p 0,31 1,06 0,09 0,7680 1,37 0,161 12,38
ARA
(Intercept) 1,43 0,30 22,77 0,0000 4,16 2,391 7,81
hsa.miR.184 0,27 0,29 0,90 0,3419 1,31 0,747 2,35
hsa.miR.342.3p -0,58 0,40 2,17 0,1410 0,56 0,247 1,18


