1
Spontaneous recovery in dynamic networks
Advisor: H. E. StanleyCollaborators:B. PodobnikS. HavlinS. V. BuldyrevD. Kenett
Antonio Majdandzic Boston University
2
Motivation
Outline
Model
Numerical results and theory
Real networks: empirical support
Discussion and conclusion
3
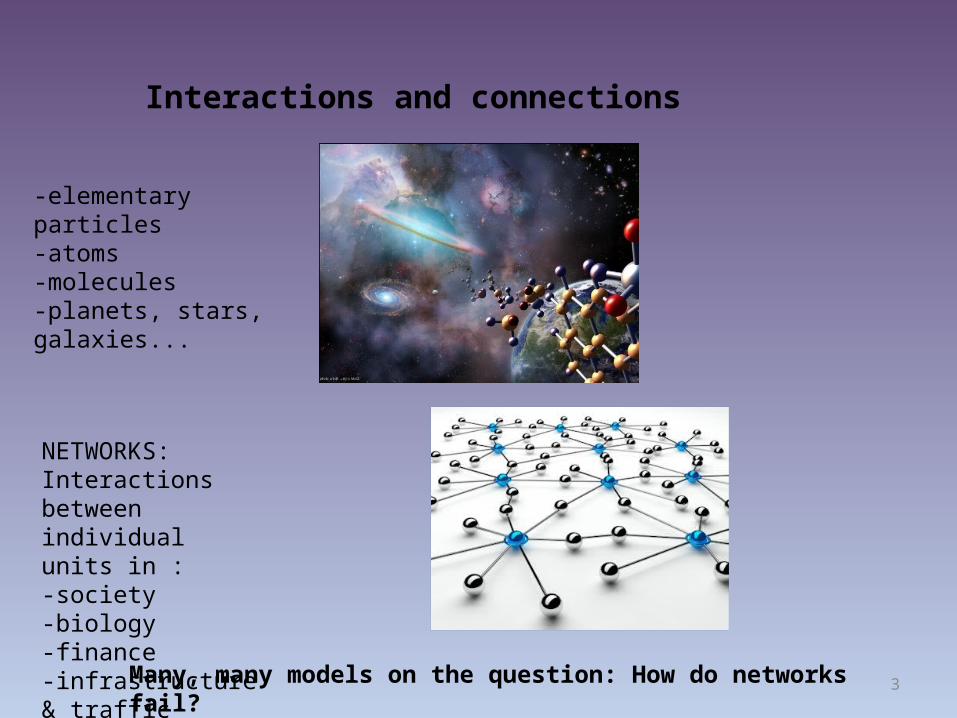
Interactions and connections
-elementary particles-atoms-molecules-planets, stars, galaxies...
NETWORKS:Interactions between individual units in :-society-biology-finance-infrastructure & traffic
Many, many models on the question: How do networks fail?
4
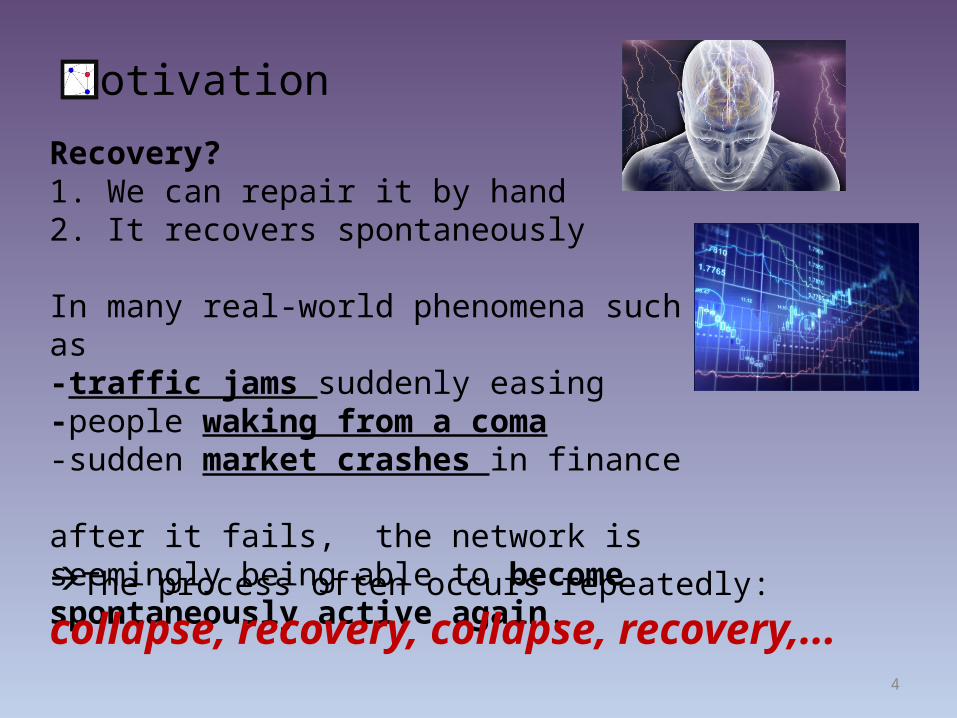
Motivation
Recovery?1. We can repair it by hand2. It recovers spontaneously
In many real-world phenomena such as -traffic jams suddenly easing-people waking from a coma-sudden market crashes in finance
after it fails, the network is seemingly being able to become spontaneously active again.
The process often occurs repeatedly: collapse, recovery, collapse, recovery,...
5
MODEL
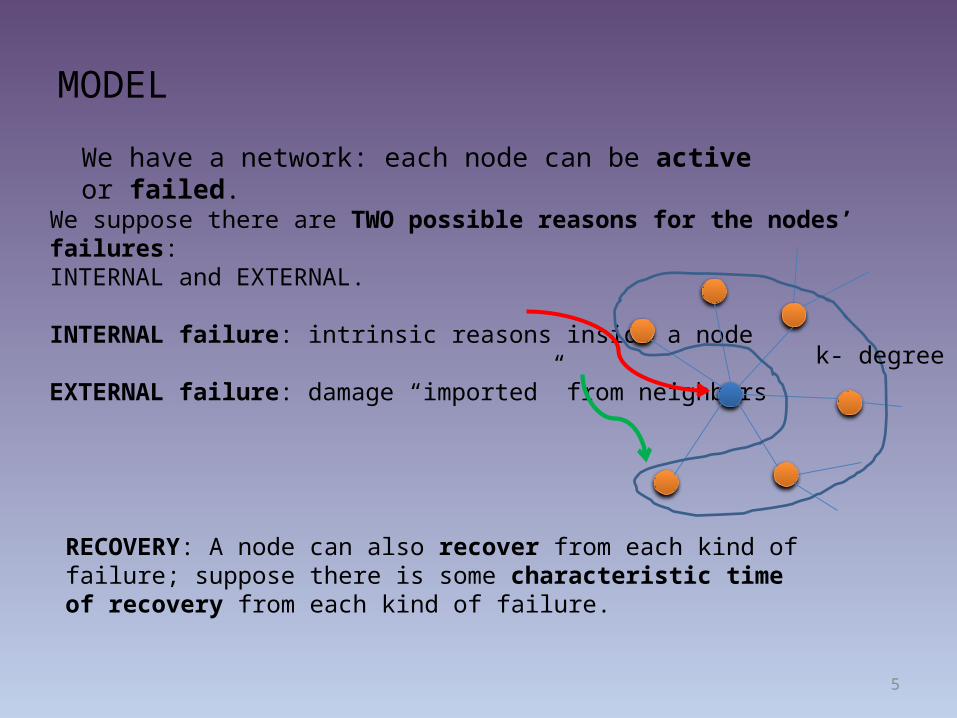
We have a network: each node can be active or failed.
We suppose there are TWO possible reasons for the nodes’ failures:INTERNAL and EXTERNAL.
INTERNAL failure: intrinsic reasons inside a node
EXTERNAL failure: damage “imported” from neighbors
RECOVERY: A node can also recover from each kind of failure; suppose there is some characteristic time of recovery from each kind of failure.
k- degree
6
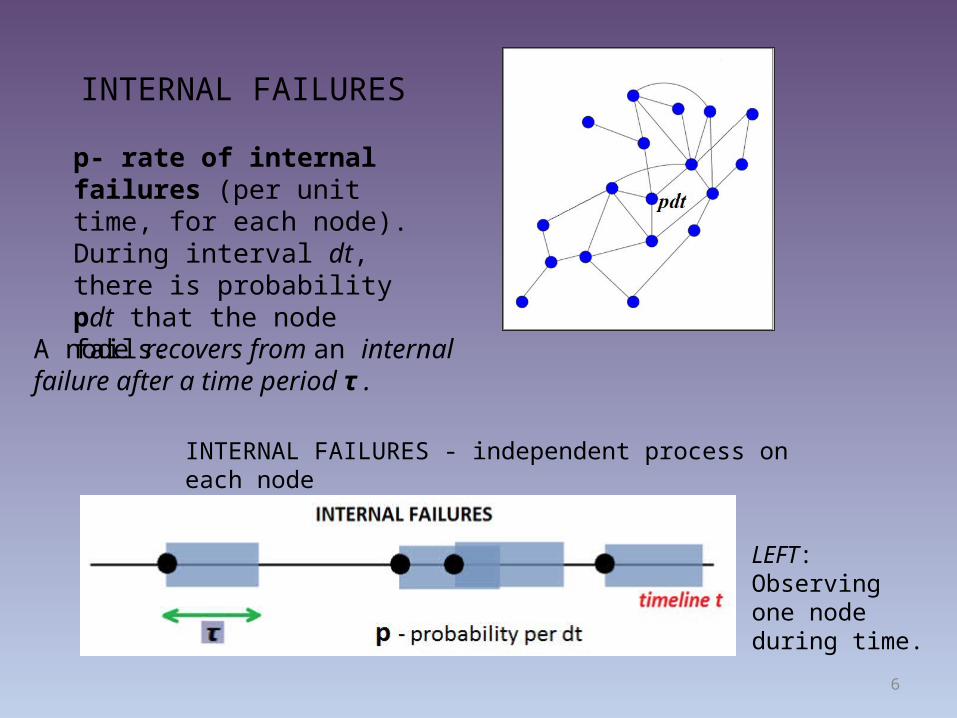
p- rate of internal failures (per unit time, for each node).During interval dt, there is probability pdt that the node fails.
INTERNAL FAILURES
A node recovers from an internal failure after a time period τ .
INTERNAL FAILURES - independent process on each node
LEFT: Observing one node during time.
7
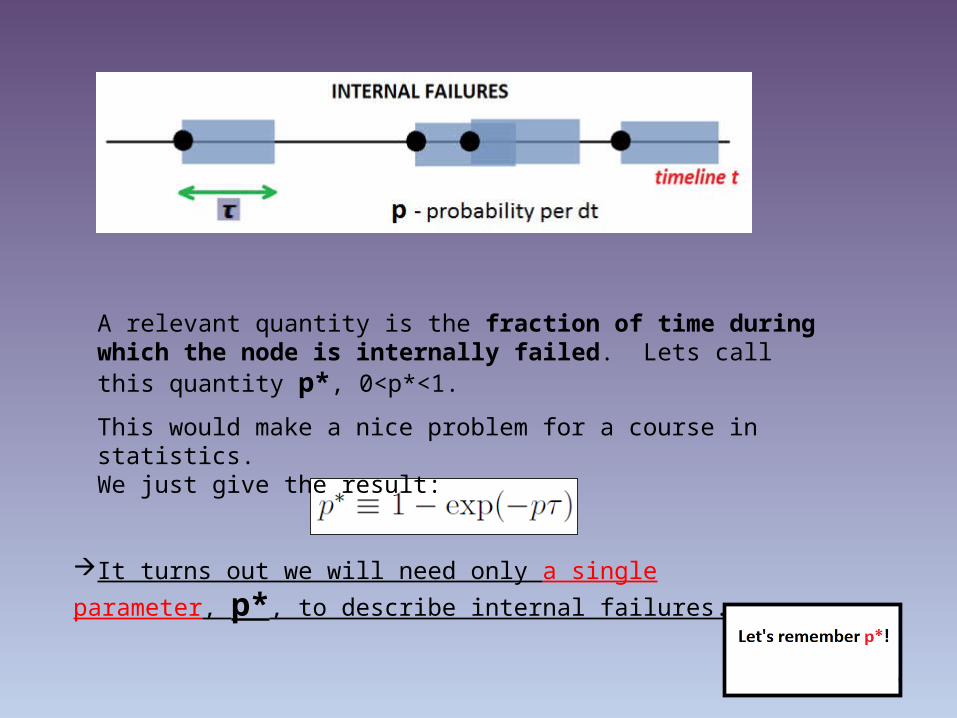
A relevant quantity is the fraction of time during which the node is internally failed. Lets call this quantity p*, 0<p*<1.
It turns out we will need only a single parameter, p*, to describe internal failures.
This would make a nice problem for a course in statistics. We just give the result:
8
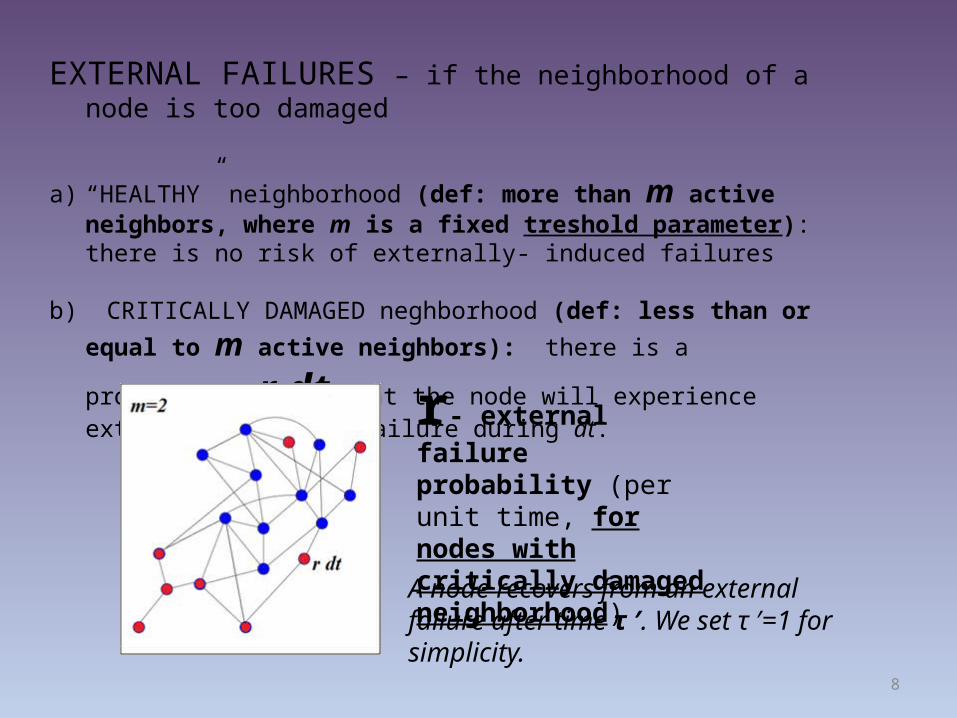
EXTERNAL FAILURES – if the neighborhood of a node is too damaged
a) “HEALTHY” neighborhood (def: more than m active neighbors, where m is a fixed treshold parameter): there is no risk of externally- induced failures
b) CRITICALLY DAMAGED neghborhood (def: less than or equal to m active
neighbors): there is a probability r dt that the node will experience externally-induced failure during dt.
r- external failure probability (per unit time, for nodes with critically damaged neighborhood)
A node recovers from an external failure after time τ ′. We set τ ′=1 for simplicity.
9
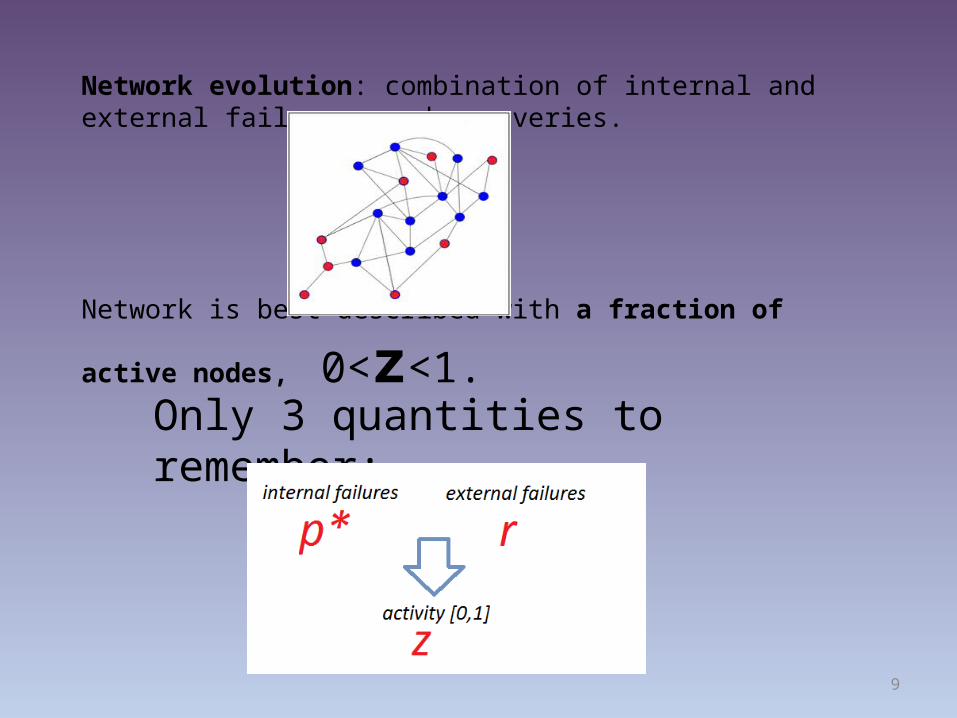
Network evolution: combination of internal and external failures, and recoveries.
Network is best described with a fraction of active nodes, 0<z<1.
Only 3 quantities to remember:
10
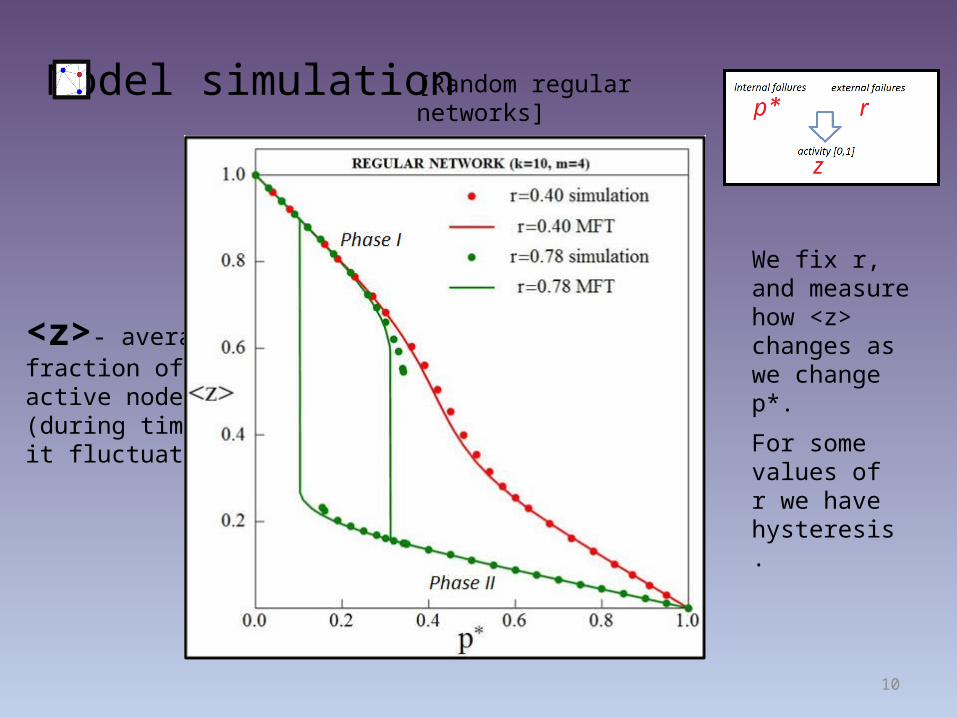
Model simulation
<z>- average fraction of active nodes(during timeit fluctuates)
We fix r, and measure how <z> changes as we change p*.
For some values of r we have hysteresis.
[Random regular networks]
11
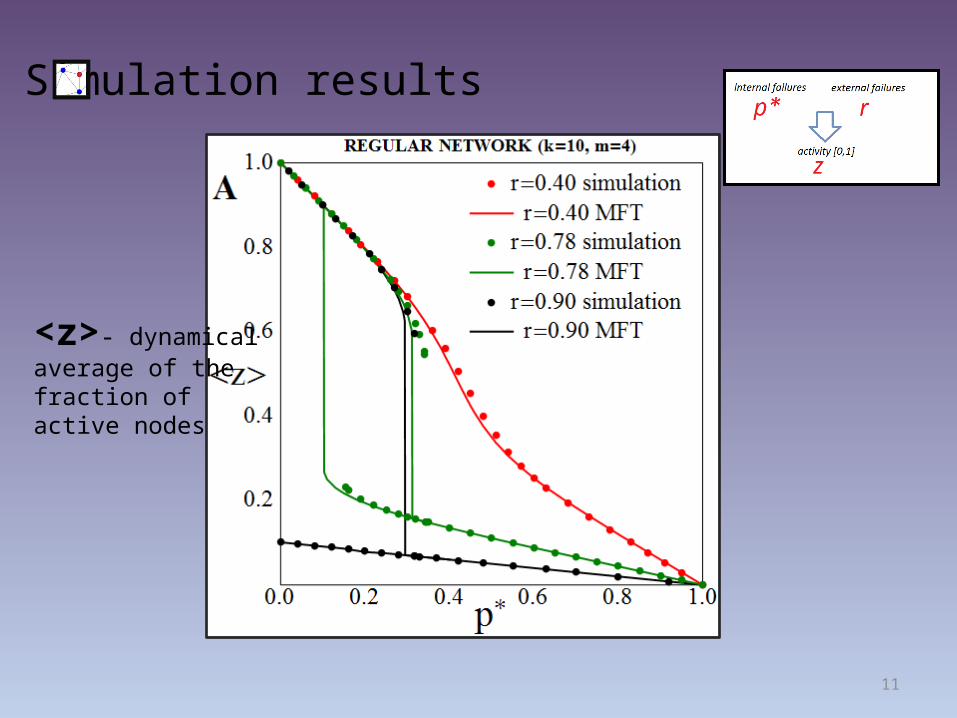
Simulation results
<z>- dynamical average of the fraction of active nodes
12
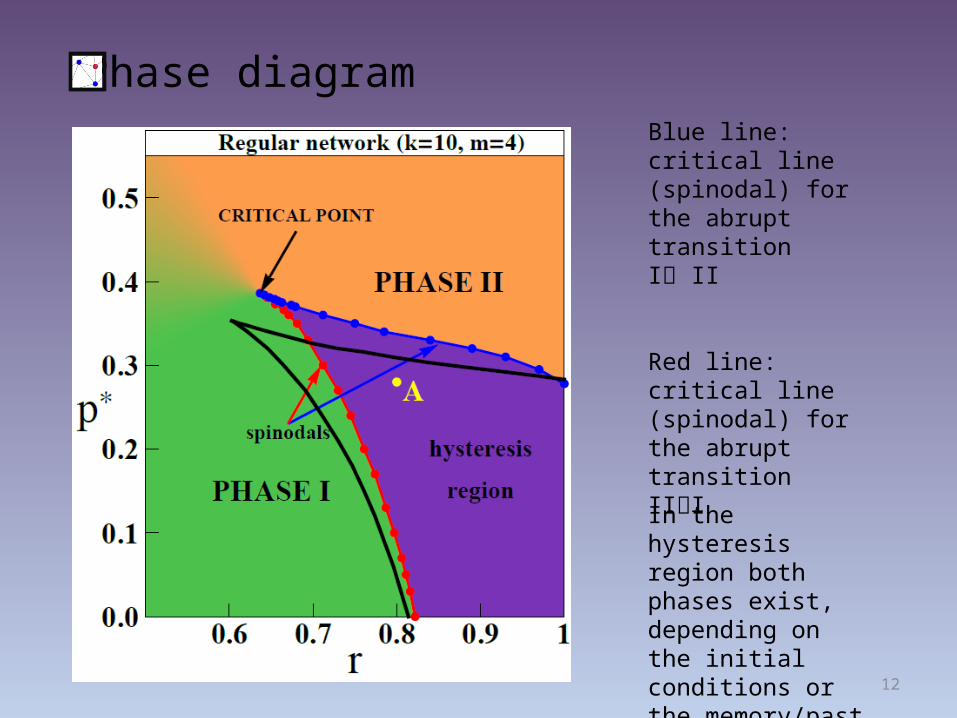
Phase diagramBlue line: critical line (spinodal) for the abrupt transition I II
Red line: critical line (spinodal) for the abrupt transitionIII
In the hysteresis region both phases exist, depending on the initial conditions or the memory/past of the system.
13
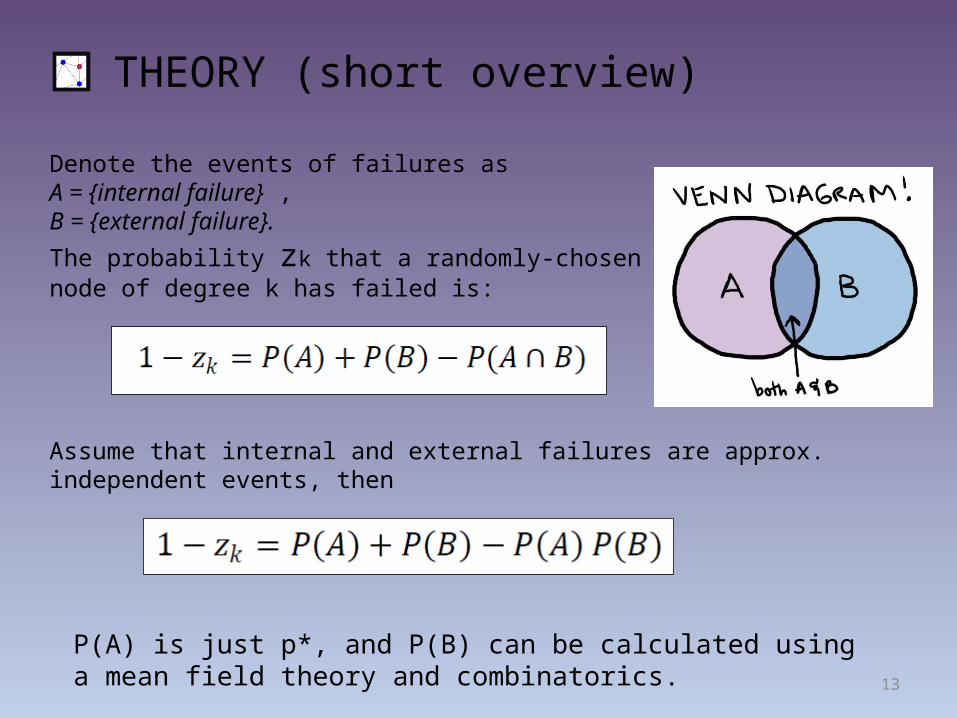
THEORY (short overview)
Denote the events of failures as A = {internal failure} ,B = {external failure}.
The probability zk that a randomly-chosen node of degree k has failed is:
Assume that internal and external failures are approx. independent events, then
P(A) is just p*, and P(B) can be calculated using a mean field theory and combinatorics.
14
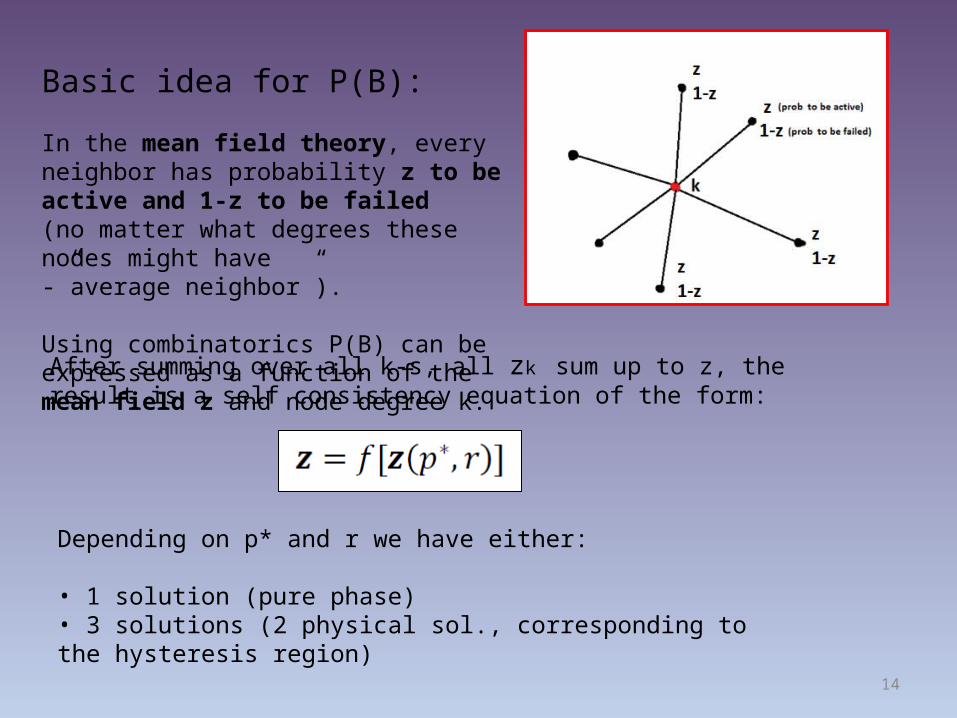
After summing over all k-s, all zk sum up to z, the result is a self consistency equation of the form:
Basic idea for P(B):
In the mean field theory, every neighbor has probability z to be active and 1-z to be failed (no matter what degrees these nodes might have-”average neighbor”).
Using combinatorics P(B) can be expressed as a function of the mean field z and node degree k.
Depending on p* and r we have either:
• 1 solution (pure phase)• 3 solutions (2 physical sol., corresponding to the hysteresis region)
15
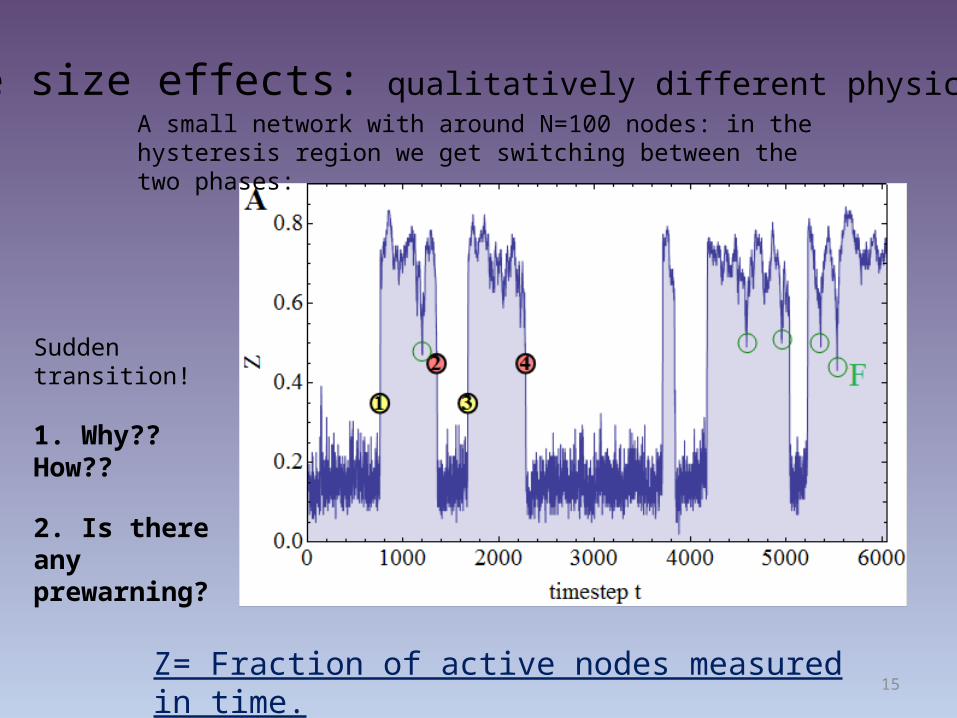
Finite size effects: qualitatively different physics
Z= Fraction of active nodes measured in time.
A small network with around N=100 nodes: in the hysteresis region we get switching between the two phases:
Sudden transition!
1. Why?? How??
2. Is there any prewarning?
16
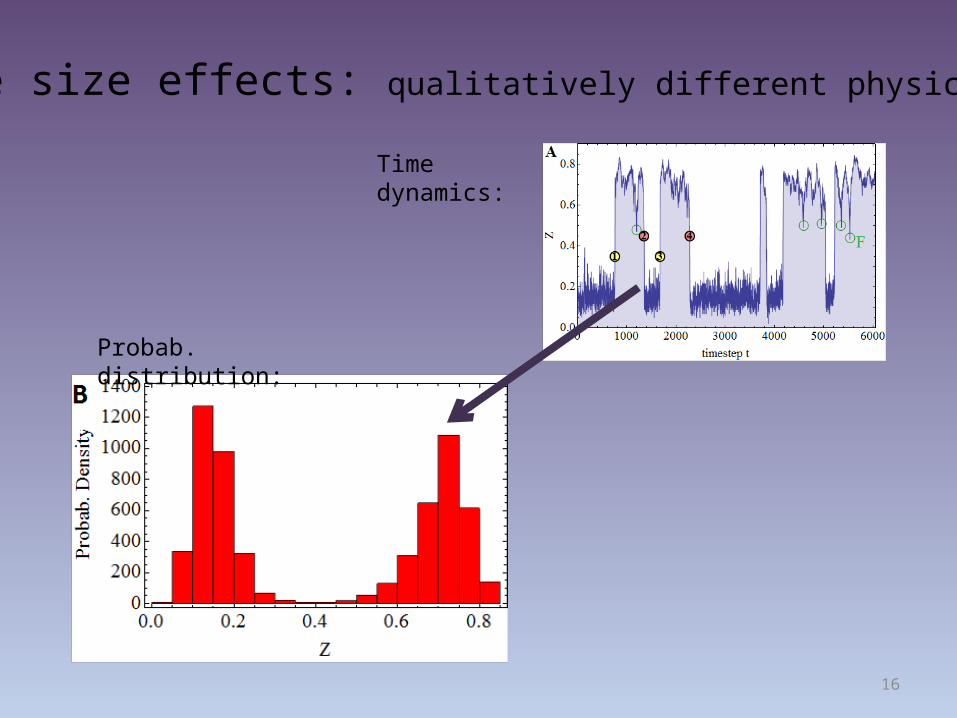
Finite size effects: qualitatively different physics
Probab. distribution:
Time dynamics:
17
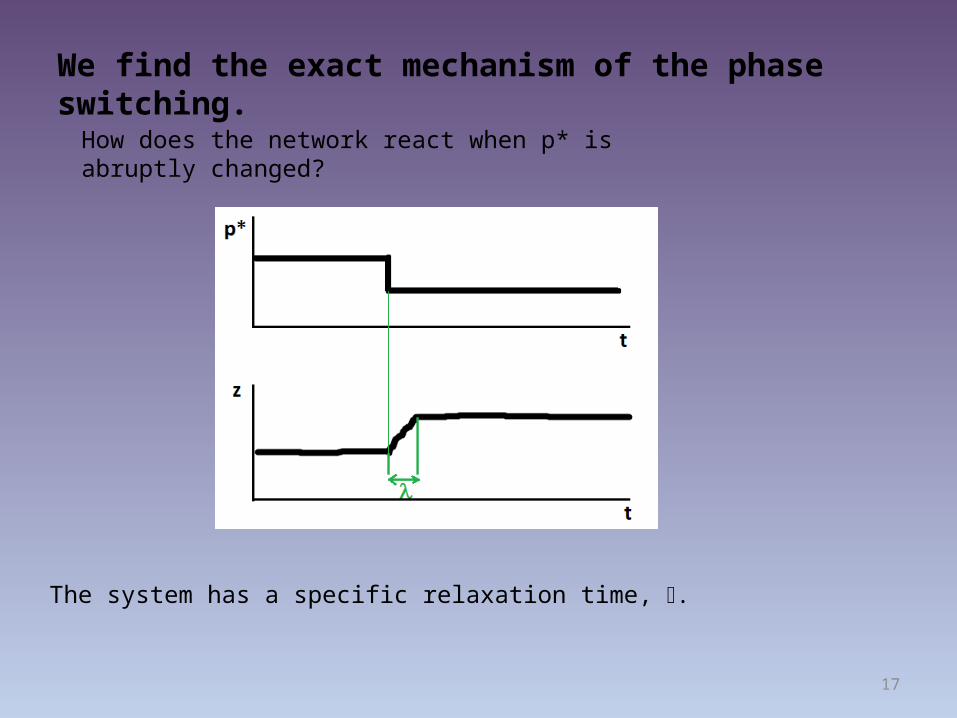
We find the exact mechanism of the phase switching.
The system has a specific relaxation time, l.
How does the network react when p* is abruptly changed?
18
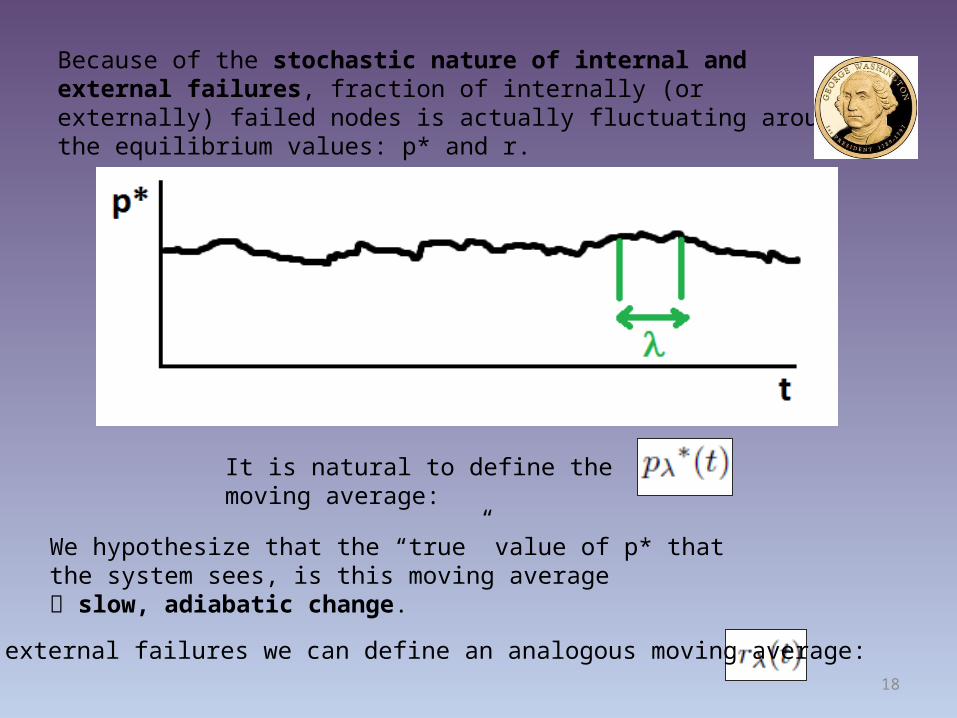
Because of the stochastic nature of internal and external failures, fraction of internally (or externally) failed nodes is actually fluctuating around the equilibrium values: p* and r.
We hypothesize that the “true” value of p* that the system sees, is this moving average slow, adiabatic change.
It is natural to define the moving average:
For the external failures we can define an analogous moving average:
19
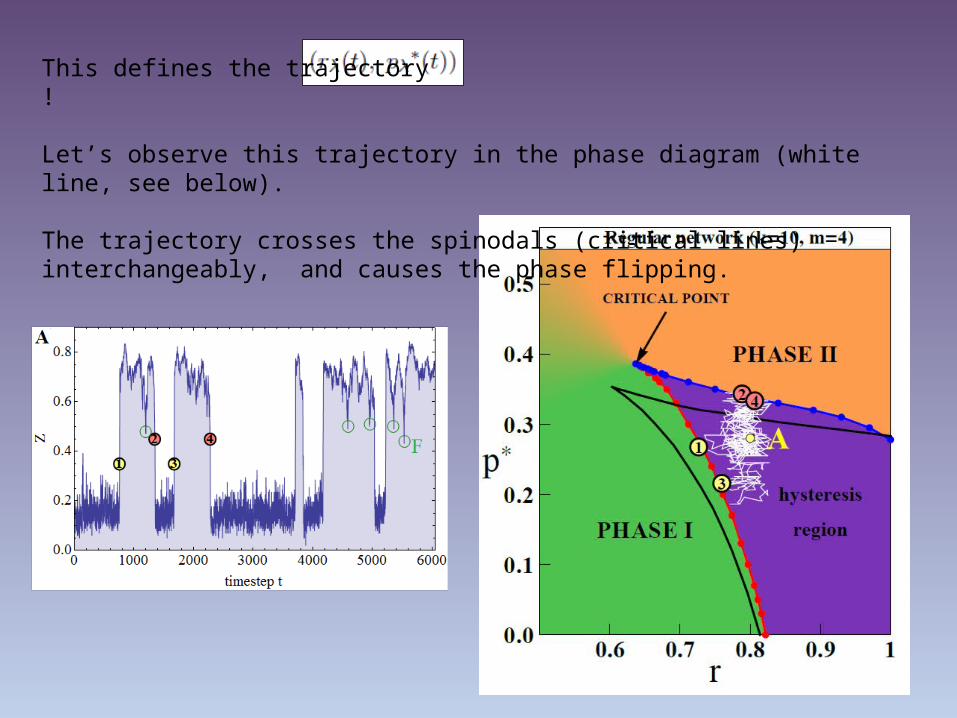
This defines the trajectory !
Let’s observe this trajectory in the phase diagram (white line, see below).
The trajectory crosses the spinodals (critical lines) interchangeably, and causes the phase flipping.
20
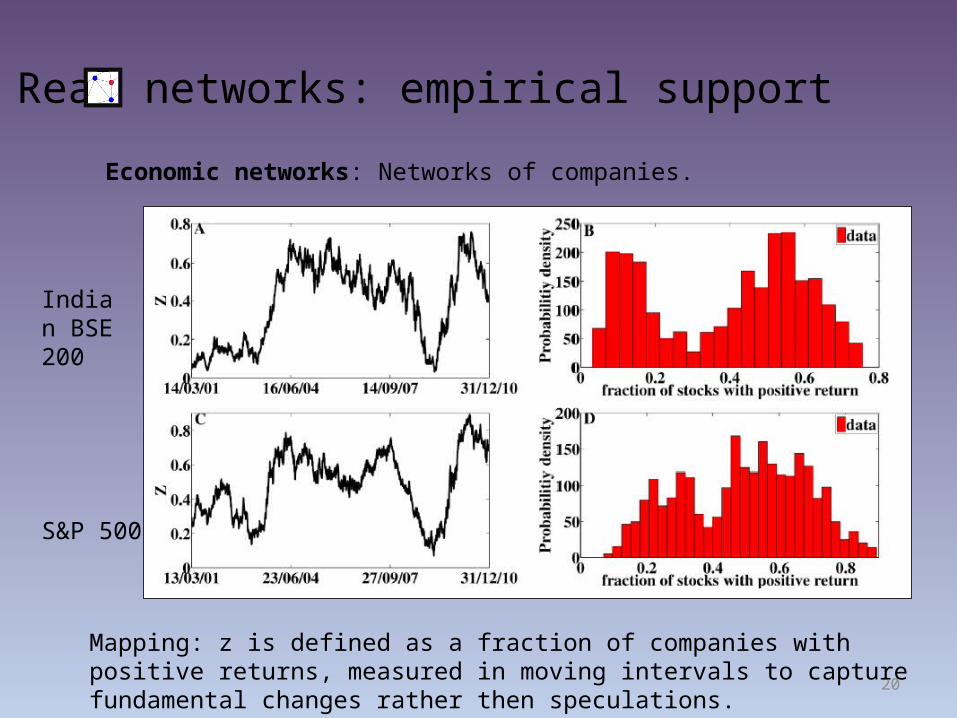
Real networks: empirical support
Economic networks: Networks of companies.
Indian BSE 200
S&P 500
Mapping: z is defined as a fraction of companies with positive returns, measured in moving intervals to capture fundamental changes rather then speculations.
21
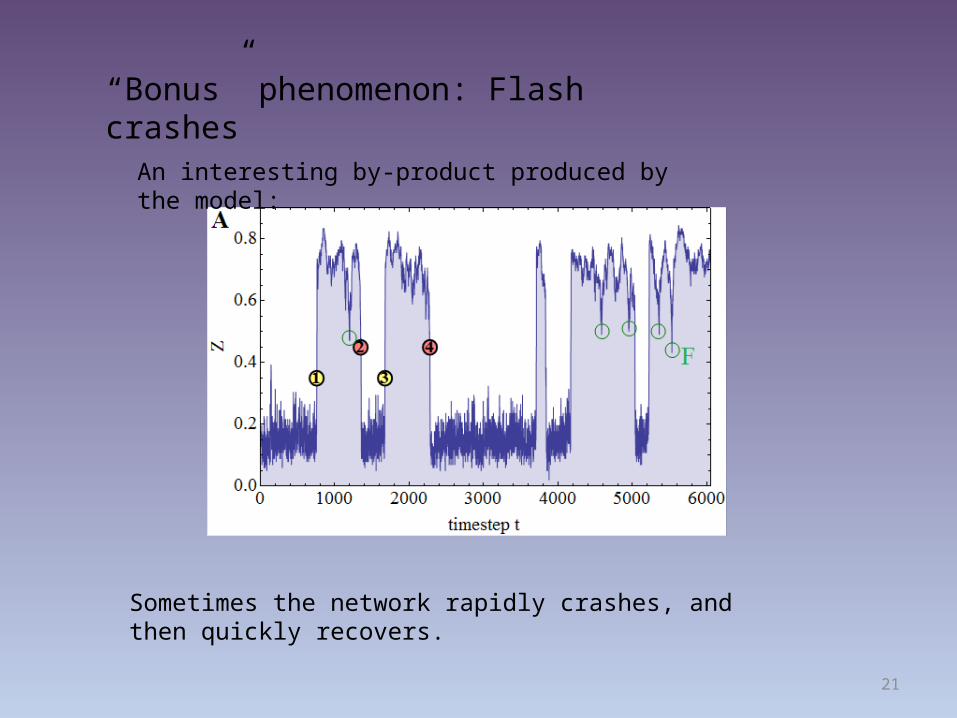
“Bonus” phenomenon: Flash crashes
An interesting by-product produced by the model:
Sometimes the network rapidly crashes, and then quickly recovers.
22
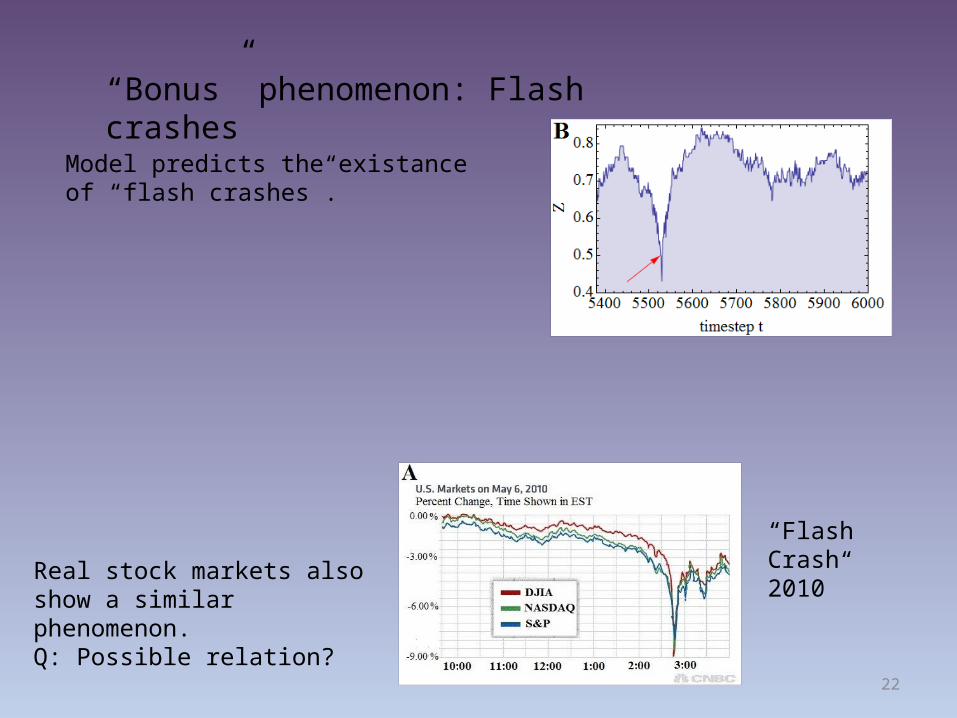
“Bonus” phenomenon: Flash crashes
Real stock markets also show a similar phenomenon.Q: Possible relation?
Model predicts the existance of “flash crashes”.
“Flash Crash2010”

23
Future work:
-We are extending the model on interdependent networks.
Preliminary results show a complicated phase diagram with 6 critical lines and two critical points.
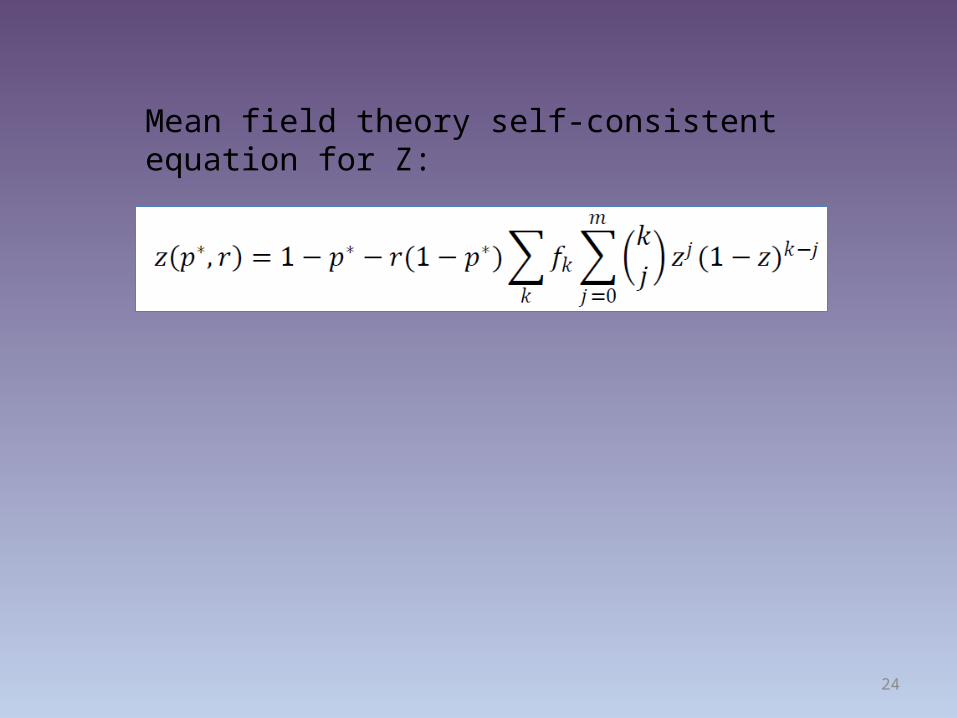
24
Mean field theory self-consistent equation for Z:


