
SSE Financial Results 6 months to 30 September 2015

Richard Gillingwater
2
Chairman

The SSE team
3

Safety comes first
4
SSE Total Recordable Injury Rate*
0.04
0.08
0.12
0.16
HY15 HY16
0.12 0.12
0
20
40
60
80
HY15 HY16
65 52
Total SSE and Contractor Recordable Injuries
*TRIR – per 100,000 hours worked

Strategy for long-term success
5
− Operating and investing in a balanced range of energy assets and businesses
− Range of opportunities to develop new assets and new customer propositions
− Annual dividend increases of at least RPI inflation

Working for a long-term framework
6
SSE view is that policy making should:
− Be clear and transparent
− Respect committed investments
− Include effective transitional arrangements
SSE strongly believes in constructive engagement with policy-makers and regulators

£757m invested
Industry leadership in Service
Dividend at least keeps pace with RPI
At least 115p EPS targeted
Delivering solid financial results
7

Gregor Alexander
8
Finance Director
₋ Financial Overview ₋ Networks

Focusing on the key financial results HY15 £m HY16 £m % change
Adjusted profit before tax 370.3 548.8 +48.2%
Fair value re-measurements (IAS 39) (17.3) (284.5)
Exceptional items - (2.2)
Interest on net pension liabilities (IAS 19R) (14.3) (11.3)
Tax on JCEs and associates (22.1) (20.0)
Reported profit before tax 316.6 230.8
Adjusted earnings per share 31.1p 45.9p +47.6%
Adjusted effective tax rate 15.0% 14.6%
Interim dividend 26.6p 26.9p +1.1%
9
10
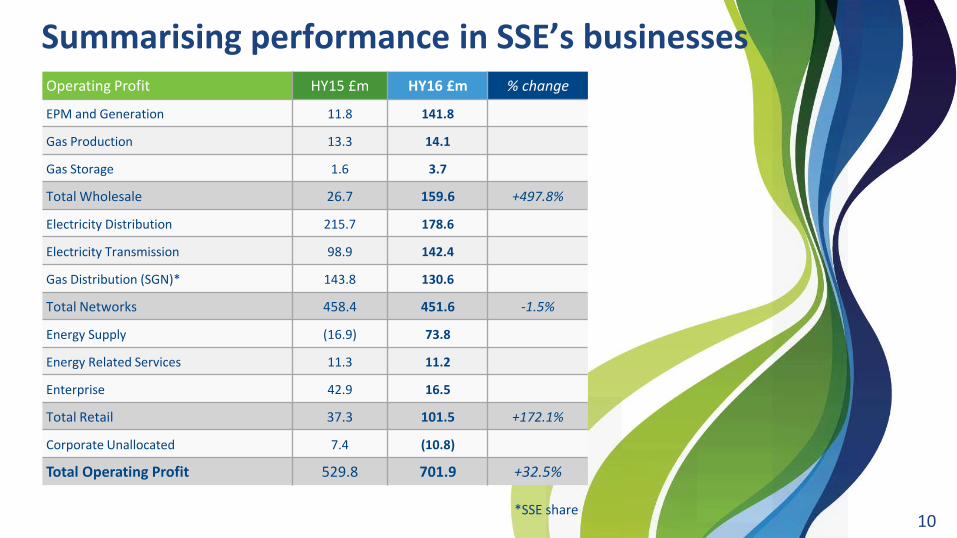
Summarising performance in SSE’s businesses Operating Profit HY15 £m HY16 £m % change
EPM and Generation 11.8 141.8
Gas Production 13.3 14.1
Gas Storage 1.6 3.7
Total Wholesale 26.7 159.6 +497.8%
Electricity Distribution 215.7 178.6
Electricity Transmission 98.9 142.4
Gas Distribution (SGN)* 143.8 130.6
Total Networks 458.4 451.6 -1.5%
Energy Supply (16.9) 73.8
Energy Related Services 11.3 11.2
Enterprise 42.9 16.5
Total Retail 37.3 101.5 +172.1%
Corporate Unallocated 7.4 (10.8)
Total Operating Profit 529.8 701.9 +32.5%
*SSE share

Focusing on adjusted earnings per share
11
- SSE is continuing to target FY16 adjusted EPS of at least 115p
- Adjusted dividend cover range from around 1.2x to around 1.4x in the 3 years to March 2018
- Long-term target closer to 1.5x - based on a dividend that at least keeps pace with RPI
Adjusted EPS HY and FY (p)
0
50
100
150
FY12 FY13 FY14 FY15 FY16
25.3 35.6 29.4 31.1
45.9
112.9 118.5 123.4 124.1 At least 115p

Making the right investment decisions (1)
12
HY15 FY15 HY16
Capital expenditure and investment (£m) 679 1,475 757
Adjusted net debt and hybrid capital (£m) 7,907 7,568 7,937
Average interest rate 4.50% 4.21% 3.96%
SSE benefited from:
- Good working capital management
- Reduced cash dividend through Scrip
- Low funding costs
- Commitment to maintaining strong balance sheet
Lawers Dam

Making the right investment decisions (2)
13
Up to 2018 and beyond
50%
30%
10%
10%
Networks
Wholesale
Retail (incl.Enterprise)Other
FY16 c. £1.75bn capex forecast
− Capex programme of around £5.5bn net across four years to March 2018
− Expected to be able to outline investment priorities beyond 2018 in the course of 2016
− Wide range of options post-2018

Focusing on value
14
Disposals and capital ‘recycling’ programme
SSE windfarm 0
1,000Remaining disposalprogramme
Wind assets sold or with saleagreements reached
Non-core assets sold or withsale agreements reached
£m

HY99 HY00 HY01 HY02 HY03 HY04 HY05 HY06 HY07 HY08 HY09 HY10 HY11 HY12 HY13 HY14 HY15 HY16
7.7 8.3 9.0
9.7 10.5
11.3 12.2
13.8 15.1
18.1
19.8 21.0
22.4 24.0
25.2 26.0 26.6 26.9
Maintaining a platform for dividend growth
15
Dividend Per Share HY (p)
Targeting dividend increases at least equal to RPI in future

Networks central to SSE’s strategy
16
0
2
4
6
8
FY10 FY11 FY12 FY13 FY14 FY15 HY16
Transmission Electricity Distribution SGN
Total Networks RAV, £bn (net)
Operating Profit HY15 HY16 % change
Electricity Distribution 215.7 178.6 -17.2%
Transmission 98.9 142.4 +44.0%
Gas Distribution (SGN) 143.8 130.6 -9.2%
Networks Operating Profit 458.4 451.6 -1.5%
Networks RAV increased by over 50% since April 2010 to £7.6bn; and is well placed to reach £10bn by 2020
Beauly-Denny

Keeping the lights on for Distribution customers
17
0
50
100
150
HY12 HY13 HY14 HY15 HY16
112 118 128 128
113
Distribution capex (£m)
0
50
100
150
200
250
HY15 HY16
216 179
Operating profit (£m) Distribution RAV (£bn)
0
1
2
3
4
FY10 HY15
2.56 3.13
Live Line Harvesting

Working for customers in ED-1
New Distribution price control
- Delivering an underlying reduction in household distribution costs
Stable and transparent regulatory framework
- Allowed revenues now set to 2023
SSE is focused on:
- Achieving efficiencies and innovation
- Ensuring investors receive fair return
18
0
20
40
HY12 HY13 HY14 HY15 HY16
30 33 33 29
24 30 33 32 32
21
SHEPD SEPD
Customer Minutes Lost (CML)
0
20
40
HY12 HY13 HY14 HY15 HY16
30 33
37 31 31
36 31
36 32
24
Customer Interruptions (CI)

Increasing the asset base in Transmission
0
50
100
150
200
HY15 HY16
99
142
Operating Profit (£m) Transmission RAV (£bn)
0
0.5
1
1.5
2
2.5
FY10 HY16
0.41
2.01
0
100
200
300
HY12 HY13 HY14 HY15 HY16
68
168 195 213
289
Transmission capex (£m)
19
Projects nearing completion:
− Beauly-Denny - £680m
− Foyers-Knocknagael - £26m
− Beauly-Blackhillock-Kintore - £94m
− Kintyre-Hunterston - £210m
− Beauly-Mossford - £68m
£1.1bn Caithness-Moray project now also underway

Securing value from Gas Distribution
20
Operating Profit* (£m)
0
50
100
150
200
HY15 HY16
144 131
0
1
2
3
FY10 HY16
1.95 2.48
SGN RAV* (£bn)
0
200
400
600
800
1000
FY07 FY08 FY09 FY10 FY11 FY12 FY13 FY14 FY15 RAVadditions
Cash returns Equity investment
Investment in SGN

Alistair Phillips-Davies
21
Chief Executive
₋ Business and Political Environment ₋ Wholesale ₋ Retail ₋ Outlook

Working within the emerging policy and regulatory framework
22 2015/16 – an important year for energy businesses in GB & Ireland
Key developments since May 2015
- Outcome of RIIO-ED1 appeal
- Implementation of the new government’s energy policies
- Provisional findings and potential remedies from the CMA market investigation
Emerging framework should enable SSE
- Deliver good operational performance for customers
- Deliver solid financial results for investors
- Be well-positioned to succeed in a changing sector

Working in the interest of customers and investors alike
23
Prudent decision to take more time
Pragmatic approach to closing RO in 2016
Progressive Price Control process
Managing Wholesale business in response to long-term trends
24
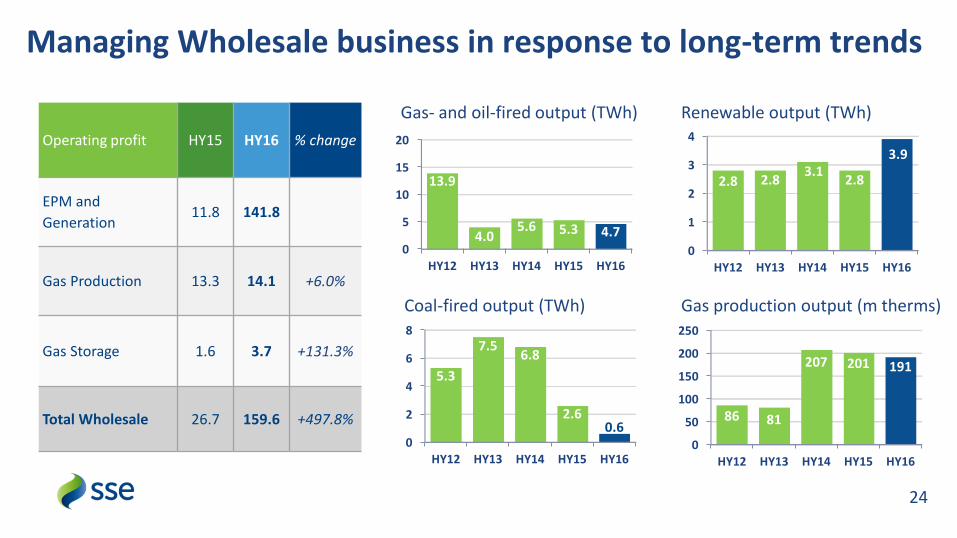
Operating profit HY15 HY16 % change
EPM and
Generation 11.8 141.8
Gas Production 13.3 14.1 +6.0%
Gas Storage 1.6 3.7 +131.3%
Total Wholesale 26.7 159.6 +497.8%
0
2
4
6
8
HY12 HY13 HY14 HY15 HY16
5.3
7.5 6.8
2.6 0.6
Coal-fired output (TWh)
0
1
2
3
4
HY12 HY13 HY14 HY15 HY16
2.8 2.8 3.1
2.8
3.9
Renewable output (TWh)
0
50
100
150
200
250
HY12 HY13 HY14 HY15 HY16
86 81
207 201 191
Gas production output (m therms)
0
5
10
15
20
HY12 HY13 HY14 HY15 HY16
13.9
4.0 5.6 5.3 4.7
Gas- and oil-fired output (TWh)
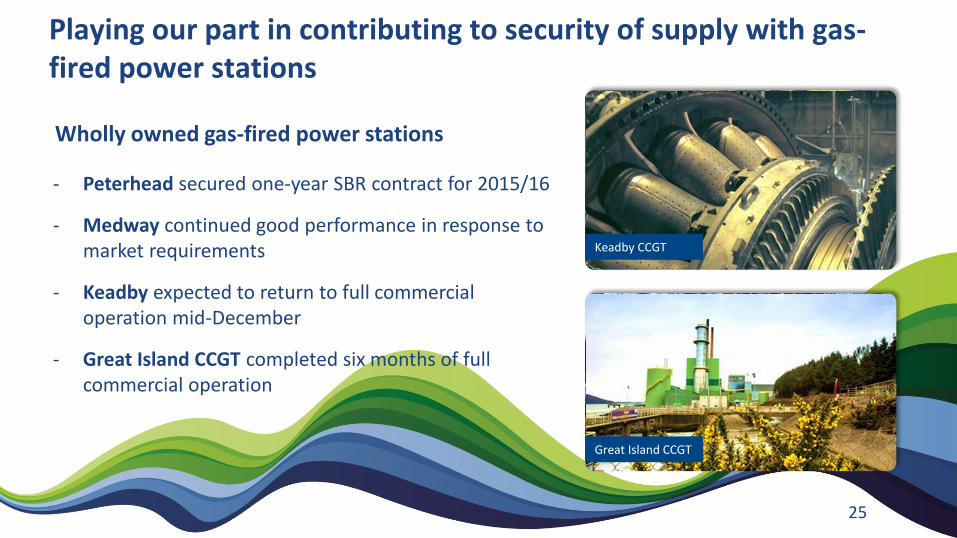
Playing our part in contributing to security of supply with gas-fired power stations
25
- Peterhead secured one-year SBR contract for 2015/16
- Medway continued good performance in response to market requirements
- Keadby expected to return to full commercial operation mid-December
- Great Island CCGT completed six months of full commercial operation
Great Island CCGT
Keadby CCGT
Wholly owned gas-fired power stations
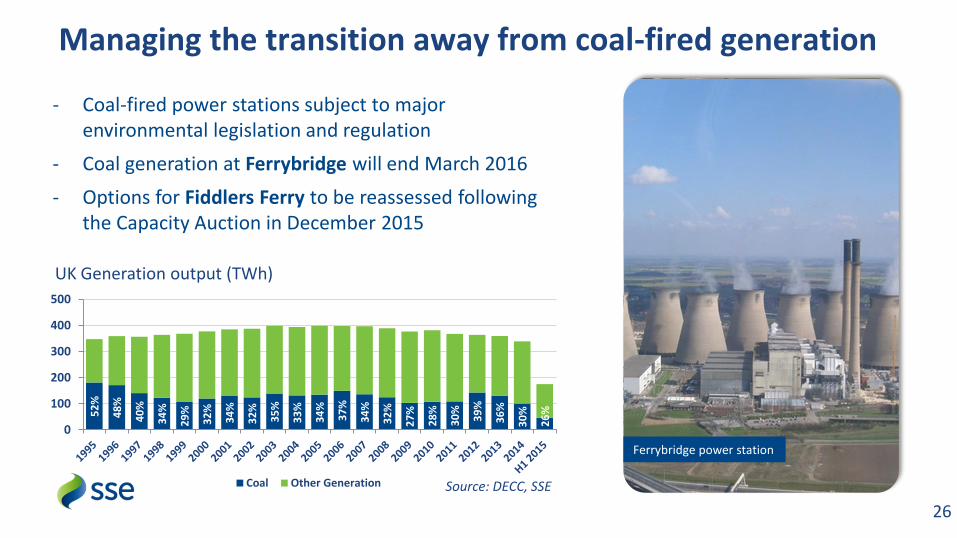
Managing the transition away from coal-fired generation
26
UK Generation output (TWh)
- Coal-fired power stations subject to major environmental legislation and regulation
- Coal generation at Ferrybridge will end March 2016
- Options for Fiddlers Ferry to be reassessed following the Capacity Auction in December 2015
Source: DECC, SSE
52
%
48
%
40
%
34
%
29
%
32
%
34
%
32
%
35
%
33
%
34
%
37
%
34
%
32
%
27
%
28
%
30
%
39
%
36
%
30
%
26
%
0
100
200
300
400
500
Coal Other Generation
Ferrybridge power station

Modernising electricity generation
− £300m/69MW multi-fuel plant at Ferrybridge fully commissioned, with another 90MW consented
27
Peterhead CCGT Ferrybridge Multifuel
− Developing world’s first full-scale carbon capture and storage project at Peterhead

Taking the right decisions in Generation – renewables (1)
28
Total Renewable Capacity (GW)
2.4 2.9 3.2 3.3 3.4 3.4
0
1
2
3
4
FY11 FY12 FY13 FY14 FY15 HY16
Hydro Onshore wind Offshore wind
• Since 2010 SSE developed:
- Just under 800MW* of new onshore wind
- 350MW** of new offshore wind
• c. 600MW of onshore wind in construction
• Beatrice FID due in 2016
Beatrice demonstrator
*83MW sold **SSE share
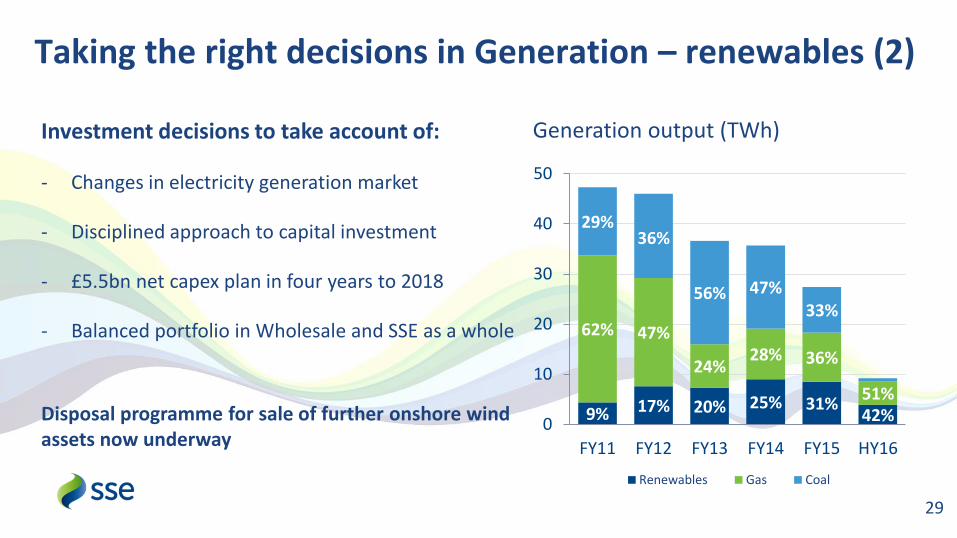
Taking the right decisions in Generation – renewables (2)
29
Investment decisions to take account of:
- Changes in electricity generation market
- Disciplined approach to capital investment
- £5.5bn net capex plan in four years to 2018
- Balanced portfolio in Wholesale and SSE as a whole
Disposal programme for sale of further onshore wind assets now underway
Generation output (TWh)
9% 17% 20% 25% 31% 42%
62% 47%
24% 28% 36%
51%
29% 36%
56% 47% 33%
0
10
20
30
40
50
FY11 FY12 FY13 FY14 FY15 HY16
Renewables Gas Coal
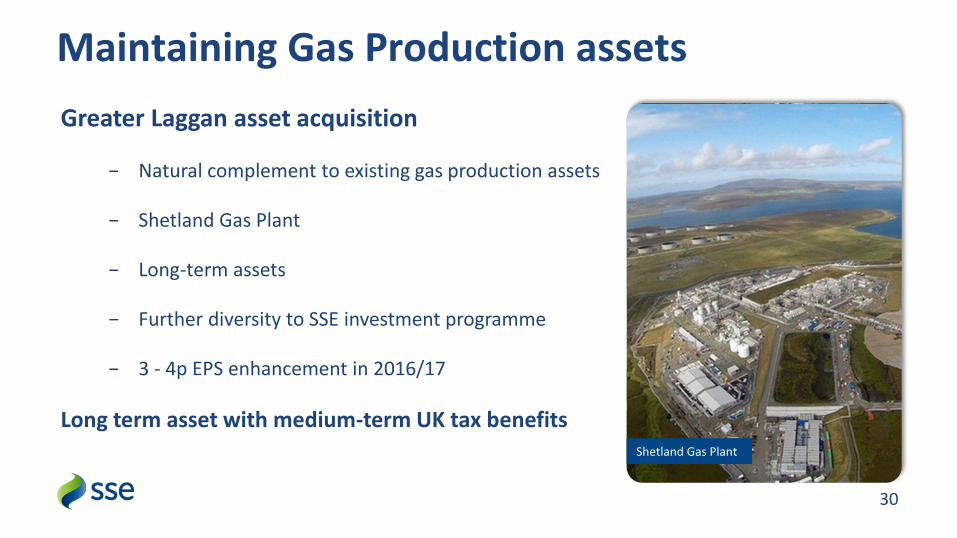
Maintaining Gas Production assets
30
Greater Laggan asset acquisition
− Natural complement to existing gas production assets
− Shetland Gas Plant
− Long-term assets
− Further diversity to SSE investment programme
− 3 - 4p EPS enhancement in 2016/17
Long term asset with medium-term UK tax benefits Shetland Gas Plant

Managing issues in Energy Supply
31
Operating profit (£m) HY15 HY16 % change
Energy Supply -16.9 73.8
Energy Related Services 11.3 11.2 -0.9%
Enterprise 42.9 16.5 -61.5%
Total Retail 37.3 101.5 +172.1%
Energy Customer Accounts (m) 8.89 8.41
Aged Debt (£m) 134.5 128.3
Source: Citizen Advice Bureau
944 770
645 577
518 421
170 141
123 119 116 97 91 89 83
70 64 48
18. Scottish Power17. Extra Energy16. Co-Operative Energy15. nPower14. Spark Energy13. First Utility12. Flow Energy11. Economy Energy10. Ovo Energy9. Utility Warehouse8. Utilita7. Green Star Energy6. Good Energy5. E.ON4. British Gas3. Ecotricity2. EDF Energy1. SSE
Ratio of complaints per 100,000 customers April – June 2015
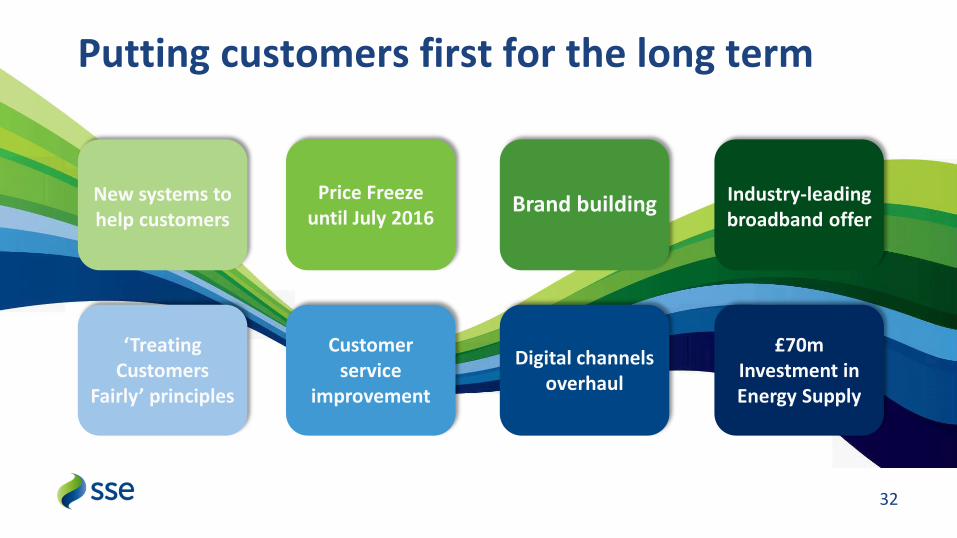
Putting customers first for the long term
32
New systems to help customers
Price Freeze until July 2016
Brand building Industry-leading broadband offer
‘Treating Customers
Fairly’ principles
Customer service
improvement
Digital channels overhaul
£70m Investment in Energy Supply

Building a new business - Enterprise
33
- Potential to attract significant and sustainable growth
- Further integration of products and services
- SSE Enterprise Contracting named top contractor
Operating profit (£m)
42.9*
16.5 0
20
40
60
HY15 HY16
*includes £15.3m gas pipelines disposal gain

Meeting the needs of customers and investors
34
SSE priorities
− Develop our business for growth in emerging political and regulatory framework
− Ensure we are positioned well for the long term
− Meet our dividend commitments

Doing the right things for the long term
35
Wholesale Networks Retail
− Completed Ferrybridge multi-fuel plant
− Enhanced roles of Peterhead & Keadby
− Acquired new gas production assets
− Started onshore wind disposal process
− RIIO-ED1 Price Control
− Enhanced customer focus in Distribution
− Strong Transmission investment programme delivery
− Best-in-class customer service
− Smart meter installation delivery
− Successfully extended product range
SSE Group − Dynamic and opportunistic approach to financing
− Actively manage asset base with targeted disposals
− Measured approach to changes in technology affecting energy sector
− Constructive approach to policy and regulation

Delivering dividend growth for the long-term
36
FY99 FY00 FY01 FY02 FY03 FY04 FY05 FY06 FY07 FY08 FY09 FY10 FY11 FY12 FY13 FY14 FY15 FY16
25.7 27.5 30.0 32.4 35.0 37.7 42.5
46.5
55.0 60.5
66.0 70.0
75.0 80.1
84.2 86.7 88.4 RPI*
Dividend Per Share FY (p)
*forecast, at least RPI
Value for customers and value for investors Q and A
37


