
Brigham Young University Brigham Young University
BYU ScholarsArchive BYU ScholarsArchive
Theses and Dissertations
2005-06-01
Stable Polymer Micelle Systems as Anti-cancer Drug Delivery Stable Polymer Micelle Systems as Anti-cancer Drug Delivery
Carriers Carriers
Yi Zeng Brigham Young University - Provo
Follow this and additional works at: https://scholarsarchive.byu.edu/etd
Part of the Chemical Engineering Commons
BYU ScholarsArchive Citation BYU ScholarsArchive Citation Zeng, Yi, "Stable Polymer Micelle Systems as Anti-cancer Drug Delivery Carriers" (2005). Theses and Dissertations. 327. https://scholarsarchive.byu.edu/etd/327
This Dissertation is brought to you for free and open access by BYU ScholarsArchive. It has been accepted for inclusion in Theses and Dissertations by an authorized administrator of BYU ScholarsArchive. For more information, please contact [email protected], [email protected].

STABLE POLYMER MICELLE SYSTEMS AS ANTI-CANCER
DRUG DELIVERY CARRIERS
by
Yi Zeng
A dissertation submitted to the faculty of
Brigham Young University
in partial fulfillment of the requirements for the degree of
Doctor of Philosophy
Department of Chemical Engineering
Brigham Young University
August 2005


ABSTRACT
STABLE POLYMER MICELLE SYSTEMS AS ANTI-CANCER
DRUG DELIVERY CARRIERS
Yi Zeng
Department of Chemical Engineering
Doctor of Philosophy
Several temporarily stable polymer micelle systems that might be used as
ultrasonic-activated drug delivery carriers were synthesized and investigated. These
polymeric micelle systems were Plurogel®, Tetronic®, poly(ethylene oxide)-b-poly(N-
isopropylacrylamide) and poly(ethylene oxide)-b-poly(N-isopropylacrylamide-co-2-
hydroxyethyl methacrylate-lactaten).
In previous work in our lab, Pruitt et al. developed a stabilized drug carrier named
Plurogel® [5, 6]. Unfortunately, the rate of the successful Plurogel® synthesis was only
about 30% by simply following Pruitt’s process. In this work, this rate was improved to
60% by combining the process of adding 0.15 M NaCl and/or 10 µl/ml n-butanol and by
preheating the solution before polymerization.

Tetronics® were proved not to be good candidates to form temporarily stable
polymeric micelle system by polymerizing interpenetrating networks inside their micelle
cores. Tetronic micelle systems treated by this process still were not stable at
concentrations below their critical micelle concentration (CMC).
Poly(ethylene oxide)-b-poly(N-isopropylacrylamide)-N,N-bis(acryloyl)cystamine
micelle-like nanoparticles were developed and characterized. When the N,N-
bis(acryloyl)cystamine (BAC) was from 0.2 wt% to 0.75 wt% of the mass of poly(N-
isopropylacrylamide), diameters of the nanoparticles at 40ºC were less than 150 nm. The
cores of the nanoparticles were hydrophobic enough to sequester 1,6-diphenylhexatriene
(DPH) and the anti-cancer drug doxorubicin (DOX). Nanoparticles with 0.5 wt% BAC
stored at room temperature in 0.002 mg/ml solutions were stable for up to two weeks.
Poly(ethylene oxide)-b-poly(N-isopropylacrylamide-co-2-hydroxyethyl
methacrylate-lactaten) micelle systems were synthesized and characterized. The degree of
polymerization of lactate side group, n, was 3 or 5. The copolymers with N-
isopropylacrylamide:2-hydroxyethyl methacrylate-lactate3: poly(ethylene oxide)
(NIPAAm:HEMA-lactate3:PEO) ratios of 20.0:5.0:1 or 22.5:2.5:1 and with
NIPAAm:HEMA-lactate5:PEO ratios of 17.5:7.5:1, 20.0:5.0:1 or 22.5:2.5:1 produced
micelles stable about 2 days at 40°C. The cores of the micelles were hydrophobic enough
to sequester DPH and DOX. The DOX release from the micelles having molar ratio of
NIPAAm:HEMA-lactate3:PEO equal to 20.0:5.0:1 was about 2 % at room temperature
and 4 % at body temperature. This system is a possible candidate for ultrasonically
activated drug delivery.

ACKNOWLEGEMENTS
I would like to express my sincere appreciation to Dr. William G. Pitt for the
guidance he has given me throughout this work. His investment of discussions, comments
and suggestions contributed significantly to the quality of this work. I look up to him very
much; his example and the things he has taught me will certainly help me in my future
career.
Appreciation is expressed to the members of my graduate committee, Dr. Paul F.
Eastman, Dr. Kenneth A. Solen, Dr. Calvin Bartholomew and Dr. Ron Terry for their
assistance in completing this work.
Appreciation is also expressed to the NIH grant (CA 98138, CA 76562), CIBA
Vision, Graduate Studies of Brigham Young University, Cancer Research Center of
Brigham Young University and Chemical Engineering Department of Brigham Young
University for financial supports that made this study possible.
Finally, I would like to express gratitude to my family, especially to my husband
Hua Lei, for their constant love and support for all these years.

TABLE OF CONTENTS LIST OF TABLES………………………………………………………………….. ixLIST OF FIGURES………………………………………………………………… xCHARPTER 1 INTRODUCTION………………………………………………… 1CHARPTER 2 LITERATTURES REVIEW……………………………………… 5
2.1 Pluronic®………………………………………………………………….. 52.2 Tetronic®………………………………………………………………….. 102.3 CH3O-poly(ethylene oxide)-b-poly(N-isopropylacrylamide)…………….. 142.4 Poly(ethylene oxide)-b-poly(N-isopropylacrylamide-co-2-hydroxyethyl
methacrylate-lactaten)……………………………………………………………….. 192.5. Factors Affecting the CMC of Micelles………………………………….. 24
CHAPTER 3 OBJECTIVES……………………………………………………….. 27CHAPTER 4 ANALTICAL METHODS………………………………………….. 29
4.1 Gel Permeation Chromatography………………………………………… 294.2 Turbidity or LCST Measurements………………………………………... 294.3 Dynamic Light Scattering………………………………………………… 294.4 Fluorescent Measurement………………………………………………… 30
CHAPTER 5 IMPROVEMENT ON THE PLUROGEL® SYNTHESIS………….. 315.1 Materials…………………………………………………………………... 315.2 Polymerization……………………………………………………………. 315.3 Analyses…………………………………………………………………... 335.4 Improvement Method ……………………………………………………. 33
5.4.1 Salt and Organic Molecules………………………………………. 335.4.2 Preheating Process……………………………………………… 35
5.4.3 Summary………………………………………………………………... 36CHAPTER 6 TEMPORARILY STABLE POLYMERIC MICELLE SYSTEM BASED ON TETRONIC®………………………………………………………….. 37
6.1 Materials………………………………………………………………….. 376.2 Polymerization……………………………………………………………. 376.3 Analyses…………………………………………………………………... 386.4 Results…………………………………………………………………….. 38
6.4.1 The Effects of NaCl, Alcohols and pH on T 904 Micellization…. 386.4.2 Temporarily Stable Polymeric Micelle System Based on
Tetronic®……………………………………………………………………………. 40CHAPTER 7 TEMPORARILY STABLE POLYMERIC MICELLE SYSTEM BASED ON CH3O-POLY(ETHYLENE OXIDE)-B-POLY(N-ISOPROPYLACRYLAMIDE)……………………………………………………... 43
7.1 Materials………………………………………………………………….. 437.2 CH3O-poly(ethylene oxide)-b-poly(N-isopropylacrylamide) Copolymer .. 43
vii

7.2.1 Polymer Synthesis and Purification………………………………. 437.2.2 Analyses…………………………………………………………... 447.2.3 Results…………………………………………………………….. 44
7.2.3.1 Polymerization Kinetics………………………………….. 447.2.3.2 Purification Improvement………………………………… 597.2.3.3 Reduction of the Molecular Weight and the Molecular
Weight Distribution of the Polymer………………………………………………… 647.3 CH3O-poly(ethylene oxide)-b-poly(N-isopropylacrylamide)-N, N-
bis(acryloyl)cystamine Nanoparticles……………………………………………… 687.3.1 Particle Synthesis …………………………………………………... 687.3.2 Analyses…………………………………………………………….. 697.3.3 Results………………………………………………………………. 70
7.3.3.1 Particle Size……………………………………………….. 707.3.3.2 Fluorescence Measurement……………………………….. 75
7.3.4 Discussion…………………………………………………………... 78CHAPTER 8 TEMPORARILY STABLE POLYMERIC MICELLE SYSTEM BASED ON CH3O-POLY(ETHYLENE OXIDE)-B-POLY(N- ISOPROPYLACRYLAMIDE-HEMA-LACTATEN)……………………………… 83
8.1 Materials…………………………………………………………………... 838.2 Synthesis………………………………………………………………….. 83
8.2.1 HEMA-lactaten……………………………………………………… 838.2.2 4,4’-Azobis(4-cyanopentanoyl chloride)…………………………… 878.2.3 PEO-ABCPC………………………………………………………... 898.2.4 PEO-b-poly(NIPAAm-co-HEMA-lactaten)………………………… 91
8.3 Analyses…………………………………………………………………... 948.4 Results…………………………………………………………………….. 97
8.4.1 Radical Formation Kinetics of PEO-ABCPC-PEO………………… 978.4.2 Particle Size…………………………………………………………. 1008.4.3 Critical Micelle Temperature Characterization…………………… 1028.4.4 Fluorescence Measurements………………………………………... 1048.4.5 Doxorubicin Encapsulation and Releasing Upon Exposure to
Ultrasound………………………………………………………………………… 1058.5 Discussion………………………………………………………………… 106
CHAPTER 9 SUMMARY AND RECOMMENDATIONS……………………….. 1119.1 Summary of Accomplishments…………………………………………… 1129.2 Recommendations for the future…………………………………………. 113
REFERENCES……………………………………………………………………… 117
viii

LIST OF TABLES
Table 1. Characteristics of P(NIPAAm)-PEO block copolymers…………………...... 18 Table 2. Turbidities of 10% product solutions with different n-butanol concentrations in the polymerization systems………………………………………...
35
Table 3. Peak diameters of the first peaks in DLS spectra…………………………… 68 Table 4. Interpretation of NMR spectrum of HEMA-lactate3………………………… 86 Table 5. Interpretation of NMR spectrum of ABCPC………………………………... 89 Table 6. Interpretation of NMR spectrum of PEO-b-poly(NIPAAm-co-HEMA-lactaten)………………………………………………………………………………... 93 Table 7. The molar composition of NIPAAm to HEMA-lactate5 to PEO in PEO-b-poly(NIPAAm-co-HEMA-lactate5)…………………………………………………... 94
ix

x

LIST OF FIGURES
Figure 1. Structure of amphiphilic copolymer………………………………………... 2 Figure 2. Structure of a polymeric micelle…………………………………………… 2 Figure 3. Structure of Pluronic®………………………………………………………. 5 Figure 4. Structure of NNDEA……………………………………………………….. 10 Figure 5. Structure of AIBN………………………………………………………….. 10 Figure 6. Structure of BAC…………………………………………………………… 10 Figure 7. Structure of Tetronic®. PO stands for propylene oxide and EO stands for ethylene oxide………………………………………………………………………… 11 Figure 8. Structure of poly(N-isopropylacrylamide) (P(NIPAAm))………………….. 15 Figure 9. Structure of 4,4’-azobis(4-cyanopentanoyl chloride)………………………. 17 Figure 10. Structure of (a) Lactic acid (b) cyclic lactate dimer………………………. 19 Figure 11. Structure of 2-hydroxyethyl methacrylate………………………………... 20 Figure 12. Production of HEMA-lactaten…………………………………………….. 21 Figure 13. Synthesis and hydrolysis of poly(NIPAAm-co-HPMAm-lactate). DPTS stands for 4-(dimethylamino)pyridinium-4-toluenesulfonate and DCC stands for N, N-dicyclohexylcarbodiimide………………………………………………………….. 24 Figure 14. Polymerization apparatus………………………………………………… 32 Figure 15. The light absorption spectrum of Ce(IV) (dashed curve) and Ce(III) (solid curve) at 60°C………………………………………………………………………… 52 Figure 16. The UV absorption of Ce(IV) aqueous mixture as a function of Ce(IV) concentration at 350 nm. Data were recorded at 60°C. Data points are n = 3, and error bars are smaller than the symbol.……………………………………………….. 52
xi

Figure 17. The light absorption spectrum of Ce(IV) (dotted curve) and PEO/Ce(IV) (solid curve) at 60°C………………………………………………………………….. 53 Figure 18. The UV absorption of PEO/Ce(IV) aqueous mixture as a function of time at 350 nm. PEO concentrations were 0.05 M for all four curves. Solid, dashed, dotted and double-dashed lines represent data of solutions at which Ce(IV) concentration equal to 0.015 M, 0.0075 M, 0.00375 M and 0.001875 M respectively. Data were recorded at 60°C. For UV absorption greater than 2.4, UV absorption was not proportional to Ce(IV) concentration and was ignored (data within the boxed area)………………………………………………………………... 55 Figure 19. The left side of Equation 7.26 as a function of time. Diamonds, triangles, squares and bars represent data of solutions for Ce(IV) concentrations equal to 0.015 M, 0.0075 M, 0.00375 M and 0.001875 M respectively………………………. 57 Figure 20. The turbidity of the polymerization system as a function of time at 60°C. Squares represent data with Ce(IV):PEO = 1.2:1 mol/mol. Triangles represent data with Ce(IV):PEO = 0.9:1 mol/mol. Data within the boxed area is not proportional to P(NIPAAm) concentration. For turbidities greater than 2.4, the turbidity was not proportional to P(NIPAAm) concentration and was ignored (data within the boxed area).Data points are n = 3, and error bars are smaller than the symbols ……………. 59 Figure 21. GPC data of the product obtained from the chloroform-diethylether/hexan precipitation process. Numbers 43973 and 1892 were calculated peak molecular weights of the final product and unreacted PEO……………………. 60 Figure 22. GPC data of the product obtained from the acetone-water separation method. Numbers 40988 and 2024 were calculated peak molecular weights of the final product and unreated PEO……………………………………………………… 62 Figure 23. GPC data of the product obtained from the ultracentrifugation separation method. Numbers 44046 and 8293 were calculated peak molecular weights of the final products. The unreacted PEO peak was marked with “PEO”. The number of the calculated peak molecular weight of unreacted PEO was not shown because of the GPC software limitation………………………………………………………….. 63 Figure 24. DLS data of the 10 wt% PEO-b-P(NIPAAm) copolymer aqueous solution at 40°C………………………………………………………………………. 65 Figure 25. DLS data of 0.02 mg/ml PEO-b-P(NIPAAm)-0.5 wt% BAC aqueous solution at 40°C………………………………………………………………………. 71
xii

Figure 26. Diameters of PEO-b-P(NIPAAm)-BAC particles with different amounts of BAC upon dilution at 40°C. The black bar represents data at 2 mg/ml solution, the hatched bar represents data at 0.2 mg/ml dilution, and the white bar represents 0.02 mg/mL dilution. Repeatable results were not obtained for the particles with 1.5 wt% BAC in 0.02 mg/ml solution, and thus are not shown. Error bars represent the standard deviations (n=3)…………………………………………………………….. 72 Figure 27. Diameters of PEO-b-P(NIPAAm)-0.5 wt% BAC particles upon dilution at 20 and 40°C. The white bar represents data at 40°C and the black bar represents data at 20°C. Error bars represent the standard deviations (n=3)…………………….. 73 Figure 28. Diameters of PEO-b-P(NIPAAm)-0.5 wt% BAC nanoparticles as a function of time. Data was measured at 40°C. The white bar indicates 0.2 mg/ml dilution, the hatched bar indicates 0.02 mg/ml dilution and the black bar indicates 0.002 mg/ml dilution. Error bars represent the standard deviations (n=3). * indicates samples with diameters statistically less than the value at 1 week…………………… 74 Figure 29. DPH emission intensities of water and PEO-b-P(NIPAAm)-BAC nanoparticles with different amounts of BAC at 40°C. The diamond represents 2 mg/ml solution, the square represents 0.2 mg/ml solution, and * represents the emission intensity of DPH in water. Data points are n = 3, and bars are smaller than the symbol.………………………………………………............................................ 76 Figure 30. DPH emission intensities of water and PEO-b-P(NIPAAm)-0.5 wt% BAC nanoparticles at 40°C. * is the emission intensity of 0.1 µg/ml DPH in water. Data points are n = 3, and some error bars are smaller than the symbol……………... 76 Figure 31. Emission intensities of 40 µg/ml DOX in water ( * ), unstabilized Pluronic® P105 (dashed line) and PEO-b-P(NIPAAm)-0.5 wt% BAC nanoparticles (solid line) at 40°C. Data points are n = 3, and some error bars are smaller than the symbol.……………………………………………………………………………….. 77 Figure 32. Emission intensities of 0.1 µg/ml DPH in PEO-b-P(NIPAAm)-0.5 wt% BAC nanoparticles at 40°C with or without reducing agent β-mercaptoethanol as a function of time. A shows data in 2 mg/ml solution and B shows data in 0.2 mg/ml dilution. The diamond represent data with no β-mercaptoethanol, the squares represent data with 10:1 molar ratio β-mercaptoethanol and the triangles represent data for non-stabilized PEO-b-P(NIPAAm). Data points are n = 3, and error bars are smaller than the symbol………………………………………………………………. 79 Figure 33. NMR spectrum of HEMA-lactate3………………………………………... 85 Figure 34. The reaction of ABCPA and thionyl chloride…………………………….. 87 Figure 35. NMR spectrum of ABCPC……………………………………………….. 88
xiii

Figure 36. GPC spectrum of PEO-ABCPC-PEO. Numbers 4057 and 2006 were calculated peak molecular weights of PEO-ABCPC-PEO and unreacted PEO……… 90 Figure 37. Structure of PEO-b-poly(NIPAAm-co-HEMA-lactaten)…………………. 91 Figure 38. NMR of PEO-b-poly(NIPAAm-co-HEMA-lactate5)……………………... 92 Figure 39. Experimental apparatus to measure the release of DOX from the drug carrier…………………………………………………………………………………. 96 Figure 40. The structure of stable free radical diphenyl picrylhydrazyl……………... 98 Figure 41. DPPH concentrations as a function of time in different ethanol solutions at 80°C. A) Solid diamonds: DPPH solution; solid squares: ABCPC and DPPH solution; solid triangles: ABCPA and DPPH solution. B) Open diamonds: PEO and DPPH solution; open squares: PEO, ABCPC and DPPH solution; open triangles: PEO-ABCPC-PEO and DPPH solution… Data points are n = 3, and error bars are smaller than the symbol.……………………………………………………………… 99 Figure 42. Diameters of PEO-b-poly(NIPAAm-co-HEMA-lactaten) micelles at 40°C. (A) n =3, (B) n =5. The black bars represent data at 1 mg/ml solution, the hatched bars represent data at 0.1 mg/ml dilution, and the white bars represent data at 0.01 mg/ml dilution. Error bars represent the standard deviations (n=3). * indicates that data of 0.1mg/ml and 0.01mg/ml were statistically different (p<0.05) from 1mg/ml within each NIPAAm:HEMA-lactaten:PEO ratio. # indicates that data of micelle with different NIPAAm:HEMA-lactaten:PEO ratio were statistically different (p<0.05) from the ones with NIPAAm:HEMA-lactaten:PEO equals to 17.5:7.5:1 in 1mg/ml solution. & indicates data of micelle with different NIPAAm:HEMA-lactaten:PEO ratio were statistically different (p<0.05) from the ones with NIPAAm:HEMA-lactaten:PEO equals to 20.0:5.0:1 in 1mg/ml solution. Statistical comparisons were made using double sided t-distribution test (n=3)…… 101 Figure 43. CMTs of copolymers at 1 mg/ml as a function of time. Closed symbols: n=5; open symbols: n=3. Diamonds: NIPAAm:HEMA-lactaten:PEO = 17.5:7.5:1; Triangles: NIPAAm:HEMA-lactaten:PEO = 20.0:5.0:1; Circles: NIPAAm:HEMA-lactaten:PEO = 22.5:2.5:1. Data are slightly off set in time for clarity…………… 103
Figure 44. CMTs of copolymers after hydrolysis for 7 days as a function of the ratio of NIPAAm:HEMA-lactaten:PEO. Closed symbols represent 1mg/ml copolymer solutions and open symbols represent 0.1 mg/ml copolymer solutions. Circles represent copolymer with n=5. Diamonds represent copolymers with n=3 and triangles represent copolymers without lactate block………………………….. 104
xiv
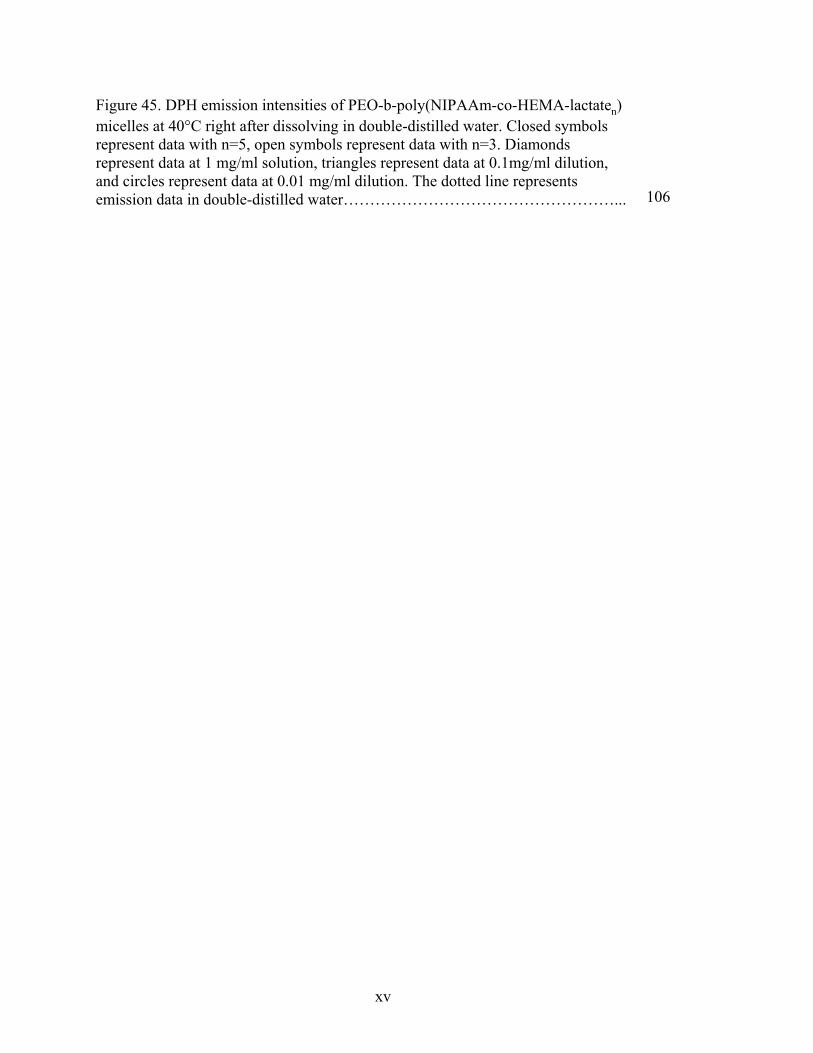
Figure 45. DPH emission intensities of PEO-b-poly(NIPAAm-co-HEMA-lactaten) micelles at 40°C right after dissolving in double-distilled water. Closed symbols represent data with n=5, open symbols represent data with n=3. Diamonds represent data at 1 mg/ml solution, triangles represent data at 0.1mg/ml dilution, and circles represent data at 0.01 mg/ml dilution. The dotted line represents emission data in double-distilled water……………………………………………... 106
xv

xvi
CHAPTER 1
INTRODUCTION
Controlled drug delivery is one of the most rapidly developing areas of medical
technology. It offers numerous advantages compared to conventional dosage forms
including improved efficacy, reduced toxicity, and improved patient compliance and
convenience [1]. For example, in the field of chemotherapy treatment of cancer, a
conventional method involves the systemic administration of anti-cancer drugs to kill
cancer cells. This exposes the entire body to the drug and usually results in severe side
effects. Controlled drug delivery provides a method to deliver anti-cancer drugs only to
cancer cells. This increases the local drug concentration at the tumor, yet maintains a low
concentration in the whole body, thus reducing toxic side effects.
Amphiphilic copolymers, such as Pluronic®, Tetronic® and CH3O-poly(ethylene
oxide)-b-poly(N-isopropylacrylamide) (PEO-b-P(NIPAAm)), are polymers that have a
hydrophobic (water repelling) part and a hydrophilic (water attracting) part on the same
molecule, as shown in Figure 1. They can self–assemble to core–shell structures in aqueous
solutions and thus form small spherical structures called micelles. The structure of a
polymeric micelle is shown in Figure 2. These kinds of micelles are often used as drug
carriers for controlled drug delivery systems [2, 3]. The hydrophobic core of the polymeric
micelle can trap hydrophobic drugs, while their hydrophilic shells make the micelle soluble
and decrease the rate of clearance from the blood. The release of the drug from theses
1

micelles can be achieved by exposure to ultrasound [4], thus providing a mechanism by
which the drug can be deposited at the desired place and desired time.
Polymeric micelles dissolve if their concentration drops below the critical micelle
concentration (CMC), which is defined as the concentration at which micelles form at a
given temperature; thus most non-stabilized micelles would dissolve into individual
polymer molecules quickly when injected into the blood and therefore no longer retain
hydrophobic drugs. One of the problems associated with the use of polymeric micelles to
deliver drugs is that CMC values of many amphiphilic copolymers are fairly high. For
example, CMCs of Pluronic® P105 (Mw 6,500) in water are 1 wt% at 25°C and 0.1 wt%
at 37°C [5]. It is not healthy to maintain such high Pluronic® concentrations in the body.
Figure 1. Structure of amphiphilic copolymer.
Figure 2. Structure of a polymeric micelle.
Hydrophilic
Hydrophobic
To use polymeric micelles as ultrasonic-activated IV administration anti-cancer
drug carriers, they must be less than 150 nm in diameter, must be stable (they must not
2

dissolve) in the blood for a sufficient amount of time to carry the drug to the desired
target site and must be biodegradable so that it does not build up in the body.
In previous work in our lab, Pruitt et al. stabilized Pluronic® P105 micelles by
polymerizing an interpenetrating polymer network of cross-linked N,N-diethylacrylamide
inside the micelle core; this stabilized drug carrier is called Plurogel® [5, 6], and it was
successfully used with ultrasound to treat tumors in rats [7]. In vitro experiments showed
that this stabilized micelle provided protection to cancer cells from anti-cancer drugs up
to 18 hours [4]. However, when Plurogel® loaded with drugs was exposed to ultrasound,
sufficient drug was released to effectively kill HL-60 cells. Although Plurogel® has
definite potential as an ultrasonically-activated drug carrier, its major deficiency is that it
is too degradable as it has a half-life in dilute aqueous solution of only about 18 hours.
Such a short half-life is good for biodegradability, but it also releases toxic drug too
quickly and not selectively at the target site.
This dissertation research focused on developing a more stable polymeric micelle
system than those obtained by Pruitt et al. Several systems were investigated, including
optimizing the Plurogel® synthesis based on Pluronic® P105, polymerizing an
interpenetrating polymer network inside amphiphilic Tetronic® copolymers, synthesizing
CH3O-poly(ethylene oxide)-b-poly(N-isopropylacrylamide)-N, N-bis(acryloyl)cystamine
nanoparticles and synthesizing poly(ethylene oxide)-b-poly(N-isopropylacrylamide-co-2-
hydroxyethyl methacrylate-lactaten) micelles. Sizes and stabilities of these polymer
systems and other properties relating to their potential as drug carriers were
characterized.
3

4

CHAPTER 2
LITERATURES REVIEW
2.1 Pluronic®
Pluronic® is a trade name (BASF Corporation) of a family of nonionic polymer
surfactants with the structure of type poly(ethylene oxide)-poly(propylene oxide)-
poly(ethylene oxide) (PEO-PPO-PEO), as shown in Figure 3. Pluronic® is formed by first
polymerizing the moderately hydrophobic PPO middle segment to the desired molecular
weight. Ethylene oxide is finally polymerized onto both hydroxyl ends to form the
flanking hydrophilic blocks.
HOO O O
H
PPO PEOPEO
nm
n
Figure 3. Structure of Pluronic®.
5

Pluronics® are widely used by industry as de-foamers, surfactants and cleansing
agents. Pluronic® P105 is the material from which Pruitt et al. synthesized stabilized
micelles, called Plurogels [6].
2.1.1 Thermodynamic Properties of Pluronic®
Both PEO and PPO are lower critical solution temperature (LCST) polymers. The
LCST of PPO is around 10°C, and it is insoluble in aqueous solutions at room
temperature [8]. The LCST of PEO is around 100°C [9]. Pluronics® are amphiphilic at
temperatures between the LCST of PPO and PEO, and thus they may form spherical
micelles in this temperature range at concentrations higher than their CMC. When the
temperature of Pluronic® aqueous solution approaches the LCST of PEO, the micelle
undergoes a sphere-to-rod transition before finally forming a macroscopic gel and
precipitating out from the aqueous solution.
At low concentrations, Pluronics® exist in aqueous solutions as individual Pluronic®
chains. As concentration is increased, Pluronic® polymers undergo a transition from
unimer chains to loose aggregates interpenetrated with water to dense micelles that
almost entirely exclude water [10]. This transition from individual unimers to dense
micelles occurs over a concentration range of an order of magnitude or more. At higher
concentrations (typically >20 wt%), a “gel” region appears. This thermoreversible gel
consists of large domains of liquid crystalline regions which have a variety of
microstructures [1].
Nivaggioli et al. studied the microviscosity in Pluronic® using fluorescence and
NMR spectroscopy. The microviscosity in Pluronic® micelles is much higher than that
6

observed in conventional surfactant micelles and depends strongly on the size of the
hydrophobic PPO block. The larger this block, the higher the viscosity [11].
2.1.2 Bioproperties of Pluronic®
In pharmaceutical applications, Pluronic® has been found to be a suitable drug
carrier because of its amphiphilic nature and low toxicity [12]. Anderson et al. reported
that at low temperatures (∼0°C), some types of Pluronic® solutions containing drugs are
liquid that can be injected into the body [13]. At higher temperatures, but lower than
body temperature, the micelles, into which hydrophobic drugs can dissolve, will form. At
body temperature, the micelles can subsequently undergo transition to the gel state, and
thus the release rate of anti-cancer drugs is reduced. Some other applications of Pluronic®
include topical delivery of silver lactate for the treatment of thermal burns, ophthalmic
delivery of pilocarpine nitrate, rectal delivery of indomethacin, and subcutaneous
delivery of recombinant interleukin 2 [14].
A major problem with common drug carriers is that they are easily cleared from the
blood by the mononuclear phagocytic system (MPS), formerly called the
reticuloendothelial system (RES). As drug carriers are cleared from the blood, they
become concentrated in the spleen, liver, and circulating monocytes, which can lead to
extreme toxicity in these organs and cells. However the hydrophilic part of Pluronic®
(the PEO) extends from the surface of the micelle into the aqueous environment and has
been shown to repel the adsorption of opsinizing proteins when used as a surface coating.
This PEO layer helps the carrier avoid recognition by the MPS by minimizing
interactions with blood proteins, thus prolonging the residence time in blood circulation
7

[15]. Bernacca et al. studied blood compatibility of polyurethane surfaces that were
surface-modified with PEO or other compounds. Surface modified polyurethane tubes
were exposed to whole blood and plasma and then assayed for β-thromboglobulin and
factor XIIa to monitor activation of platelets and complement. PEO-modified
polyurethane resulted in lower release of β-thromboglobulin compared to the other
surface modifications [16].
Some types of Pluronic® micelles have diameters around 10~30 nm [6]. This makes
the micelles large enough to escape renal excretion but small enough to allow
extravasation into the targeted tissue, such as a tumor [6]. Also Pluronic® micelles are
sensitive to ultrasound, which will perturb the structure of the micelle [17]. This may
allow for a simple method of targeting drug release to a specific location in the body,
while keeping the drug within the micelle when not exposed to the ultrasonic energy.
2.1.3 Disadvantages of Pluronic®
The major problem of using Pluronic® micelles as a drug delivery system is that the
polymer concentration will decrease when injected into the body because of dilution in
the blood circulation and clearance by the MPS. When the concentration of polymer
drops below the CMC, the micelle dissolves and the drug inside the micelle will be
released immediately. CMC values of Pluronics® are fairly high. For example, CMCs of
Pluronic® P105 (Mw 6,500) in water are 1 wt% at 25°C and 0.1 wt% at 37°C [5]. It is not
easy and not healthy to maintain such high Pluronics® concentrations in the body.
8
2.1.4 Stabilization of Pluronic® Micelle with an Interpenetrating Network within the Core
An efficient way to stabilize Pluronic® micelles is to polymerize other polymers
within the core of the micelle to form a non-covalent interpenetrating network [5].
Individual Pluronic® chains, which tend to form a “U”-shaped structure within the
micelle with the chain ends of the PEOs extending out into the aqueous phase, entangle
with the interpenetrating network. To disentangle from the interpenetrating network, the
hydrophilic PEO blocks are required to diffuse through the hydrophobic micelle core.
Because there is a free energy barrier to such disentanglement, the micelles are
temporarily stabilized by the non-covalent interpenetrating network.
Pruitt et al. created such an interpenetrating network using a LCST monomer: N,
N’-diethylacrylamide (NNDEA, Figure 4). Poly(NNDEA) has a LCST of 28 C [5].
During polymerization NNDEA monomer was hydrophobic and remained within the core
of the micelle at the reaction temperature of 65°C. 2,2-azobisbutyronitrile (AIBN, Figure
5) was chosen as a hydrophobic initiator and bis(acryoylcystamine) (BAC, Figure 6) was
selected as a hydrophobic crosslinker because its polymerizable groups are identical to
NNDEA polymerizable groups. BAC contains a disulfide bond that can be easily broken
with a reducing agent possessed by cells. Because all reaction reagents are hydrophobic
the polymerization will occur within the hydrophobic core of the micelle instead of in the
aqueous phase. Following polymerization, when the temperature drops below the LCST
of the P(NNDEA), P(NNDEA) becomes hydrophilic and the micelle core expands to
facilitate drug loading. Stabilized Pluronic® micelles are called Plurogels® [6], and they
are temporarily stabilized at concentrations below the CMC of Pluronic® [5, 6].
9

N
O
N N
NN
Figure 4. Structure of NNDEA. Figure 5. Structure of AIBN.
NH
O
SS
NH
O
Figure 6. Structure of BAC.
2.2 Tetronic®
Tetronic® is another product of the BASF Corporation and is a X-shaped block
copolymer; the typical structure of these polymers is shown in Figure 7. The sequential
addition of propylene oxide to the ethylenediamine center creates the hydrophobic core.
The four terminal ends of the molecule are formed by the addition of ethylene oxide units
and provide the hydrophilic character [3]. Tetronic® has similar chemical properties as
Pluronic®, and it might be possible to stabilize it in micellar form in a similar way.
10

EO PO
EO PON
H2C
H2C N
x
x
y
y
EOx
EOy x
PO
PO
y
Figure 7. Structure of Tetronic®. PO stands for propylene oxide and EO stands for ethylene oxide.
2.2.1 Thermodynamic Properties of Tetronic®
Like Pluronics®, Tetronics® exist in aqueous solutions as individual Tetronic®
unimers at low concentrations. When the concentration is greater than the CMC,
micelles form. Unlike Pluronic® polymers, which undergo a transition from unimers to
loose aggregates interpenetrated with water to dense micelles that almost entirely exclude
water, Tetronic® polymers do not form the same compact micellar structure as observed
with Pluronic® polymers [11, 18]. This may occur because the presence of the X-shaped
junction at the center of the polymer chain introduces extra free volume in the micelle
and hinders the polymer chains from forming a more compact structure. It may also be
possible that the tertiary amines are protonated (at neutral or lower pH) and thus entrain
water into the core. Nivaggioli et al. found that the diameter of the micelle formed with
Tetronic® T704 (Mw 5,500) is approximately 11.5 nm (in the 40-50°C temperature
range), which is significantly smaller than that of the 16.2 nm micelle formed with
Pluronic® P104 (Mw 5,900) [11]. The latter copolymer has similar molecular weight and
PPO weight percent as the former one. The authors believed this relatively small size and
11

aggregation number of T704 micelles is another indication of the hindrance encountered
by the copolymer chains to form a larger, more compact micelle structure.
As with Pluronics®, some of the members of the Tetronic® series exhibit the unique
property of thermal gelation at high concentrations upon increase in the temperature.
Spancake et al. reported that Tetronic® 1508 undergoes sol-gel transition at about
25~27°C when the concentration was 20~25% w/w [14].
Like Pluronic®, various grades of Tetronic® vary in small increments of
hydrophilic-hydrophobic balance depending on the length of the poly(propylene oxide)
and poly(ethylene oxide) chains; this determines their solubility characteristics. It was
reported that the CMC of Tetronic® 908 in water at 25°C is 0.06% w/w, while the CMC
of Teteronic® 707 at same temperature is 0.005% w/w [19]. This because Tetronic® 908
has longer PEO blocks than Teteronic® 707, which makes the former one more soluble in
water than the latter one.
2.2.2 Bioproperties of Tetronic®
Like Pluronics®, Tetronics® are also non-hazardous and chemically stable under
physiological conditions [20]. Furthermore, Tetronics® are similar to Pluronics® in
chemical composition. Their PEO blocks also help the micelle carrier avoid recognition
by the MPS, thus prolonging the residence time in blood circulation [15]. So it is
anticipated that Tetronics® may also be a viable drug delivery system and with the
potential to release drugs upon exposure to low-frequency ultrasound as Pluronics® do
[15].
12

Tan et al. studied protein adsorption of polystyrene particles that were surface-
modified with Tetronic® 908 at 25°C and 37°C [15, 21]. They used three major proteins
⎯ albumin, fibrinogen and immunoglobulin as well as blood plasma in their study. By
probing the translation diffusion and hence the hydrodynamic size of polymer particles in
the presence of water–soluble plasma proteins, Tan et al. observed constant
hydrodynamic diameters and rotational mobility of Tetronic® 908 coated polystyrene
particles as the weight ratio of protein to polystyrene increased. This indicates that
minimum protein adsorption occurred on hydrophobic polystyrene particles if they were
precoated with Tetronic®.
Moghimi studied the distribution of polystyrene particles that were also surface-
modified with Tetronic® 908 in rats [22]. Three hours after intravenous infusion into the
rats, the hepatic and the blood content of T 908 coated particles (60 nm in diameter) were
approximately 10% and 60% of the administered dose, respectively; while the hepatic
and blood content were 60% and 1% respectively for unmodified particles of similar size.
These data indicate that Tetronic® 908 reduced the clearance of PS particles from the
blood by the mononuclear phagocytic system (MPS) system.
2.2.3 Disadvantages
Though the CMC is not high for Tetronic® (Attwood et al. reported that the CMC
for Tetronic® 908 was 0.03% w/w with surface tension method at 40°C [19]),
fluorescence measurements show that Tetronic® micelle solutions at concentrations that
are just a little higher than CMC are not stable enough to deliver drugs [19]. This may
because Tetronic® micelles cannot form compact structures as Pluronic® micelles. So
13
higher concentration Tetronic® solutions would be needed for drug delivery, and this
might not be safe to the body.
2.3 CH3O-poly(ethylene oxide)-b-poly(N-isopropylacrylamide)
CH3O-poly(ethylene oxide)-b-poly(N-isopropylacrylamide) is another kind of
thermosensitive micelle-forming block copolymer. Each component of it is discussed
separately below.
2.3.1 Poly(N-isopropylacrylamide)
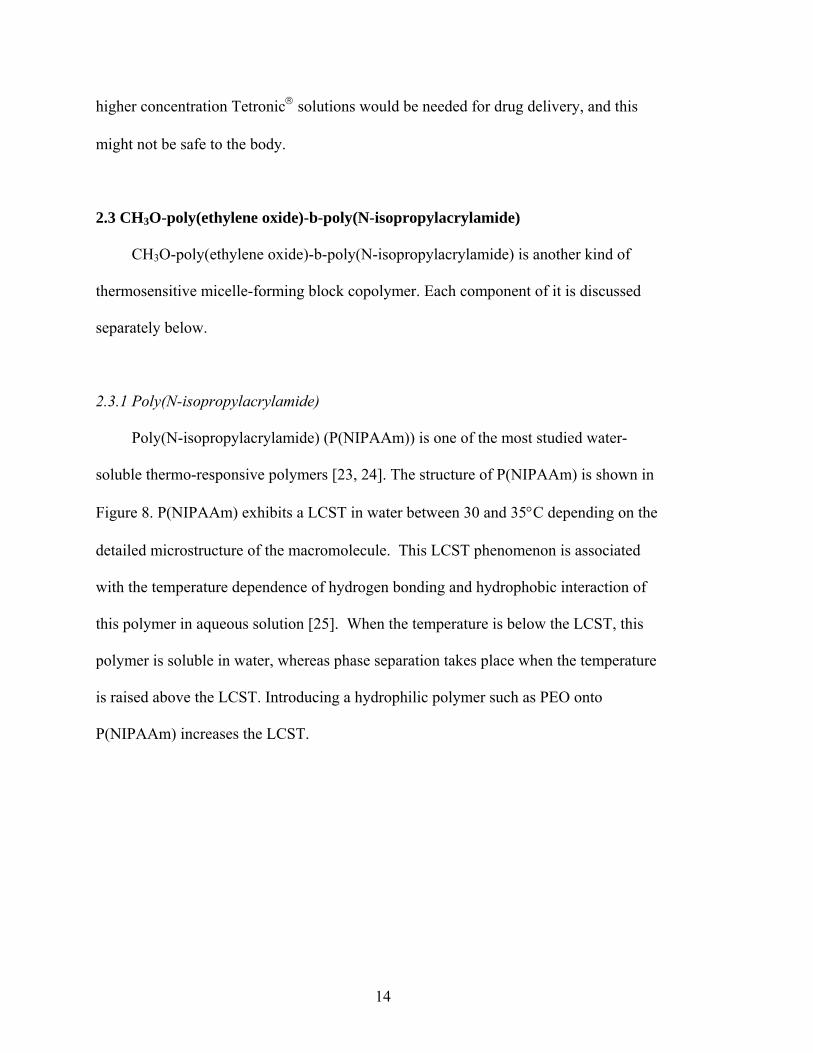
Poly(N-isopropylacrylamide) (P(NIPAAm)) is one of the most studied water-
soluble thermo-responsive polymers [23, 24]. The structure of P(NIPAAm) is shown in
Figure 8. P(NIPAAm) exhibits a LCST in water between 30 and 35°C depending on the
detailed microstructure of the macromolecule. This LCST phenomenon is associated
with the temperature dependence of hydrogen bonding and hydrophobic interaction of
this polymer in aqueous solution [25]. When the temperature is below the LCST, this
polymer is soluble in water, whereas phase separation takes place when the temperature
is raised above the LCST. Introducing a hydrophilic polymer such as PEO onto
P(NIPAAm) increases the LCST.
14

H3CH2C
HC H
CO
HN
CH
H3C CH3
m
Figure 8. Structure of poly(N-isopropylacrylamide) (P(NIPAAm)).
The thermo-reversible expansion of P(NIPAAm) makes it a very useful polymer for
a variety of biological and drug release applications, as reviewed by Schild [23]. Dry or
desolvated P(NIPAAm) gels were incubated in drug solutions to load with drug. The
release of drugs from within the gels to the outside media could be realized through pure
diffusion or squeezing out by the pressure generated during gel collapse.
P(NIPAAm) has been synthesized by a variety of techniques: free radical initiation
in organic solution, redox initiation in aqueous solution, ionic polymerizations, radiation
polymerization, and more [23]. If the polymerization is carried out in an aqueous
medium at a temperature higher than the LCST of the P(NIPAAm), even though
polymerization begins in a homogeneous solution of the monomer, it will continue in a
heterophase colloid-disperse system after the first polymer fractions are formed [24].
15

2.3.2 Poly(ethylene oxide)
As mentioned earlier, PEO has also been of interest because of its physicochemical
properties such as low protein and cell adhesion in aqueous systems. Block and graft
copolymers containing PEO as hydrophilic segments, such as PEO-co-poly(lactic acid)
and PEO-co-poly(ε-caprolactone), are widely synthesized and studied [26, 27].
2.3.3 CH3O-poly(ethylene oxide)-b-poly(N-isopropylacrylamide)
Because of the unique properties of P(NIPAAm) and PEO, block copolymers of
PEO-b-P(NIPAAm) have recently attracted much attention [28-30]. Thermosensitive
micelles can be obtained by this combination of hydrophilic and thermosensitive polymer
blocks. Such micelles may dissolve due to the loss of the micellization capacity when the
temperature is decreased below the LCST of the block copolymer, which is higher than
that of the P(NIPAAm) homopolymer. As the water solution of the copolymers is heated,
the micelles will assemble with P(NIPAAm) forming the core and the PEO forming the
hydrophilic shell.
2.3.3.1 Synthesis
There are several ways to form PEO-b-P(NIPAAm) copolymer [25-31].
Topp et al. reported a method that was widely used. A ceric ion redox system was
used to create radicals at each terminal carbon of PEO. These radicals initiated the
polymerization of NIPAAm, providing a direct route to A-B-A block copolymers using
HO-PEO-OH, and A-B block copolymers if CH3O-PEO-OH was used. Termination of
16

the polymerization occurs through the reaction with another Ce(IV) ion. Radical
recombination has not been observed [29].
The polymerization probably occurs in four stages. During the first stage a radical is
formed through the oxidation at the PEO-OH end group by the ceric ion in which the
ceric ion is reduced. In the second stage the radical polymerization of NIPAAm starts,
after which in the third stage the block copolymers acquire a sufficient number of
NIPAAm groups that they start to form micelles. In the last stage the polymerization
proceeds within the core of the micelle, known as an “emulsion block copolymerization”
[29].
Virtane et al. [26] and Neradovic et al. [27] reported another synthetic pathway:
PEO macroazoinitiators were first prepared by a condensation reaction of 4,4’-azobis(4-
cyanopentanoyl chloride) (ABCPC, Figure 9) and PEO in dichloromethane. Then,
purified PEO macroazoinitiators initiated the free radical polymerization of NIPAAm in
dioxane, and block copolymers were formed.
C
CN
CH3
N N C
CN
CH3
ClOC COCl
Figure 9. Structure of 4,4’-azobis(4-cyanopentanoyl chloride).
17
2.3.3.2 Thermodynamic Properties of PEO-b-P(NIPAAm)
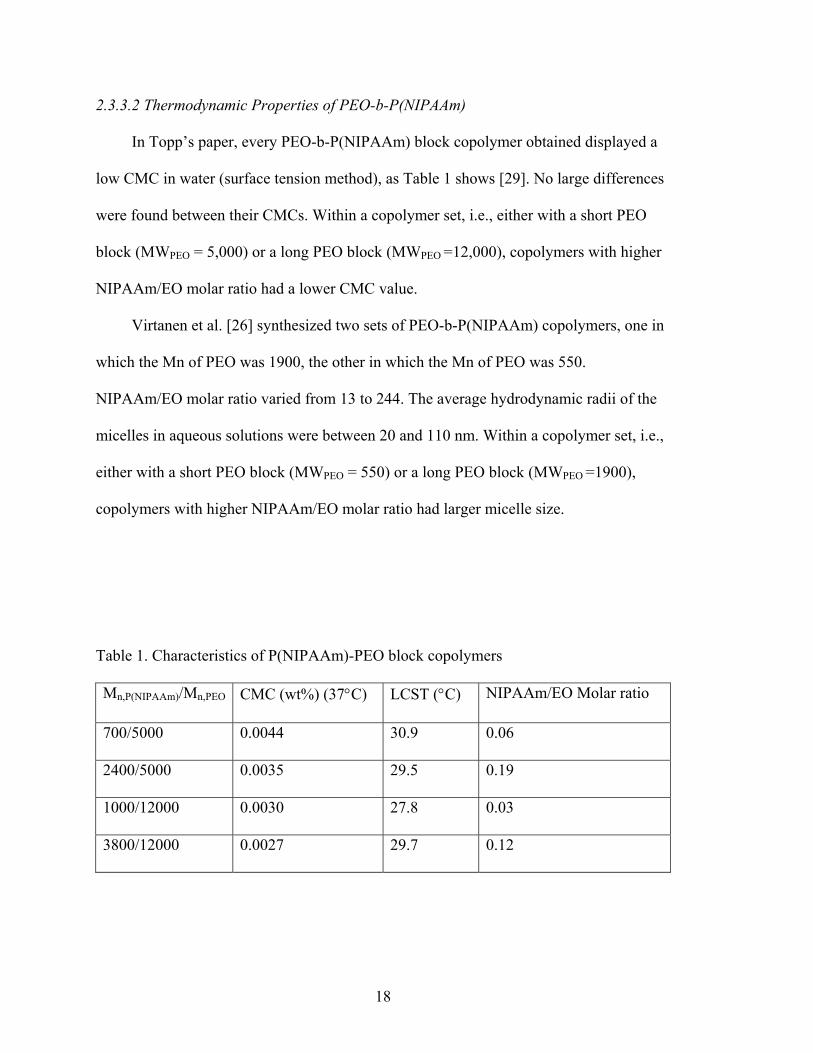
In Topp’s paper, every PEO-b-P(NIPAAm) block copolymer obtained displayed a
low CMC in water (surface tension method), as Table 1 shows [29]. No large differences
were found between their CMCs. Within a copolymer set, i.e., either with a short PEO
block (MWPEO = 5,000) or a long PEO block (MWPEO =12,000), copolymers with higher
NIPAAm/EO molar ratio had a lower CMC value.
Virtanen et al. [26] synthesized two sets of PEO-b-P(NIPAAm) copolymers, one in
which the Mn of PEO was 1900, the other in which the Mn of PEO was 550.
NIPAAm/EO molar ratio varied from 13 to 244. The average hydrodynamic radii of the
micelles in aqueous solutions were between 20 and 110 nm. Within a copolymer set, i.e.,
either with a short PEO block (MWPEO = 550) or a long PEO block (MWPEO =1900),
copolymers with higher NIPAAm/EO molar ratio had larger micelle size.
Table 1. Characteristics of P(NIPAAm)-PEO block copolymers
Mn,P(NIPAAm)/Mn,PEO CMC (wt%) (37°C) LCST (°C) NIPAAm/EO Molar ratio
700/5000 0.0044 30.9 0.06
2400/5000 0.0035 29.5 0.19
1000/12000 0.0030 27.8 0.03
3800/12000 0.0027 29.7 0.12
18
2.4 Poly(ethylene oxide)-b-poly(N-isopropylacrylamide-co-2-hydroxyethyl methacrylate-lactaten) 2.4.1 HEMA-lactaten
2.4.1.1 Lactic Acid
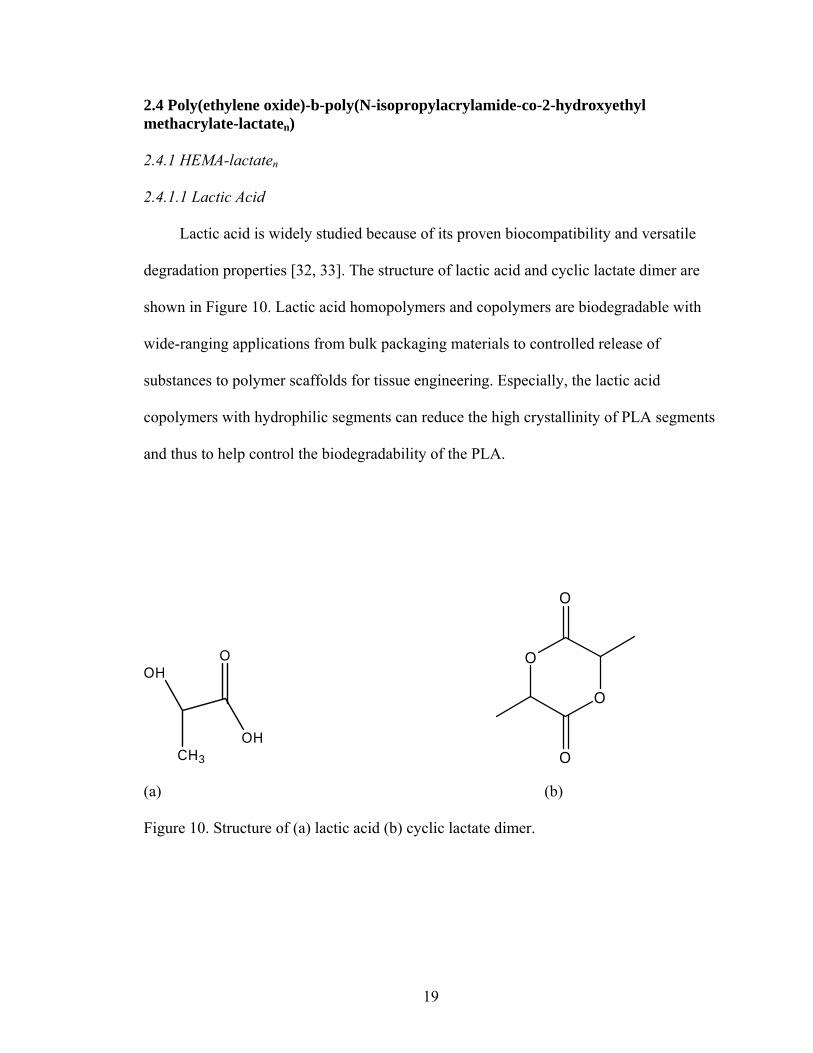
Lactic acid is widely studied because of its proven biocompatibility and versatile
degradation properties [32, 33]. The structure of lactic acid and cyclic lactate dimer are
shown in Figure 10. Lactic acid homopolymers and copolymers are biodegradable with
wide-ranging applications from bulk packaging materials to controlled release of
substances to polymer scaffolds for tissue engineering. Especially, the lactic acid
copolymers with hydrophilic segments can reduce the high crystallinity of PLA segments
and thus to help control the biodegradability of the PLA.
OH
CH3
OH
O
O
O
O
O
(a) (b)
Figure 10. Structure of (a) lactic acid (b) cyclic lactate dimer.
19

2.4.1.2 2-Hydroxyethyl Methacrylate
Biomaterial 2-hydroxyethyl methacrylate (HEMA) and its polymers have been
largely employed in biomedical applications, such as contact lenses and dental materials
[34]. The structure of HEMA is shown in Figure 11. Because of the presence of a
hydroxyl group in the HEMA, various modifications of HEMA can be made using its
primary alcohol while leaving the double bond unchanged, thus providing a wide variety
of HEMA derivatives.
O
O
OH
Figure 11. Structure of 2-hydroxyethyl methacrylate.
2.4.1.3 HEMA-lactaten
It has been reported that hydroxy compounds can form very active initiating
systems for the ring opening polymerization of cyclic lactate dimers in the presence of
stannous octoate. Lactate oligomers were synthesized by initiation from hydroxyethyl
20

methacrylate (HEMA) at 110°C in this way [35, 36]. The reaction mechanism is shown
in Figure 12.
OH
O
O
O OH +
O
O
O
O
Figure 12. Production of HEMA-lactaten.
2.4.2 PEO-poly(NIPAAm-co-HPMAm-lactaten)
In 1999, Neradovic et al. found that poly(NIPAAm-co-HPMAm-lactaten) with
hydrolytically sensitive lactate ester side groups will hydrolyze and convert to
poly(NIPAAm-co-HPMAm) in aqueous solution [37]. Based on this fact, they designed a
novel type of polymeric micelle with PEO-b-poly(NIPAAm-co-HPMAm-lactaten). The
21

synthesis and hydrolysis schemes are shown in Figure 13. Particle sizes of the resulting
micelles were between 154 and 657 nm.
It was reported that the critical micelle temperature (CMT) of PEO-b-
poly(NIPAAm-co-HPMAm-lactaten) at 5 mg ml-1 was lower than the LCST of
P(NIPAAm) (about 30°C) and decreased with increasing HPMAm-lactaten content, while
the CMT of PEO-b-poly(NIPAAm-co-HPMAm) was higher than the LCST of
P(NIPAAm) and increased with increasing the HPMAm content. When the lactate ester
side groups of the copolymers were hydrolyzed in aqueous solution, a gradual increase in
CMT was observed [37].
PEO-b-poly(NIPAAm-co-HPMAm-lactaten) copolymers with their CMTs lower
than 37°C will form micelles at body temperature. Their CMTs will increase because of
the hydrolysis of the lactate ester side groups. Once CMTs of the copolymers are greater
than 37°C, the micelles will dissolve. Therefore the destabilization of the polymeric
micelles can be controlled by manipulating the change in the CMT.
22

HO
O
N
CN
N OH
CN O
+ CH3OO
H
ABCPA PEO
O
O
N
CN
N O
CN O
PEO
PEO
PEO-ABCPA-PEO
DPTSDCC
+NH
O
+
NH
O
O
OH
O
NIPAAm HPMAm-lactaten
n
80 ° C
HO
O
O
n
HN O
x y
CN
HN O
O
O
PEO
poly(NIPAAm-co-HPMAm-lactaten)-b-PEO
23

HO
HN O
x y
CN
HN O
O
O
PEO
poly(NIPAAm-co-HPMAm)-b-PEO
OH
HO
O
O
Figure 13. Synthesis and hydrolysis of poly(NIPAAm-co-HPMAm-lactate). DPTS stands for 4-(dimethylamino)pyridinium-4-toluenesulfonate and DCC stands for N, N-dicyclohexylcarbodiimide.
2.5. Factors Affecting the CMC of Micelles
There are some factors, such as salt and organic molecules, that change the CMC
value of the micelles through the interaction with solvent water. Because these factors
can help to stabilize micelles at lower concentrations, they are discussed below.
24
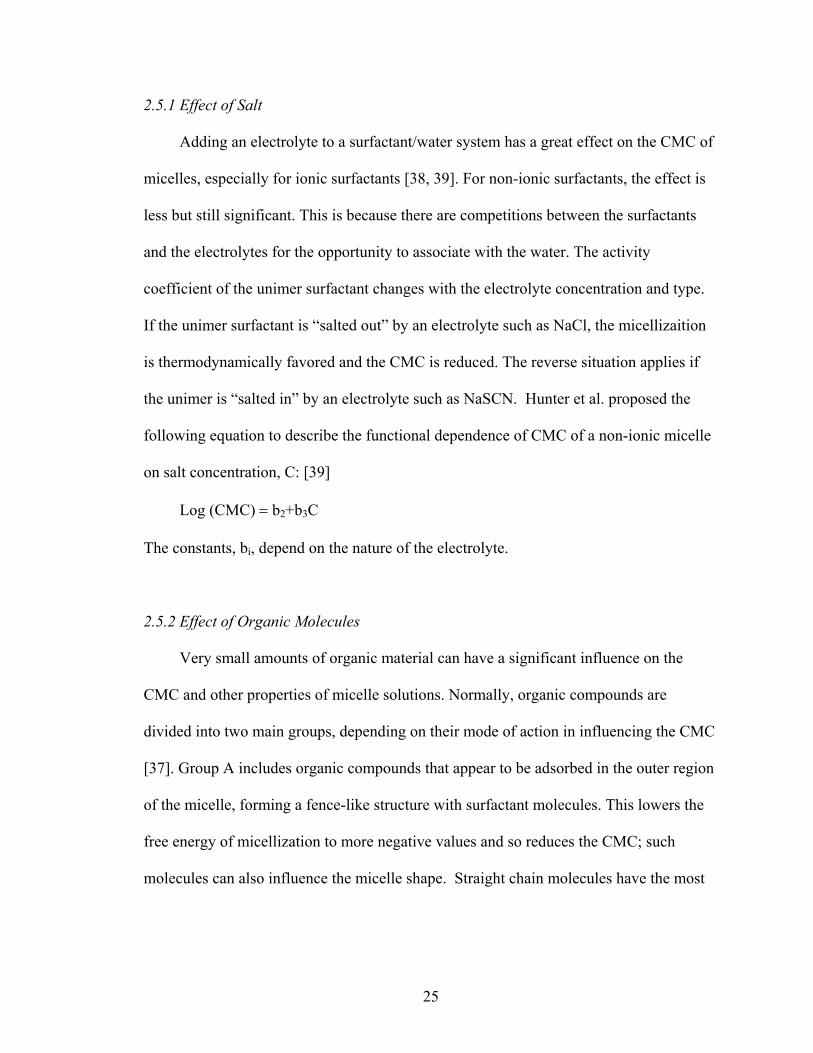
2.5.1 Effect of Salt
Adding an electrolyte to a surfactant/water system has a great effect on the CMC of
micelles, especially for ionic surfactants [38, 39]. For non-ionic surfactants, the effect is
less but still significant. This is because there are competitions between the surfactants
and the electrolytes for the opportunity to associate with the water. The activity
coefficient of the unimer surfactant changes with the electrolyte concentration and type.
If the unimer surfactant is “salted out” by an electrolyte such as NaCl, the micellizaition
is thermodynamically favored and the CMC is reduced. The reverse situation applies if
the unimer is “salted in” by an electrolyte such as NaSCN. Hunter et al. proposed the
following equation to describe the functional dependence of CMC of a non-ionic micelle
on salt concentration, C: [39]
Log (CMC) = b2+b3C
The constants, bi, depend on the nature of the electrolyte.
2.5.2 Effect of Organic Molecules
Very small amounts of organic material can have a significant influence on the
CMC and other properties of micelle solutions. Normally, organic compounds are
divided into two main groups, depending on their mode of action in influencing the CMC
[37]. Group A includes organic compounds that appear to be adsorbed in the outer region
of the micelle, forming a fence-like structure with surfactant molecules. This lowers the
free energy of micellization to more negative values and so reduces the CMC; such
molecules can also influence the micelle shape. Straight chain molecules have the most
25
marked effect. Group A compounds are generally effective at quite low concentrations.
Alcohols with moderate to long hydrocarbon chains belong to this group [39].
Group B materials alter the CMC at higher concentrations and modify the bulk
water structure. Group B material can either be a “structure maker” or a “structure
breaker”. Structure breakers increase the CMC by reducing the amount of water structure
that the hydrophobic part of the surfactant can induce. Structure makers work in a reverse
way. Typical structure breakers are urea and formamide while structure makers are
xylose and fructose [39]
26

CHAPTER 3
RESEARCH OBJECTIVES
To use polymeric micelles as ultrasonic-activated IV administration anti-cancer
drug carriers, they must be less than 150 nm in diameter, must be stable (they must not
dissolve) in the blood for a sufficient amount of time to carry the drug to the desired
target site and must be biodegradable so that it does not build up in the body. The overall
goal of this research was to synthesize and investigate several polymeric micelle systems
that might meet the requirements mentioned above. Micelle sizes, stabilities of the
micelles vs. concentration or time, and the effect of temperature on the stabilities of
micelle systems were to be characterized. The overall goal was divided into the following
four objectives:
1. Improvement on the Plurogel® synthesis.
Because the percentage of the successful Plurogel® synthesis was only about 30%
by simply following Pruitt’s process, one objective of this research was to improve this
percentage. Different polymerization conditions, such as preheating or adding salt, or
alcohols, were to be tried.
2. Synthesis and investigation of temporarily stable polymer micelle system based on
Tetronic®.
Since Tetronic® shares similar chemical features with Pluronic®, it might be
possible to stabilize Tetronic® in micellar form in a similar way. An interpenetrating
network of cross-linked N, N-diethylacrylamide was to be polymerized within the cores
27

of T904 micelles. Different polymerization conditions, such as adding salt and/or
alcohols and preheating, were to be tried.
3. Synthesis and investigation of Temporarily stable polymer micelle system based on
CH3O-poly(ethylene oxide)-b-poly(N-isopropylacrylamide).
a. CH3O-poly(ethylene oxide)-b-poly(N-isopropylacrylamide) was to be
prepared by polymerizing NIPAAm in water solution using MeO-PEO and
Ce(IV) as a initiator system. The polymerization kinetics were to be
characterized.
b. A biodegradable crosslinker, N, N-bis(acryloyl)cystamine (BAC) was to be
copolymerized together with NIPAAm during CH3O-poly(ethylene oxide)-b-
poly(N-isopropylacrylamide) preparation. This would form a crosslinked core
within the micelle and help to stabilize the micelle.
4. Synthesis and investigation of Temporarily stable polymeric micelle system based on
CH3O-poly(ethylene oxide)-b-poly(N-isopropylacrylamide-HEMA-lactaten).
CH3O-poly(ethylene oxide)-b-poly(N-isopropylacrylamide-HEMA-lactaten) was to
be prepared in organic solution via free radical polymerization. The degree of
polymerization of lactate side group and the molar ratio of NIPAAm to HEMA-lactaten to
PEO in polymerization were to be optimized to produce a micelle stable for about 2 days
at 40°C.
28

CHAPTER 4
ANALYTICAL METHODS
4.1 Gel Permeation Chromatography
Molecular weights of the product were determined with gel permeation
chromatography (Waters 515 pump with Styragel® HR 3 column, refractive index
detector Waters 2410 and polystyrene standards) in THF or DMF at a flow rate of 1.0 or
0.5 ml/min. The dried product samples were dissolved in HPLC grade THF or DMF, and
then passed through a 0.2 µm Teflon syringe filter before being injected into the GPC
system. Milleniun32 software was used to control the system and record and analyze data.
4.2 Turbidity or LCST Measurements
Turbidities or LCSTs of the sample solutions were studied with a Beckman Coulter
DU 640 spectrophotometer. Samples were placed in 1 cm x 1 cm cuvettes. Absorption
values of the solutions at 600 nm were recorded and evaluated.
4.3 Dynamic Light Scattering
Particle sizes of the samples in aqueous solution were measured by dynamic light
scattering (DLS) with a Brookhaven 90Plus submicron particle size analyzer.
Measurements were performed at a scattering angle of 90º. The CONTIN algorithm that
gives the intensity distribution was used to analyze data. For each sample, 3
measurements were made and each measurement took 2 minutes. The average count rate
29

of the background was 15 kilo counts per second (kcps), and that of each measurement
was between 200 and 500 kcps.
4.4 Fluorescent Measurement
Anti-cancer drug doxorubicin (DOX) and 1,6-diphenylhexatriene (DPH) are
hydrophobic compounds and have fluorescent emissions at 590 nm and 430 nm
respectively. Their emission intensity depends strongly on the hydrophobicity of the local
environment. DPH has almost no fluorescence in an aqueous solution while it is highly
fluorescent in a hydrophobic environment. DOX has less fluorescence in water than in a
hydrophobic environment. When the probes are mixed with micelle solutions, they are
trapped in the hydrophobic cores of the micelles, and their emission intensities report the
hydrophobic nature of the cores. Once the micelle loses its stability and dissolves, the
probes are released to the aqueous environment and the emission intensity decreases or
goes to zero. Thus we can tell how fast the micelles dissolve.
Stabilities of polymerized systems and microenvironments of the particle cores
were studied using a Perkin-Elmer LS50B luminescence spectrometer with DPH and
DOX as the fluorescent probe. A stock solution of DPH or DOX in tetrahydrofuran
(THF) was added to an empty glass vial, and the THF was evaporated. The polymer
solution with a known concentration was then added to the vial. The vial was left at room
temperature for 0.5 hours to thoroughly dissolve the fluorescent probe. The concentration
of DPH or DOX was 0.1 or 40 µg/ml respectivlely. The solutions were then transferred to
a quartz cuvette and excited at λexcitation = 360 nm for DPH, and λexcitation = 488 nm for
DOX. The emission was measured and recorded by a computer.
30

CHAPTER 5
IMPROVEMENT ON THE PLUROGEL® SYNTHESIS
As mentioned in Chapter 2, Pruitt et al. developed a temporarily stable polymer
micelle system named Plurogel® [5]. For Plurogel®, the average micelle diameters in 1
wt% solutions are smaller than 100 nm and the turbidity of 10 wt% solutions are less than
0.2. Unfortunately, this was not always accomplished. The percentage of the successful
Plurogel® synthesis was only about 30% by simply following Pruitt’s process. Different
polymerization conditions were investigated to improve this percentage.
5.1 Materials
Pluronic® P105 (Mw 6,500) was kindly provided as a gift by BASF. N, N-
dietylacrylamide (NNDEA) was obtained from Polysciences. N, N-
bis(acryloyl)cystamine (BAC) and 2,2’-azobisbutyronitrile (AIBN) were obtained from
Sigma-Aldrich. Fluorescence probe 1,6-diphenyl-1,3,5-hexatriene (DPH) was obtained
from Molecular Probes (Eugene, Oregon). N-butanol was obtained from Mallinckrodt
Baker. Hexanol was obtained from Spectrum Chemical Mfg.. N-octanol was obtained
from Fisher Scientific. All chemicals were used without further purification.
5.2 Polymerization
Polymerization was done in a round bottom flask connected to a water condenser
and a nitrogen purge, as shown in Figure 14. At room temperature, AIBN and BAC were
31

first dissolved in the oily NNDEA monomer in the round bottom flask for 3 hours.
During the same time period, an aqueous solution of 10 wt% P105 was purged with
nitrogen. The solution was then added into the round bottom flask containing the
monomer, initiator and crosslinker, stirred for an hour to allow for dispersing the
compounds into the micelle cores. Then the system was heated up to 65°C for 24 hrs
under nitrogen purge and constant stirring.
Figure 14. Polymerization apparatus.
32

5.3 Analyses
Turbidities of 10 wt% Plurogel® solutions were measured by the spectrophotometer.
Micelle sizes of Plurogel® in 1 and 0.1 wt% aqueous solutions were measured by
DLS at room temperature (about 20°C).
5.4 Improvement Method
Various attempts were made to improve the percentage of the successful synthesis
and the stabilities of the micelles. These are described in the following paragraphs.
5.4.1 Salt and Organic Molecules
5.4.1.1 Adding Salt or Organic Molecules to10 wt% P105 Solutions
As mentioned earlier, salt and organic molecules have an effect on CMC values of
the micelles through the interaction with solvent water. Thus NaCl and one kind of
alcohol (n-butanol, 1-hexanol, n-octanol) at various concentrations were added to the 10
wt% P105 solution. The turbidities of the solutions at polymerization temperature 65°C
and the average diameter of P105 micelles in 10 wt% aqueous solutions were recorded.
At 65°C, the single-phase boundaries of NaCl, n-butanol, 1-hexanol and n-octanol
in 10 wt% P105 aqueous solutions were 0.15 M, 30 µl/ml, 2.5 µl/ml and 0.4 µl/ml
respectively. At this temperature, when concentrations of the salt or alcohols were higher
than these values, the solutions became slightly milky, which is attributed to the
precipitation of the P105.
The average diameter of P105 micelles in 10 wt% aqueous solution decreased from
15.7 nm to 13.3 nm when 0.15 M NaCl was added, and decreased to 12.1 nm when 10
33

µl/ml n-butanol was added. Because the single-phase boundaries of 1-hexanol and n-
octanol in 10 wt% P105 aqueous solutions are very low, no DLS analysis was carried out
with such solutions.
5.4.1.2 Adding Salt and/or Organic Molecules to Polymerization Systems
The main factor that caused the failure of Plurogel® synthesis was that NNDEA
monomers polymerized in aqueous phase instead inside the P105 micelle core. Results in
the above section showed that a suitable amount of NaCl or alcohols helped to decrease
micelle sizes. This might lead to a denser micelle core, thereby helping to trap monomers,
initiators and crosslinkers into the core better to polymerize an interpenetrating polymer
network.
N-butanol at various concentrations and 0.15 M NaCl were added to the
polymerization system before polymerization. The solution was then stirred for 30 mins
without purging. It was polymerized at 65°C for 24 hours. The turbidities of the product
solutions are shown in Table 2. The lowest turbidity value, which was 0.1713, was
obtained when a combination of 0.15 M NaCl and 10 µl/ml n-butanol was added to the
P105 solution. The reason for this might be that when the n-butanol concentration was
lower than 10 µl/ml, the alcohol concentration was not high enough to make the cores of
the micelles tight, some NNDEA monomers were not trapped into the cores of micelles
but reacted in the aqueous phase instead, thus the turbidity of the solution was increased
because of the hydrophobic P(NNDEA) outside of the micelle. When the n-butanol
concentration was higher than 10 µl/ml, it was possible that the alcohol caused the
34

micelles to form large aggregates, and these aggregates were stabilized during the
polymerization, thus increased the turbidity of the solution.
The DLS analysis showed that the diameter of the micelle from the product
solutions with lowest turbidity was 81.9 nm in 1 wt% solution, which is suitable for our
application.
Table 2. Turbidities of 10% product solutions with different n-butanol concentrations in the polymerization systems. n-butanol concentration in polymerization system (µl/ml)
Turbidity of 10 wt% product solution.
5 1.2269 ± 0.0002
10 0.1713 ± 0.0001
15 0.4414 ± 0.0001
20 1.2610 ± 0.0002
25 2.0450 ± 0.0002
5.4.2 Preheating Process
In this improvement method, the 10 wt% P105 solution was purged under nitrogen
for 2 hours and then preheated at 35°C for 0.5 hour. Required amounts of initiator,
monomer, crosslinker, NaCl and n-Butanol were then added to the solution. The solution
was heated at 35°C for another 0.5 hour. Then the whole system was heated up to 65°C
35

to complete the polymerization. Compared to the polymerization without preheating,
preheating the solution helped to increase the percentage of the successful Plurogel®
synthesis from around 30 % to around 60 %. This might be because preheating improved
the dispersing of the monomers.
5.4.3 Summary
Summarizing all the successful techniques discussed above that increased the
percentage of the successful Plurogel® synthesis, an improved polymerization process
was described as follows:
The polymerization was done in a round bottom flask connected to a water
condenser and a nitrogen purge, as shown in Figure 14. At room temperature, AIBN and
BAC were first soaked in the oily NNDEA monomer phase in the round bottom flask for
3 hours. During the same time period, an aqueous solution of 10 wt% P105 was purged
under nitrogen for 2.5 hours and then preheated at 35°C for 0.5 hour. The solution was
then poured into the round bottom flask containing the monomer, initiator and
crosslinker. NaCl (0.15 M) and n-butanol (10 µl/ml) were then added into the solution.
The solution was stirred at 35°C for another 0.5 hour under nitrogen purging (or till all
the solid dissolved). Then the system was heated up to 65°C for 24 hrs under nitrogen
purging and constant stirring.
36

CHAPTER 6
TEMPORARILY STABLE POLYMERIC MICELLE SYSTEM BASED ON TETRONIC®
6.1 Materials
Tetronic® T904 (Mw 6,700) and Tetronic® T704 (Mw 5,500) were kindly provided
as a gift by BASF. N, N-dietylacrylamide (NNDEA) was obtained from Polysciences. N,
N-bis(acryloyl)cystamine (BAC) and 2,2’-azobisbutyronitrile (AIBN) were obtained
from Sigma-Aldrich. Fluorescence probe 1,6-diphenyl-1,3,5-hexatriene (DPH) was
obtained from Molecular Probes (Eugene, Oregon). N-butanol was obtained from
Mallinckrodt Baker. Hexanol was obtained from Spectrum Chemical Mfg. N-octanol was
obtained from Fisher Scientific. All chemicals were used without further purification.
6.2 Polymerization
The polymerization apparatus was the same as that used in Plurogel®
polymerization. At room temperature, AIBN and BAC were first soaked in the oily
NNDEA monomer phase in the round bottom flask for 3 hours. During the same time
period, an aqueous solution of 10, 20 or 30 wt% Tetronic® (T904 or T704) was purged
with nitrogen. The solution was then added into the round bottom flask containing the
monomer, initiator and crosslinker. NaCl (0.15 M) and n-butanol (10 µl/ml) were added
at the same time. The solution was stirred for an hour to disperse the compounds into the
37

micelle cores followed by a preheating process at 35°C for 0.5 hour. The whole system
was then heated up to 65°C and polymerized for 24 hours under nitrogen atmosphere and
constant stirring.
Polymerization was also carried out in the solution with its pH value adjusted to 10.
6.3 Analyses
T904 aqueous solutions with different concentrations (1 wt% or 10 wt%) were
studied. NaCl was added into the 1 wt% or 10 wt% T 904 solutions with its
concentrations varying from 0.1 M to 3 M. N-butanol, 1-hexanol or n-octanol was added
into the 10 wt% T904 solutions with alcohol concentrations varying from 0.1 M to 0.4 M.
Micelle sizes were also measured with pH values of the solution varying from 5.1 to 12.3.
Turbidities of the polymerization systems and micelle sizes were characterized at
room temperature and 65°C by spectrophotometer.
The critical micelle concentration of T904 and T704 and stabilities of polymerized
Tetronic® systems were studied by fluorescent measurement.
6.4 Results
6.4.1 The Effects of NaCl, Alcohols and pH on T 904 Micellization
6.4.1.1 NaCl
At room temperature, the single-phase boundaries of NaCl in the 10 wt% or 1 wt%
T904 aqueous solution were 3 M and 1 M respectively. When concentrations of the salt
were higher than these values, the solutions became noticeably more viscous. At 65°C,
the single-phase boundary of NaCl in the 10 wt% T904 aqueous solution was 0.15 M.
38

When concentrations of the salt were higher than these values, the solutions became
slightly milky. At the same temperature, the average diameter of the non-stabilized T904
micelles in 10 wt% aqueous solution decreased from 23.1 nm to 16.4 nm when 0.15 M
salt was added.
6.4.1.2 Alcohols
At room temperature, the single-phase boundaries of n-butanol, 1-hexanol and n-
octanol in the 10 wt% T904 solution were 200 µl/ml, 20 µl/ml and 10 µl/ml respectively.
When concentrations of alcohols were higher than these values, the solutions became
noticeably more viscous. At 65°C, the single-phase boundaries of n-butanol and 1-
hexanol in the 10 wt% T904 solution were 30 µl/ml and 5 µl/ml respectively. When
concentrations of alcohols were higher than this, the solutions became milky. At the same
temperature, the average diameter of the T904 micelles in 10 wt% aqueous solution
decreased from 23.1 nm to 16.4 nm when 10 µl/ml n-butanol was added.
The above results showed that a suitable amount of NaCl or alcohols helped to
decrease the micelle size. This might lead to a denser micelle core, and thus will help to
trap monomers, initiators and crosslinkers into the core better to polymerize an
interpenetrating polymer network to create a stable micelle.
6.4.1.3 pH Value
Tetronic® molecules have tertiary amines in their center (see Figure 7), which
remain in the cores of the micelles. Changing pH values of the solutions might have an
39

effect on the protonation of the amines and thus change diameters of the micelles
eventually.
At room temperature, 10 wt% T904 aqueous solution did not form micelles in
acidic environment, but formed micelles with their diameter around 12 nm when the pH
value of the solution was higher than 7. These results show that at room temperature, the
pH values of the solutions change CMCs of the copolymers and sizes of the micelles. The
chemical structure of the center of Tetronic® is similar to methyldiethanolamine
(MDEA). It was reported that the pK value of MDEA was 8.56 at 25°C [40]. In acidic
environment, the tertiary amines in the center of Tetronics® might be protonated and thus
can not form micelles.
It was reported that the pK value of MDEA was 8.07 at 50°C and was 7.64 at 70°C
[40]. Although these pK values are still higher than 7, 10 wt% T904 aqueous solution
formed micelles with their diameter around 20 nm in acidic, neutral and basic
environment at 65°C. These results show that the pH value has a less important effect in
the micellization of Tetronics® compared to temperature.
6.4.2 Temporarily Stable Polymeric Micelle System Based on Tetronic®
Tetronic® has similar chemical properties as Pluronic®, and might be stabilized in a
similar way: a cross-linked, interpenetrating polymer network of NNDEA was used in an
attempt to stabilize the micelles at concentrations below CMC.
Polymerizations were conducted in 10, 20, 30 wt% solutions of Tetronic® T904 or
T704, which were used because they have similar PO/EO molar ratios and molecular
weights as P105. In each polymerization, NNDEA concentration varied from 0.5 wt% to
40

1.0, 1.5 wt% of the solution. The molar ratio of initiator AIBN to NNDEA and
crosslinker BAC to NNDEA was kept at 1:100 and 50:100 respectively. Concentrations
of NaCl and n-butanol in the polymerization system were varied to improve the stability
of the micelle.
Turbidities of the polymerized T904 and T704 systems in neutral environment and
T904 systems in basic environment with its pH value equal to 10 were over 0.8 compared
to standard Plurogel® (based on P105) which has a turbidity of about 0.2. Fluorescence
measurement results showed that CMCs of polymerized T904 systems were still higher
than 1 wt%. These results showed that Tetronic® micelles could not be stabilized in this
way. This might be because the core of Tetronic® micelle was not very dense, and much
of the NNDEA polymerized in water phase instead of in the core of the micelle.
41

42
CHAPTER 7
TEMPORARILY STABLE POLYMERIC MICELLE SYSTEM BASED ON CH3O-POLY(ETHYLENE OXIDE)-
B-POLY(N-ISOPROPYLACRYLAMIDE) 7.1 Materials
Methoxypoly(ethylene oxide) (Mw 2,000), N-isopropylacrylamide, ammonium
cerium nitrate and N,N-bis(acryloyl)cystamine were obtained from Sigma-Aldrich and
used without further purification. Doxorubicin hydrochloride was obtained from
Pharmacia & Upjohn Company, Kalamazoo MI in dosage form, which is one part DOX
and 5 parts lactose. Fluorescence probe 1,6-diphenyl-1,3,5-hexatriene was obtained from
Molecular Probes (Eugene, Oregon). Pluronic® P105 was kindly provided by BASF
Corp, NJ.
7.2 CH3O-poly(ethylene oxide)-b-poly(N-isopropylacrylamide) Copolymer
7.2.1 Polymer Synthesis and Purification
Polymerization was carried out according to the procedure described by Topp et al.
[29]. In a round bottom flask connected to a water condenser, 10 ml double-distilled
water was heated to 60°C and purged with nitrogen for two hours to remove oxygen.
Subsequently, 1 g methoxypoly(ethylene oxide) (MeO-PEO) and the required amount of
N-isopropylacrylamide (NIPAAm) were added. When the polymer and monomer were
43

dissolved, ammonium cerium nitrate, which would react with MeO-PEO to form free
radicals, in 4 ml of 1 M nitric acid was added. The molar ratio of Ce(IV) to PEO varied
from 0.15:1 to 1.2:1. After 4 hours of reaction, the solution was cooled to room
temperature and 1 M NaOH solution was added to precipitate out the cerium salts [29].
The clear polymer solution was vacuum dried and the precipitate redissolved in
chloroform. The chloroform solution was then poured in diethylether/hexane (ratio 1/1,
v/v) to precipitate the final product.
7.2.2 Analyses
Molecular weights of the copolymer products were determined with gel permeation
chromatography [28].
Micelle sizes of the products in aqueous solution were measured by DLS at 40°C.
UV absorption of Ce(IV), Ce(III), PEO/Ce(IV) were measured with a Beckman
Coulter DU 640 spectrophotometer at reaction temperature.
Turbidities of the P(NIPAAm) and polymerization solutions were measured by the
same spectrophotometer.
7.2.3 Results
7.2.3.1 Polymerization Kinetics
7.2.3.1.1 Proposed Polymerization Mechanisms
There are no detailed reports published on the polymerization mechanism of this
particular reaction. Based on literature discussing similar reactions, the following free
radical polymerization mechanism is proposed:
44
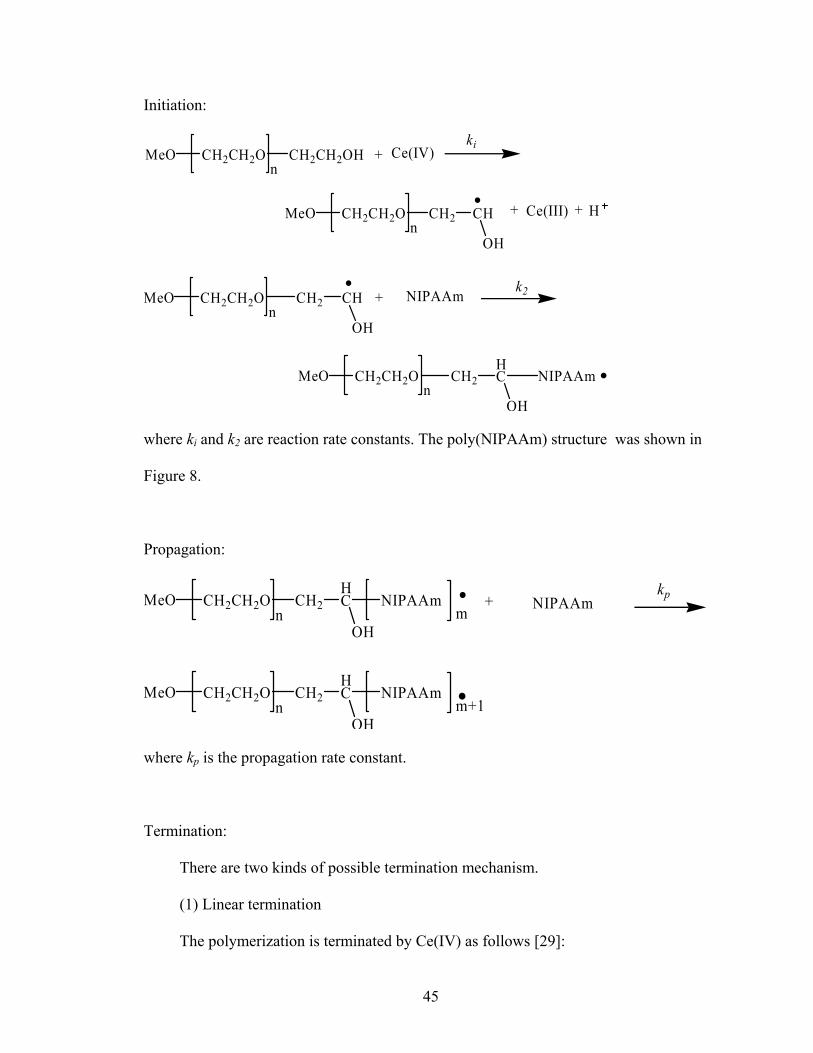
Initiation:
MeO CH2CH2O CH2CH2OHn
Ce(IV)
+ Ce(III) + H
+
MeO CH2CH2O CH2n
CH
OH
MeO CH2CH2O CH2n
HC
OH
NIPAAm
+MeO CH2CH2O CH2n
CH
OH
NIPAAm
ki
k2
where ki and k2 are reaction rate constants. The poly(NIPAAm) structure was shown in
Figure 8.
Propagation:
+MeO CH2CH2O CH2n
HC
OH
NIPAAm NIPAAmm
MeO CH2CH2O CH2n
HC
OH
NIPAAmm+1
kp
where kp is the propagation rate constant.
Termination:
There are two kinds of possible termination mechanism.
(1) Linear termination
The polymerization is terminated by Ce(IV) as follows [29]:
45

Ce(IV)+
+ Ce(III) + HMeO CH2CH2O CH2n
CH
OH
kt
m-1 CH
CO
HN
CH
H3C CH3
NIPAAm CH
MeO CH2CH2O CH2n
CH
OHm-1 CH
CO
HN
CH
H3C CH3
NIPAAmH2C
where kt is reaction constant. This linear termination results in a diblock copolymer with
unstauration on the terminal NIPAAm moiety.
(2) Coupling termination
Topp et al. reported that the copolymerization of PEO-b-PNIPAm with the method
mentioned above is a quasi-living polymerization of NIPAAm as the radicals survive
inside the micellar core [28]. If so, this would lead to a coupling termination mechanism:
MeO CH2CH2O CH2n
HC
OH
NIPAAm2
MeO CH2CH2O CH2n
HC
OH
NIPAAm
NIPAAmHC
H2C OCH2CH2 OMe
n
kt2
m
m
OHm
46

where kt2 is reaction constant. This method of termination would produce a triblock
copolymer with a structure similar to Pluronic® (see Chapter 1) with PEO chains flanking
the P(NIPAAm) midsection.
7.2.3.1.2 Rate of Polymerization and Kinetic Chain Length
According to classical kinetic modeling of free radical polymerization, the rate of
polymerization, Rp, is equal to dtMd ][
− , where [M] is the monomer concentration and t is
time; the kinetic chain length, νn, is defined as the rate of monomer consumption per rate
of radical formation [41].
Based on the polymerization mechanism proposed in Section 7.2.3.1.1, Rp and νn of
the product could be calculated in following way:
(1) We assume that quasi-steady state is reached with respect to the PEO free
radicals,
0][=
•dt
PEOd ,
where [PEO•] is the concentration of the PEO free radical.
A material balance on [PEO•] gives
0][]][[)](][[ 2 =•
=•−dt
PEOdNIPAAmPEOkIVCePEOki (7.1)
where [PEO] is the concentration of unreacted polymer PEO,
[Ce(IV)] is the concentration of the Cerium ions, and
[NIPAAm] is the concentration of NIPAAm monomer.
47

(2) For PEO-P(NIPAAm) free radicals, we assume that quasi-steady state is reached,
0][=
•dt
P(NIPAAm)PEOd - ,
where [PEO-P(NIPAAm)•] is the concentration of the PEO-P(NIPAAm) free radical.
(3) If linear termination (the polymerization is terminated by Ce(IV)) dominates, a
material balance on [PEO-P(NIPAAm)•] gives
0][])][([]][[2 =•
=•−•dt
P(NIPAAm)PEOdP(NIPAAm)PEOIVCekNIPAAmPEOk --t (7.2)
Combining Equations 7.1 and 7.2 gives
)](][[]][[)](][[ 2 IVCeP(NIPAAm)PEOkNIPAAmPEOkIVCePEOk -ti •=•= (7.3)
t
i
kPEOk
P(NIPAAm)PEO-][
][ =• (7.4)
Thus
t
ippp k
NIPAAmPEOkkNIPAAmP(NIPAAm)PEOk
dtMdR -
]][[]][[][=•=−= (7.5)
νn = )]([
][)](][[ IVCek
NIPAAmkIVCePEOk
R
t
p
i
p = (7.6)
(4) If the polymerization is terminated by free radical coupling, a material balance on
[PEO-P(NIPAAm)•] gives
0][][]][[ 222 =
•=•−•
dtP(NIPAAm)PEOdP(NIPAAm)PEOkNIPAAmPEOk -
-t (7.7)
Combining Equations 7.1 and 7.7 gives
48

222 ][]][[)](][[ •=•= P(NIPAAm)PEOkNIPAAmPEOkIVCePEOk -ti (7.8)
21
2
))](][[
(][t
i
kIVCePEOk
P(NIPAAm)PEO- =• (7.9)
Thus
21
2
))](][[
]([]][[t
ippp k
IVCePEOkNIPAAmkNIPAAmP(NIPAAm)PEOkR - =•= (7.10)
νn = 21
2 ]))][([(
][)](][[
PEOIVCekk
NIPAAmkIVCePEOk
R
it
p
i
p = (7.11)
Nagarajan et al. reported that there might be a side reaction that consumes PEO
free radical [42]:
PEO + Ce(IV) Oxidative product + Ce(III) + Hk0
where k0 is reaction constant and the oxidative product might be aldehyde-ended PEO.
Considering this reaction, Rp and νn of the product could be calculated as follows:
(1) We assume again that quasi-steady state is reached with respect to the PEO free
radicals,
0][=
•dt
PEOd .
A material balance on [PEO•] gives
0][)](][[]][[)](][[ 02 =•
=•−•−dt
PEOdIVCePEOkNIPAAmPEOkIVCePEOki (7.12)
Thus
49

)]([][)](][[
][02 IVCekNIPAAmkIVCePEOk
PEO i
+=• (7.13)
(2) If linear termination (the polymerization is terminated by Ce(IV)) dominates,
combining Equations 7.13 and 7.2 gives
)])([][(]][[
][02
2
IVCekNIPAAmkkPEONIPAAmkk
P(NIPAAm)PEOt
i-+
=• (7.14)
Thus
)])([][(][][
02
22
IVCekNIPAAmkkPEONIPAAmkkk
Rt
ipp += (7.15)
νn = )])([][)](([
][
02
22
IVCekNIPAAmkIVCekNIPAAmkk
t
p
+ (7.16)
(3) If the polymerization is terminated by free radical coupling, combining Equations
7.13 and 7.7 gives
21
022
2 ))])([][()](][][[
(][IVCekNIPAAmkkIVCePEONIPAAmkk
P(NIPAAm)PEOt
i-+
=• (7.17)
Thus
21
0221
2
21
23
2/12
)])([][(
)])(][([][)(
IVCekNIPAAmkk
IVCePEONIPAAmkkkR
t
ipp
+= (7.18)
νn = 21
21
0221
2
23
2/12
)])(][([)])([][(
][)(
IVCePEOIVCekNIPAAmkk
NIPAAmkkk
t
ip
+ (7.19)
50
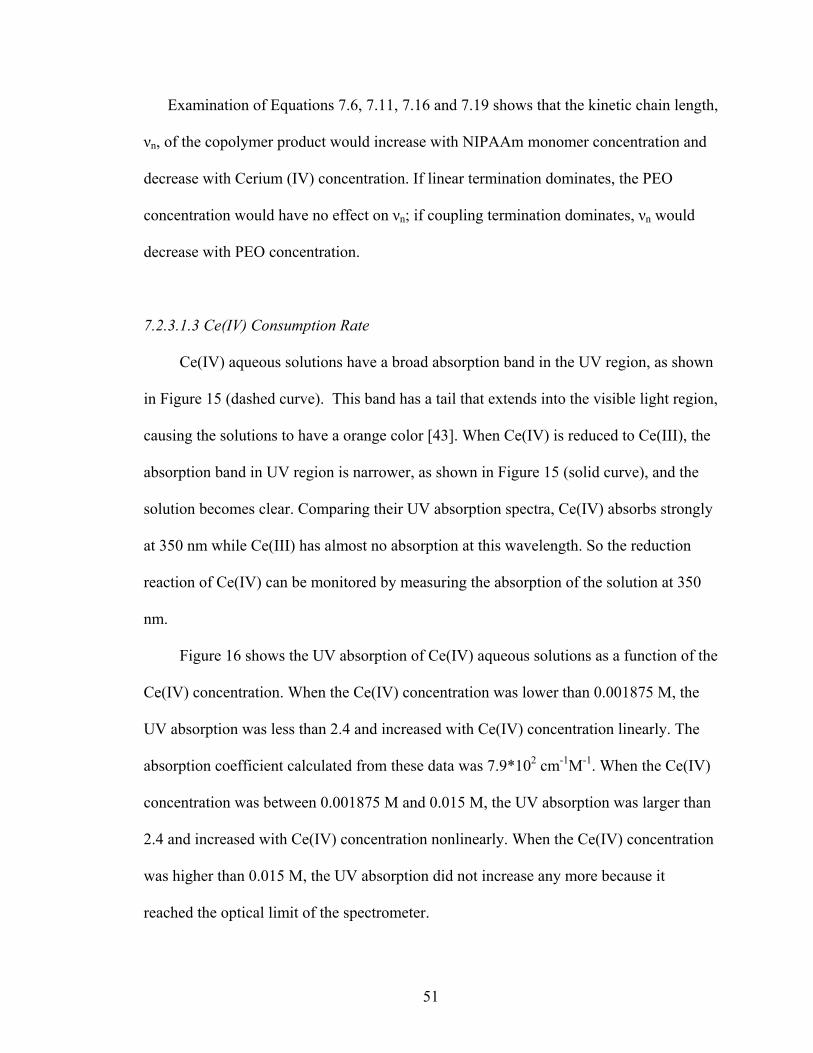
Examination of Equations 7.6, 7.11, 7.16 and 7.19 shows that the kinetic chain length,
νn, of the copolymer product would increase with NIPAAm monomer concentration and
decrease with Cerium (IV) concentration. If linear termination dominates, the PEO
concentration would have no effect on νn; if coupling termination dominates, νn would
decrease with PEO concentration.
7.2.3.1.3 Ce(IV) Consumption Rate
Ce(IV) aqueous solutions have a broad absorption band in the UV region, as shown
in Figure 15 (dashed curve). This band has a tail that extends into the visible light region,
causing the solutions to have a orange color [43]. When Ce(IV) is reduced to Ce(III), the
absorption band in UV region is narrower, as shown in Figure 15 (solid curve), and the
solution becomes clear. Comparing their UV absorption spectra, Ce(IV) absorbs strongly
at 350 nm while Ce(III) has almost no absorption at this wavelength. So the reduction
reaction of Ce(IV) can be monitored by measuring the absorption of the solution at 350
nm.
Figure 16 shows the UV absorption of Ce(IV) aqueous solutions as a function of the
Ce(IV) concentration. When the Ce(IV) concentration was lower than 0.001875 M, the
UV absorption was less than 2.4 and increased with Ce(IV) concentration linearly. The
absorption coefficient calculated from these data was 7.9*102 cm-1M-1. When the Ce(IV)
concentration was between 0.001875 M and 0.015 M, the UV absorption was larger than
2.4 and increased with Ce(IV) concentration nonlinearly. When the Ce(IV) concentration
was higher than 0.015 M, the UV absorption did not increase any more because it
reached the optical limit of the spectrometer.
51

-1.0000-0.50000.00000.50001.00001.50002.00002.50003.00003.50004.00004.5000
150.0 250.0 350.0 450.0 550.0 650.0 750.0
wave length (nm)
UV-v
is a
bsor
btio
n
Figure 15. The light absorption spectrum of Ce(IV) (dashed curve) and Ce(III) (solid curve) at 60°C.
0
0.5
1
1.5
2
2.5
3
3.5
4
4.5
5
0 0.01 0.02 0.03 0.04 0.05 0.06 0.07
Ce(IV) concentration (M)
UV
abso
rptio
n
Figure 16. The UV absorption of Ce(IV) aqueous mixture as a function of Ce(IV) concentration at 350 nm. Data were recorded at 60°C. Data points are n = 3, and error bars are smaller than the symbol.
52
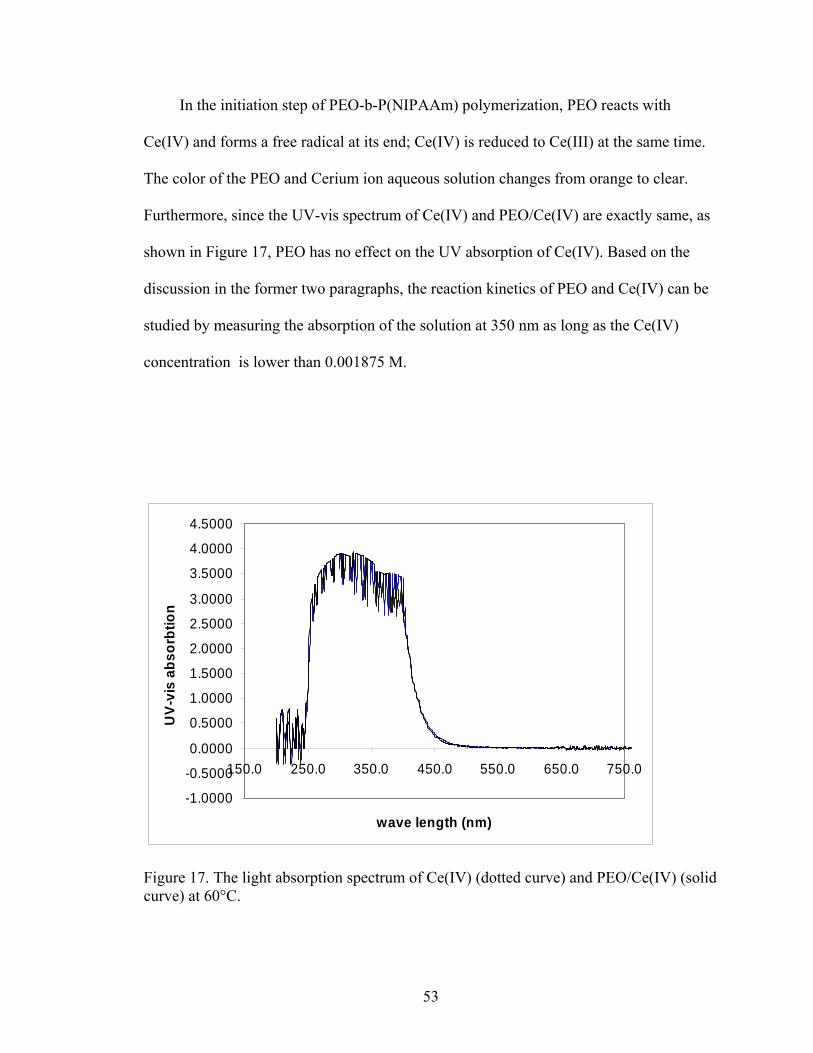
In the initiation step of PEO-b-P(NIPAAm) polymerization, PEO reacts with
Ce(IV) and forms a free radical at its end; Ce(IV) is reduced to Ce(III) at the same time.
The color of the PEO and Cerium ion aqueous solution changes from orange to clear.
Furthermore, since the UV-vis spectrum of Ce(IV) and PEO/Ce(IV) are exactly same, as
shown in Figure 17, PEO has no effect on the UV absorption of Ce(IV). Based on the
discussion in the former two paragraphs, the reaction kinetics of PEO and Ce(IV) can be
studied by measuring the absorption of the solution at 350 nm as long as the Ce(IV)
concentration is lower than 0.001875 M.
-1.0000
-0.5000
0.0000
0.5000
1.0000
1.5000
2.0000
2.5000
3.0000
3.5000
4.0000
4.5000
150.0 250.0 350.0 450.0 550.0 650.0 750.0
wave length (nm)
UV-
vis
abso
rbtio
n
Figure 17. The light absorption spectrum of Ce(IV) (dotted curve) and PEO/Ce(IV) (solid curve) at 60°C.
53

UV absorptions of PEO/Ce(IV) aqueous mixtures as a function of time on a semi-
log-scale are shown in Figure 18. PEO concentrations were the same for all four curves
and equal to that in the polymerization, which was 0.05 M. Ce(IV) concentrations were
0.015 M, 0.0075 M, 0.00375 M and 0.001875 M respectively, so molar ratios of Ce(IV)
to PEO were 0.3:1, 0.15:1, 0.075:1, 0.0375:1. When the UV absorption was greater than
2.4, the UV absorption did not increase with Ce(IV) concentration linearly (see Figure
16). So any UV absorption that was above 2.4 in Figure 18 (within the boxed area) was
ignored. Figure 18 shows that Ce(IV) concentration decreased gradually and linearly on a
semi-log-scale with time. According to the reaction between PEO and Ce(IV) proposed
in the Section 7.2.3.1.1, this indicates that PEO free radicals were not produced all at
once. Because the PEO free radical is not resonance stabilized, its reactivity is high [44].
Our assumption in Section 7.2.3.1.2 is reasonable that the PEO free radical would react
quickly and establish a quasi-steady state concentration.
54

0.01
0.1
1
10
0 5 10 15 20 25
time (min)
UV
abso
rbtio
n
Figure 18. The UV absorption of PEO/Ce(IV) aqueous mixture as a function of time at 350 nm. PEO concentrations were 0.05 M for all four curves. Solid, dashed, dotted and double-dashed lines represent data of solutions at which Ce(IV) concentration equal to 0.015 M, 0.0075 M, 0.00375 M and 0.001875 M respectively. Data were recorded at 60°C. For UV absorption greater than 2.4, UV absorption was not proportional to Ce(IV) concentration and was ignored (data within the boxed area).
Nagarajan et al. reported the kinetics of the reaction between Ce(IV) and PEO using
the ferrous-ion-titration method [42]. They found that Ce(IV) consumption rate increased
with the first power of Ce(IV) concentration and PEO concentration.
(1) If this is the case, the Ce(IV) consumption rate can be written as
])][([)]([ PEOIVCekdt
IVCedce−= (7.20)
where kce is the rate constant.
55

(2) A material balance on unreacted PEO based on the reaction between PEO and
Ce(IV) proposed in Section 7.2.3.1.1 gives
)])([)](([][][ 00 IVCeIVCePEOPEO −−= (7.21)
where [PEO]0 and [Ce(IV)]0 are initial concentrations of PEO and Ce(IV), respectively.
They have the following relationship:
mIVCe
PEO 00
)]([][ = (7.22)
where m is the molar ratio of Ce(IV) to PEO, and is equal to 0.3, 0.15, 0.075 and 0.0375
respectively for each curve in Figure 18.
Combining Equations 7.22 and 7.21 gives
)])([)](([)]([
][ 00 IVCeIVCe
mIVCe
PEO −−= (7.23)
(3) Combining Equations 7.23 and 7.20 gives
)]))([)](([)]([
)](([)]([0
0 IVCeIVCemIVCe
IVCekdt
IVCedce −−−= (7.24)
Rearranging Equation 7.24 gives
dtkIVCeIVCe
mIVCe
IVCe
IVCedce−=
−− )]))([)](([)]([
)](([
)]([
00
(7.25)
Integrating on both sides of Equation 7.25 gives
tktkIVCeIVCe
mIVCe
IVCe
IVCedce
t
ce
Ce
Ce
==−−
− ∫∫0
}[
][0
00 )]))([)](([
)]([)](([
)]([ (7.26)
Equation 7.26 shows if we plot the left side of the equation vs. time, a straight line should
be obtained with kce equal to the slope of the line.
56

Figure 19 shows numerical integration of the left side of Equation 7.26 as a function
of time by using data in Figure 18. Four fairly linear plots were obtained with similar
slopes for times greater than 8 minutes. This suggests the Ce(IV) consumption rate did
increase with the first power of Ce(IV) concentration and PEO concentration. A linear
regression of each data set in Figure 19 gave an average slope, equal to kce, of 6.36, 5.45,
5.02 and 5.09 respectively. Thus the mean and standard deviation value of kce was 5.48 ±
0.53. The standard deviation of these data was not small (about 10% of the mean value).
This large standard deviation might be because all reactions happened in cuvettes without
stirring. Thus temperature and concentration inside cuvettes might not be uniform,
leading to an uneven reaction rate.
020406080
100120
0 5 10time (min)
left
side
of E
quat
ion
7.26
15
Figure 19. The left side of Equation 7.26 as a function of time. Diamonds, triangles, squares and bars represent data of solutions for Ce(IV) concentrations equal to 0.015 M, 0.0075 M, 0.00375 M and 0.001875 M respectively.
57

7.2.3.1.4 Polymerization Kinetic Investigation
The discussion in Section 7.2.3.1.3 was of the reduction of Ce(IV) by PEO in the
absence of NIPAAm monomer. When monomer was present, the solution turned from
orange to white and thus the change in UV absorption at 350 nm could not be monitored.
Instead, the solution turbidity at 600 nm was recorded to investigate polymerization
kinetics.
First, the turbidity of P(NIPAAm) aqueous solution as a function of the
P(NIPAAm) concentration at 60°C was measured. A similar curve as shown in Figure 17
was obtained. When the P(NIPAAm) concentration was lower than 0.375 wt%, the
turbidity was less than 2.5 and increased with P(NIPAAm) concentration linearly. When
the P(NIPAAm) concentration was higher than 0.375 wt%, the solution turbidity was
larger than 2.5 and increased with P(NIPAAm) concentration nonlinearly.
The turbidity of the polymerization system as a function of time at 60°C is shown in
Figure 20. Because the turbidity does not increase with P(NIPAAm) concentration
linearly when the P(NIPAAm) concentration was higher than 0.375 wt%, any turbidity
that was above 2.5 in Figure 20 (within the boxed area) was ignored. As we can see, it
took about 12 minutes for the turbidity of the solution began to increase, which means
PEO-b-P(NIPAAm) micelles commenced formation at this time. This was longer than the
report of Topp et al., who indicated that at about 12 minutes the polymerization solution
began turning white in their reaction [28]. This might be because the NIPAAm monomer
concentration in Topp’s experiments (1.7 M) was higher than that in my experiments
(0.75 M). According to Equations 7.5, 7.10, 7.15, and 7.18, the rate of polymerization
should increase with NIPAAm concentration.
58

-0.5
0
0.5
1
1.5
2
2.5
3
3.5
0 10 20 30 40 50
time (min)
Turb
idity
Figure 20. The turbidity of the polymerization system as a function of time at 60°C. Squares represent data with Ce(IV):PEO = 1.2:1 mol/mol. Triangles represent data with Ce(IV):PEO = 0.9:1 mol/mol. Data within the boxed area is not proportional to P(NIPAAm) concentration. For turbidities greater than 2.4, the turbidity was not proportional to P(NIPAAm) concentration and was ignored (data within the boxed area). Data points are n = 3, and error bars are smaller than the symbols.
7.2.3.2 Purification Improvement
Polymerization was carried out as described in Section 7.2.1. Molecular weight of
final product was determined by gel permeation chromatography (GPC). In the GPC
spectrum of the final product, the peak at 9 minutes is assigned to PEO. As shown in
Figure 21, there was a lot of unreacted PEO left in the final product obtained from the
chloroform-diethylether/hexane precipitation process. This means the side reaction of
PEO and Ce(IV) mentioned in Section 7.2.3.1.2 may be occurring.
59

Figure 21. GPC data of the product obtained from the chloroform-diethylether/hexan precipitation process. Numbers 43973 and 1892 were calculated peak molecular weights of the final product and unreacted PEO.
60

Eliassaf reported that poly(NIPAAm) could be precipitated from its acetone
solution by adding an equal volume of water [45]; thus an acetone-water precipitation
process was carried out to remove unreacted PEO. Instead of dissolving the reaction
product in chloroform, the polymer was vacuum dried and then dissolved in acetone. The
acetone solution was then poured in double-distilled water to precipitate out the final
product. An independent experiment showed that unreacted PEO would not precipitate
out from its aqueous-acetone solution with the acetone concentration between 0 and 80
wt%. GPC data of the final product obtained from this purification method are shown in
Figure 22. The unreacted PEO peak decreased dramatically following the water
precipitation.
In another paper published by Topp et al. in 2000, they used an ultracentrifugation
method to separate unreacted PEO [28]. In this work at BYU, the clear polymer solution
was centrifuged 0.5 hour (10,000 rpm, Eppendorf 5415C) at 40°C to separate the
unreacted PEO. GPC data of my final product obtained from this method were shown in
Figure 23.
61

Figure 22. GPC data of the product obtained from the acetone-water separation method. Numbers 40988 and 2024 were calculated peak molecular weights of the final product and unreated PEO.
62

Figure 23. GPC data of the product obtained from the ultracentrifugation separation method. Numbers 44046 and 8293 were calculated peak molecular weights of the final products. The unreacted PEO peak was marked with “PEO”. The number of the calculated peak molecular weight of unreacted PEO was not shown because of the GPC software limitation.
63

Comparing Figures 21, 22 and 23, the unreacted PEO peak decreased dramatically
in Figures 22 and 23, which means both acetone-water separation method and
ultracentrifugation method worked well to separate unreacted PEO from final polymer
products. In Figure 22, there was only very high molecular weight product (Mw >
40,000) left, while in Figure 23, the product with medium molecular weight was left.
Since higher molecular weight PEO-b-P(NIPAAm) tends to form larger micelles in
solutions, micelles formed by the product from the acetone-water separation method
should be larger than those formed by the product from the ultracentrifugation method.
As mentioned in Chapter 2, the micelle size has to be smaller than 150 nm to be used as
an injectable drug delivery carrier. So the ultracentrifugation is a better method to
separate a product that forms small micelles.
7.2.3.3 Reduction of the Molecular Weight and the Molecular Weight Distribution of the Polymer
Figure 23 shows that molecular weights of final products obtained from the
ultracentrifugation separation were widely distributed. Because the molecular weight of
the PEO segment is only 2,000, the molecular weight of the P(NIPAAm) segment must
range from 0 to 40,000. The problem with these copolymers was that they could not form
small micelles with narrow size distribution. This was proved by dynamic light scattering
(DLS) data, as shown in Figure 24. Unlike Plurogel®, which had only one narrow
distribution peak on its dynamic light scattering spectra, both spectra of 1 wt% and 0.1
wt% PEO-b-P(NIPAAm) copolymer aqueous solutions showed two broad peaks with 50
% by number of micelles falling in each peak respectively. The broad distribution of each
peak suggests that the copolymer did not form dense or uniform micelles.
64

Figure 24. DLS data of the 10 wt% PEO-b-P(NIPAAm) copolymer aqueous solution at 40°C.
In order to decrease the molecular weight and tighten the molecular weight
distribution of the copolymer, different polymerization conditions were tried, which are
listed as follows:
(1) Reaction temperatures
According to Equations 7.6, 7.11, 7.16 and 7.19, the kinetic chain length νn is
proportion to propagation rate constant (kp) and inversely proportion to the termination
rate constant (kt or kt2). If kp increased more rapidly with temperature than kt or kt2, then
decreasing temperature will decrease MW. Polymerizations were carried out at different
temperatures other than 60°C, which were 40°C, 30°C, 25°C. When the temperature was
equal to or higher than 30°C, an emulsion polymerization mechanism occurred; when the
temperature was 25°C, a solution polymerization mechanism occurred. GPC spectra of
products obtained at 40°C or 30°C were similar to Figure 23, i.e. having a narrow peak
65
with the peak MW higher than 40,000 and a broad peak with the peak MW around
7,000~8,000. GPC spectrum of the product obtained at 25°C showed only PEO peaks,
this means there was no copolymer formed at this temperature. These results supported
the hypothesis that kp increased more rapidly with temperature compared to kt or kt2.
(2) Initial NIPAAm concentrations
Since according to Equations 7.6, 7.11, 7.16 and 7.19, kinetic chain length νn is
proportion to NIPAAm concentration, experiments were done in which the initial
NIPAAm concentration was decreased from 0.210 M to 0.105 M, 0.021 M and 0.004 M.
GPC spectra of products obtained with NIPAAm concentration equal to 0.105 M or
0.021 M were similar to Figure 23. Both had a narrow peak with the peak mode MW
higher than 40,000 and a broad peak with the peak mode MW around 5,000~6,000. The
GPC spectrum of the product with NIPAAm concentration equal to 0.004 M was similar
to Figure 21. It had a small peak with the peak MW higher than 40,000 and a large peak
with the peak MW equal to 1,910. This means when the NIPAAm concentration was very
low, few copolymers were formed during polymerization. These data were not consistent
with kinetic mechanism proposed in Section 7.2.3.1.2.
(3) Initial PEO concentrations
Since according to Equations 7.11 and 7.19, kinetic chain length νn is inversely
proportion to PEO concentration when the coupling termination dominates, experiments
were done in which the initial PEO concentration was increased from 0.050 M to 0.075
M and 0.125 M. GPC spectra of products obtained with PEO concentration equal to
0.075M or 0.125 M were similar to Figure 23. These results showed that kinetic chain
66

length νn is not a function of PEO concentration. According to Equations 7.6 and 7.16,
this result suggests that a linear termination mechanism dominates.
(4) Initial Ce(IV) concentrations
Since according to Equations 7.6, 7.11, 7.16 and 7.19, kinetic chain length νn is
inversely proportion to the Ce(IV) concentration, the initial Ce(IV)/ PEO ratio was
increased from 1.2 to 2.0 and 3.0. The GPC spectrum of the product obtained with the
Ce(IV)/ PEO ratio equal to 2.0 or 3.0 was similar to Figure 23. They both had a narrow
peak with the peak MW higher than 40,000 and a broad peak with the peak MW around
6,000~8,000. These data were not consistent with the kinetic mechanism proposed in
Section 7.2.3.1.2.
(5) Reaction times
The turbidity of the polymerization system did not increase significantly after 30
minutes. It was assumed that further reaction would only increase the chain length of
copolymer, which was not desired; so if the reaction was stopped before 30 minutes,
lower molecular weight copolymer might be obtained. Thus the reaction was executed for
15, 20, 30 and 60 mins. GPC spectra of products obtained were all similar to Figure 23 in
that they all had a narrow peak with MW higher than 40,000 and a broad peak with the
peak MW value around 7,000~8,000. DLS spectra of micelles, which were formed by the
products obtained from these four different reaction times, were all similar to Figure 24
in that they all had a broad peak with the mode average diameter larger than 5,000 nm
and another peak with the peak diameter less than 1,000 nm. Mode average diameters
less than 1,000 nm are shown in Table 3. These results showed that even micelles formed
67
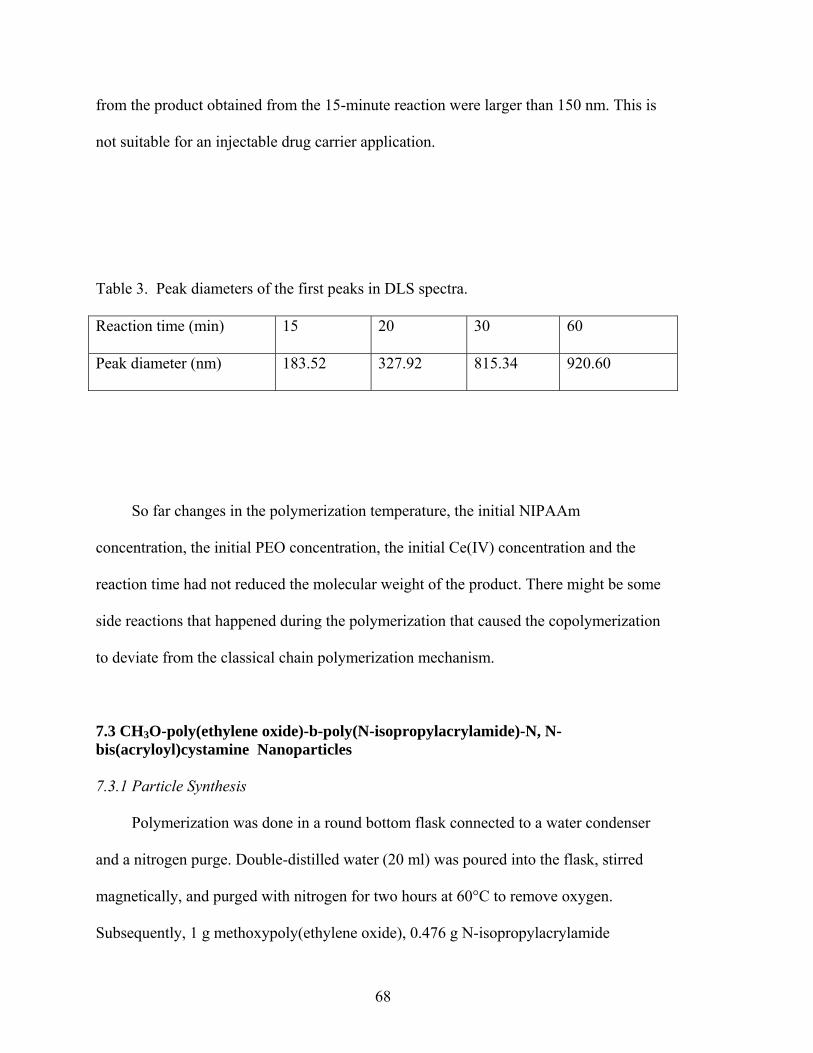
from the product obtained from the 15-minute reaction were larger than 150 nm. This is
not suitable for an injectable drug carrier application.
Table 3. Peak diameters of the first peaks in DLS spectra.
Reaction time (min) 15 20 30 60
Peak diameter (nm) 183.52 327.92 815.34 920.60
So far changes in the polymerization temperature, the initial NIPAAm
concentration, the initial PEO concentration, the initial Ce(IV) concentration and the
reaction time had not reduced the molecular weight of the product. There might be some
side reactions that happened during the polymerization that caused the copolymerization
to deviate from the classical chain polymerization mechanism.
7.3 CH3O-poly(ethylene oxide)-b-poly(N-isopropylacrylamide)-N, N-bis(acryloyl)cystamine Nanoparticles 7.3.1 Particle Synthesis
Polymerization was done in a round bottom flask connected to a water condenser
and a nitrogen purge. Double-distilled water (20 ml) was poured into the flask, stirred
magnetically, and purged with nitrogen for two hours at 60°C to remove oxygen.
Subsequently, 1 g methoxypoly(ethylene oxide), 0.476 g N-isopropylacrylamide
68

(NIPAAm) and measured amounts of N,N-bis(acryloyl)cystamine (BAC) were added.
After 5 minutes purging, 0.376 g ammonium cerium nitrate in 4 ml of 1 M nitric acid was
added.
During PEO-b-P(NIPAAm) copolymerization, micelles commenced formation by
12 minutes following the addition of the ammonium cerium nitrate, as indicated by a
color change from orange to white. Because the biodegradable crosslinker BAC is
hydrophobic, we assume it was sequestered into micelle cores and was copolymerized
with the NIPAAm, thus crosslinking cores of micelles.
After 4 hours of reaction, the solution was cooled to room temperature and 1 M
NaOH solution was added to precipitate out the cerium salts [29]. The supernate of the
reaction (containing copolymer) was centrifuged 0.5 hour (10,000 rpm, Eppendorf
5415C) at 40°C to separate the unreacted PEO. Precipitated copolymer products were
freeze dried, dissolved with double-distilled water to form a solution with a concentration
of 2.0±0.1 mg/mL. Some solutions were stored at room temperature, some were stored at
37°C, and others were frozen.
The BAC concentration was varied in several experiments from 20 wt% of that of
the NIPAAm monomer to 2.0, 1.5, 1.0, 0.75, 0.5, 0.2 and 0.1wt%.
7.3.2 Analyses
Molecular weights of copolymers were determined with gel permeation
chromatography.
LCSTs of copolymer solutions at 2.0 mg/ml and 0.2 mg/ml and their particle sizes
were characterized by turbidity and DLS at 40°C, respectively.
69

Fluorescence measurements were carried out at 40°C to study nanoparticle
stabilities and microenvironments of nanoparticle cores.
7.3.3 Results
7.3.3.1 Particle Size
After resuspending PEO-b-P(NIPAAm)-BAC nanoparticles made with 20 wt% or 2
wt% BAC, a white flocculate was always apparent and settled after several days. Thus no
particle size analysis was done for these higher concentrations.
For nanoparticles with less than 2.0 wt% BAC, stock solutions (in which
nanoparticle concentrations were 2.0 mg/ml) were subsequently diluted to 0.2 mg/ml and
0.02 mg/ml. Figure 25 shows the size distribution of PEO-b-P(NIPAAm)-0.5 wt% BAC
nanoparticles in 0.02 mg/ml solution. As opposed to the PEO-b-P(NIPAAm) micelle
solution that had two peaks in the spectrum (Figure 24), the solution of PEO-b-
P(NIPAAm)-0.5 wt% BAC nanoparticles had only one peak. Similar results with single
peaks were obtained for PEO-b-P(NIPAAm)-BAC nanoparticles with BAC amounts
varying from 2.0 wt% to 0.2 wt%.
Figure 26 shows diameters of particles at all three dilutions measured by DLS.
Nanoparticles with 1.5 wt% BAC or 1.0 wt% BAC had diameters over 200 nm at all
three dilutions, indicating that large particles had formed. Diameters of nanoparticles
with BAC amounts from 0.75 wt% to 0.2 wt% were less than 150 nm and were detectable
at all three dilutions. Nanoparticles with 0.1 wt% BAC were not detectable at
concentrations lower than 0.2 mg/ml, indicating that not enough crosslinking occurred to
prevent particles from dissolving upon dilution. Topp et al. reported that diameters of his
70

PEO-b-P(NIPAAm) micelles varied from 61 nm to 117 nm at 37°C and depended on the
molar ratio of EO and NIPAAm repeat units in the copolymer [29]. Thus nanoparticles in
this work stabilized with 0.75% to 0.20% BAC are comparable in size to micelles
reported by Topp.
Figure 25. DLS data of 0.02 mg/ml PEO-b-P(NIPAAm)-0.5 wt% BAC aqueous solution at 40°C.
As mentioned earlier, PEO-b-P(NIPAAm) copolymers are soluble in water at room
temperature and form polymeric micelles at temperatures above the LCST of the
P(NIPAAm). Turbidity measurement at 600 nm showed that PEO-b-P(NIPAAm)-0.5
wt% BAC nanoparticles at 2.0 mg/ml and 0.2 mg/ml solutions exhibited a LCST of
29±1°C.
71

0
200
400
600
800
1000
1200
1400
1600
1800
0.1 0.2 0.5 0.75 1 1.5
BAC Amount (wt%)
Dia
met
er (n
m)
Figure 26. Diameters of PEO-b-P(NIPAAm)-BAC particles with different amounts of BAC upon dilution at 40°C. The black bar represents data at 2 mg/ml solution, the hatched bar represents data at 0.2 mg/ml dilution, and the white bar represents 0.02 mg/mL dilution. Repeatable results were not obtained for the particles with 1.5 wt% BAC in 0.02 mg/mL solution, and thus are not shown. Error bars represent the standard deviations (n=3).
It is postulated that PEO-b-P(NIPAAm)-BAC particles also form a micelle-like
structure at temperatures above the LCST of the P(NIPAAm) (such as during
polymerization at 60°C and during subsequent experiments at 40°C), but would not
totally dissolve at room temperature due to crosslinked cores. However, cooling below
the LCST would cause the P(NIPAAm) core to expand, and the observed hydrodynamic
diameters would increase. This hypothesis is supported by data presented in Figure 27. At
72

room temperature, PEO-b-P(NIPAAm)-0.5 wt% BAC particles were detectable at
concentrations as low as 0.002 mg/ml, and their diameters increased 37-102% compared
to the particles at same concentration at 40°C. Particles in 0.002 mg/ml solution showed
the largest increase in diameter, perhaps because the driving force to disassociate the
crosslinked particle caused a large uptake of water.
0
50
100
150
200
0.2 0.02 0.002Solution concentration (mg/ml)
Dia
met
er (n
m)
Figure 27. Diameters of PEO-b-P(NIPAAm)-0.5 wt% BAC particles upon dilution at 20 and 40°C. The white bar represents data at 40°C and the black bar represents data at 20°C. Error bars represent the standard deviations (n=3).
Figure 28 shows the change in nanoparticle diameters over time. Experiments were
carried out over one month and samples were stored at room temperature, so the
P(NIPAAm) core was expanded to provide driving force for dissolution. In general, the
nanoparticle diameters decreased with time, although diameters of particles at 0.2 mg/ml
73

dilution are not significantly different at 3 and 4 weeks (p>0.05). Nanoparticles in 0.002
or 0.02 mg/ml solutions became undetectable at three or four weeks respectively,
indicating that they degraded within these time periods. Nanoparticles that were stored at
37°C or frozen showed no change in diameter during 4 weeks of storage (data not
shown).
Figure 28. Diameters of PEO-b-P(NIPAAm)-0.5 wt% BAC nanoparticles as a function of time. Data was measured at 40°C. The white bar indicates 0.2 mg/ml dilution, the hatched bar indicates 0.02 mg/ml dilution and the black bar indicates 0.002 mg/ml dilution. Error bars represent the standard deviations (n=3). * indicates samples with diameters statistically less than the value at 1 week.
74

7.3.3.2 Fluorescence Measurement
DPH emission intensities of PEO-b-P(NIPAAm)-BAC nanoparticles with different
amount of BAC at 40°C are shown in Figure 29. The BAC concentration was varied from
0 wt% to 0.2, 0.5, 0.75, 1.0 and 1.5 wt%. These data show that the fluorescent intensity
increased as the amount of BAC crosslinker increased. Such data supports the hypothesis
that as the ratio of BAC to NIPAAm increased, the distance between crosslink points
decreased, and the crosslinked network became tighter. We speculate that less water was
able to penetrate into the core, and thus there was less quenching of the fluorescence.
Pruitt et al. reported that DPH emission intensities of stabilized Pluronic® P105 micelles
(called Plurogel®), in 1 mg/mL and 0.1 mg/mL solutions with same DPH concentration
(0.1µg/mL) were 20 and 3 respectively [5]. Compared with Pruitt’s results, PEO-b-
P(NIPAAm)-BAC nanoparticles with more than 1 wt% BAC provide similar
hydrophobic core environments as Plurogel®.
Figure 30 shows DPH emission intensities of PEO-b-P(NIPAAm)-0.5 wt% BAC
particles at different concentrations at 40°C. DPH emission intensities decreased almost
linearly upon dilution, indicating that no significant micelle degradation occurred upon
dilution. In contrast to Plurogel®, whose DPH emission intensities in 0.1 and 0.01 mg/mL
solutions with same DPH concentration were both greater than 1, DPH emission
intensities of PEO-b-P(NIPAAm)-0.5 wt% BAC particles at same concentrations were
less than 1 [5]. These suggested that the cores of PEO-b-P(NIPAAm)-0.5 wt% BAC
particles are less hydrophobic than the cores of Plurogel® at a similar dilute
concentration. This might occur because the hydrophobic part of PEO-b-P(NIPAAm) is
P(NIPAAm) while the hydrophobic part of P105 is poly(propylene oxide) (PPO). The
75

logarithm value (10 based) of octanol-water partition coefficient of P(NIPAAm) at 40°C
obtained in our lab using a shake-flask method was 2.13 and that of PPO was 2.54. These
results prove that P(NIPAAm) is less hydrophobic than PPO.
05
10152025
0 0.5 1 1.5 2BAC amount (wt%)
Inte
nsity
(A. U
.)
Figure 29. DPH emission intensities of water and PEO-b-P(NIPAAm)-BAC nanoparticles with different amounts of BAC at 40°C. The diamond represents 2 mg/ml solution, the square represents 0.2 mg/ml solution, and * represents the emission intensity of DPH in water. Data points are n = 3, and bars are smaller than the symbol.
0.1
1
10
0.001 0.01 0.1 1 10Solution concentration (mg/ml)
Inte
nsity
(A.U
.)
Figure 30. DPH emission intensities of water and PEO-b-P(NIPAAm)-0.5 wt% BAC nanoparticles at 40°C. * is the emission intensity of 0.1 µg/ml DPH in water. Data points are n = 3, and some error bars are smaller than the symbol.
76

When the solution concentration was diluted to 0.001 mg/ml, the emission intensity
of the particles was only slightly above the emission intensity observed for a saturated
solution of DPH in distilled water.
DOX emission intensities at 40°C of PEO-b-P(NIPAAm)-0.5 wt% BAC particles
and unstabilized Pluronic® P105 micelles at different concentrations are shown in Figure
31. For unstabilized P105, there was a sharp drop of the emission intensity when the
concentration was lower than 1 mg/mL. This is because the critical micelle concentration
(CMC) of unstabilized P105 at 40°C is around 1 mg/ml [5]. The DOX was released from
micelles into aqueous solution and was quenched. For PEO-b-P(NIPAAm)-0.5 wt% BAC
nanoparticles, the emission intensities decreased upon dilution gradually. At
concentrations below 0.2 mg/mL, they have higher emission intensities than unstabilized
Pluronic® P105 micelles. These observations indicate the stabilized particles did not
dissolve at low concentrations and are consistent with data shown in Figure 30.
0.01
0.1
1
0.001 0.1 10solution concentration (mg/ml)
Inte
nsity
(A.U
.)
Figure 31. Emission intensities of 40 µg/ml DOX in water ( * ), unstabilized Pluronic® P105 (dashed line) and PEO-b-P(NIPAAm)-0.5 wt% BAC nanoparticles (solid line) at 40°C. Data points are n = 3, and some error bars are smaller than the symbol.
77

One of reasons BAC was chosen as the crosslinker is that it contains a disulfide
bond that can be broken by reducing agents such as glutathione possessed by cells at
physiological conditions. To test the degradability of BAC, a reducing agent β-
mercaptoethanol was added to 2 and 0.2 mg/ml PEO-b-P(NIPAAm)-0.5 wt% BAC
solution. The molar ratio of β-mercaptoethanol to BAC was 10:1. The solutions were
stored at 37°C. Fluorescence tests were carried out immediately following addition, then 7
and 14 days after adding β-mercaptoethanol. Results are shown in Figure 32. After β-
mercaptoethanol was added, DPH emission intensities of particles with 0.5 wt% BAC in
both solution concentrations decreased with time gradually, and after 14 days reached the
emission value of the particle without BAC at corresponding concentrations. Without β-
mercaptoethanol in solutions, DPH emission intensities of nanoparticles with 0.5 wt%
BAC decreased only slightly after 14 days in both concentrations. These data indicate
that BAC can be degraded by β-mercaptoethanol and the particles appear to be totally
degraded after 14 days.
7.3.4 Discussion
Micelle-like nanoparticles PEO-b-P(NIPAAm)-BAC have been synthesized as
potential drug delivery carriers. Synthesis was achieved by copolymerization of NIPAAm
with the crosslinker BAC onto PEO polymers. The ratio of BAC to NIPAAm in
polymerizations was varied over a wide range.
78

A
456789
0 1 2
Time (weeks)
Inte
nsity
(A.U
.)
B
00.5
11.5
22.5
3
0 1 2Time (weeks)
Inte
nsity
(A.U
.)
Figure 32. Emission intensities of 0.1 µg/ml DPH in PEO-b-P(NIPAAm)-0.5 wt% BAC nanoparticles at 40°C with or without reducing agent β-mercaptoethanol as a function of time. A shows data in 2 mg/ml solution and B shows data in 0.2 mg/ml dilution. The diamond represent data with no β-mercaptoethanol, the squares represent data with 10:1 molar ratio β-mercaptoethanol and the triangles represent data for non-stabilized PEO-b-P(NIPAAm). Data points are n = 3, and error bars are smaller than the symbol.
Diameters of PEO-b-P(NIPAAm)-BAC nanoparticles measured by DLS varied
with the amount of BAC (Figure 26). The physical properties of the nanoparticles could
be categorized into four groups. Nanoparticles polymerized with 2 wt% or greater BAC
never dissolved in water even below the LCST of P(NIPAAm). We speculate that the
79

high amount of BAC rendered the core sufficiently hydrophobic that the resulting
micelles were hydrophobic at room temperature and they coagulated. It is also possible
that at these high concentrations of BAC, some crosslinking occurred outside of the
micelle core, and could have linked the nanoparticles together during polymerization.
Nanoparticles with BAC amount from 1.5 wt% to 1.0 wt% had diameters larger
than 200 nm. These larger sizes may also be due to slight aggregation of particles or
some interparticle crosslinking occurring during copolymerization, but perhaps at a lesser
extent than above 2 wt% BAC.
In the range of 0.75 wt% and 0.2 wt% BAC, the nanoparticle sizes were less than
150 nm. This was about the same size as non-crosslinked micelles and as Plurogel®
particles [5]. This BAC concentration range appears to be ideal for producing small stable
micelles. Below this range the micelles were not stable upon dilution. Stable micelles of
less than 100 nm would be suitable for IV administration of drug carries [46]. In addition,
these nanoparticles are biocompatible because they would eventually degrade.
Particle size analysis and fluorescence measurement showed that with a suitable
amount of the crosslinker BAC, temporally stable PEO-b-P(NIPAAm)-BAC
nanoparticles could be obtained. The nanoparticles appear to be stable up to two weeks
even at dilute concentrations (Figure 28). This is much longer than Plurogel® which has a
half-life in dilute aqueous solution of only about 18 hours [5]. During degradation,
diameters of the nanoparticles at different solution concentrations decreased with time.
This slow degradation (in the absence of β-mercaptoethanol) of large nanoparticles might
have occurred because some PEO-b-P(NIPAAm) copolymer chains forming the micelles
during polymerization might not have been crosslinked into the network, but only
80

entangled with other copolymers within the micelles. When the solutions were stored at
room temperature, non-crosslinked-copolymer chains dissolved into aqueous solutions
gradually.
Because diameters of diluted nanoparticles decreased over time (Figure 28), it
appears that some copolymer diffused out and did not remain with the nanoparticles even
when re-heated to 40°C which was above the LCST. However, in the absence of
diffusional driving forces, such as when storing undiluted samples at 37°C (above the
LCST) or below the freezing point, diameters of the nanoparticles did not decrease in size
during 4 weeks of storage.
As mentioned earlier, DOX is not only a fluorescent probe but also an anti-cancer
drug. The fluorescence measurement showed that PEO-b-P(NIPAAm)-BAC
nanoparticles sequester DOX (Figure 31). Furthermore, the particles are stable for up to
two weeks even when stored at room temperature and are eventually biodegradable so
that they do not build up in the body (Figure 32). All these properties make PEO-b-
P(NIPAAm)-BAC nanoparticles a potential candidate for anti-cancer drug delivery.
81

82

CHAPTER 8
TEMPORARILY STABLE POLYMERIC MICELLE SYSTEM BASED ON CH3O-POLY(ETHYLENE OXIDE)-B
-POLY(N-ISOPROPYLACRYLAMIDE -HEMA-LACTATEN)
8.1 Materials
Methoxypoly(ethylene oxide) (Mw 2,000), 2-hydroxyethyl methacrylate, 3,6-
dimethyl-1,4-dioxane-2,5-dione, tin (II) 2-ethylhexanoate, N-isopropylacrylamide, 4,4’-
azobis(4-cyanopentanoic acid), 1,4-dioxane, thionyl chloride and stable free radical
diphenyl picrylhydrazyl were obtained from Sigma-Aldrich and used without further
purification. Doxorubicin hydrochloride was obtained from Pharmacia & Upjohn
Company (Kalamazoo, MI) in dosage form. Fluorescence probe 1,6-diphenyl-1,3,5-
hexatriene was obtained from Molecular Probes (Eugene, Oregon).
8.2 Synthesis
8.2.1 HEMA-lactaten
Oligolactate esters of 2-hydroxyethyl methacrylate (HEMA-lactaten), (n = number
of lactate units in oligolactate) were synthesized by ring-opening oligomerization of
lactide using HEMA as the initiator and stannous octoate as a catalyst as described by
Cadee et al. [35] A mixture of lactide and HEMA was stirred at 110°C under nitrogen
83
purging until the lactide was molten. Subsequently, catalytic amounts of stannous octoate
(1 mol% with respect to HEMA) dissolved in toluene were added to the mixture. The
mixture reacted for 1 hour and then was cooled to room temperature. HPLC grade THF
was used to dissolve the formed solid and the THF solution was added dropwise to ice
water mixture. The formed precipitate was collected by centrifugation and then
subsequently dissolved in ethyl acetate. The solution was centrifuged again to remove
any undissolved solid. The supernatant obtained from the centrifugation was vacuum
dried, yielding viscous oil.
The target stoichiometry was 3 or 5 lactate units per HEMA.
1H NMR spectra of the HEMA-lactaten in CDCl3 were recorded using Varian Unity
300 MHz instruments. The spectrum of the HEMA-lactate3 is shown in Figure 33 and the
interpretation based on proton-proton correlated spectroscopy (HH-COSY) and the
literature is shown in Table 4 [36].
84

a, a'
bc d
f
e
OH
O
g
h
Figure 33. NMR spectrum of HEMA-lactate3.
85

Table 4. Interpretation of NMR spectrum of HEMA-lactate3.
δ (chemical shift) Proton
6.1 1H, Ha’
5.6 1H, Ha
5.3-5.1 1H, He
4.5-4.3 5H, Hc, Hd, Hg
4.1 2H, ether acetate, -COOCH2-
2.8 1H, -OH
2.1 3H, ether acetate, CH3COO-
1.9 3H, Hb
1.6-1.4 6H, Hf ,Hh
1.3 1H, ether acetate, -OCH2CH3
The n value could be calculated from relative integral intensities of He and Ha,
which was 3.03 in the case of 3:1 feed ratio of lactate:HEMA. These data showed the n
value was very close to the target stoichiometry. The spectrum of the HEMA-lactate5 was
similar. The n value calculated from relative integral intensities of He and Ha was 5.12.
86
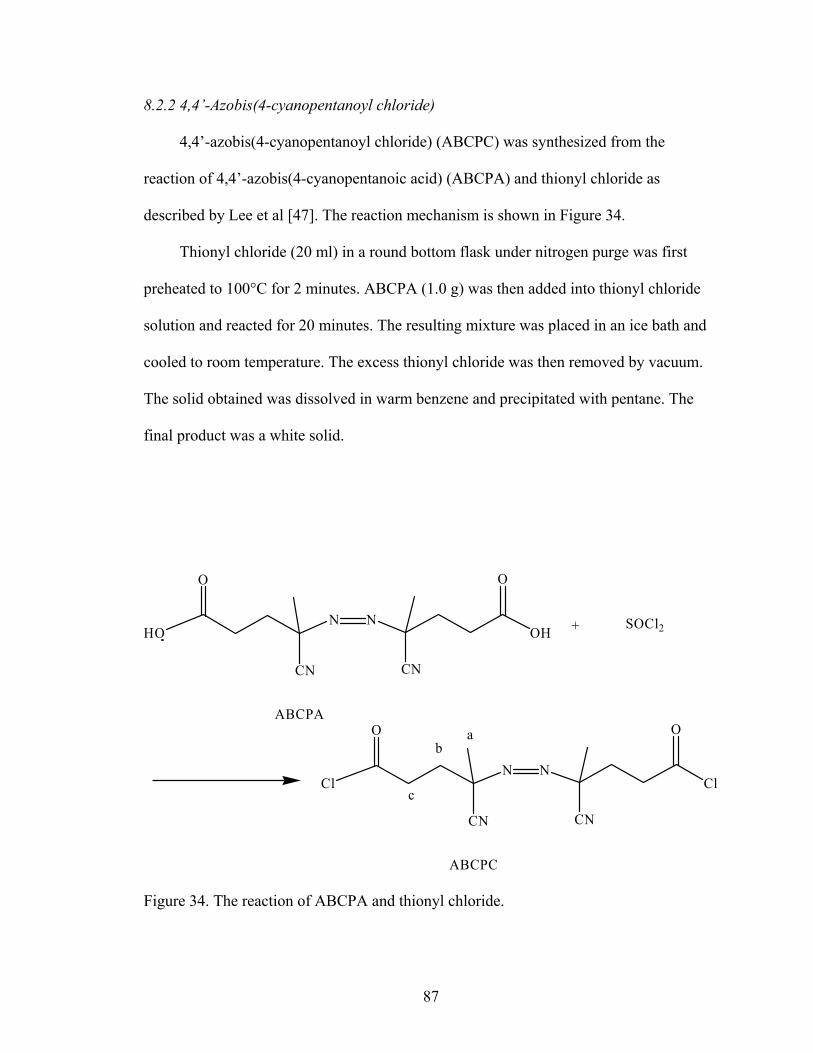
8.2.2 4,4’-Azobis(4-cyanopentanoyl chloride)
4,4’-azobis(4-cyanopentanoyl chloride) (ABCPC) was synthesized from the
reaction of 4,4’-azobis(4-cyanopentanoic acid) (ABCPA) and thionyl chloride as
described by Lee et al [47]. The reaction mechanism is shown in Figure 34.
Thionyl chloride (20 ml) in a round bottom flask under nitrogen purge was first
preheated to 100°C for 2 minutes. ABCPA (1.0 g) was then added into thionyl chloride
solution and reacted for 20 minutes. The resulting mixture was placed in an ice bath and
cooled to room temperature. The excess thionyl chloride was then removed by vacuum.
The solid obtained was dissolved in warm benzene and precipitated with pentane. The
final product was a white solid.
HO
O
N
CN
N
CN
ABCPA
ABCPC
+ SOCl2
O
OH
Cl
O
N
CN
N
CN
O
Cl
a
c
b
Figure 34. The reaction of ABCPA and thionyl chloride.
87

The 1H NMR spectrum of ABCPC in CDCl3 was recorded and shown in Figure 35.
The interpretation based on the literature is shown in Table 5 [47, 48].
Figure 35. NMR spectrum of ABCPC.
88

Table 5. Interpretation of NMR spectrum of ABCPC.
δ (chemical shift) Proton
3.3-2.9 4H, Hb
2.7-2.4 4H, Hc
1.8-1.7 6H, Ha
1.6-1.5 4H, pentane, CH3CH2CH2CH2CH3
8.2.3 PEO-ABCPC
Incorporation of PEO into the block copolymer requires the synthesis of a PEO-
ABCPC macroinitiator. It was prepared by a condensation reaction of the chloride end
groups of ABCPC and the OH end group of PEO as described by Virtanen et al [26].
PEO and ABCPC were first dissolved in dry dichloromethane and then an excess amount
of triethylamine was added. The mixture reacted for 24 hr at room temperature and then
vacuum dried. From the GPC spectrum of product (Figure 36), about 60 wt% of the final
product was PEO-ABCPC-PEO (peak Mw = 4,057), 40 wt% of it (peak Mw = 2,006)
was PEO. Because it is very difficult to separate PEO from PEO-ABCPC-PEO and PEO
has little effect on later reactions, PEO was left in the final product without further
purification.
89

Figure 36. GPC spectrum of PEO-ABCPC-PEO. Numbers 4057 and 2006 were calculated peak molecular weights of PEO-ABCPC-PEO and unreacted PEO.
90
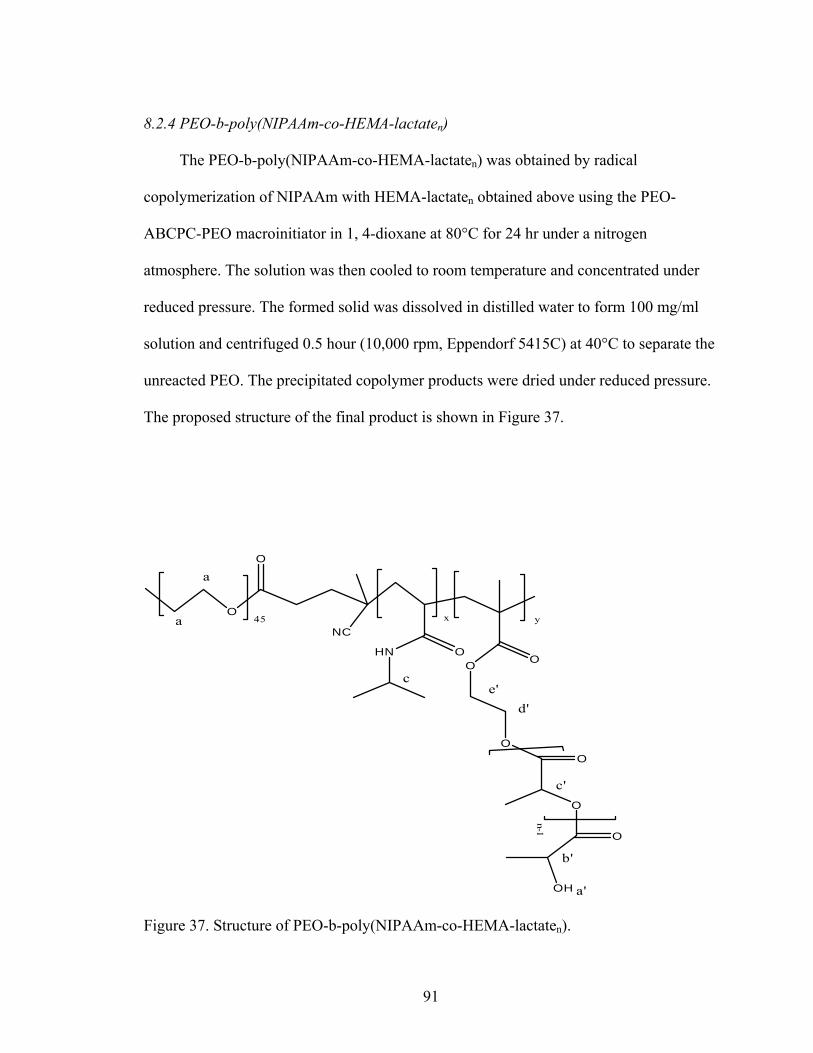
8.2.4 PEO-b-poly(NIPAAm-co-HEMA-lactaten)
The PEO-b-poly(NIPAAm-co-HEMA-lactaten) was obtained by radical
copolymerization of NIPAAm with HEMA-lactaten obtained above using the PEO-
ABCPC-PEO macroinitiator in 1, 4-dioxane at 80°C for 24 hr under a nitrogen
atmosphere. The solution was then cooled to room temperature and concentrated under
reduced pressure. The formed solid was dissolved in distilled water to form 100 mg/ml
solution and centrifuged 0.5 hour (10,000 rpm, Eppendorf 5415C) at 40°C to separate the
unreacted PEO. The precipitated copolymer products were dried under reduced pressure.
The proposed structure of the final product is shown in Figure 37.
HN OO O
O
O
O
OH
O
n-1
x y
a'
NC
O
O
45a
a
b'
c'
d'e'
c
Figure 37. Structure of PEO-b-poly(NIPAAm-co-HEMA-lactaten).
91

The 1H NMR spectra of the copolymers in DMSO-d6 were recorded using Varian
Unity 300 MHz instruments. The spectrum of PEO-b-poly(NIPAAm-co-HEMA-lactate5)
is shown in Figure 38 and the interpretation based on the literature is shown in Table 6
[37, 49].
Figure 38. NMR of PEO-b-poly(NIPAAm-co-HEMA-lactate5).
92

Table 6. Interpretation of NMR spectrum of PEO-b-poly(NIPAAm-co-HEMA-lactaten).
δ (chemical shift) Proton
5.2-5.0 2H, Hb’, Hc’
4.5-4.0 3H, Ha’, Hd’, He’
3.9-3.6 1H, Hc
3.5 PEO methylene protons CH2-CH2
3.3 dioxane protons
2.5-0.7 the rest of the protons
The molar composition of NIPAAm to HEMA-lactate5 to PEO in PEO-b-
poly(NIPAAm-co-HEMA-lactate5) was determined from relative integral intensities, as
shown in Table 7. These data showed that the molar ratios calculated from NMR had
same trend as feed molar ratios, but the NIPAAm:PEO and HEMA-lactaten:PEO
averaged about 70% of the feed ratio. It may be possible that some unreated PEO was not
entirely separated out. When the feed ratio of NIPAAm to PEO increased, the molar
ratio of that calculated from NMR increased too; when the feed ratio of HEMA-lactate5
to PEO decreased, the molar ratio of that calculated from NMR decreased too. So in
further discussion the polymers will be named by their molar feed ratio.
93

Table 7. The molar composition of NIPAAm to HEMA-lactate5 to PEO in PEO-b-poly(NIPAAm-co-HEMA-lactate5). Feed Molar Ratio Molar Ratio Calculated from NMR.
17.5:7.5:1 11.1:4.7:1
20:5:1 16.1:4.5:1
22.5:2.5:1 17:1.4:1
8.3 Analyses
Sizes of the polymeric micelles at different solution concentrations were measured
by DLS.
CMTs of the copolymer solutions, before and after hydrolysis, were quantified by
measuring their absorbance at 600 nm at various temperatures. To hydrolyze the
copolymers, samples were dissolved in phosphate buffered saline (PBS, pH=7), in a
concentration of 1 mg/ml and incubated at 40°C. CMTs of the copolymer solutions were
measured at 0, 2 and 7 days of hydrolysis.
The temporally stabilities of the various micelle systems were studied using
fluorescent measurements.
The anticancer drug doxorubicin (DOX) was introduced into PEO-b-
poly(NIPAAm-co-HEMA-lactaten) micelles by simple mixing as described previously
[4]. The release of the drug upon application of ultrasound was measured in a 70 kHz
ultrasonic bath using the apparatus shown in Figure 39. The 488nm line of an argon ion
94

laser (Ion Laser Technology, Model 5500 A) was directed through a dielectric-interface
beam splitter. The intensity of the split portion of the beam was measured by a photo
detector (Newport Model 818-SL with 835 display) and was used to monitor the laser
power throughout measurements. The other portion of the beam was guided into one
branch of a bifurcated fiber optic bundle (part DF13036M, Edmund Optics, Barrington,
NJ) that guided the light into an acoustically transparent plastic (cellulose butyrate) tube
of 2.54 cm diameter filled with the DOX solution. The laser light exited the fiber optic
bundle in a cone of light. DOX within the cone of light absorbed at 488 nm and
isotropically emitted fluorescence centered at 580 nm. In the same fiber optic bundle
were fibers that collected and directed the fluorescence to a detector. The geometry of
the fiber optic is such that 99% of the collected fluorescence originated from within 3
mm of fiber optic tip. The fluorescence signal was directed through the second branch of
the fiber optic bundle through a multinode dielectric band and filter (Omega Optical
Model 535DF35) to a silicon detector (EGSG Model 450-1). The filter was used to cut
off any emissions with a wavelength below 517 nm, including any Rayleigh-scattered
laser light. The photo detector signal was recorded with an oscilloscope and then stored
on a computer for further processing.
As ultrasound from the ultrasonic bath released DOX from the micelles, the
fluorescence of the DOX was reduced due to some quenching by water. The collection
fiber optic recorded this change in fluorescence intensity, and the amount of drug
released was computed from the change in fluorescence as described by Husseini et al.
[17].
95

The acoustically transparent tube and fiber optic were positioned in the ultrasonic
bath such that the end of the fiber optic bundle was in an ultrasonically intense region of
the bath. The ultrasonic intensity was controlled by adjusting the 60 Hz Voltage that
powered the ultrasonic bath using a variable AC transformer (Variac). The ultrasonic
intensity was measured by placing a hydrophone (8103, Bruel and Kjaer, Naerum, DK) at
the same location as the end of the fiber optic.
Filter
Laser PhotoDetector
Oscilloscope
ComputerVariac
Oscillator
Transformer
Transducer
Waterbath
Sample inchamber
Figure 39. Experimental apparatus to measure the release of DOX from the drug carrier.
96
To execute these measurements, solutions of either PBS, DOX in PBS or DOX in
copolymer micelles in PBS were placed in the plastic tube, which was placed in the
ultrasonic bath. The ultrasound was applied at various intensities, and the changes in
fluorescence were measured and converted to a % drug released, as described previously
[17].
8.4 Results
8.4.1 Radical Formation Kinetics of PEO-ABCPC-PEO
Diphenyl picrylhydrazyl (DPPH) was reported to be useful as a radical scavenger
[50]. Active DPPH has a stable free radical on one of the nitrogen atoms of, as shown in
Figure 40. When this free radical reacts with another free radical, DPPH becomes
inactive. It was found that absorption coefficients of the active and inactive DPPH at 519
nm were 1.15*104 and 2.28*103 respectively. Thus, the reaction rate of active DPPH with
other free radicals could be determined by UV-VIS spectrometry.
In this work, radical formation kinetics of PEO-ABCPC-PEO were studied using
DPPH. The concentration of DPPH was measured by spectrometric analysis at 519 nm
(Beckman Coulter DU 640 spectrophotometer). DPPH concentrations as a function of
time in different solutions were shown in Figure 41.
97

NO2
NO2
NO2
N N
Figure 40. The structure of stable free radical diphenyl picrylhydrazyl.
Data in Figure 41A showed that when there was only DPPH in the solution, its
absorption only decreased 11% at 80°C (solid diamonds). This proved DPPH was a fairly
stable free radical at this temperature. When ABCPA and DPPH were both in the solution
(solid triangles), the absorption of DPPH decreased almost linearly with time. The
solution with ABCPC and DPPH in it showed a very similar linear decrease (solid
squares). This proved the ABCPC synthesized in the lab had similar initiation kinetics as
ABCPA obtained from Sigma-Aldrich.
Data in Figure 41B showed that when there was PEO and DPPH in the solution, the
absorption of DPPH decreased (open diamonds), suggesting that the OH end group of
PEO did react with DPPH. Comparing absorptions of ABCPC and DPPH solution
(Figure 41A, solid squares), PEO, ABCPC and DPPH solution (Figure 41B, open
squares) and PEO-ABCPC-PEO and DPPH solution (Figure 41B, open triangles), the
absorption of the latter solution decreased faster than the former two. This means that
98

PEO-ABCPC-PEO was more reactive than ABCPC towards inactivation of DPPH. This
inactivation was so fast that it appears to be more than just the additive effect of PEO and
ABCPC in solution together. Radical formation kinetics of PEO-ABCPC-PEO showed
that PEO-ABCPC-PEO decomposes into free radicals at a rate at least as fast as ABCPA
and therefore should be an efficient initiator for PEO-b-poly(NIPAAm-co-HEMA-
lactaten) polymerization.
A
0.00000.20000.40000.60000.8000
0 20 40 60 80time (mins)
Abso
rptio
n
B
00.20.40.60.8
0 20 40 60 80time (mins)
Abs
orpt
ion
Figure 41. DPPH concentrations as a function of time in different ethanol solutions at 80°C. A) Solid diamonds: DPPH solution; solid squares: ABCPC and DPPH solution; solid triangles: ABCPA and DPPH solution. B) Open diamonds: PEO and DPPH solution; open squares: PEO, ABCPC and DPPH solution; open triangles: PEO-ABCPC-PEO and DPPH solution. Data points are n = 3, and error bars are smaller than the symbol.
99

8.4.2 Particle Size
Diameters of the micelles were measured by DLS at three concentrations: 1 mg/ml,
0.1 mg/ml and 0.01 mg/ml. Figure 42 shows the change of the diameter as the molar ratio
of NIPAAm to HEMA-lactaten to PEO was varied. In Figure 42A and 42B, n equals 3
and 5 respectively. The molar ratio of NIPAAm to PEO increases along the horizontal
axis in each figure. Data in these figures shows that the diameter of the micelle increases
when the molar ratio of NIPAAm to PEO increase. The micelles with the NIPAAm:PEO
ratio of 45:1 had diameters over 150 nm at all three dilutions (Figure 42A), indicating
that large micelles had formed. These larger sizes may be due to fairly long
poly(NIPAAm) hydrophobic blocks formed during polymerization. Diameters of the
micelles with all other NIPAAm to PEO ratios were less than 130 nm. Although not
statistically significant, all micelles expanded upon dilution, except the ones with
NIPAAm:HEMA-lactate3:PEO ratio of 17.5:7.5:1 or 20.0:5.0:1 at 0.01 mg/ml dilutions
(Figure 42A). Compared with other micelles at same concentration, the larger error bars
of these two measurements indicated that these two kinds of micelle were not very stable
at such low concentration, and thus the DLS data was noisy. Comparison of Figures 42A
and 42B, show that with the same NIPAAm:HEMA-lactaten:PEO molar ratio, the
micelles with longer lactate block in oligomer (n=5) were larger than the ones with
shorter lactate block (n=3). This because hydrophobic lactate blocks are incorporated into
hydrophobic cores. It is likely that longer lactate blocks made the core bigger, and thus
increased the size of the micelle.
100

* *A #
* * &* * * # #
#
Figure 42. Diameters of PEO-b-poly(NIPAAm-co-HEMA-lactaten) micelles at 40°C. (A) n =3, (B) n =5. The black bars represent data at 1 mg/ml solution, the hatched bars represent data at 0.1 mg/ml dilution, and the white bars represent data at 0.01 mg/ml dilution. Error bars represent the standard deviations (n=3). * indicates that data of 0.1mg/ml and 0.01mg/ml were statistically different (p<0.05) from 1mg/ml within each NIPAAm:HEMA-lactaten:PEO ratio. # indicates that data of micelle with different NIPAAm:HEMA-lactaten:PEO ratio were statistically different (p<0.05) from the ones with NIPAAm:HEMA-lactaten:PEO equals to 17.5:7.5:1 in 1mg/ml solution. & indicates data of micelle with different NIPAAm:HEMA-lactaten:PEO ratio were statistically different (p<0.05) from the ones with NIPAAm:HEMA-lactaten:PEO equals to 20.0:5.0:1 in 1mg/ml solution. Statistical comparisons were made using double sided t-distribution test (n=3).
101

8.4.3 Critical Micelle Temperature Characterization
Figure 43 shows all six copolymers had CMTs far below 37°C immediately upon
dissolving in PBS, indicating that they all would form micelles at body temperature.
When the ratio of NIPAAm:HEMA-lactaten:PEO was the same, copolymers with shorter
lactate blocks (open symbols at 0 day) had higher CMTs than those with longer lactate
blocks (closed symbols at 0 day). This is because the lactate block is hydrophobic and
contributes toward lowering the CMT. Within each lactate block length set (n=3 or n=5),
the CMT increased as the molar ratio of NIPAAm to HEMA-lactaten increased.
After hydrolysis for 2 days, CMTs of copolymers with n=5 increased but were still
below 37°C (closed symbols at 2 days). Copolymers with n=3 and having molar ratios of
NIPAAm:HEMA-lactate3:PEO of 20.0:5.0:1 or 22.5:2.5:1 had a similar change in their
CMTs (open triangle and open circle at 2 days). When NIPAAm:HEMA-lactate3:PEO
was 17.5:7.5:1, the copolymers had CMTs above 37°C after hydrolysis for 2 days and
thus would no longer form micelles at body temperature (open diamond at 2 days). This
indicates the stability of the micelle was controlled by the hydrolysis of the lactate
groups.
102

Figure 43. CMTs of copolymers at 1 mg/ml as a function of time. Closed symbols: n=5; open symbols: n=3. Diamonds: NIPAAm:HEMA-lactaten:PEO = 17.5:7.5:1; Triangles: NIPAAm:HEMA-lactaten:PEO = 20.0:5.0:1; Circles: NIPAAm:HEMA-lactaten:PEO = 22.5:2.5:1. Data are slightly off set in time for clarity.
After hydrolysis for 7 days, copolymers with NIPAAm:HEMA-lactaten:PEO ratio
of 22.5:2.5:1 still had CMTs below 37°C, whether n=3 or n=5 (open and closed circles at
7 days). CMTs of copolymers with NIPAAm:HEMA-lactaten:PEO ratios of 20.0:5.0:1
shifted above 37°C (open and closed triangles at 7 days). This means micelles formed
from the latter copolymers would dissolve within 7 days at body temperature.
Copolymers with NIPAAm:HEMA-lactate5:PEO ratios of 17.5:7.5:1 had similar changes
in their CMTs (closed diamond at 7 days).
Figure 44 shows CMTs of all three sets of copolymers (n=0, n=3 or n=5)
hydrolyzed for 7 days at different dilutions. NIPAAm:HEMA-lactaten:PEO ratios had no
significant effect on the CMT after hydrolysis for 7 days. These data indicate that lactate
103
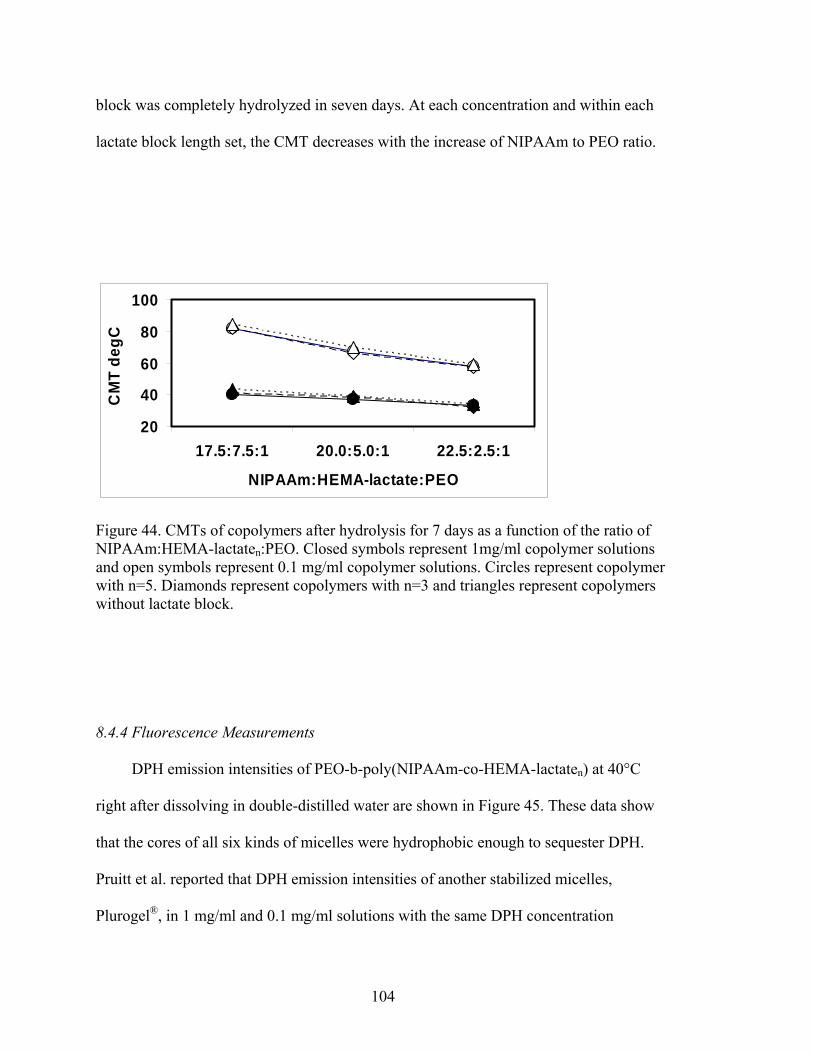
block was completely hydrolyzed in seven days. At each concentration and within each
lactate block length set, the CMT decreases with the increase of NIPAAm to PEO ratio.
20
40
60
80
100
17.5:7.5:1 20.0:5.0:1 22.5:2.5:1
NIPAAm:HEMA-lactate:PEO
CM
T de
gC
Figure 44. CMTs of copolymers after hydrolysis for 7 days as a function of the ratio of NIPAAm:HEMA-lactaten:PEO. Closed symbols represent 1mg/ml copolymer solutions and open symbols represent 0.1 mg/ml copolymer solutions. Circles represent copolymer with n=5. Diamonds represent copolymers with n=3 and triangles represent copolymers without lactate block.
8.4.4 Fluorescence Measurements
DPH emission intensities of PEO-b-poly(NIPAAm-co-HEMA-lactaten) at 40°C
right after dissolving in double-distilled water are shown in Figure 45. These data show
that the cores of all six kinds of micelles were hydrophobic enough to sequester DPH.
Pruitt et al. reported that DPH emission intensities of another stabilized micelles,
Plurogel®, in 1 mg/ml and 0.1 mg/ml solutions with the same DPH concentration
104

(0.1µg/mL) were 20 and 3 respectively [5]. Compared with Pruitt’s results, PEO-b-
poly(NIPAAm-co-HEMA-lactaten) micelles provide similar hydrophobic core
environments as Plurogel®. At each concentration, the fluorescent intensity increased as
the molar ratio of NIPAAm to PEO increased. This is because as the molar ratio of
NIPAAm to PEO increases, the hydrophobic part of the copolymer increases and the core
of the micelle became tighter and perhaps larger. We postulate that less water was able to
penetrate into the core, and thus there was less quenching of the DPH fluorescence.
Copolymers with longer lactate blocks showed higher DPH emission intensities than
those with shorter lactate blocks, which was expected because the poly(lactate) block is
hydrophobic, thus causing more DPH fluorescence inside the micelle.
8.4.5 Doxorubicin Encapsulation and Releasing Upon Exposure to Ultrasound
Micelles formed from the copolymer with NIPAAm:HEMA-lactate3:PEO ratio of
20.0:5.0:1 were used at a concentration of 10 wt% in this analysis. Diameters of these
micelles were smaller than 100 nm; they were stable up to 48 hours and degraded within
7 days; a hydrophobic environment was present at very low concentration of drug carrier.
These data suggest that this kind of micelle should be capable of sequestering
hydrophobic drugs like DOX and used as an anti-caner drug carrier.
Low-frequency (70 kHz) ultrasound was used to release DOX from PEO-b-
poly(NIPAAm-co-HEMA-lactate3) micelles. The amount of DOX released was 2% at
room temperature and was 4% at 37 ºC, which values are lower than the DOX released
from Plurogel®. Plurogel® exhibits about 9.1% release of the DOX at 37 ºC under similar
ultrasonic exposure conditions [51].
105

0
2
4
6
8
10
12
14
16
18
17.5:7.5:1 20.0:5.0:1 22.5:2.5:1
NIPAAm:HEMA-Lactate:PEO
DPH
Em
issi
on In
tens
ity (A
.U.)
Figure 45. DPH emission intensities of PEO-b-poly(NIPAAm-co-HEMA-lactaten) micelles at 40°C right after dissolving in double-distilled water. Closed symbols represent data with n=5, open symbols represent data with n=3. Diamonds represent data at 1 mg/ml solution, triangles represent data at 0.1mg/ml dilution, and circles represent data at 0.01 mg/ml dilution. The star represents emission data in double-distilled water. Data points are n = 3, and error bars are smaller than the symbol.
8.5 Discussion
PEO-b-poly(NIPAAm-co-HEMA-lactaten) micelles have been synthesized as
potential anticancer drug delivery carriers. Synthesis was achieved by copolymerization
of NIPAAm with HEMA-lactaten initiated by PEO-ABCPC macroinitiator. The molar
ratio of NIPAAm to HEMA-lactaten to PEO in polymerizations was varied over a wide
range.
Diameters of PEO-b-poly(NIPAAm-co-HEMA-lactaten) micelle as measured by
DLS increased with the molar ratio of NIPAAm to PEO (Figure 42). Diameters of
106

micelles with NIPAAm to PEO molar ratios less than 45.0:1 were less than 130 nm. Such
a size is slightly larger than Plurogel® micelles [5], but still small enough to be used in
vivo. It was reported that micelles with diameters less than 100 nm would be suitable for
IV administration of drug carriers [46]. In our experiment, micelles with NIPAAm to
PEO ratio less than 22.5:1 at concentrations greater than or equal to 0.1 mg/ml fall in this
category.
P(NIPAAm) homopolymer has a CMT of about 32°C. As hydrophilic monomers
are copolymerized with NIPAAm, the CMT increases, while copolymerization with
hydrophobic monomers decreases the CMT. In this research, we were adding both a
hydrophilic PEO segment and a hydrophobic HEMA-lactaten comonomer. Figure 43
shows CMTs of the copolymers immediately upon dissolution in PBS decreased as the
molar ratio of HEMA-lactaten to PEO increased. CMTs decreased to about 19°C when
the molar ratio of HEMA-lactate5 to PEO was 7.5:1. Thus the polymer with greater
amounts of hydrophobic HEMA-lactaten block displayed a greater decrease in CMTs.
As lactate ester side groups of the copolymers hydrolyzed gradually, the copolymer
became more hydrophilic, and thus CMTs of the copolymers increased [37]. Comparing
CMTs of the copolymers after hydrolysis for 2 days to those right after dissolution, the
copolymers with greater HEMA-lactaten to PEO molar ratio produced a larger increase in
CMTs. CMTs of the copolymers with molar ratios of HEMA-lactaten:PEO of 5.0:1 or
2.5:1 increased but were still below 37°C at 2 days. This means that micelles formed
from these copolymers would be stable at body temperature up to 48 hours, a longer time
than Plurogel® which has a half-life in dilute aqueous solution of only about 18 hours [5].
107

Figure 43 shows that after hydrolysis for 7 days, CMTs of all three sets of
copolymers (n=0, n=3 or n=5) with same NIPAAm:HEMA-lactaten:PEO ratios were
similar at the same solution concentration, which indicates that the lactate blocks were
completely hydrolyzed within seven days. CMTs of hydrolyzed copolymers varied
between 55 and 85°C, depending on the NIPAAm:HEMA-lactaten:PEO ratio. Neradovic
et al. reported that poly(NIPAAm-co-HEMA) has a LCST of about 30°C in 0.1 mg/ml
solution for a series of copolymers in which the molar ratio of HEMA:NIPAAm varied
from 0:1 to 1:1 [37]. The difference between CMTs of Neradovic and those of our
copolymers is attributed to the large hydrophilic PEO block. Though PEO is a LCST
polymer too, it is reported that linear PEO (Mw 2,270, which was similar to the PEO
used in this research) has an LCST of over 160°C at 1mg/ml solution [52]. Experiments
carried out in our lab also showed that in 0.1mg/ml solution, the LCST of pure PEO (Mw
2,000) was not detectable up to 85°C. These data suggested that PEO is very hydrophilic
under the condition of this research and apparently increases the CMT of the PEO-b-
poly(NIPAAm-co-HEMA) copolymer.
Low-frequency ultrasound caused the anticancer drug DOX to be released from
PEO-b-poly(NIPAAm-co-HEMA-lactate3) micelles with NIPAAm:HEMA-lactate3:PEO
equal to 20.0:5.0:1. But the amount released was less than previously observed from
Plurogel®. Currently, we can only speculate on the cause of this difference. Because the
glass transition temperature (Tg) of PPO is -185°C, the lightly crosslinked PPO core of
Plurogel® may be a rubbery gel at the experiment temperature(room temperature or
37°C) [53]. The Tg of polylactide is around 57~60°C, the poly(NIPAAm-HEMA-
lactaten) core may be more of a crystalline solid at the experiment temperature [54].
108
Shearing forces from cavitating bubbles may open micelles with gel cores more easily
than those with crystalline solid cores. More work remains to be done to test this
hypothesis and to investigate other unique properties of this novel micellar drug carrier.
109

110
CHAPTER 9
SUMMARY AND RECOMMENDATIONS
To use polymeric micelles as ultrasonic-activated IV administration anti-cancer
drug carriers, they must be less than 150 nm in diameter, must be stable (they must not
dissolve) in the blood for a sufficient amount of time to carry the drug to the desired
target site and must be biodegradable so that it does not build up in the body. Several
polymeric micelle systems, such as Plurogel®, Tetronic®, poly(ethylene oxide)-b-poly(N-
isopropylacrylamide) and poly(ethylene oxide)-b-poly(N-isopropylacrylamide-co-2-
hydroxyethyl methacrylate-lactaten), were investigated.
In previous work in our lab, Pruitt et al. developed a stabilized drug carrier named
Plurogel® [5, 6]. Unfortunately, the rate of the successful Plurogel® synthesis was only
about 30% by simply following Pruitt’s process. In this work, this rate was improved by
combining several techniques.
Although Plurogel® was successfully used with ultrasound to treat tumors in rats
[7], its major deficiency is that it is too degradable as it has a half-life in dilute aqueous
solution of only about 18 hours. Such a short half-life is good for biodegradability, but it
also releases toxic drug too quickly and not selectively at the target site. In this work,
poly(ethylene oxide)-b-poly(N-isopropylacrylamide)-N,N-bis(acryloyl)cystamine and
111

poly(ethylene oxide)-b-poly(N-isopropylacrylamide-co-2-hydroxyethyl methacrylate-
lactaten) were synthesized and proved to have potential as drug delivery vehicles that are
more stable than the Plurogels® in vitro.
9.1 Summary of Accomplishments
1. Adding NaCl and/or n-butanol and preheating the Pluronic® solution helped to
increase the rate of the successful Plurogel® synthesis. The optimal concentration
appeared to be about 0.15 M of NaCl and 10 µl/ml of n-butanol. The optimal
preheating condition was at 35 ºC for 0.5 hour.
2. Tetronics® were not good candidates to form stable polymeric micelle system at
concentrations below their CMC by polymerizing interpenetrating networks
inside their micelle cores.
3. Poly(ethylene oxide)-b-poly(N-isopropylacrylamide) polymerization did not
totally follow the proposed polymerization mechanisms. The study showed that
linear termination mechanism dominated. In the reaction between Ce(IV) and
PEO, Ce(IV) consumption rate appeared to be first order in Ce(IV) concentration
and in PEO concentration.
4. Poly(ethylene oxide)-b-poly(N-isopropylacrylamide)- N,N-
bis(acryloyl)cystamine (PEO-b-NIPAAm-BAC) micelle-like nanoparticles were
developed. When the BAC was from 0.2 wt% to 0.75 wt% of the mass of
NIPAAm, the diameters of the nanoparticles were less than 150 nm at 40ºC. The
cores of the nanoparticles were hydrophobic enough to sequester DPH and the
anti-cancer drug doxorubicin (DOX). The nanoparticles with 0.5 wt% BAC stored
112

at room temperature in 0.002 mg/ml solutions were stable for up to two weeks.
The nanoparticles were not detectable 14 days after adding reducing agent β-
mercaptoethanol.
5. Poly(ethylene oxide)-b-poly(N-isopropylacrylamide-co-2-hydroxyethyl
methacrylate-lactaten) (PEO-b-poly(NIPAAm-co-HEMA-lactaten) ) micelle
system that releases its drug upon application of ultrasound was synthesized. The
degree of polymerization of lactate side group, n, was 3 or 5. The in vitro stability
life time of the micelle can be controlled by the length of lactate side group
(indicated by the value of n) and the molar ratio of NIPAAm to HEMA-lactaten to
PEO in the copolymer. The copolymers PEO-b-poly(NIPAAm-co-HEMA-
lactate3) with NIPAAm:HEMA-lactate3:PEO = 20.0:5.0:1 or 22.5:2.5:1 and the
copolymers PEO-b-poly(NIPAAm-co-HEMA-lactate5) with NIPAAm:HEMA-
lactate5:PEO = 17.5:7.5:1, 20.0:5.0:1 or 22.5:2.5:1 produced micelles that were
stable for about 2 days at 40°C. The cores of the micelles were hydrophobic
enough to sequester DPH and DOX. The DOX release from the micelles having
molar ratio of NIPAAm to HEMA-lactate3 to PEO equal to 20.0:5.0:1 was about
2 % at room temperature and 4 % at body temperature.
9.2 Recommendations for Further Research
1. Further research in PEO-b-NIPAAm-BAC nanoparticles should show whether
DOX can be released from these nanoparticles using ultrasound. Similar
equipment to that used in Chapter 8 might be used.
113

2. Further research in PEO-b-poly(NIPAAm-co-HEMA-lactaten) synthesis should
focus on improving the yield of the copolymer. This might include the following:
• Chromatography should be investigated to separate unreacted PEO from
PEO-ABCPC-PEO.
• One could prepare the PEO macroinitiator using other method. Vamvakaki
et al. reported the formation of PEO macroinitiator by reacting PEO with
potassium naphthalene in THF [55]. Without further purification, the PEO
macroinitiator obtained was used directly in the following polymerization which
was carried out in methanol via an oxyanionic polymerization mechanism. This
method might increase the PEO macroinitiator yield and thus increase the total
yield.
• One could use other purification technique to remove unreacted PEO
instead of by centrifugation. The initiation kinetic of PEO-ABCPC-PEO showed
that a lot of PEO-ABCPC free radical formed within a very short time; this might
form a lot of short-chain-length copolymers. Because the chain length of PEO
was fixed at 2,000, short-chain-length copolymer would have a short hydrophobic
segment. Thus the whole copolymer would have properties similar to pure PEO.
Centrifugation might separate not only unreacted PEO but also some short-chain-
length copolymers. This might decrease the total yield of the copolymer.
3. The maximum DOX loading capacity of these polymeric micelle systems in
solution should be determined by using the fluorescent properties of DOX.
4. Only the changes of the CMTs were investigated during the in vitro degradation
of PEO-b-poly(NIPAAm-co-HEMA-lactaten) in this work. In the future, changes
114
of the sizes of the micelles, changes of the molecular weights of the copolymers
and the amount of lactic formed could be characterized according to method
reported by Zweers et al. [56].
5. The animal toxicity of the PEO-b-NIPAAm-BAC and PEO-b-poly(NIPAAm-co-
HEMA-lactaten) should be investigated in a rodent model using procedures
similar to those described by Pruitt [57].
115

116

REFERENCES
1. M. Malmsten and B. Lindman, Self-assembly in aqueous block copolymer
solutions, Macromolecules 25 (1992) 5440-5445.
2. K. Kataoka, G. S. Kwon, M. Yokoyama, T. Okano, and Y. Sakurai, Block
copolymer micelles as vehicles for drug delivery, Journal of controlled release 24 (1993)
119-132.
3. K. E. Uhrich, S. M. Cannizzaro, R. S. Langer, and K. M. Shakesheff, Polymeric
systems for controlled drug release, Chem. Rev 99(11) (1999) 3181-3198.
4. G. A. Husseini, N. Y. Rapoport, D. A. Christensen, J. D. Pruitt, and W. G. Pitt,
Kinetics of ultrasonic release of doxorubicin from Pluronic P105 micelles, Colloids and
Surfaces B: Biointerfaces 24 (2002) 253-264.
5. J. D. Pruitt, G. Husseini, N. Rapoport, and W. G. Pitt, Stabilization of Pluronic P-
105 Micelles with an Interpenetrating Network of N,N-Diethylacrylamide,
Macromolecules 33(25) (2000) 9306-9309.
6. N. Rapoport, Stabilization and activation of Pluronic micelles for tumor-targeted
drug delivery., Colloids and Surfaces B: Biointerfaces 16 (1999) 93-111.
7. J. L. Nelson, Ultrasonically Enhanced Drug Delivery of Doxorubicin in vivo from
Stabilized Pluronic Micelle Carriers, in Chemical Engineering. 2002, Brigham Young
University: Provo, UT. p. 79.
117

8. P. Alexandridis and T. A. Hatton, Poly(ethylene oxide)-block-Poly(propylene
oxide)-block-Poly(ethylene oxide) Copolymer Surfactants in Aqueous Solutions and at
Interfaces: Thermodynamics, Structure, Dynamics, and Modelling, Colloids Surfaces A:
Physicochem. Eng. Aspects 96(1/2) (1995) 1-46.
9. S. Saeki, N. Huwahara, M. Nakata, and M. kaneko, Upper and lower critical
solution temperatures in poly(ethylene glycol) solutions, Polymer 17 (1976) 685-689.
10. N. Rapoport and K. Caldwell, Structural transitions in micellar solutions of
Pluronic P-105 and their effect on the conformation of dissolved Cytochrome C: an
electron paramagnetic resonance investigation, Colloids and Surfaces B: Biointerfaces 3
(1994) 217-228.
11. T. Nivaggioli, B. Tsao, P. Alexandridis, and T. A. Hatton, Microviscosity in
Pluronic and Tetronic poly(ethylene oxide)-poly(propylene oxide) block copolymer
micelles., Langmuir 11 (1995) 119-126.
12. C. Guo, J. Wang, H. Liu, and J. Chen, Hydration and conformation of
temperature-dependent micellization of PEO-PPO-PEO block copolymers in aqueous
solutions by FT-Raman, Langmuir 15 (1999) 2703-2708.
13. B. C. Anderson, N. K. Pandit, and S. K. Mallapragada, Understanding drug
release from poly(ethylene oxide)-b-poly(propylene oxide)-b-poly(ethylene oxide) gels.,
Journal of Controlled Release 70 (2001) 157-167.
14. C. W. Spancake, K. D. O., and M. A. K., Thermorheologic properties of aqueous
solutions and gels of Tetronic 1508., Pharmaceutical Research 8(3) (1991) 345-349.
118

15. J. S. Tan, D. E. Butterfield, C. L. Voycheck, K. D. Caldwell, and J. T. Li, Surface
modification of nanoparticles by PEO/PPO block copolymers to minimize interactions
with blood components and prolong blood circulation in rats., Biomaterials 14(11) (1993)
823-833.
16. G. M. Bernacca, M. J. Gulbransen, R. Wilkinson, and D. J. Wheatley, In vitro
blood compatibility of surface-modified polyurethanes, Biomaterials 19 (1998) 1151-
1165.
17. G. A. Husseini, G. D. Myrup, W. G. Pitt, D. A. Christensen, and N. Y. Rapoport,
Factors affecting acoustically-triggered release of drugs from polymeric micelles, J.
Contr. Release 69 (2000) 43-52.
18. C. Perreur, J. Habas, J. Peyrelasse, and J. Francois, Rheological and small-angle
neutron scattering studies of aqueous solutions of branched PEO-PPO-PEO copolymers,
Physical Review E 63 (2001) 031505.
19. D. Attwood, J. H. Collett, and C. A. O'connor, The effect of gamma irradiation on
the surface, rheological and micellar behavior of the block copolymer, Tetronic 908.,
International Journal of pharmaceutic 65 (1990) 201-205.
20. M. G. Fakes, A. R. Mlodozeniec, and Z. G. M., Temperature-independent
Isoviscous effect in ternary systems of water, Tetronic 1307 and HEMA., Journal of
Colloid and Interface Science 138(2) (1990) 505-514.
21. J. S. Tan and P. A. Martic, Protein adsorption and conformational change on
small polymer particles., Journal of Colloid and Interface science 136(2) (1990) 415-431.
119

22. S. M. Moghimi, Mechanisms regulating body distribution of nanospheres
conditioned with Pluronic and Tetronic block co-polymers., Advanced Drug Delivery 16
(1995) 183-193.
23. H. G. Schild, Poly(n-isopropylacrylamide): experiment , theory and application.,
Prog. Polym. Sci. 17 (1992) 163-249.
24. V. I. Lozinsky, E. V. Kalinina, O. I. Putilina, V. K. Kulakova, E. A. Kurskaya, A.
S. Dubovik, and V. Y. Gringerg, Effect of the phase state of a reaction mixture on the
properties of poly(N-isopropylacrylamide) synthesized in an aqueous medium., Polymer
Science, Ser. A. 44(11) (2002) 1122-1128.
25. K. K. Lee, J. C. Hung, and M. C. Jhon, The synthesis and thermal phase transition
behavior of poly(N-isopropylacrylamide)-b-poly(ethylene oxide), Polymer Bulletin 40
(1998) 455-460.
26. J. Virtanen, S. Holappa, H. Lemmetyine, and H. Tenhu, Aggregation in aqueous
poly(n-isopropylacrylamide)-block -poly(ethylene oxide) solutions studied by
fluorescence spectroscopy and light scattering, Macromolecules 35 (2002) 4763-4769.
27. D. Neradovic, C. F. van Nostrum, and W. E. Hennink, Thermoreponsive
polymeric micelles with controlled instability based on hydrolytically sensitive.,
Macromolecules 34 (2001) 7589-7591.
28. M. D. C. Topp, I. H. Leunen, P. J. Dijkstra, K. Tauer, C. Schellenberg, and J.
Feijen, Quasi-living polymerization of N-isopropylacrylamide onto poly(ethylene
glycol), Macromolecules 33 (2000) 4986-4988.
120

29. M. D. C. Topp, P. J. Dijkstra, H. Talsma, and J. Feijen, Thermosensitive micelle-
forming block copolymers of poly(ethylene glycol) and poly(N-isopropylacrylamide),
Macromolecules 30 (1997) 8518-8520.
30. H. Lin and Y. Cheng, In-situ thermoreversible gelation of block and star
copolymers of poly(ethylene glycol) and poly(N-isopropylacrylamide) of varying
architectures., Macromolecules 34 (2001) 3710-3715.
31. Y. Maeda, N. Taniguchi, and I. Ikeda, Changes in the hydration state of a block
copolymer of poly(N-isopropylacrylamide) and Poly(ethylene oxide) on thermosensitive
micellization in water, Macromol. Rapid Commun 22 (2001) 1390-1393.
32. D. W. Lim, S. H. Choi, and T. G. Park, A new class of biodegradable hydrogels
stereocomplexed by enantiomeric oligo(lactide) side chains of poly(HEMA-g-OLA)s,
Macromol. Rapid commun. 21 (2000) 464-471.
33. S. J. de Jong, W. N. E. van Dijk-Wolthuis, J. J. Kettenes-van den Bosch, P. J. W.
Schuyl, and W. E. Hennink, Monodisperse enantiomeric lactic acid oligomers:
preparation, characterization, and stereocomplex formation, Macromolecules 31(19)
(1998) 6397-6402.
34. A. Y. Kwok, G. G. Qiao, and D. H. Solomon, Interpenetrating amphiphilic
polymer networks of poly(2-hydroxyethyl methacrylate) and poly(ethylene oxide), Chem.
Mater. (2004).
35. J. A. Cadee, M. De Kerf, C. J. De Groot, W. Den Otter, and W. E. Hennink,
Synthesis, characterization of 2-(methacryloxyloxy)ethyl-(di-) L-lactate and their
application in dextran-based hydrogels, Polymer 40 (1999) 6877-6881.
121

36. W. N. E. v. Dijk-Wolthuis, S. K. Y. Tsang, J. J. K.-v. d. Bosch, and W. E.
Hennink, A new class of polymerizable dextrans with hydrolyzable groups: hydroxyethyl
methacrylated dextran with and without oligolactate spacer., Polymer 38(25) (1997)
6235-6242.
37. D. Neradovic, W. L. J. Hinriches, J. J. Kettenes-van den Bosch, and W. E.
Hennink, Poly(N-isopropylacrylamide) with hydrolyzable lactic acid ester side groups: a
new type of thermosensitive polymer, Macromol. Rapid. Commun. 20 (1999) 577-581.
38. Y. Su, H. Liu, J. Wang, and J. Chen, Study of salt effects on the micellization of
PEO-PPO-PEO block copolymer in aqueous solution by FTIR spectroscopy, Langmuir
18(3) (2002) 865-871
39. R. J. Hunter, Foundations of Colloid Science. 2001: Oxford University Press.
40. J. L. Oscarson, G. Wu, P. W. Faux, R. M. Izatt, and J. J. Christensen,
Thermodynamics of protonation of alkanolamnies in aqueous solution to 325 Celsius,
Thermochimica Acta 154 (1989) 119-127.
41. F. Rodriguez, Principles of poymer systems. 4th ed. 1996, Bristol:
Taylor&Francis. 92-93.
42. S. Nagarajan and K. S. V. Srinivasan, Block copolymerization initiated by
Ce(IV)-poly(ethylene glycol) redox system-kinetics and characterization, European
Polymer Journal 30(1) (1994) 113-119.
43. R. A. Sheldon and J. K. Kochi, Photochemical and thermal reduction of
cerium(IV) carboxylates. Formation and oxidation of alkyl radicals., Journal of the
American Chemical Society 90(24) (1968) 6688-6698.
122

44. J. F. W. Billmeyer, Textbook of polymer science. Third edition ed. 1984, New
York: John Wiley & Sons. 114-116.
45. J. Eliassaf, Aqeous solutions of poly(N-isopropylacrylamide), Journal of Applied
Polymer Science 22 (1978) 873-874.
46. T. S. Ha and D. Kim, Drug releasing characteristics of PDLLA-MPEG DI- and
MPEG-PDLLA-MPEG triblock copolymer micelles, J.M.S.-Pure Appl. Chem. A36(7&8)
(1999) 1031-1044.
47. S.-H. Lee, P. T. Engen, and H. W. Gibson, Blocking group/Initiators for the
synthesis of polyrotaxanes via free radical polymerizations, Macromolecules 30(3)
(1997) 337-343.
48. D. Kim, S. Lee, K. Doh, and Y. Nam, Synthesis of block copolymers having
perfluoroalkyl and silicone-containing side chains using diazo macroinitiator and their
surface properites., Journal of Applied Polymer Science 74 (1999) 1917-1926.
49. D. Neradovic, M. J. van steenbergen, L. Vansteelant, Y. J. Meijer, C. F. van
Nostrum, and W. E. Hennink, Degradation mechanism and kinetics of thermosensitive
polyacrylamides containing lactid acid side chains, Macromolecules 36 (2003) 7491-
7498.
50. M. W. A. Kuijpers, D. van Eck, M. F. Kemmere, and J. T. F. Keurenties,
Cavitaion-induced reactions in high-pressure carbon dioxide, Science 298(6 December)
(2002) 1969-1971.
51. G. A. Husseini, D. A. Christensen, N. Y. Rapoport, and W. G. Pitt, Ultrasonic
release of doxorubicin from Pluronic P105 micelles stabilized with an interpenetrating
network of N,N-diethylacrylamide, J. Controlled Rel. 83(2) (2002) 302-304.
123

52. R. Kjellander and E. Florin, Water structure and changes in thermal stability of
the system poly(ethylene oxide)-water, J. Chem. Soc. Faraday trans. 1 77 (1981) 2053-
2077.
53. I. A. Volegova, E. V. Konyukhova, and Y. K. Godovsky, Dynamic Mechanical
Characterization of Molecular Motion in a Wide Temperature Range of Various
Polymers Containing Propylene Units, Journal of Thermal Analysis and Calorimetry
59(1-2) (2000) 123-130.
54. K. E. Perepelkin, Polylactide Fibres: Fabrication, Properties, Use, Prospects. A
Review, Fibre Chemistry 34(2) (2002) 85-100.
55. M. Vamvakaki, N. C. Billingham, and S. P. Armes, Synthesis of controlled
structure water-soluble diblock copolymers via oxyanionic polymerization,
Macromolecules 32 (1999) 2088-2090.
56. M. L. T. Zweers, G. H. M. Engbers, D. W. Grijpma, and J. Feijen, In vitro
degradation of nanoparticles prepared from polymers based on DL-lactide, glycolide and
poly(ethylene oxide), Journal of Controlled Release 100 (2004) 347-356.
57. J. Pruitt, Stabilization of Pluronic P-105 for Targeted Nanoparticle Drug
Delivery, in Chemical Engineering. 2001, Brigham Young University: Provo, Utah. p.
118.
124


