FOR322 Stand density and stocking
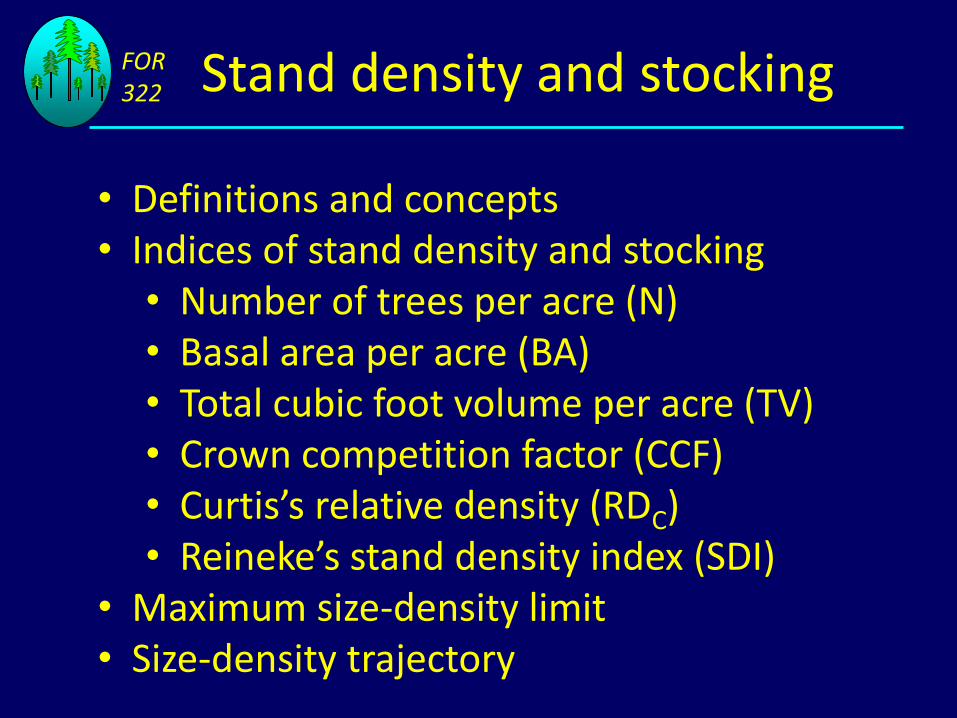
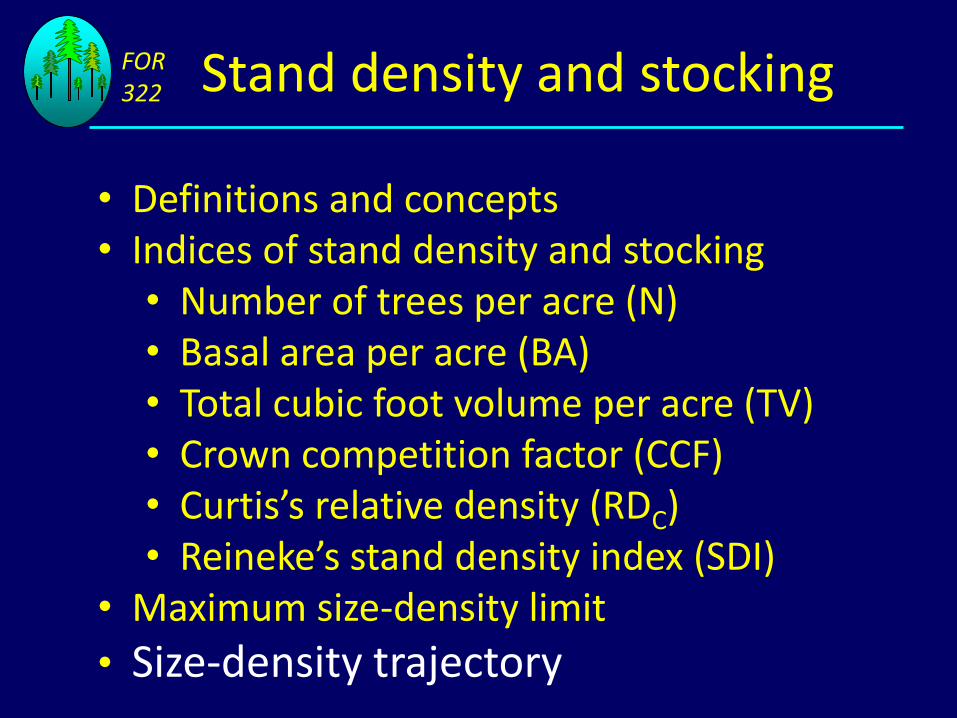
• Definitions and concepts• Indices of stand density and stocking
• Number of trees per acre (N)• Basal area per acre (BA)• Total cubic foot volume per acre (TV)• Crown competition factor (CCF)• Curtis’s relative density (RDC)• Reineke’s stand density index (SDI)
• Maximum size-density limit• Size-density trajectory

FOR322 Stand density and stocking
Stand Density: A quantitative measure of the degree of crowding or competition existing within the stand.
FOR322 Stand density and stocking
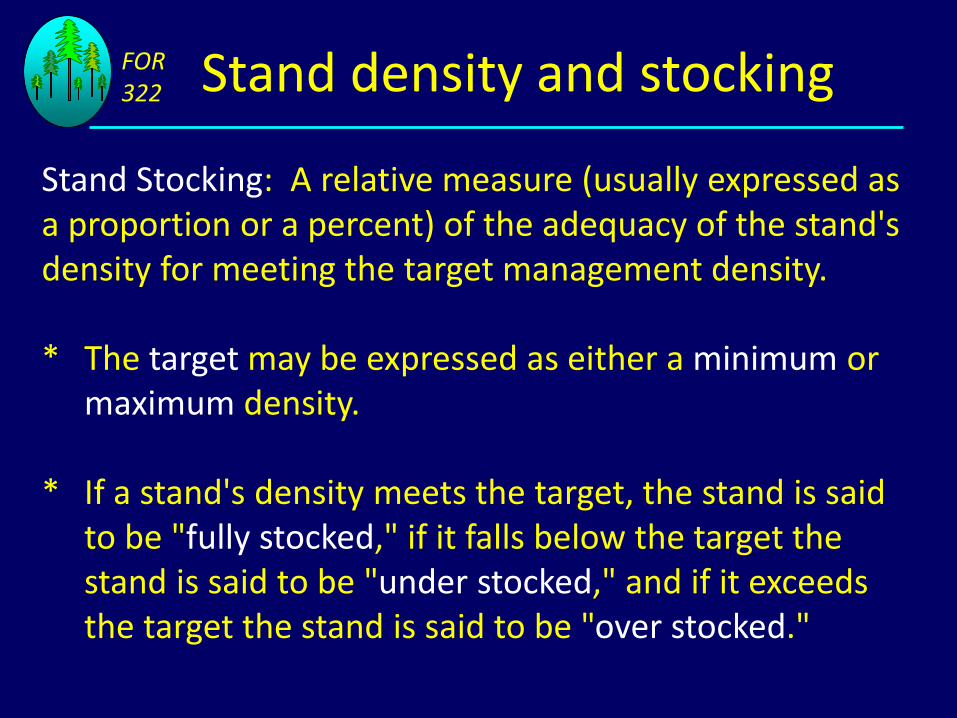
Stand Stocking: A relative measure (usually expressed as a proportion or a percent) of the adequacy of the stand's density for meeting the target management density.
* The target may be expressed as either a minimum or maximum density.
* If a stand's density meets the target, the stand is said to be "fully stocked," if it falls below the target the stand is said to be "under stocked," and if it exceeds the target the stand is said to be "over stocked."

FOR322 Stand density and stocking
Relative Density: Usually computed by dividing the density of the stand by the "full," "normal" or "maximum" density.
=375
550= 68%

FOR322 Stand density and stocking
"Stockability": The inherent capability of a piece of ground to carry the "full", "normal" or "maximum" density.
Conditions that can lead to "stockability" problems include:1. Very low rainfall (i.e., rainfall near the lower limit for
the species).2. Limited soil volume due to rock (i.e., the "flower pot"
situation).3. Nutrient deficiency (black spruce bog) or toxicity
(serpentine soil)

FOR322 Stand density and stocking
Stockability refers to inherent capacity of a piece of
ground.
Caution: Many factors, including past stand disturbances, can cause low density in the current stand
But, in southwestern and eastern Oregon, carrying capacity of maximum stand density has been correlated with plant association (integrated soil and climatic effects).
To a lesser extent, stockability varies even among Westside Douglas-fir sites

FOR322 Stand density and stocking
Permanent plots in Douglas-fir stands
ln(trees per acre)
ln(q
uad
rait
ic m
ean
dia
met
er)

FOR322 Stand density and stocking
Competition between trees within a stand has the following effects:
It reduces diameter growth rates
For some species, it reduces height growth rates
It increases crown recession rates
It increases mortality rates

FOR322 Stand density and stocking
Initial stand density effects on diameter growth:
0
20
40
60
80
100
120
140
160
0 20 40 60 80 100 120
He
igh
t (f
eet
)
Age (years)
Stand density effect on crown recession
Total tree height
Crown base height, dense stand
Crown base height, sparse stand

FOR322 Stand density and stocking
Stand density effects on diameter growth:
0
20
40
60
80
100
120
140
160
0 20 40 60 80 100 120
DB
H (
inch
es)
Age (years)
Wide spacing
Medium spacing
Close spacing

FOR322 Stand density and stocking
For even-aged (relatively pure) stands, volume is a direct function of:
1) Age2) Inherent site productivity3) Stand density

FOR322 Stand density and stocking
Stand development can be described in terms of progression of stand density:
Phase 1 : Planting Density Crown Closure
• Trees are growing independently of each other
• Stand growth rate is directly proportional to initial planting density
• No or limited crown lift/crown recession

FOR322 Stand density and stocking
Phase 2 : Crown Closure Onset of competition induced mortality
• Individual tree growth rates decline• Net stand growth rate continues to
increase substantially• Suppression mortality of branches begins;
crowns begin to rise or recede

FOR322 Stand density and stocking
Phase 3 : Onset of competition mortality maximum density
• Net stand growth continues at a positive but reduced rate due to loss from mortality
• Mortality induced by continued crown recession; crown size on suppressed trees become insufficient to sustain tree

FOR322 Stand density and stocking
Phase 4 : At Maximum Density
• Net stand growth rate can continue slowly or may stop based on gross growth rate of the stand and the slope of the maximum size-density line
• Stand growth is a balance between mortality rate and increment on surviving trees

FOR322 Stand density and stocking
Langsaeter’s hypothesis (note that age is fixed)
Growing stock at a given age
FOR322 Stand density and stocking
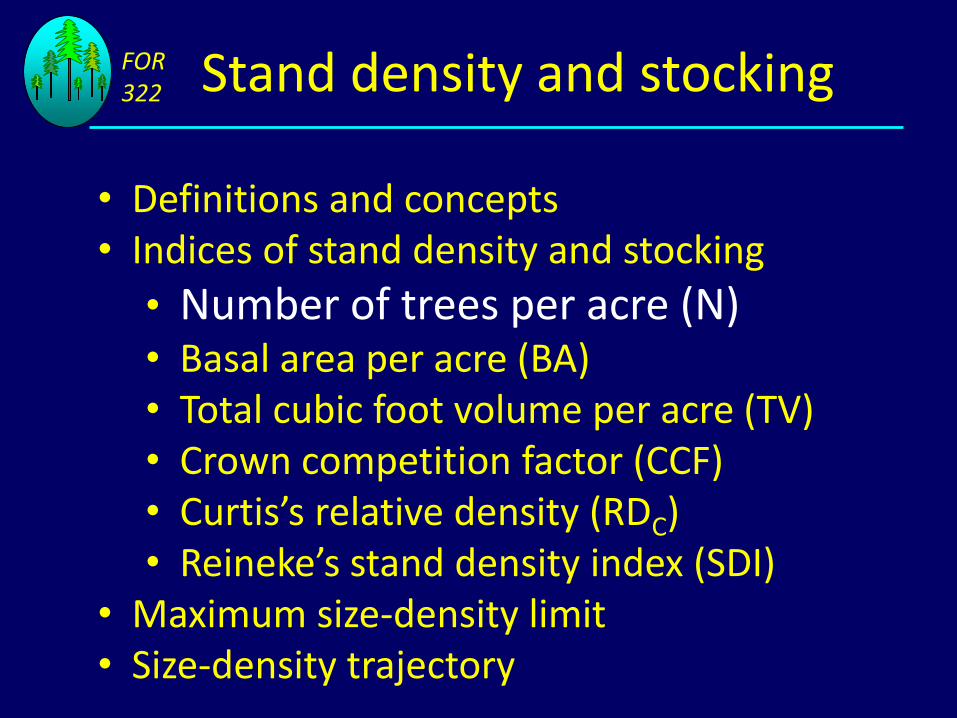
• Definitions and concepts• Indices of stand density and stocking
• Number of trees per acre (N)• Basal area per acre (BA)• Total cubic foot volume per acre (TV)• Crown competition factor (CCF)• Curtis’s relative density (RDC)• Reineke’s stand density index (SDI)
• Maximum size-density limit• Size-density trajectory
FOR322 Stand density and stocking
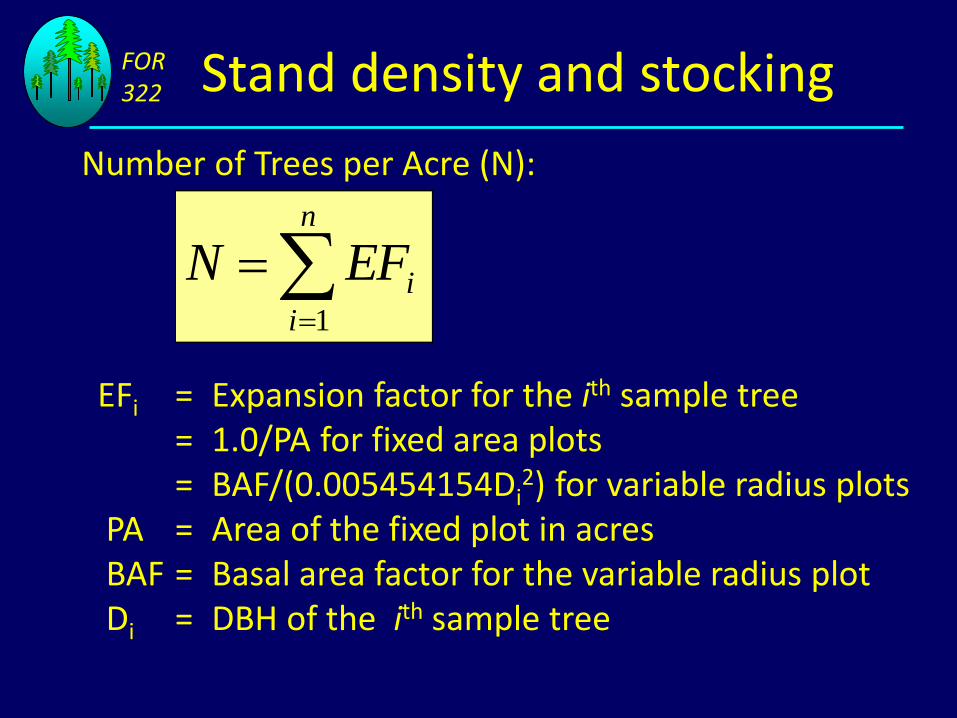
Number of Trees per Acre (N):
EFi = Expansion factor for the ith sample tree= 1.0/PA for fixed area plots= BAF/(0.005454154Di
2) for variable radius plotsPA = Area of the fixed plot in acresBAF = Basal area factor for the variable radius plotDi = DBH of the ith sample tree
n
i
iEFN1

FOR322 Stand density and stocking
Fixed area plots:
Circular: PA = πR2/43,560R = plot radius in feet
Square: PA = S2/43,560S = plot side length in feet
Rectangular: PA = S1S2/43,560Si = plot side length in feet

FOR322 Stand density and stocking
Expansion factors:
1/5 ac 5 trees per ac0.1 ac 10 trees per ac1/57.3 ac 57.3 trees per ac0.0175 ac 57.14 trees per ac30-ft radius or0.0648909 acor1/15.406 ac 15.406 trees per ac

FOR322 Stand density and stocking
N = 15 + 75 + 180 + 155 + 150 + 100 + 1-- + 80 + 55 + 30 + 10 + 15
= 965 trees per acre

FOR322 Stand density and stocking
• Definitions and concepts• Indices of stand density and stocking
• Number of trees per acre (N)
• Basal area per acre (BA)• Total cubic foot volume per acre (TV)• Crown competition factor (CCF)• Curtis’s relative density (RDC)• Reineke’s stand density index (SDI)
• Maximum size-density limit• Size-density trajectory
FOR322 Stand density and stocking
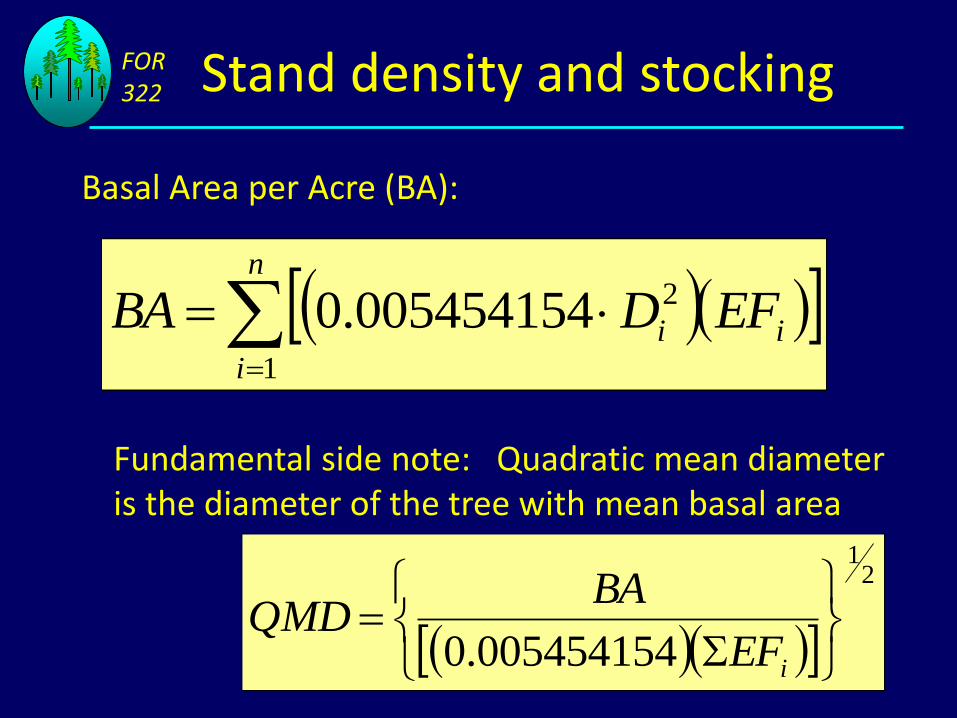
Basal Area per Acre (BA):
n
i
ii EFDBA1
2005454154.0
Fundamental side note: Quadratic mean diameter is the diameter of the tree with mean basal area
21
005454154.0
iEF
BAQMD
FOR322 Stand density and stocking
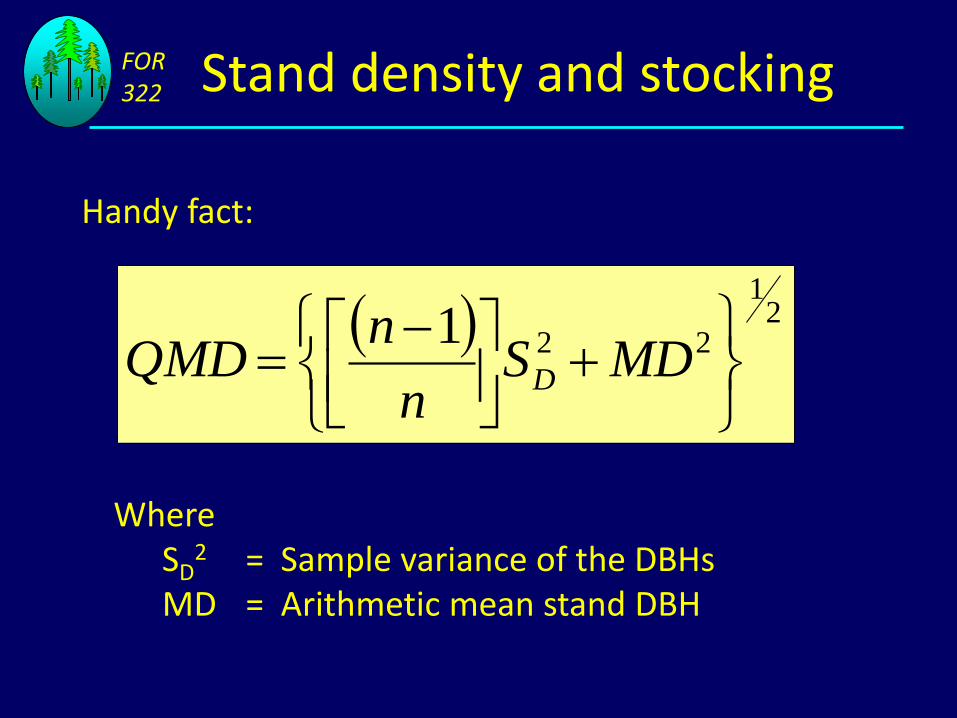
Handy fact:
21
221
MDS
n
nQMD D
WhereSD
2 = Sample variance of the DBHsMD = Arithmetic mean stand DBH
FOR322 Stand density and stocking
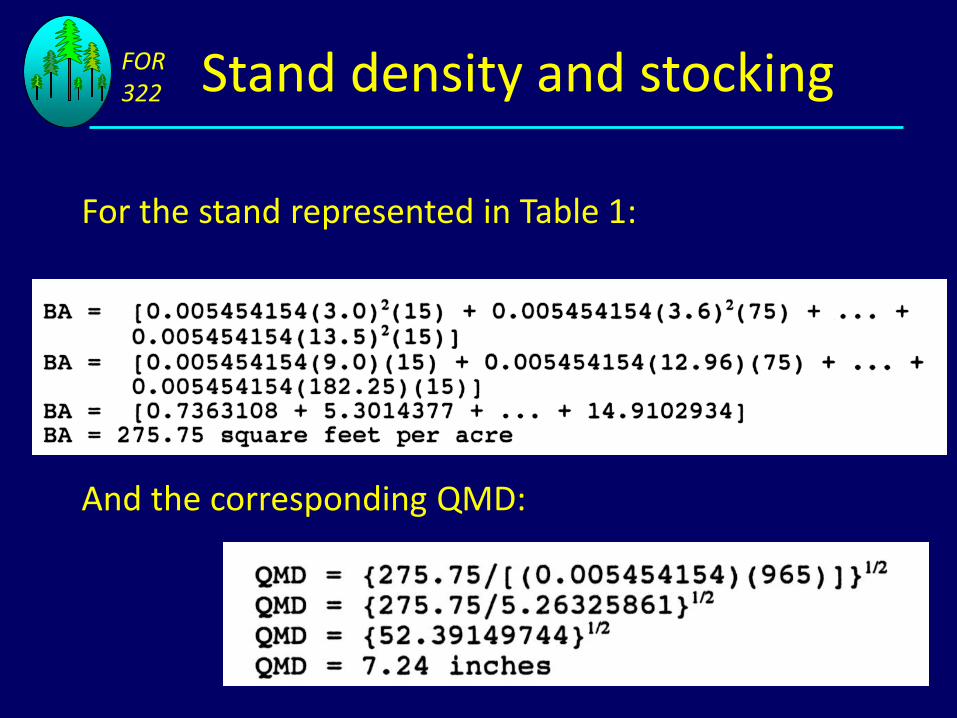
For the stand represented in Table 1:
And the corresponding QMD:
FOR322 Stand density and stocking
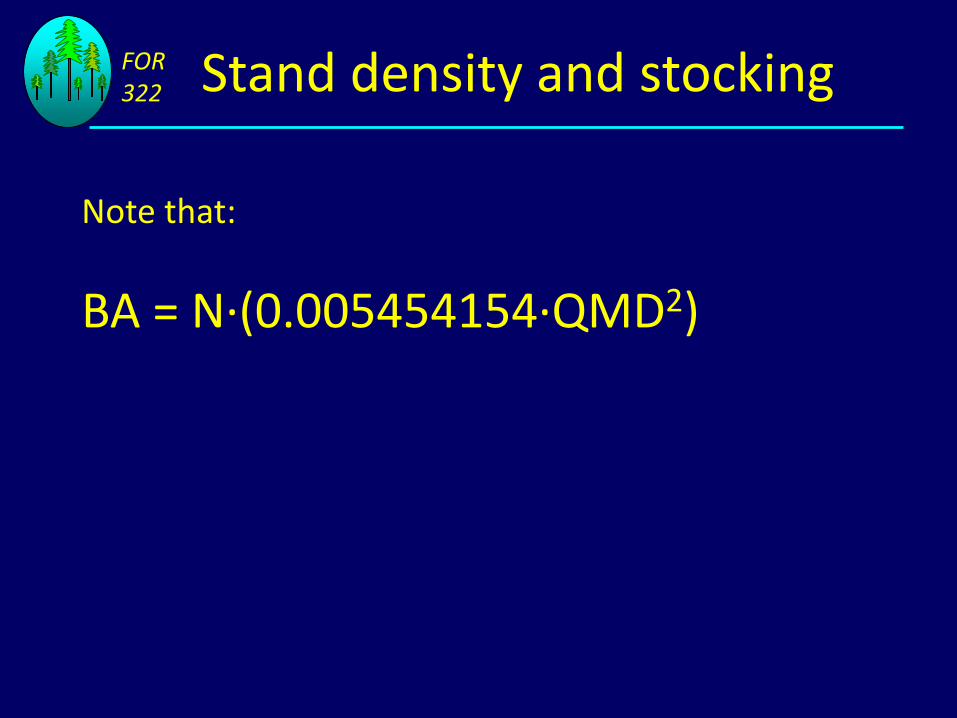
Note that:
BA = N·(0.005454154·QMD2)

FOR322 Stand density and stocking
• Definitions and concepts• Indices of stand density and stocking
• Number of trees per acre (N)• Basal area per acre (BA)
• Total cubic foot volume per acre (TV)• Crown competition factor (CCF)• Curtis’s relative density (RDC)• Reineke’s stand density index (SDI)
• Maximum size-density limit• Size-density trajectory
FOR322 Stand density and stocking
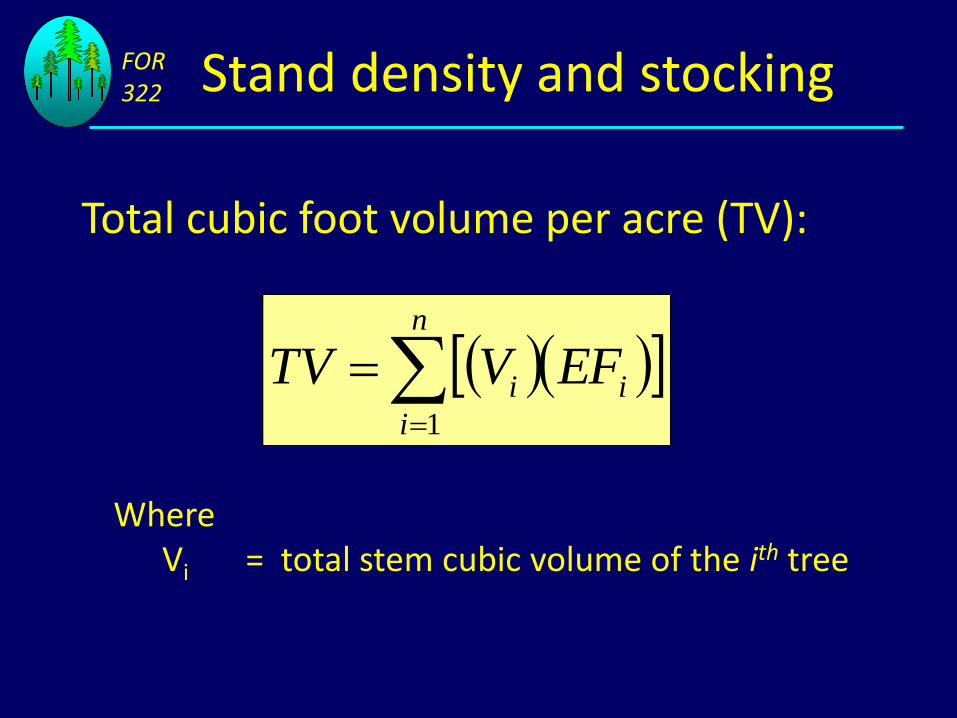
Total cubic foot volume per acre (TV):
n
i
ii EFVTV1
WhereVi = total stem cubic volume of the ith tree
FOR322 Stand density and stocking
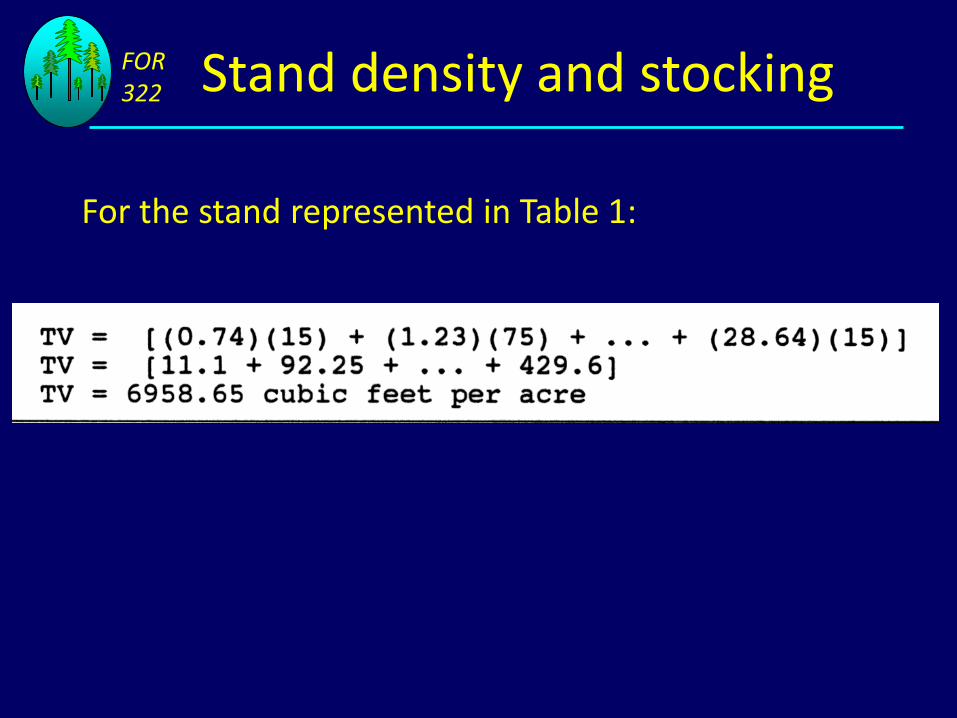
For the stand represented in Table 1:

FOR322 Stand density and stocking
N, BA, and TV as measures of stand density suffer from two problems with respect to interpretation:
1) For a given number of trees per acre, N, further information about average tree size is needed to know how crowded the trees are (e.g., big difference if QMD=5 inches or QMD=20 inches!)
2) For a given BA or TV, further information about number of trees per acre is needed to know how crowded the trees are (e.g., big difference if N=120 or N=1500!)
FOR322 Stand density and stocking
To address this problem of biological interpretation, other measures of stand density have been derived

FOR322 Stand density and stocking
• Definitions and concepts• Indices of stand density and stocking
• Number of trees per acre (N)• Basal area per acre (BA)• Total cubic foot volume per acre (TV)
• Crown competition factor (CCF)• Curtis’s relative density (RDC)• Reineke’s stand density index (SDI)
• Maximum size-density limit• Size-density trajectory
FOR322 Stand density and stocking
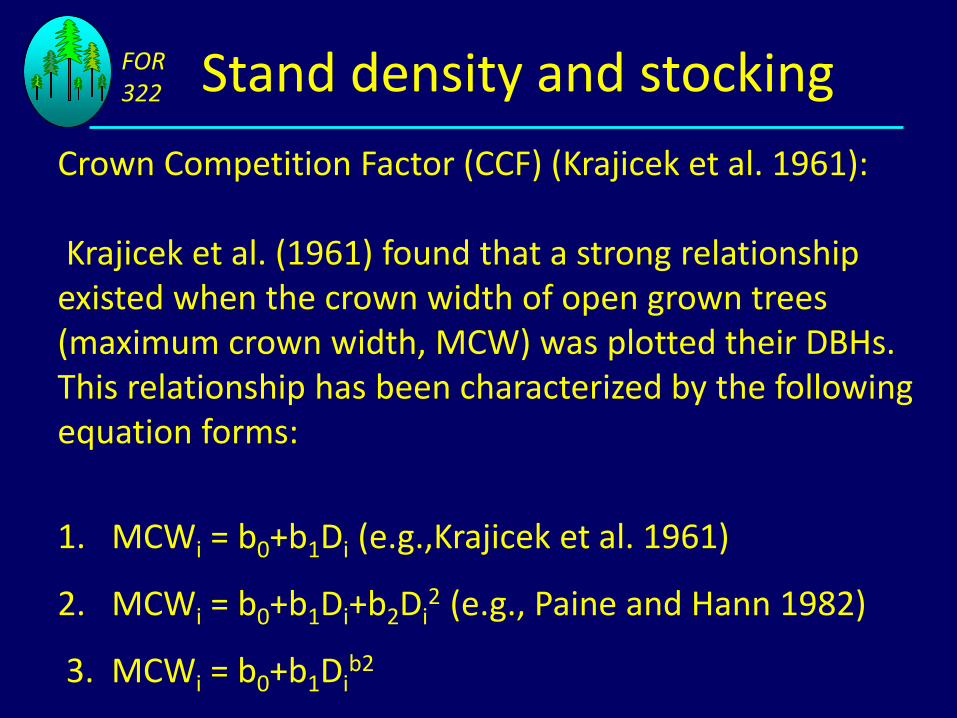
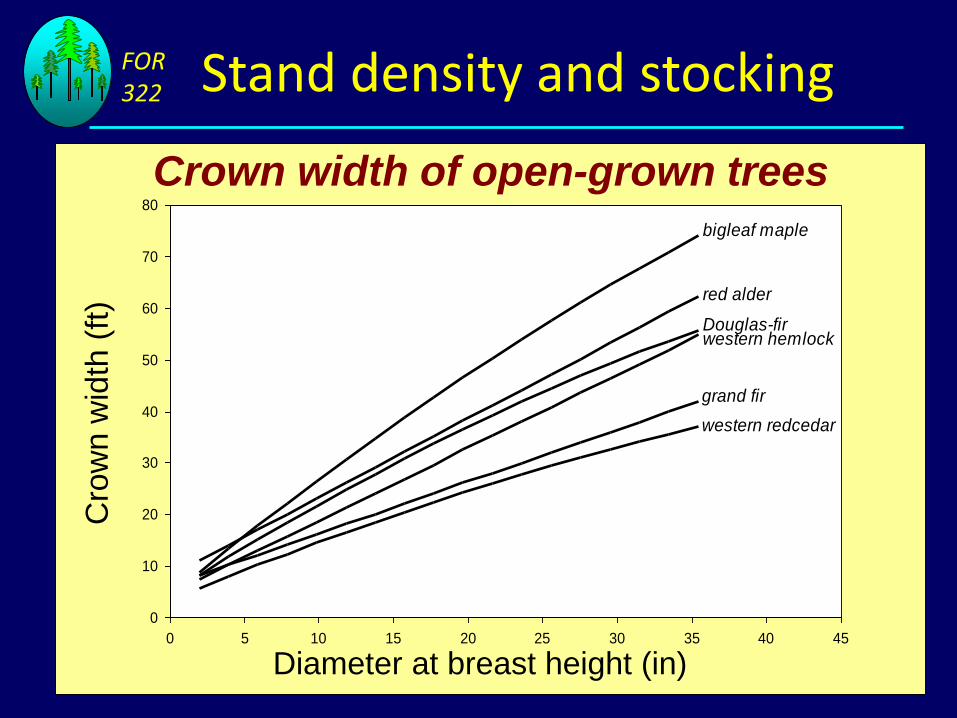
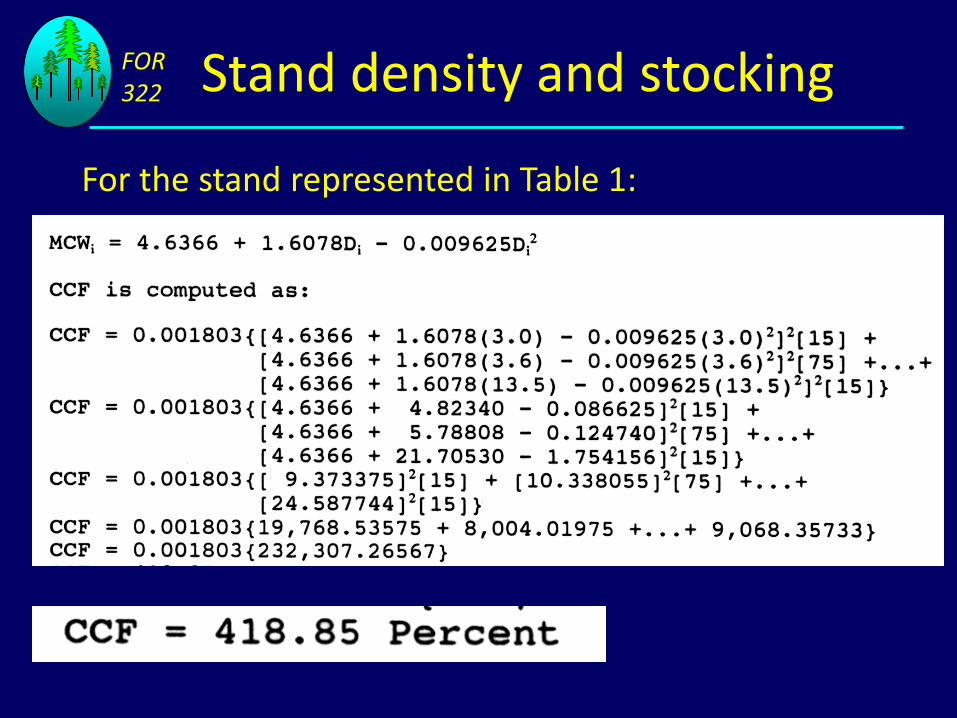
Crown Competition Factor (CCF) (Krajicek et al. 1961):
Krajicek et al. (1961) found that a strong relationship existed when the crown width of open grown trees (maximum crown width, MCW) was plotted their DBHs. This relationship has been characterized by the following equation forms:
1. MCWi = b0+b1Di (e.g.,Krajicek et al. 1961)
2. MCWi = b0+b1Di+b2Di2 (e.g., Paine and Hann 1982)
3. MCWi = b0+b1Dib2
FOR322 Stand density and stocking
0
10
20
30
40
50
60
70
80
0 5 10 15 20 25 30 35 40 45
bigleaf maple
red alder
western hemlockDouglas-fir
grand fir
western redcedar
Cro
wn w
idth
(ft
)
Diameter at breast height (in)
Crown width of open-grown trees

FOR322 Stand density and stocking
Krajicek et al. (1961) then applied this relationship to trees growing in a stand by:
1. Predicting the maximum crown width for each tree in the stand as if it were open grown
2. Computing the maximum crown area assuming the predicted open-grown crown was circular in shape
3. Summing the maximum crown areas for all trees in the stand
4. Dividing this sum by the number of square feet in an acre and multiplying the results by 100 to put it on a percent basis

FOR322 Stand density and stocking
Actual crown width
Actual and maximum potential crown projection areas:
Maximum potential crown width (MCW)
FOR322 Stand density and stocking
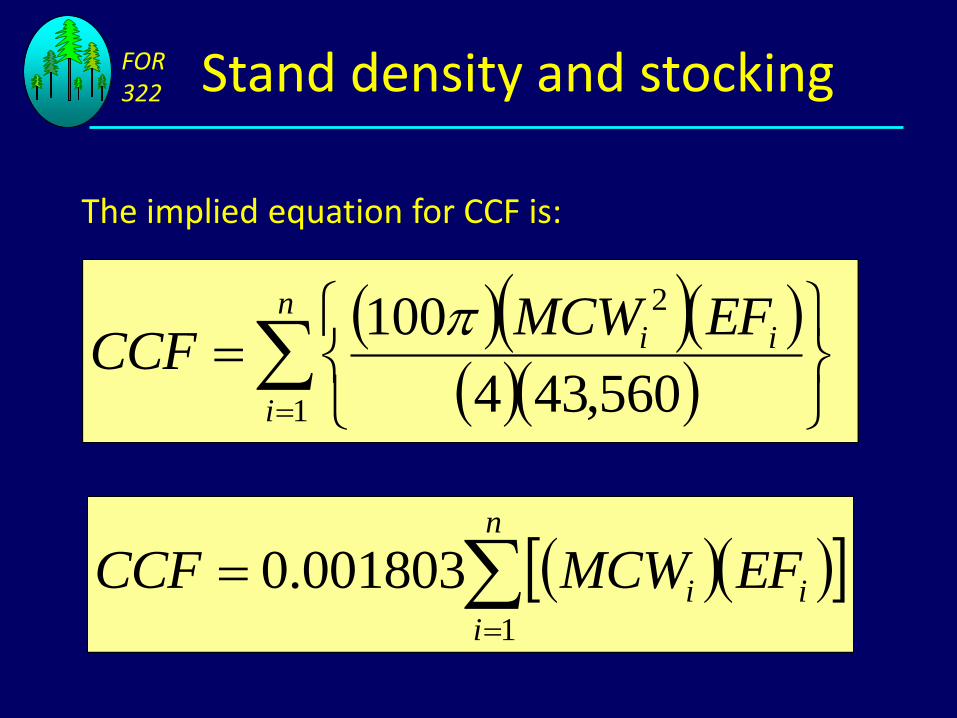
The implied equation for CCF is:
n
i
ii EFMCWCCF
1
2
560,434
100
n
i
ii EFMCWCCF1
001803.0

FOR322 Stand density and stocking
Actual crown projection areas:
Crown cover = 75%

FOR322 Stand density and stocking
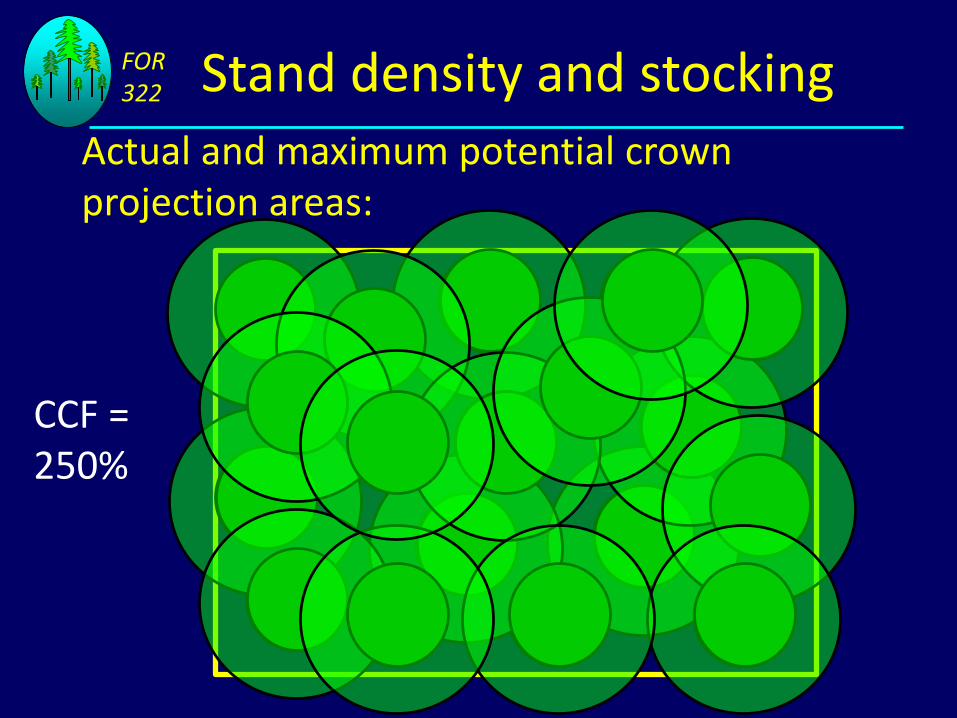
Actual and maximum potential crown projection areas:
FOR322 Stand density and stocking
Actual and maximum potential crown projection areas:
CCF = 250%

FOR322 Stand density and stocking
• CCF computes a % crown closure for the stand assuming all trees are open grown
• Theoretically, a CCF value of 100% indicates that the trees in the stand are just beginning to experience competition (i.e., about 100% canopy cover)
• As CCF increases above 100%, the level of competition between trees increases (but canopy cover remains ≤100%)
• All stands with the same CCF value are experiencing the same level of competition
• CCF is, therefore, a measure of relative density that uses 100% crown closure as the basis for comparisons

FOR322 Stand density and stocking
Note that if
MCWi = b0+b1Di
Then CCF becomes:
CCF = k1(N) + k2(N)(MD) + k3(BA)
Where,k1 = 0.001803b0
2
k2 = 0.003606b0b1
k3 = 0.330579b12
In other words, CCF can be regarded as a weighted linear combination of N, BA, and MD
FOR322 Stand density and stocking
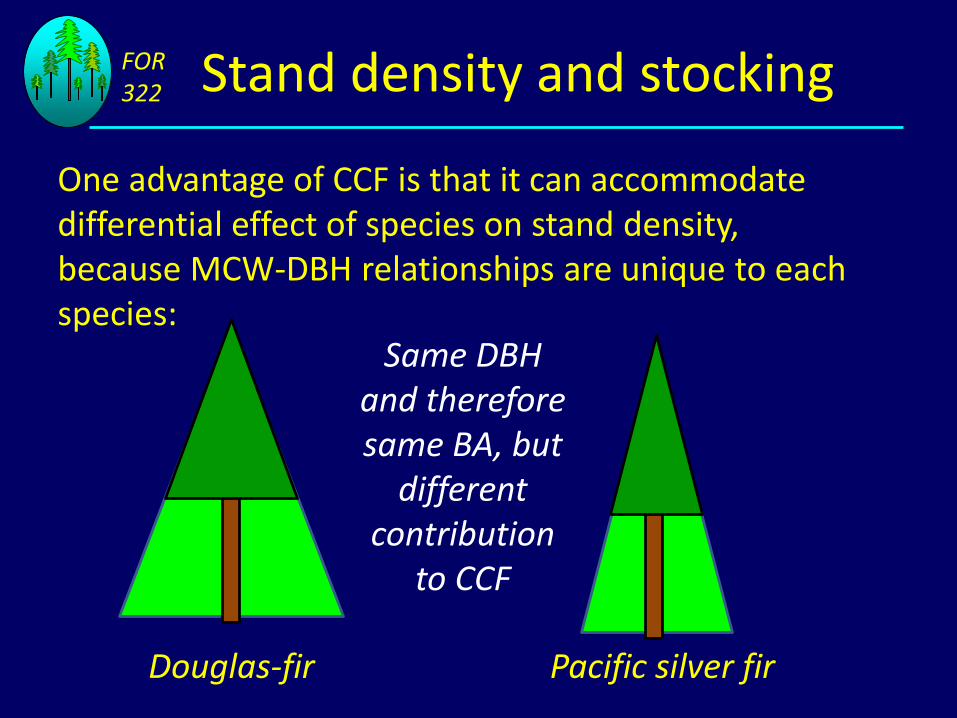
One advantage of CCF is that it can accommodate differential effect of species on stand density, because MCW-DBH relationships are unique to each species:
Douglas-fir Pacific silver fir
Same DBH and therefore same BA, but
different contribution
to CCF
FOR322 Stand density and stocking
For the stand represented in Table 1:
FOR322 Stand density and stocking
• Definitions and concepts• Indices of stand density and stocking
• Number of trees per acre (N)• Basal area per acre (BA)• Total cubic foot volume per acre (TV)• Crown competition factor (CCF)
• Curtis’s relative density (RDC)• Reineke’s stand density index (SDI)
• Maximum size-density limit• Size-density trajectory

FOR322 Stand density and stocking
Curtis' (l982) Relative Density (RDC):
RDC is derived from:
RD = observed BA / maximum BA
= BA/BAm
Curtis (1982) found that, in stands at maximum density,
the maximum BA (BAm) could be predicted by:
BAm = b1(QMD)b2

FOR322 Stand density and stocking
Therefore,
RD = BA/[b1(QMD)b2]
Because b1 is just a multiplier, it doesn’t affect relative
density rankings among stands, so Curtis decided to set:
b1 = 1
In coastal Douglas-fir, Curtis found that b2 ranged from
0.45 to 0.50, so he set
b2 = 0.5

FOR322 Stand density and stocking
The resulting formula for Curtis’s relative density is:
RDC = BA/[(QMD)1/2]
or
= 0.005454154(N)(QMD)3/2
or
= (0.005454154)1/4 (N)1/4 (BA)3/4

FOR322 Stand density and stocking
For the stand represented in Table 1:

FOR322 Stand density and stocking
• Definitions and concepts• Indices of stand density and stocking
• Number of trees per acre (N)• Basal area per acre (BA)• Total cubic foot volume per acre (TV)• Crown competition factor (CCF)• Curtis’s relative density (RDC)
• Reineke’s stand density index (SDI)• Maximum size-density limit• Size-density trajectory
FOR322 Stand density and stocking
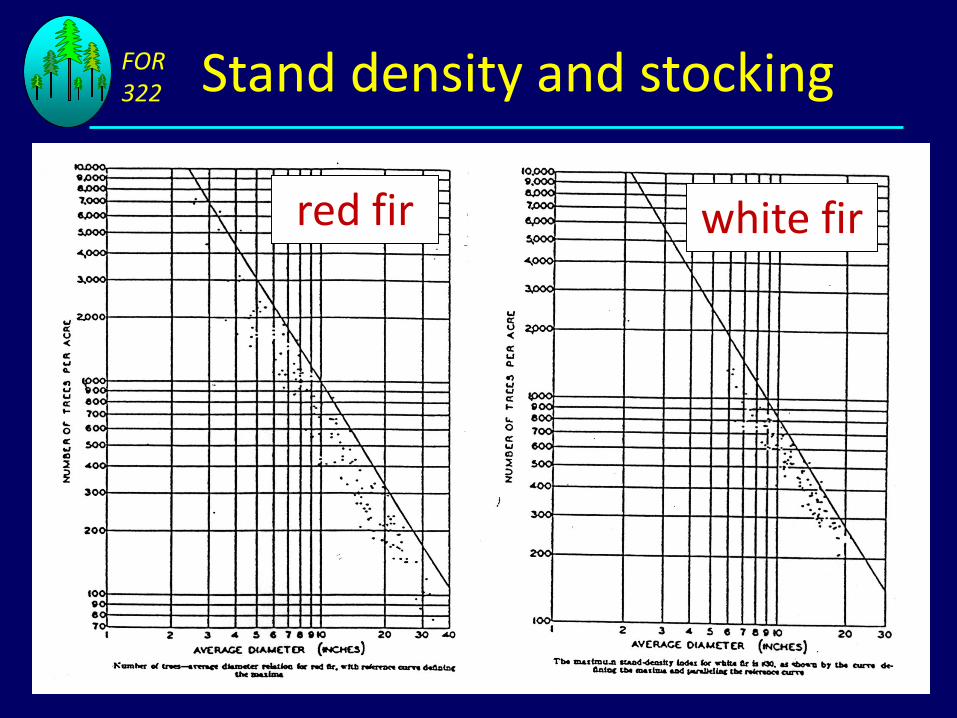
red fir white fir

FOR322 Stand density and stocking
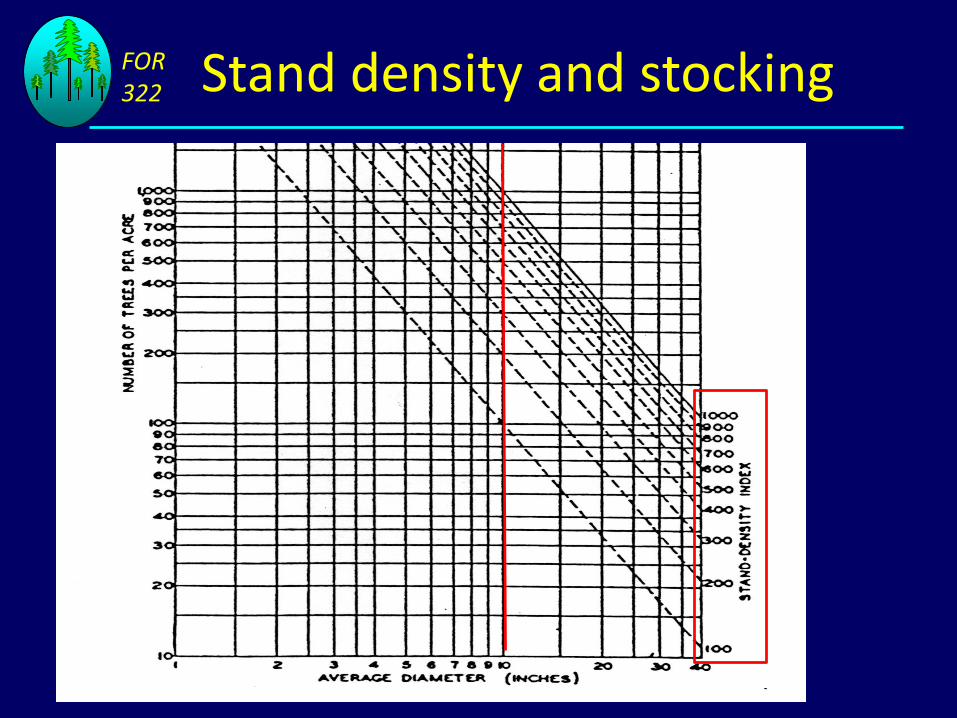
Reineke`s (1933) Stand Density Index (SDI):
Reineke (1933) found that when the logarithm of N was plotted on the logarithm of QMD for even-aged stands at maximum stand density, the relationship was linear for many species:
LOG(Nm) = b0 + b1LOG(QMD)
Where Nm = Maximum number of trees possible for a stand of given QMD
LOG = Base 10 logarithm

FOR322 Stand density and stocking
CA mixed conifer
OR/WA Douglas-fir CA
Douglas-fir

FOR322 Stand density and stocking
LOG(Nm) = b0 + b1LOG(QMD)
Reineke (l933) found the value of b1 to be -1.605 regardless of species.
However, Reineke's (1933) values for b0 do differ substantially between species.

FOR322 Stand density and stocking
To form SDI, Reineke (1933) assumed that a specific stand falling on a line parallel to the maximum line experienced the same level of competition as all other stands falling on the same line:
LOG(N) = K - 1.605 LOG(QMD)
LOG(QMD)
LO
G(N
)
Size-density limit
(maximum SDI)
FOR322 Stand density and stocking
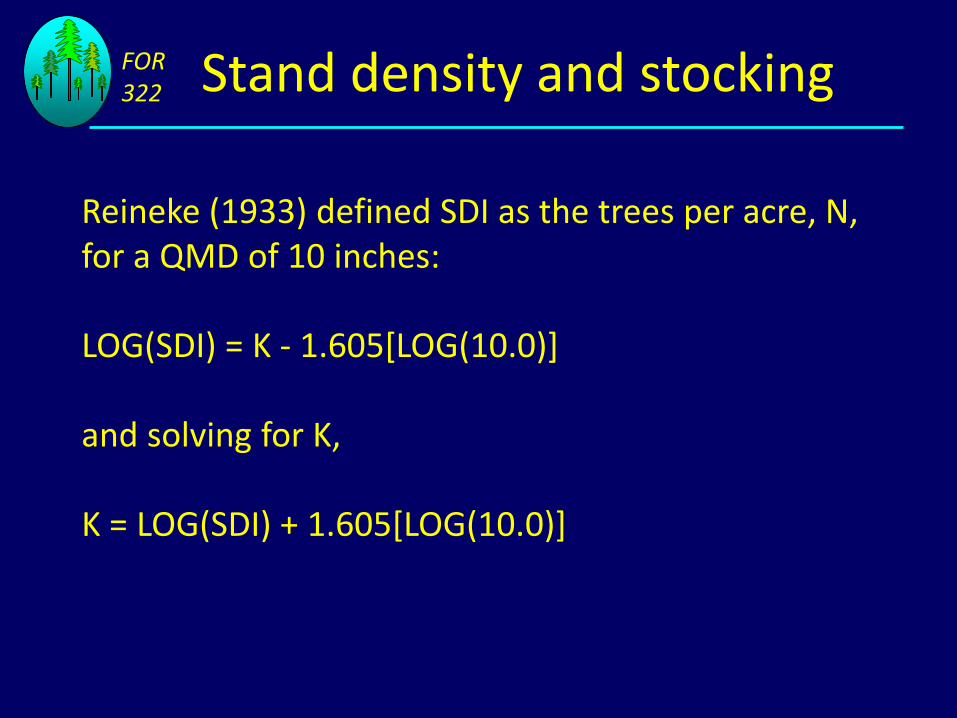
Reineke (1933) defined SDI as the trees per acre, N, for a QMD of 10 inches:
LOG(SDI) = K - 1.605[LOG(10.0)]
and solving for K,
K = LOG(SDI) + 1.605[LOG(10.0)]

FOR322 Stand density and stocking
FOR322 Stand density and stocking

FOR322 Stand density and stocking
With fixed slope on relationship between log(QMD) and
log(N), we can determine what SDI is implied by a given
combination of QMD and N:
LOG(SDI) = LOG(N) - 1.605[LOG(10.0/QMD)]
or transforming both side by exponentiating:
605.1605.1
10
0.10
QMDN
QMDNSDI
FOR322 Stand density and stocking
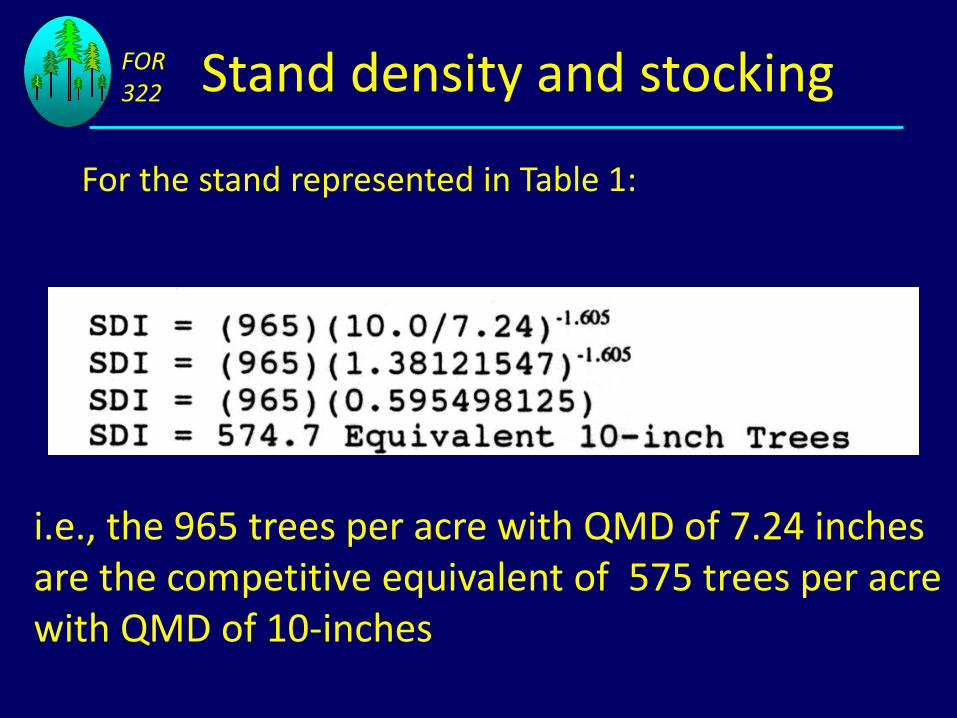
For the stand represented in Table 1:
i.e., the 965 trees per acre with QMD of 7.24 inches are the competitive equivalent of 575 trees per acre with QMD of 10-inches
Density (tpa)
Tre
e s
ize (
Dq
, in
ch
es
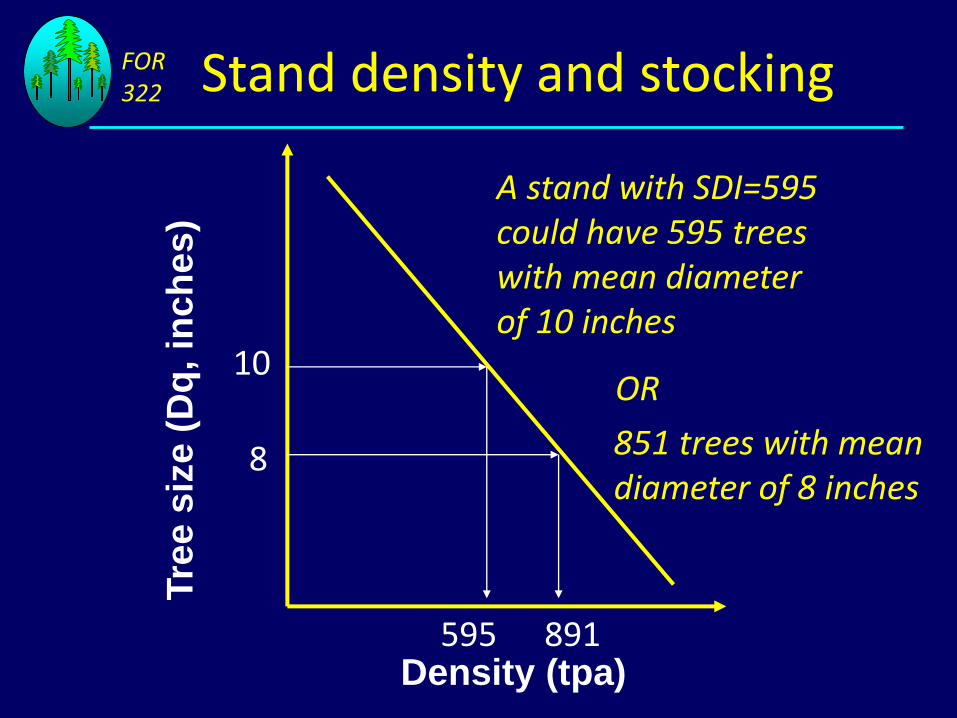
)A stand with SDI=595 could have 595 trees with mean diameter of 10 inches
OR10
595
851 trees with mean diameter of 8 inches
8
891
FOR322 Stand density and stocking
FOR322 Stand density and stocking
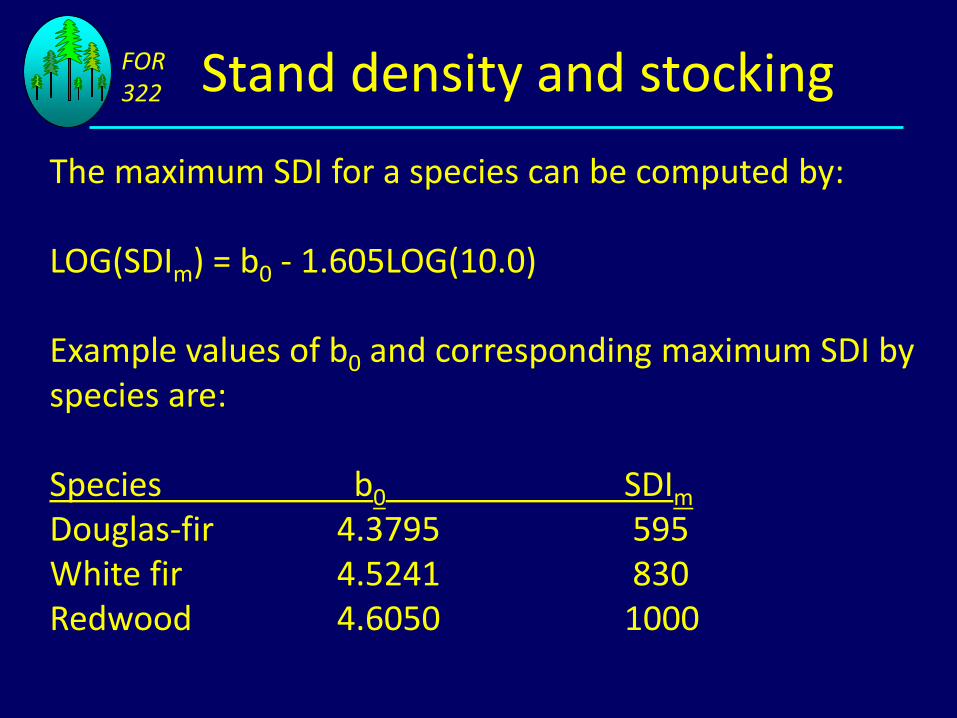
The maximum SDI for a species can be computed by:
LOG(SDIm) = b0 - 1.605LOG(10.0)
Example values of b0 and corresponding maximum SDI by species are:
Species b0 SDIm
Douglas-fir 4.3795 595White fir 4.5241 830Redwood 4.6050 1000

FOR322 Stand density and stocking
Maximum size-density limits for different tree species and yield classes within species
from Harper (1977) Population Biology of Plants.
FOR322 Stand density and stocking
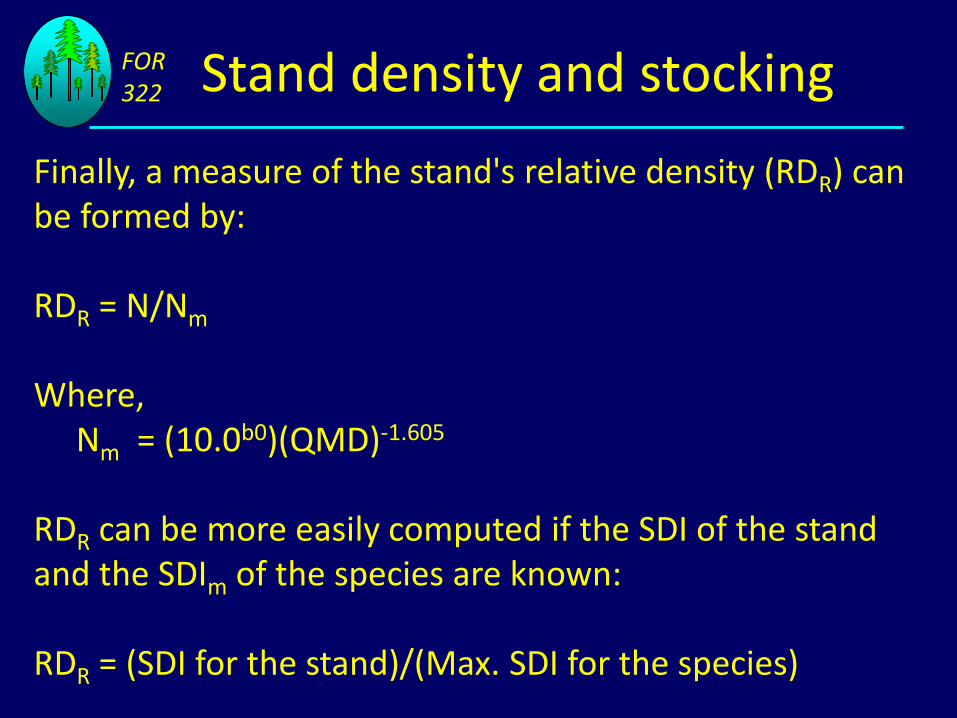
Finally, a measure of the stand's relative density (RDR) can be formed by:
RDR = N/Nm
Where,Nm = (10.0b0)(QMD)-1.605
RDR can be more easily computed if the SDI of the stand and the SDIm of the species are known:
RDR = (SDI for the stand)/(Max. SDI for the species)

FOR322 Stand density and stocking
For the stand represented in Table 1:
RDR = 574.7 / 595.0= 0.9659
(Assuming maximum SDI for coastal Douglas-fir is 595)

FOR322 Stand density and stocking
• Definitions and concepts• Indices of stand density and stocking
• Number of trees per acre (N)• Basal area per acre (BA)• Total cubic foot volume per acre (TV)• Crown competition factor (CCF)• Curtis’s relative density (RDC)• Reineke’s stand density index (SDI)
• Maximum size-density limit• Size-density trajectory
FOR322 Stand density and stocking
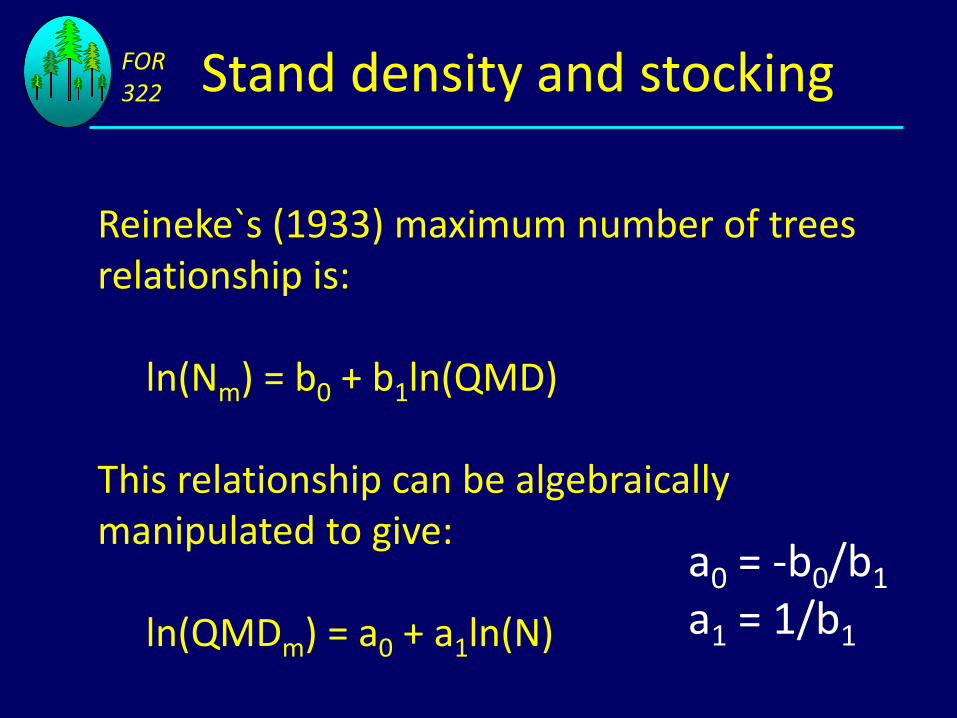
Reineke`s (1933) maximum number of trees relationship is:
ln(Nm) = b0 + b1ln(QMD)
This relationship can be algebraically manipulated to give:
ln(QMDm) = a0 + a1ln(N)
a0 = -b0/b1
a1 = 1/b1
FOR322 Stand density and stocking
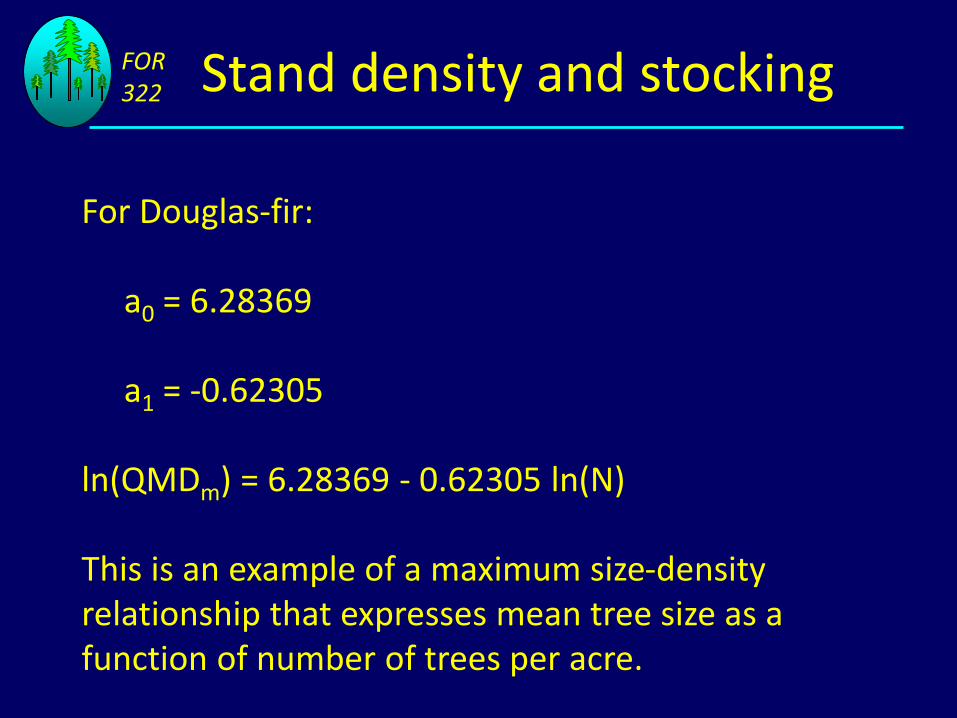
For Douglas-fir:
a0 = 6.28369
a1 = -0.62305
ln(QMDm) = 6.28369 - 0.62305 ln(N)
This is an example of a maximum size-density relationship that expresses mean tree size as a function of number of trees per acre.

FOR322 Stand density and stocking
Other measures of mean tree size that have found broad use are mean tree volume and mean tree biomass.
For example, Drew and Flewelling (1979) present the following relationship for Douglas-fir, with slope of -3/2 derived from “-3/2 law of self-thinning”:
ln(MVm) = 12.644 - (3/2)·ln(N)
Where
MVm = Maximum volume per tree in a stand of density N
FOR322 Stand density and stocking
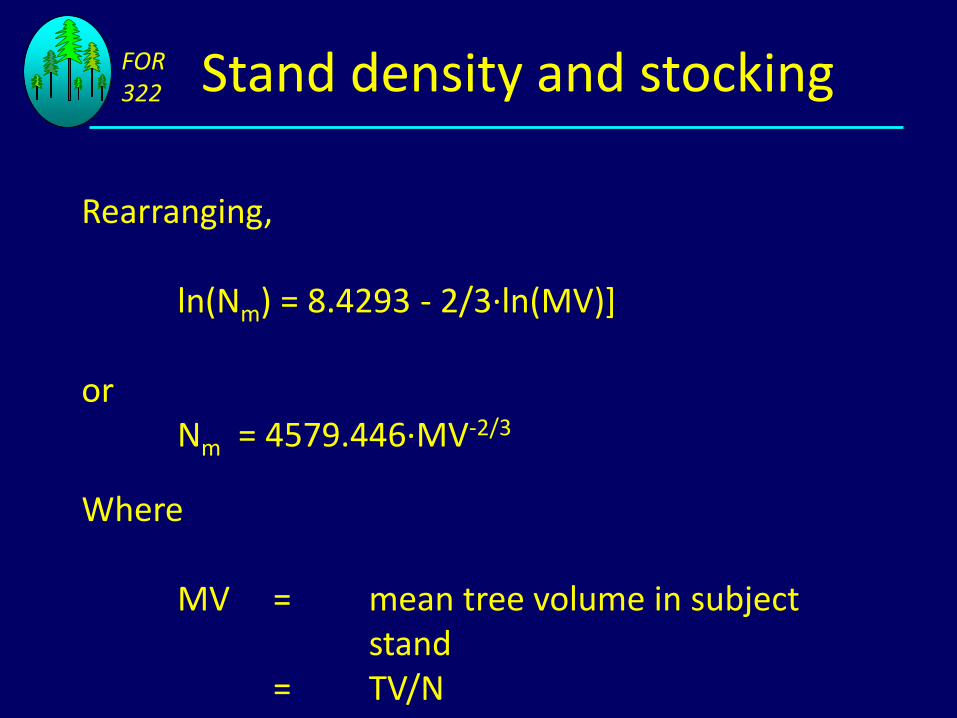
Rearranging,
ln(Nm) = 8.4293 - 2/3·ln(MV)]
orNm = 4579.446·MV-2/3
Where
MV = mean tree volume in subject stand
= TV/N
FOR322 Stand density and stocking
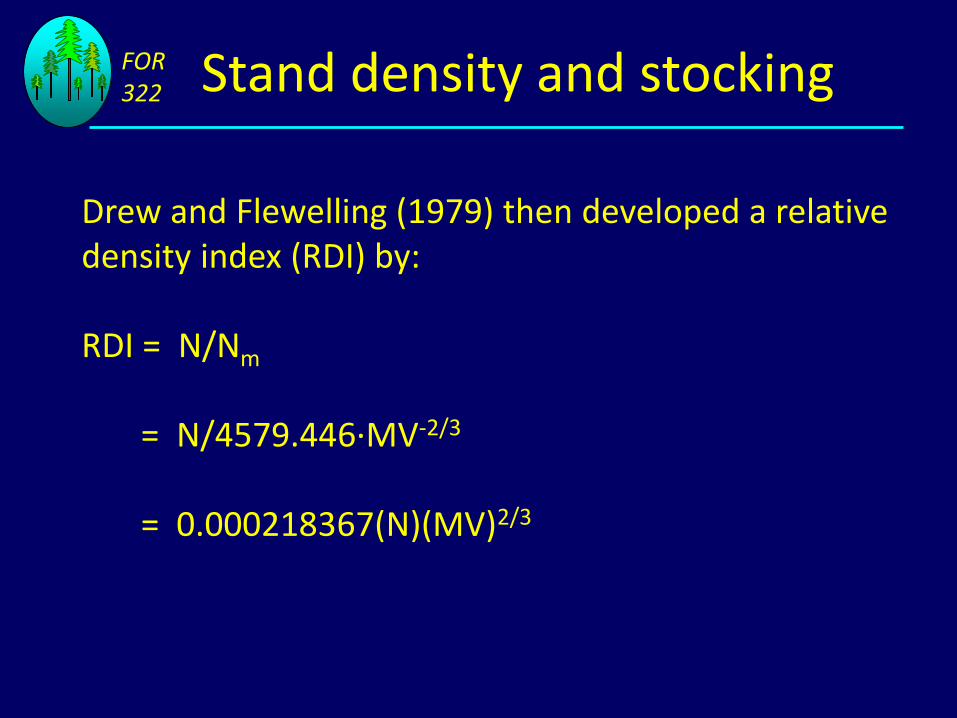
Drew and Flewelling (1979) then developed a relative density index (RDI) by:
RDI = N/Nm
= N/4579.446·MV-2/3
= 0.000218367(N)(MV)2/3

FOR322 Stand density and stocking
For the stand represented in Table 1:
RDI = (0.0002183676)(965)(6958.65/965)2/3
= (0.0002183676)(965)(7.211036269)2/3
= (0.0002183676)(965)(3.732488285)= 0.7865
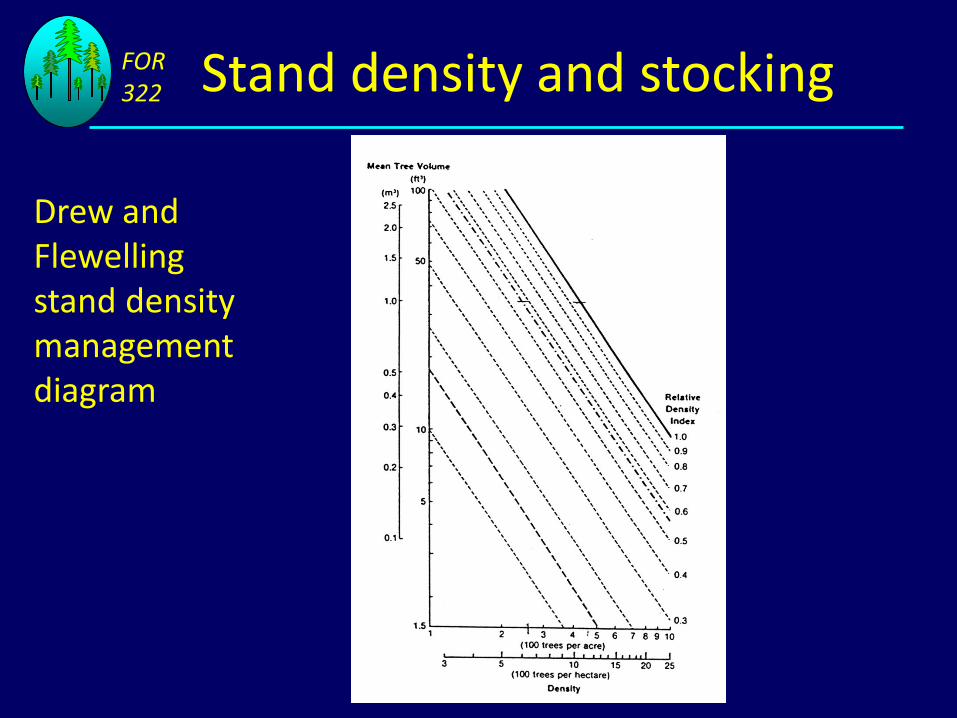
Drew and Flewelling (1979) then constructed a stand density management diagram for Douglas-fir based on their maximum size-density line and relative density index

FOR322 Stand density and stocking
Drew and Flewelling stand density management diagram
(Note isopleths for mean stand diameter and height)

FOR322 Stand density and stocking
Drew and Flewelling proposed the following hypotheses concerning stand growth:
1) At densities below crown closure (less than 0.15 relative density) growth per unit area is proportional to density.
2) At relative densities beteen 0.15 and 0.40, growth per unit area increases with density, but growth per tree declines.
3) At relative densities between 0.40 and 0.55, growth per unit area is unaffected by density.
4) For relative densities greater than 0.55, gross growth is the same as in the 0.40 to 0.55 region, but net growth may be considerably less than this if substantial mortality has occurred.
FOR322 Stand density and stocking
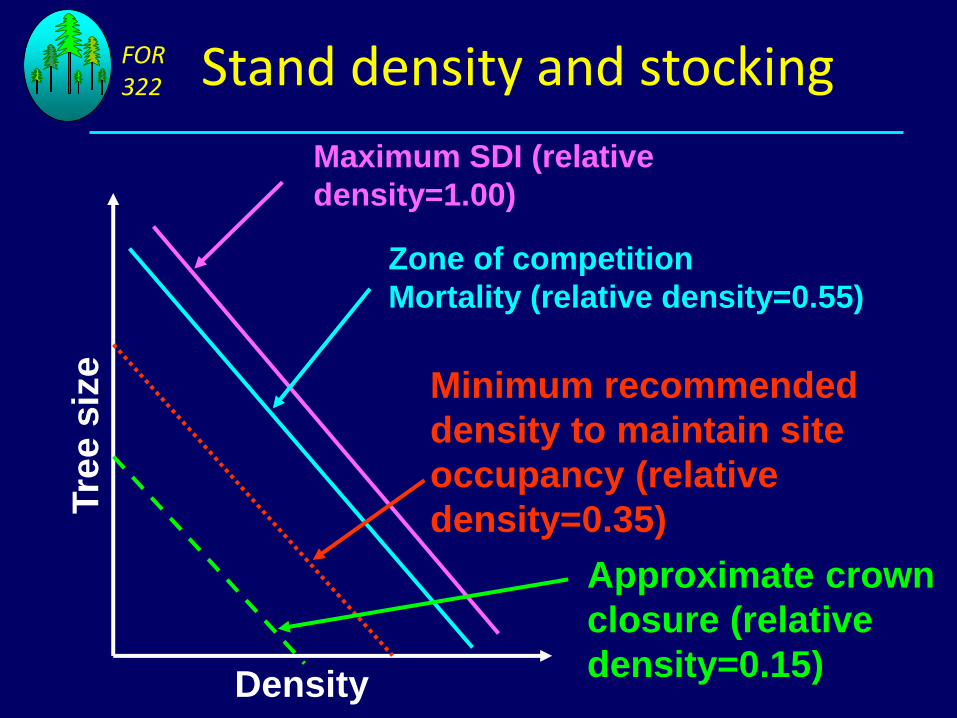
Drew and Flewelling stand density management diagram
Density
Tre
e s
ize
Zone of competition
Mortality (relative density=0.55)
Minimum recommended
density to maintain site
occupancy (relative
density=0.35)
Maximum SDI (relative
density=1.00)
Approximate crown
closure (relative
density=0.15)
FOR322 Stand density and stocking

FOR322 Stand density and stocking
Similar stand density management diagram, but based on QMD rather than MV (like Reineke but with axes switched)
600
from Long et al. (1988)
FOR322 Stand density and stocking
• Definitions and concepts• Indices of stand density and stocking
• Number of trees per acre (N)• Basal area per acre (BA)• Total cubic foot volume per acre (TV)• Crown competition factor (CCF)• Curtis’s relative density (RDC)• Reineke’s stand density index (SDI)
• Maximum size-density limit
• Size-density trajectory

FOR322 Stand density and stocking
The maximum size-density line only defines the maximum size that trees can attain for a given N.
Implied in the concept of a maximum size-density limit is the development of stands in a way that they approach the maximum size density limit and track (or become asymptotic to) this limit as they self-thin and suppression mortality proceeds.
The path that stands follow has been referred to as
the size-density trajectory.

FOR322 Stand density and stocking
Time trajectory of stands over stand density management diagram (from Drew and Flewelling 1979)

FOR322 Stand density and stocking
Red alder

FOR322 Stand density and stocking
Smith and Hann (1984) modeled stand trajectories as they approached the maximum size-density limit as:
ln(Y) = a0 + a1ln(N) – (a0a2)exp{-a3[ln(N0) – ln(N)]a4}
WhereY = Mean tree sizeN = Current number of trees per acreN0 = Number of trees per acre at initiation of
mortality)a0, a1 = Parameters defining the maximum size-
density line
FOR322 Stand density and stocking
Important points about the size-density trajectory:
• The trajectories describe unthinned, self-thinning stands; thinned stands behave differently.
• The specific trajectory a stand follows depends only upon the initial trees per acre, N0
• The shape of the trajectory is not a function of productivity; productivity affects how fast the stand moves along the trajectory, but not the path
• The size-density trajectory is static – it does not predict the rate of movement of a stand along the trajectory; a dynamic model requires addition of a model for rate of mortality.

Density
Tre
e s
ize
Heavy thinning
Light thinning
FOR322 Stand density and stocking
FOR322 Stand density and stocking
Can also model the size-density trajectory with QMD instead of mean volume or biomass.
One approach is to use the reciprocal of the Reineke slope : 1/-1.605 = -0.62305
Under this slope, stands growing along their maximum SDI will increase in basal area over time.
With a slope of -0.5, stands growing along their maximum SDI will have constant basal area.

FOR322 Stand density and stocking
Why are the maximum size-density limit and maximum size-density trajectories important?
FOR322 Stand density and stocking
Why are the maximum size-density limit and maximum size-density trajectories important?
• Stand density management• Current assessment of stand density relative
to management objective• Design of thinning regime to meet stand
management objective• Constraint on growth models; check on
individual-tree mortality model

FOR322
End 30 January 2015
Stand density and stocking


