
Standard Chem. and Pharm. Co., Ltd. (SCP) Investor Conference
2017.04.25
1
Stock Ticker: 1720
免責聲明Safe Harbor Notice
本次簡報與討論包含特定預測性的說明,而其內容有關於營運結果、財務狀況,以及對未來事件的預期。因為此等前瞻性說明是有關於未來事件,而且取決於未來發生時的環境因素,所以必然含有風險與不確定性。
本公司將不負擔公開更新或修改這些預測性的說明之義務,無論是出現新資訊、未來發生任何事件,或其他情況。實際結果可能與此等預測性說明推測的內容有重大差異。
In these presentations and discussions, there are certain forward lookingstatements regarding the results of operation, financial condition andcurrent expectation about future events. As forward-looking statementsrelate to events and depend on circumstances in the future, they involverisk and uncertainty.
We do not undertake any obligation to publicly revise or update anyforward looking statements for availability of new information, futureevents or otherwise. Real result probably differ substantially from thoseexpected in these forward-looking statements.
2

Conference Agenda
1. Introduction to Standard Pharmaceutical Group (SCP Group)
� Standard – History, Accomplishments
� Group Organizational Structure – Corporate Structure, Resource Integration
� Standard Pharmaceutical Group (SCP Group)
2. 2016 Financial Statements
� Income Statement
� Balance Sheet
� Global Revenue
3. Forward-looking
� Pharmaceutical Industry Forecast
� Actions for Revenue Growth
� Forward-looking Strategy
4. Corporate Social Responsibility (CSR)
3

Introduction to Standard Pharmaceutical Group
(SCP Group)
4

JDMC - 2008
TGA - 2009
FDA - 2011
Standard Chem. and Pharm. Co., Ltd (SCP) –Historical Milestones
5
1967 SCP is formally established
1995 SCP’s Initial Public Offering
1988 SCP is first Taiwan pharma company to be ISO9001 certified
2000 SCP is first TW company to pass US FDA inspection
and officially enter the international pharmaceutical market
2008 SCP receives PMDA “Certificate of Foreign Drug Manufacturer”
2009 SCP’s API plant passes TGA inspection
2010 SCP passes TW PIC/S GMP inspection
2011 SCP passes US-FDA cGMP inspection with no 483
2012 SCP passes K-FDA inspection, and is certified GDP by the T-FDA
2014 SCP receives the Gold Award for Outstanding Biotechnology Company
2015 SCP receives its first US-FDA approved ANDA
2015 SCP receives the Little Giants Citizen’s Award for CSR
2016 SCP receives the Citizen’s Award for CSR
2017 SCP is ranked in the Top 20th Percentile of Taiwanese listed Companies by the Taiwan
Stock Exchange
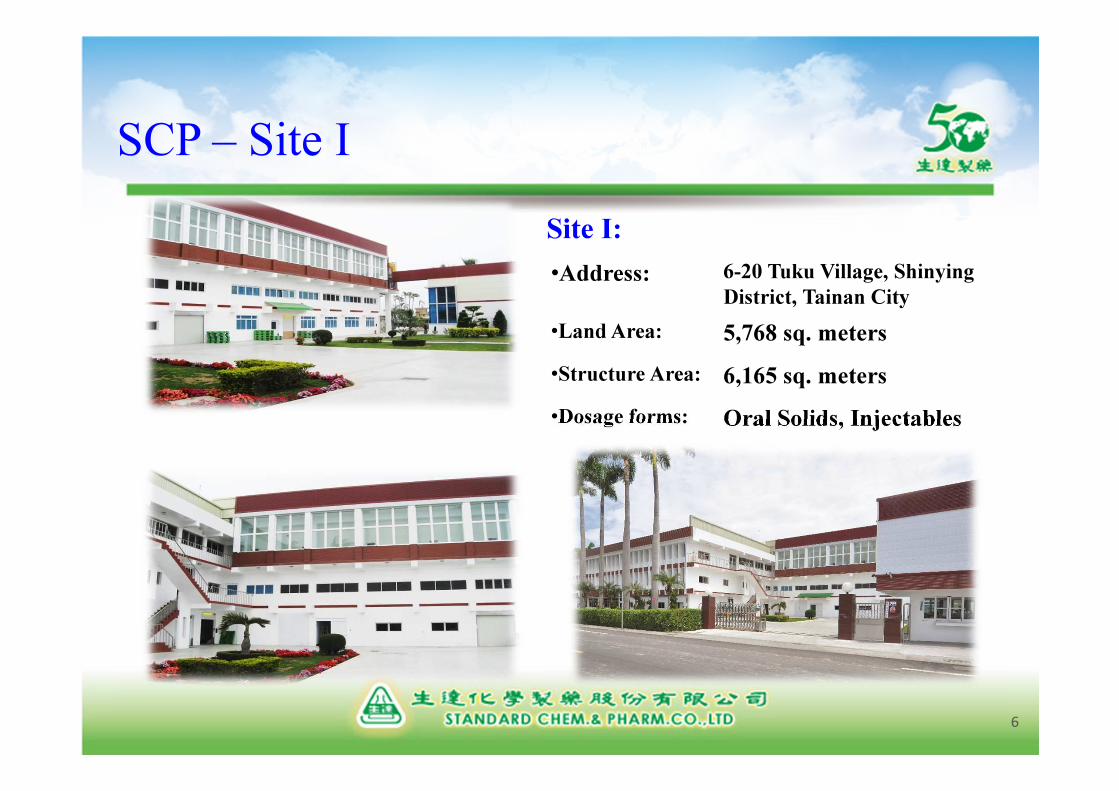
Site I:
SCP – Site I
6
•Address: 6-20 Tuku Village, Shinying
District, Tainan City
•Land Area: 5,768 sq. meters
•Structure Area: 6,165 sq. meters
•Dosage forms: Oral Solids, Injectables

•Address 154 Kaiyuan Rd., Shinying
District, Tainan City
• Land Area: 54,860 sq. meters
• Structure Area: 40,562 sq. meters
• Dosage Forms: Oral Solids, Liquids, Creams,
Suppositories, Gauze
SCP – Site II
7
Site II ::::

SCP – R&D Accomplishments
�SCP - R&D Expenditures and Ratio of past 5 years
�SCP – Dossier submission of past 5 years
8
Dossier
Submissions2012 2013 2014 2015 2016
Taiwan 12 14 10 16 9
Foreign Markets 0 10 23 17 14
Total 12 24 33 33 23
2012 2013 2014 2015 2016
R&D Expenditures 172,406 167,533 183,196 174,730 182,911
% of Total revenue 8% 7% 8% 8% 7%

Standard Pharmaceutical Group
SCP
SyngenBiotech
Chia Scheng
Investment
InforightTechnology
AdvPharmaStandard Chem. &
Pharm. Co.
Jiangsu Standard Biotech
Standard Philippines
SourireeBiotech
Multipower
Enterprise
Jiangsu Standard-DiaBiopharma
Santos Biotech
9

2012
Your Chance
Pharmacy
Chain
1967
SCP is
established
1982
Syn-Tech is
established
1999
Syn-Gen:
API Fermentation
& Biochemical
Nutrition
1999
AdvPharma:
researches
Chinese oncology
medicine
2000
Inforight Tech:
Hardware &
Software 2000
CNH:
Intermediates
& API
2009
Souriree
Biotech
Pharm.
SCP Group – Resource Integration
10
2010
Standard-Dia:
Patches
2010
Multipower
Enterprise
Corp.
1998
Chia-Scheng:
makes foreign
investments

� Focus on Western Pharmaceuticals
� Various Dosage Forms:
.
SCP – Operational Activities
11
Oral Solids, Injectables, Ointments, Liquids, Nasal Sprays, Suppositories, etc
� APIs: Human and Veterinarian Use

SCP –Most Important Milestones of Past 2 Years
�Taiwan
• Distributor for Japanese DSP new drug Latuda® launched
in 2017
• Licensed for Vertically Integrated manufacturing ofJapanese DSP drug Erispan®
�U.S.
• Continuous export of Repaglinide (for type 2 diabetes)
�Japan
• ODM for Japanese partner for Asthma drug Montelukast
• Montelukast launches in Japan in 2016
12
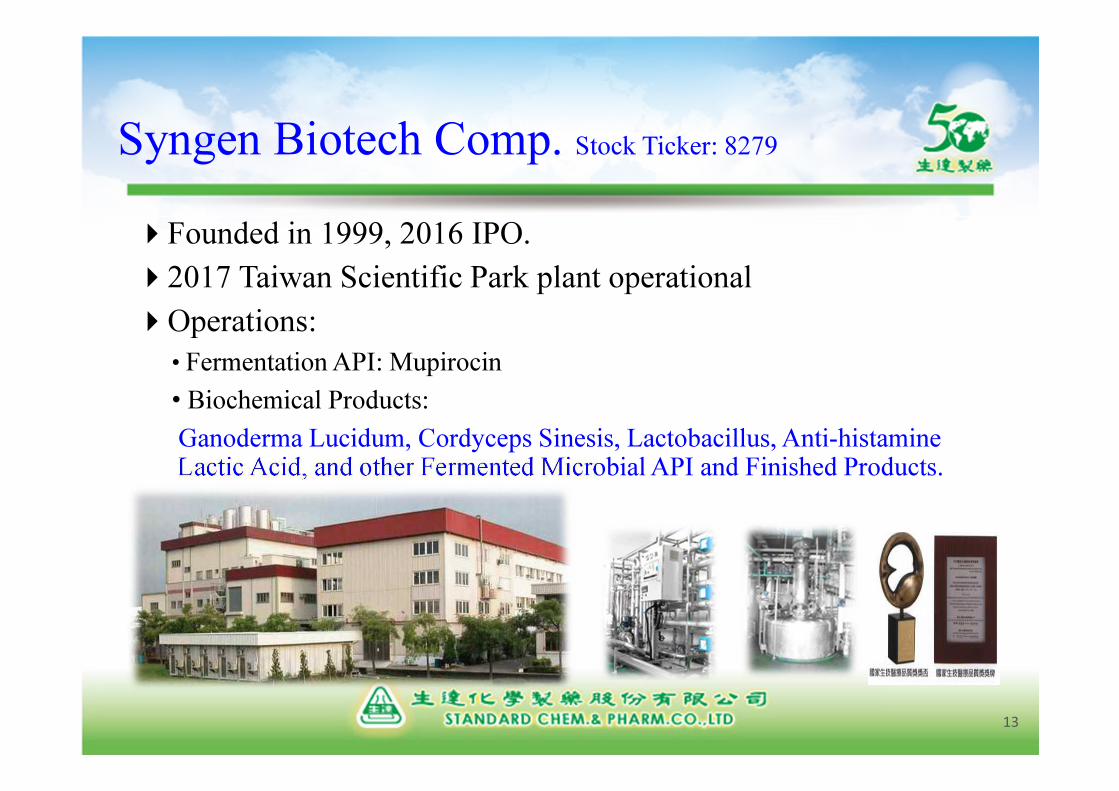
Syngen Biotech Comp. Stock Ticker: 8279
�Founded in 1999, 2016 IPO.
�2017 Taiwan Scientific Park plant operational
�Operations:
• Fermentation API: Mupirocin
• Biochemical Products:
Ganoderma Lucidum, Cordyceps Sinesis, Lactobacillus, Anti-histamine Lactic Acid, and other Fermented Microbial API and Finished Products.
13

Multipower Enterprises
�Own Brand: NeoAngelac, Stronzon, Boscogen
�Products: Infant Formula, Goat Milk, Health Supplements
�Principal Suppliers:
• France’s Leading Formula Manufacturer
• Renowned European Milk Manufacturers
�Chain-store Sales Channels
14
2016 Financial Statements
15
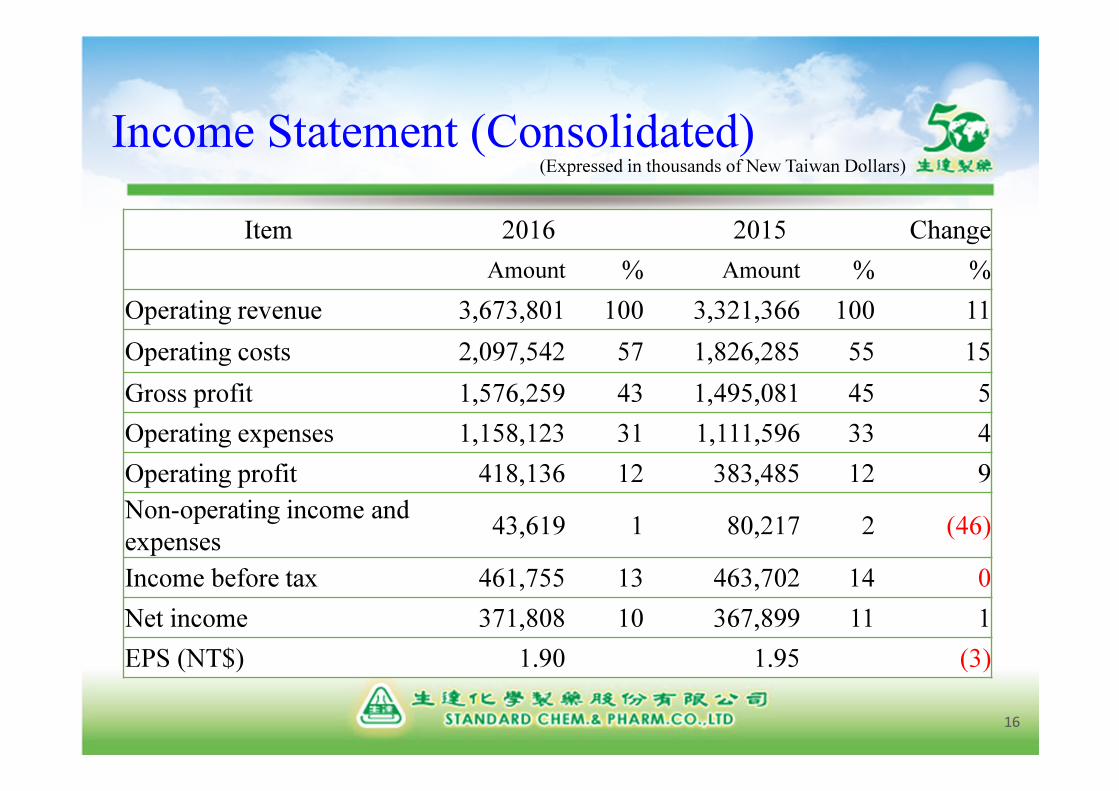
Income Statement (Consolidated)
Item 2016 2015 Change
Amount % Amount % %
Operating revenue 3,673,801 100 3,321,366 100 11
Operating costs 2,097,542 57 1,826,285 55 15
Gross profit 1,576,259 43 1,495,081 45 5
Operating expenses 1,158,123 31 1,111,596 33 4
Operating profit 418,136 12 383,485 12 9
Non-operating income and
expenses43,619 1 80,217 2 (46)
Income before tax 461,755 13 463,702 14 0
Net income 371,808 10 367,899 11 1
EPS (NT$) 1.90 1.95 (3)
(Expressed in thousands of New Taiwan Dollars)
16

Income Statement (Parent Company)
Item 2016 2015 Change
Amount % Amount % %
Operating revenue 2,357,528 100 2,205,463 100 7
Operating costs 1,308,075 56 1,199,627 54 9
Gross profit margin 1,049,453 44 1,005,836 46 4
Operating expenses 742,267 31 687,568 31 8
Operating profit 307,186 13 318,268 15 (3)
Non-operating income
and expenses88,622 4 92,145 4 (4)
Income before tax 395,808 17 410,413 19 (4)
Net income 340,216 14 347,894 16 (2)
Earnings per share (NT$) 1.90 1.95 (3)
17
(Expressed in thousands of New Taiwan dollars)

SCP Financials – 50 Years of Profit
18
Standard's Profit and EPSIncome after Tax EPS
($)
1.24
1.39
1.66
2.09 2.15
1.77 1.81
1.88
1.35
1.47
1.61
1.73
2.09
1.95
1.90
0.00
0.50
1.00
1.50
2.00
2.50
0
50,000
100,000
150,000
200,000
250,000
300,000
350,000
400,000
Net Income
EPS
(Expressed in thousands of New Taiwan Dollars)

19
SCP Financials –Historical Dividend Distributions
1.20
1.501.25 1.20
1.60
0.50
1.001.20
2.50
1.00
1.50
0.30 0.30
0.70
2.092.15
1.771.81
1.88
1.35
1.47
1.61
1.73
2.09
1.95
0.00
0.50
1.00
1.50
2.00
2.50
3.00
2005 2006 2007 2008 2009 2010 2011 2012 2013 2014 2015
Stock Dividend
Cash Dividend
EPS

Balance Sheet (Consolidated)
Item 2016/12/31 2015/12/31
Amount % Amount %
Cash and cash equivalents 876,820 14 766,379 13
Accounts Receivable 975,369 16 896,756 16
Inventories 737,725 12 649,536 11
Investments 798,771 14 638,180 11
Property, plant, and equipment 2,090,208 33 2,186,890 38
Other current and non-current assets 746,947 11 657,546 11
Total Assets 6,225,840 100 5,795,287 100
Current Liabilities 1,646,886 27 1,177,842 20
Long-term loans 47,317 1 21,111 1
Other liabilities 334,973 5 709,413 12
Total liabilities 2,029,176 33 1,908,366 33
Total shareholder’s equity 4,196,664 67 3,886,921 67
20
(Expressed in thousands of New Taiwan Dollars)

Item 2016/12/31 2015/12/31
Amount % Amount %
Cash and cash equivalents 438,306 8 302,033 6
Accounts Receivable 722,095 14 727,819 15
Inventories 448,633 9 410,466 9
Investments 2,036,377 39 1,939,083 40
Property, plant, and equipment 1,170,949 23 1,235,025 25
Other current and non-current assets 332,270 7 273,838 5
Total Assets 5,148,630 100 4,888,264 100
Current Liabilities 1,066,585 21 828,927 17
Long-term loans 30,000 1 - -
Other liabilities 332,693 6 514,714 10
Total liabilities 1,429,278 28 1,343,641 27
Total shareholder’s equity 3,719,352 72 3,544,623 73
21
Balance Sheet (Parent Company)(Expressed in thousands of New Taiwan Dollars)

22
SCP Group Global Revenue
Note: ‘Other’ includes Germany, Iran , Hong Kong, Macao, etc.
(Expressed in thousands of New Taiwan Dollars)
0
50,000
100,000
150,000
200,000
250,000
S.E.A. China S. Korea U.S.A. Japan Other
2016 2015

Global Revenue Ratio of past 5 Years(SCP Group )
23
0%
10%
20%
30%
40%
50%
60%
70%
80%
90%
100%
2012 2013 2014 2015 2016
88.4% 86.8% 86.5% 86.6% 82.5%
11.6% 13.2% 13.5% 13.4% 17.5%
Domestic
International
(Expressed in thousands of New Taiwan Dollars)
� International Sales of
past 5 years
� Ratio of International
to Domestic Sales of
past 5 years

Global Revenue Ratio of past 5 years(SCP)
24
0%
10%
20%
30%
40%
50%
60%
70%
80%
90%
100%
2012 2013 2014 2015 2016
83.8% 83.5% 83.5% 83.2%76.6%
16.2% 16.5% 16.5% 16.8%23.4%
Domestic
International
� Ratio of International
to Domestic Sales of
past 5 years
� International Sales of
past 5 years(Expressed in Thousands of New Taiwan Dollars)

Forward-looking
25
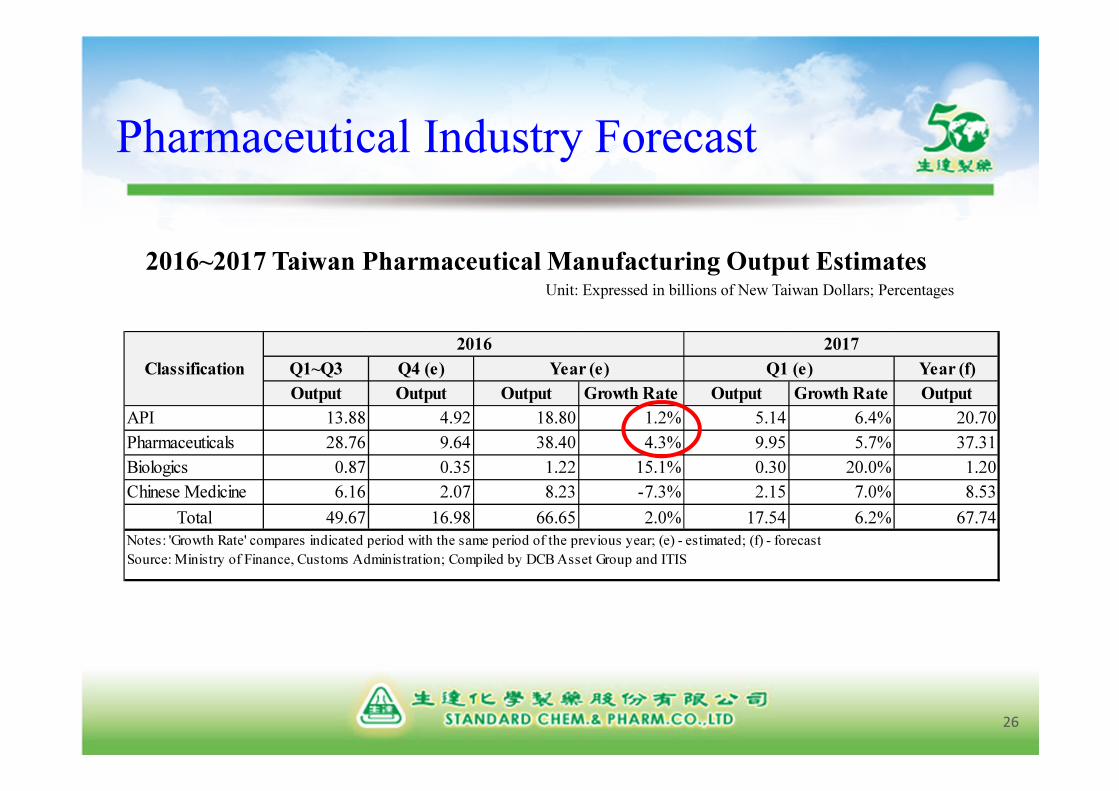
Q1~Q3 Q4 (e) Year (f)
Output Output Output Growth Rate Output Growth Rate Output
API 13.88 4.92 18.80 1.2% 5.14 6.4% 20.70
Pharmaceuticals 28.76 9.64 38.40 4.3% 9.95 5.7% 37.31
Biologics 0.87 0.35 1.22 15.1% 0.30 20.0% 1.20
Chinese Medicine 6.16 2.07 8.23 -7.3% 2.15 7.0% 8.53
Total 49.67 16.98 66.65 2.0% 17.54 6.2% 67.74
Notes: 'Growth Rate' compares indicated period with the same period of the previous year; (e) - estimated; (f) - forecast
Source: Ministry of Finance, Customs Administration; Compiled by DCB Asset Group and ITIS
Classification
2016 2017
Year (e) Q1 (e)
Pharmaceutical Industry Forecast
26
2016~2017 Taiwan Pharmaceutical Manufacturing Output EstimatesUnit: Expressed in billions of New Taiwan Dollars; Percentages

Future Milestone
From Taiwan Generics
to
International
Better than Generics
27
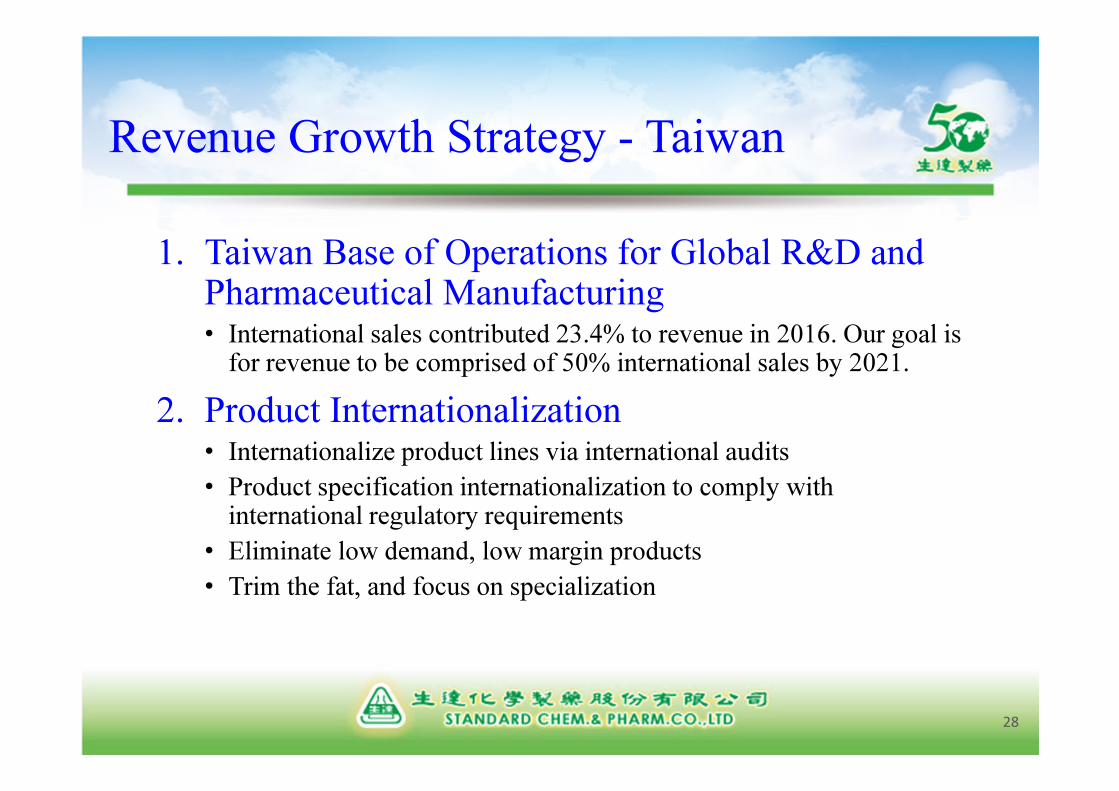
Revenue Growth Strategy - Taiwan
1. Taiwan Base of Operations for Global R&D and Pharmaceutical Manufacturing• International sales contributed 23.4% to revenue in 2016. Our goal is for revenue to be comprised of 50% international sales by 2021.
2. Product Internationalization• Internationalize product lines via international audits
• Product specification internationalization to comply with international regulatory requirements
• Eliminate low demand, low margin products
• Trim the fat, and focus on specialization
28
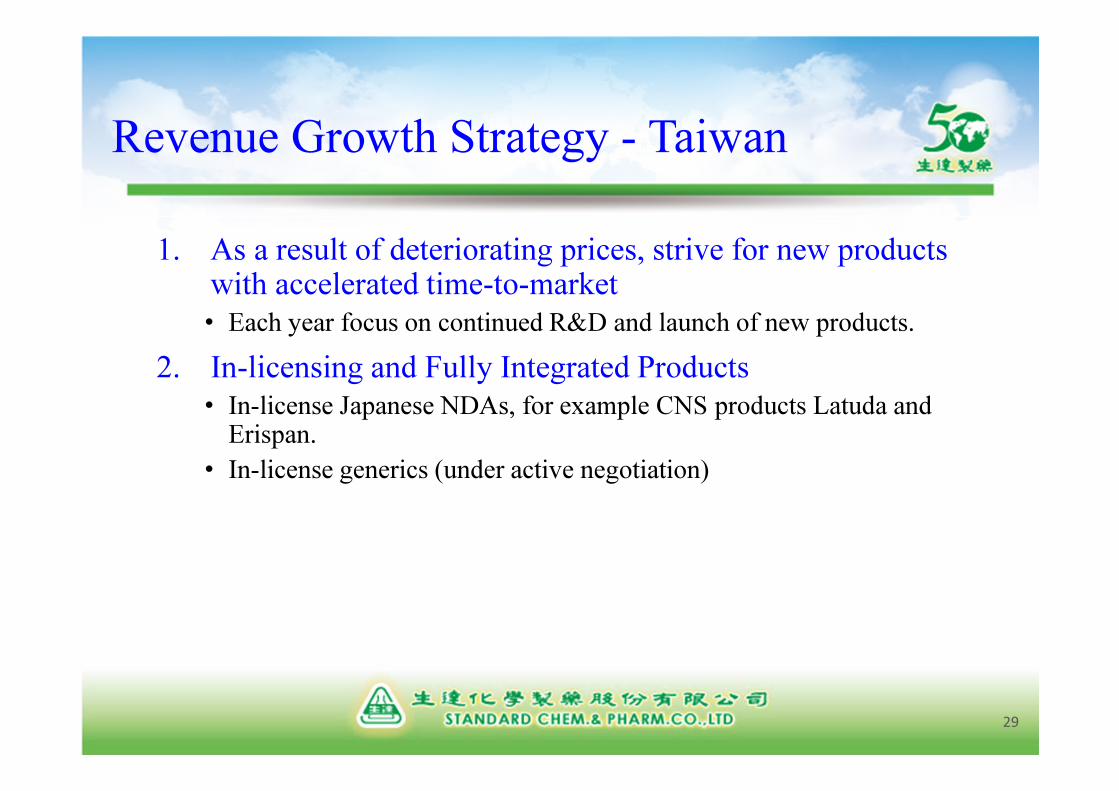
1. As a result of deteriorating prices, strive for new products with accelerated time-to-market
• Each year focus on continued R&D and launch of new products.
2. In-licensing and Fully Integrated Products
• In-license Japanese NDAs, for example CNS products Latuda and Erispan.
• In-license generics (under active negotiation)
29
Revenue Growth Strategy - Taiwan

1. Quality ‘Consistency Evaluation’ of the CFDA• By end of 2018, 289 Drug Products are expected to be compliant with new CFDA Consistency Evaluation
• 2019 will be characterized as an industry shake-up, as non-compliant products will have licenses revoked
• Requires large capital funding and internationally competitive pharmaceutical technology.
• Pharmaceutical BE studies average CN¥5MM; but having money does not equate to technological success.
2. Remain competitive through cross-market knowledge• SCP has successful experience with U.S. and Japan regulatory dossiers
• SCP to continue to specialize expertise in BE design and execution
• Client Prioritization: SMEs have opportunities over large corporations
• Collaboration Model: Tech-transfer, Co-development, BE Collaboration, Profit-sharing Partnerships
30
Revenue Growth Strategy - China
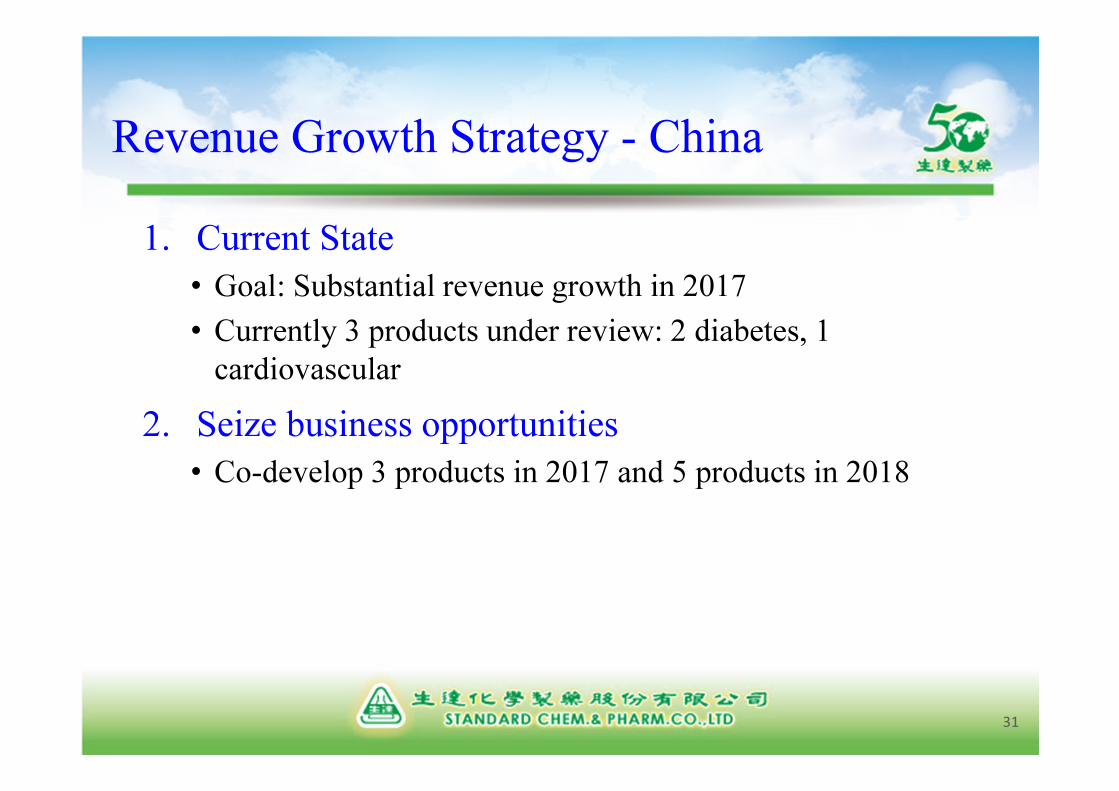
1. Current State
• Goal: Substantial revenue growth in 2017
• Currently 3 products under review: 2 diabetes, 1
cardiovascular
2. Seize business opportunities
• Co-develop 3 products in 2017 and 5 products in 2018
31
Revenue Growth Strategy - China

Revenue Growth Strategy - Japan
1. Japan Collaboration • ODM
• Japanese companies distributors
2. API Strategy • Collaboration with Syn-Tech for API Vertical Integration
32

1. Current State
• Obtained license for Montelukast (Asthma)
• Launch in 2016
2. Under Development
• Oral capsule for pain reliever: Co-development and Manufacturing
• Oral tablet for Osteoporosis: Co-development
• Orally Disintegrating Tablet (ODT) for anti-ulcer:Co-development and Manufacturing
33
Revenue Growth Strategy - Japan
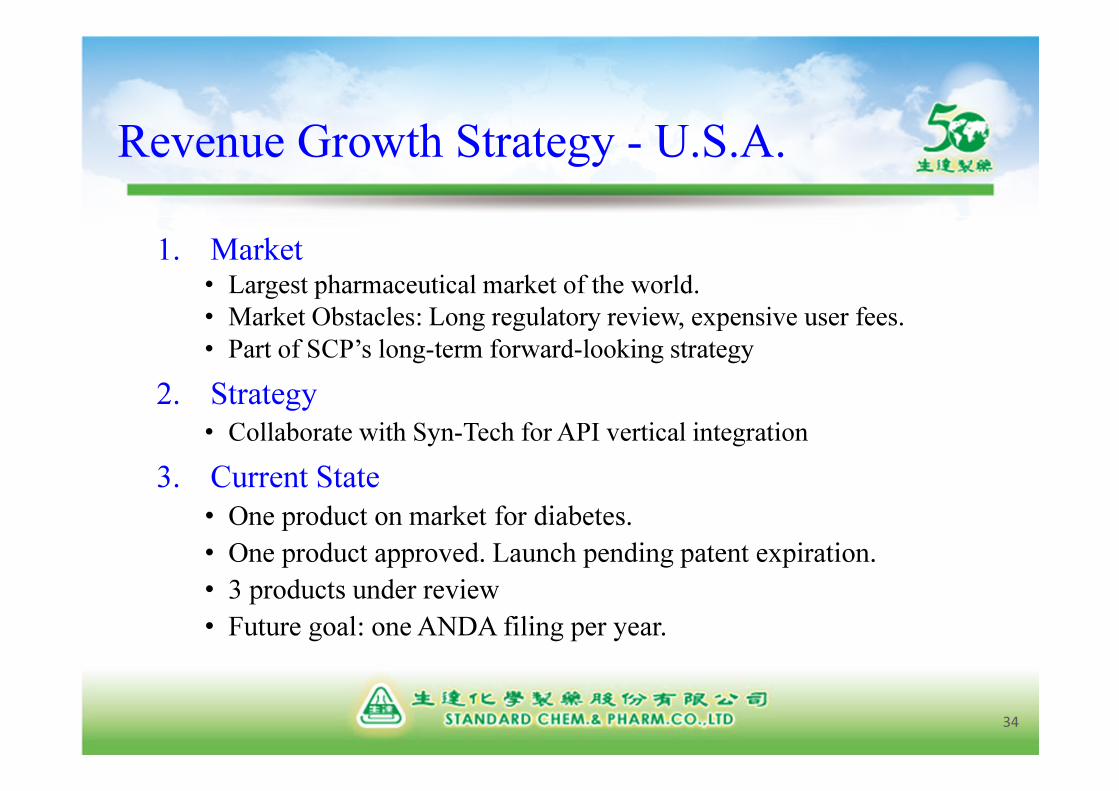
1. Market• Largest pharmaceutical market of the world.
• Market Obstacles: Long regulatory review, expensive user fees.
• Part of SCP’s long-term forward-looking strategy
2. Strategy
• Collaborate with Syn-Tech for API vertical integration
3. Current State
• One product on market for diabetes.
• One product approved. Launch pending patent expiration.
• 3 products under review
• Future goal: one ANDA filing per year.
34
Revenue Growth Strategy - U.S.A.
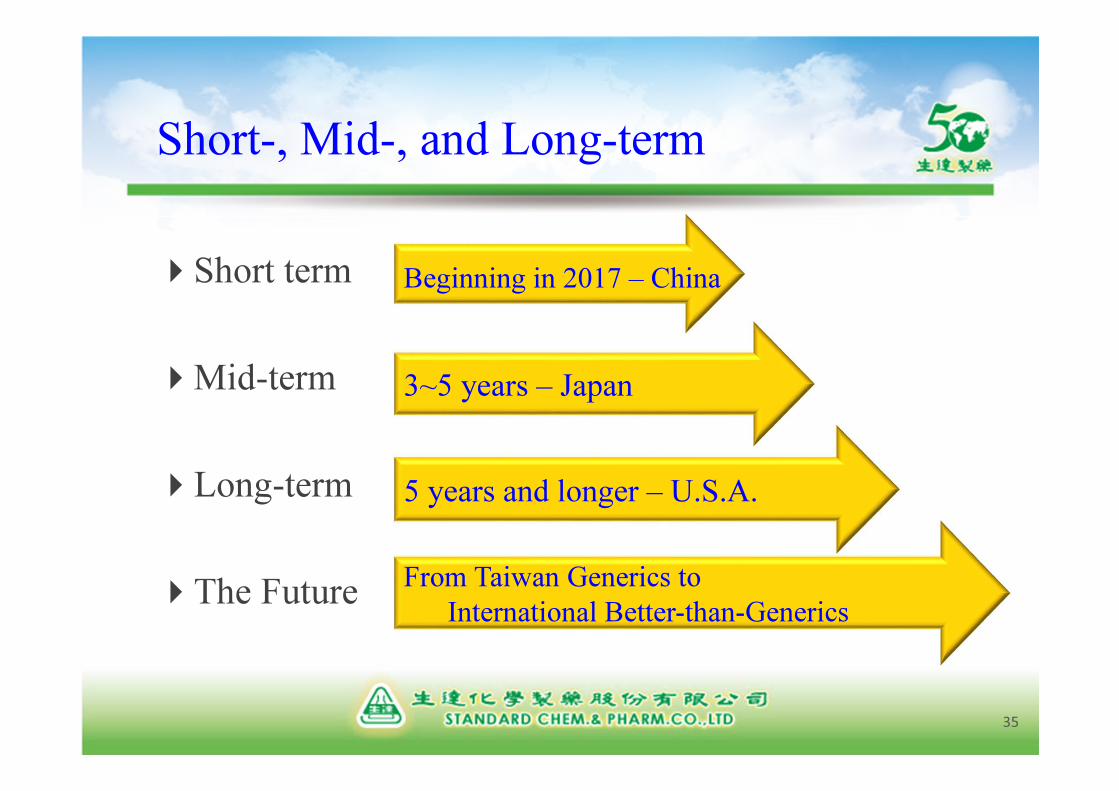
Short-, Mid-, and Long-term
35
�Short term
�Mid-term
�Long-term
�The Future
Beginning in 2017 – China
3~5 years – Japan
5 years and longer – U.S.A.
From Taiwan Generics to
International Better-than-Generics

Forward-looking Strategy Layout
�Increase International Revenue Ratio• Increase international business resources
• Recruit international talent
�Specialized technology and professional development of international performance• Develop Taiwan into a base of cutting-edge R&D technology and revenue generation.
�Leverage Competitiveness in Overseas Markets• Stable foundation
• Rapid revenue creation
• Step-by-step optimization for minimization of loss due to inefficiencies
• Focus on market knowledge and business acumen
• Establish strategic partnerships for mid- and long-tem goals
36

Corporate Social Responsibility
37

Corporate Social Responsibility
�Fan Tao-Nan Foundation
• Established in 1987
• Capital: NT$196 Million
• Annual Budget: NT$11 Million
• The Fan Tao-Nan Foundation was recognized by the Department of Education as an outstanding social foundation along with 16 other Taiwanese foundations in 2011.
�Investments in Society
• Funded or provided assistance to 5,416 students in 2016:
• [Scholarships]: University – 4 students (majoring in related fields), High School – 102 students, Middle School – 828 students at 59 schools, Elementary School – 2,650 students at 221 schools
• [Hope After-school Class] (Monday to Friday afternoons): 1,500 students at 20 schools
• [Sunflower Wednesdays]: After-school classes on Wednesdays for 330 students at 4 schools
• [Graduation Subsidies]: 6 students
• In 2016, provided meal-assistance to 6,118 students during winter and summer holidays in participation with 7-11, Family Mart, 520 Lunchbox, and Huang-Ji Beef Noodles.
38

Q & A
39
Thank you for your attention
40

![Int J Ayu Pharm Chem - IJAPCijapc.com/volume5-second-issue/V5-I2-2-p-1-14.pdf · Int J Ayu Pharm Chem 2016 Vol. 5 Issue 2 1 [e ISSN 2350-0204] Int J Ayu Pharm Chem RESEARCH ARTICLE](https://cdn.vdocument.in/doc/165x107/5eb89ccf42f72a7371042a05/int-j-ayu-pharm-chem-int-j-ayu-pharm-chem-2016-vol-5-issue-2-1-e-issn-2350-0204.jpg)


![Int J Ayu Pharm Chem - IJAPCijapc.com/volume10-first-issue/MNAPC-V10-I1-22-p-310-317.pdf · Int J Ayu Pharm Chem 2019 Vol. 10 Issue 1 310 [e ISSN 2350-0204] Int J Ayu Pharm Chem REVIEW](https://cdn.vdocument.in/doc/165x107/5ece5f0bb81e72227c2887d5/int-j-ayu-pharm-chem-int-j-ayu-pharm-chem-2019-vol-10-issue-1-310-e-issn-2350-0204.jpg)

![Int J Ayu Pharm Chemijapc.com/volume6-third-issue/MNAPC-6-3-19-p-138-149.pdf · 2019-06-03 · Int J Ayu Pharm Chem 2017 Vol. 6 Issue 3 138 [e ISSN 2350-0204] Int J Ayu Pharm Chem](https://cdn.vdocument.in/doc/165x107/5e7cb9c82adb9411d10b1e6e/int-j-ayu-pharm-2019-06-03-int-j-ayu-pharm-chem-2017-vol-6-issue-3-138-e-issn.jpg)
![Int J Ayu Pharm Chemijapc.com/volume5-third-issue/V5-I3-20-P-116-129.pdfInt J Ayu Pharm Chem 2016Vol. 5 Issue 3 116 [e ISSN 2350-0204] Int J Ayu Pharm Chem REVIEW ARTICLE](https://cdn.vdocument.in/doc/165x107/5ab8132f7f8b9a684c8c625a/int-j-ayu-pharm-j-ayu-pharm-chem-2016vol-5-issue-3-116-e-issn-2350-0204-int-j.jpg)