
Standard Ethernet as an Embedded Communication Network
Project Report
For the Degree Of Master Of Science
April 26, 1999
Candidate: Geoffrey R. Hendrey
Advisor: Philip Koopman
Department of Electrical and Computer Engineering
Carnegie Mellon University
Pittsburgh, PA 15213

Standard Ethernet as an Embedded Communication Network June 8, 1999 1
Standard Ethernet as an EmbeddedCommunication Network
Geoffrey R. Hendrey
Abstract
Standard 10 Mbit/s Ethernet is being used for embedded real-time networking despite funda-
mental problems with prioritization, schedulability, and delay bounding. Furthermore, the charac-
teristics of embedded time-driven workloads (periodicity, synchronization, and short messages)
result in significantly longer message delays than Poisson-type “general purpose” workloads. This
paper shows what kind of delay performance to expect when Ethernet is used for embedded net-
working, shows how to use controlled jitter to improve Ethernet performance, and compares Ether-
net delays to Controller Area Network (CAN) delays. We simulated several embedded workloads
incorporating time-driven traffic and varying frame sizes. For Ethernet with time-driven workloads
and 15m cable lengths, delays were roughly 35 times the delays for a Poisson workload. However, we
found that by introducing controlled jitter we could reduce average delays by about 26% and
“worst-case” delays by about 47% for embedded Ethernet. In practice, this jitter can be added from
user-level networking code without any modification to drivers or hardware. We conclude that
because Ethernet operates at a higher bit rate than slow-speed embedded protocols, and is most effi-
cient on short cable lengths, average message delays are comparable to those of CAN, and can be
made acceptable for soft real-time embedded workloads.
1.0 Introduction
Protocols such as Foundation Fieldbus, ControlNet, Interbus, and CAN have been developed specif-
ically for networking embedded real-time systems. These protocols typically run slowly (around 1 Mbit/s)

Standard Ethernet as an Embedded Communication Network June 8, 1999 2
but offer increased determinism over multiple access methods used by desktop networks [MTL, 98]. For
hard real-time applications, determinism is a must, since missed deadlines can result in catastrophic system
failure [Krishna, 97]. However, for soft real-time systems that will not fail dangerously if a message dead-
line is occasionally missed, it is possible that a familiar high-speed local area network (LAN) protocol can
provide performance comparable to a dedicated embedded protocol. This paper explores the performance
of the most popular LAN, IEEE 802.3 Ethernet, when used for embedded communication. We compare the
performance of Ethernet to CAN, a common embedded communication protocol, typically used in auto-
motive and industrial machine control [Moon, 96][Glaze, 96].
Ethernet has several properties that make it ideal for distributed embedded systems. First, Ethernet is
a completely decentralized protocol. There is no centralized polling station that can fail. There is no token
that can be lost. Ethernet, in its most basic version runs at 10 Mbit/s, an order of magnitude faster than
most embedded protocols [CAN, 91]. Communication software can be developedand testedon worksta-
tions using a familiar API such as the POSIX IV socket calls and should be portable to a Real-Time Oper-
ating System (RTOS) without modification. The code can be run and debugged on workstations that use
the same medium access control (MAC) as the target platform.
Ethernet has traditionally been used to network enterprise workstations and to transfer non-real-time
data. The success of Ethernet in the desktop world has been due to its simplicity, expandability, robustness,
and affordable implementation. Based on Ethernet’s success as a data network, embedded soft real-time
communication networks are being implemented with standard 10 Mbit/s Ethernet for economy, familiar-
ity, and compatibility with enterprise networks.
By using TCP/IP on top of Ethernet, embedded systems can become globally accessible from enter-
prise networks. This connectivity and interoperability is possible, and affordable using commodity off-the-
shelf (COTS) hardware and software, which has led to a recent surge in interest in embedded Ethernet.
Consider that embedded Ethernet controller chips sell for less than 10 dollars in quantities of 1000. 32-bit
ARM processor cores with integrated 10/100BaseT Ethernet and an RTOS license cost $32.50 in quantities

Standard Ethernet as an Embedded Communication Network June 8, 1999 3
of 10,000 [Shear, 97]. At least 8 proprietary real-time operating systems (RTOS) provide “small” TCP/IP
implementations ranging from 20 Kb to 120 Kb designed for use in embedded applications [Quintell, 97].
There are two reasons to expect that the performance of Ethernet will be different for embedded
workloads than for LAN-type workloads. First, Ethernet was designed to perform well under workloads
that behave as Poisson processes, which is a reasonable model for LAN traffic. However, embedded real-
time workloads are often time-driven, in which messages are generated by periodic sampling intervals
rather than explicit event triggers. In time-driven systems, messages are generated in synchronized periodic
bursts. These bursts are caused by the transmission of sense/process/actuate messages during system states
that must be simultaneously sampled by several control loops (e.g. piston strikes top-dead-center in a com-
bustion engine) [Backman, 97]. The time required to serialize the time-driven messages greatly increases
the average message delay. Many embedded protocols handle such message pileups efficiently; Ethernet
does not. Secondly, while the typical topology for both an Ethernet LAN subnet and an embedded Ethernet
is a star topology, cable lengths in an embedded Ethernet will likely be no more than 15m. Because colli-
sion detection occurs more rapidly as cable lengths decrease, the Ethernet MAC is actually more efficient
for embedded systems than for LANs, given the same workload. This improvement in collision detection
speed helps offset the degradation of delay performance caused by typical time-driven embedded work-
loads.
Because there are significant pros and cons to using Ethernet for embedded communication, a thor-
ough evaluation of Ethernet’s performance on embedded workloads with short cable lengths (e.g. 15m) is
needed. The performance of Ethernet for LANs has been well established both analytically and by obser-
vation for many kinds of traffic [Mazraani, 91][Gonsalves, 88][Boggs, 88][Hutchinson, 87][Shwarts, 87],
but no studies could be found that address the performance of Ethernet under time-driven workloads with
cable lengths and topologies representative of embedded systems. In order to build an embedded soft real-
time system with the requisite confidence that messages will make their deadlines, the delay performance
of Ethernet must be established for embedded workloads.

Standard Ethernet as an Embedded Communication Network June 8, 1999 4
In section 2 we elaborate further on the differences between CAN and Ethernet, and describe previ-
ous research that has been done, primarily on the LAN topology, to establish throughput and delay charac-
teristics for Ethernet.
In section 3 we show the results of MAC level simulations of Ethernet on a LAN topology to serve
as a baseline for later comparison with the embedded topology. Three models of traffic are used: a Poisson
model in which all the messages have exponentially distributed interarrival times, a time-driven model in
which all of the messages are generated with the same period and phase, and a mixed workload in which
half the messages are Poisson and half are time-driven. For each scenario we generated cumulative distri-
bution functions (CDF) of message delays and compare the average and “worst-case” delays.
In section 4 we produce CDFs of message delays using cable lengths typical of embedded systems,
not LANs. These CDFs allow the probability of missed deadlines to be evaluated and can be used as a
guideline for building embedded Ethernets. We also point out the significant reduction in delay that is
achieved by short cable lengths.
In section 5 we introduce controlled queuing jitter as a means to reduce message delays for embed-
ded Ethernet workloads. We present a method for choosing how much jitter should be introduced, and
show simulation results for time-driven workloads that indicate delays can be significantly reduced using
this technique.
In section 6 we compare the delay performance of Ethernet to CAN. We compare both the average
and worst-case delays. We show that for the average case, Ethernet delays are shorter than CAN delays,
and are only slightly longer in the “worst-case”.

Standard Ethernet as an Embedded Communication Network June 8, 1999 5
2.0 Background and previous work
2.1 Embedded Ethernet
We assume the reader is familiar with carrier-sense multiple access with collision detection used by
the IEEE 802.3 MAC [IEEE85]. Throughout this paper, “Ethernet” will refer to the 10 Mbit/s Ethernet
described by 802.3.
Numerous studies have addressed the performance of Ethernet for non-real-time applications. One
of the most thorough observational studies (which we will use in section 6 to validate our simulator) was
conducted by Gonsalves [Gonsalves, 85]. Gonsalves used a bus structured LAN consisting of 3 500m seg-
ments, and measured the performance of a 33-38 host, 10Mbit/s Ethernet. Throughput and delay statistics
were collected. However, Gonsalves’ results are not applicable to embedded Ethernets because the cable
lengths were too long, and a modern star topology was not used.
The suitability of the Ethernet LAN for voice traffic was investigated in [Gonsalves, 83]. Although
packets were generated periodically, and delay was considered as a performance metric, there was no syn-
chronization of sources as would be found in an embedded time-driven system. The performance of Ether-
net under bursty traffic was examined in [Mazraani, 91] but bursty sources were Poisson sources that had
active and inactive periods, not periodic time-driven sources that we consider essential for modeling
embedded traffic.
Hutchinson and Merabti simulated a generic real-time workload comprised of periodic and aperiodic
messages, but due to the limitations of their simulation platform, they scaled the network baud rate to 250
Kbps [Hutchinson, 87]. The scaled delay characteristics presented do not match well with Gonsalves’
observed delays in [Gonsalves, 85]. Sources described as synchronous were in fact Poisson streams, and
only 512-byte frames were considered for the synchronous sources, which means that the simulation was
more representative of multimedia-type traffic than a real-time control system that would typically

Standard Ethernet as an Embedded Communication Network June 8, 1999 6
exchange messages using the smallest frame size available - 64-bytes. Furthermore, no simulation valida-
tion results were presented.
Despite its non-deterministic delay characteristics, Ethernet has been used, and will continue to be
used for real-time systems. The literature describes Ethernet being used in closed loop systems to monitor
and control everything from servos to linear particle accelerators [Mazraani, 91] [Addison, 98][Elkins, 86]
[Daniel, 98] [Daniel, 98][Quintell, 97][Shear, 97]. The majority of these papers are qualitative “industry/
experience” papers, or present data that is very specific to a single system.
No previous studies could be found that present distributions of message delays for time-driven
Ethernet traffic, using the star topology which is common in modern hubbed Ethernets, and considering
cable lengths typical of embedded systems (e.g. 15m as opposed to 1500m). This lack of data reduces the
design of embedded real-time Ethernet to intuition and guesswork.
2.2 CAN
The following introduction is taken directly from the CAN specification [CAN,91]:
“The Controller Area Network (CAN) is a serial communications protocol which effi-
ciently supports distributed realtime control with a very high level of security. Its domain
of applications ranges from high speed networks to low cost multiplex wiring. In automo-
tive electronics, engine control units, sensors, ant-skid systems, etc. are connected using
CAN with bitrates up to 1 Mbit/s. ... Whenever the bus is free, any unit may start to trans-
mit a message. If 2 or more units start transmitting messages at the same time, the bus
access conflict is resolved by bitwise arbitration using the IDENTIFIER. The mechanism
of arbitration guarantees that neither information nor time is lost. ...During arbitration,
every transmitter compares the level of the bit transmitted with the level that is monitored
on the bus. If these levels are equal, the unit will continue to send. When a ‘recessive’

Standard Ethernet as an Embedded Communication Network June 8, 1999 7
level is sent and a ‘dominant’ level is monitored... the unit has lost arbitration and must
withdraw without sending one more bit.”
In order for bitwise arbitration to work, the time required to transmit a single bit must be long
enough that the bit “fills” the entire cable length, and all stations have a consistent read-back value. At 1
Mbit/s, the ISO11898 standard specifies that the CAN bus cannot exceed 40 m. Increasing the bit rate
beyond 1 Mbit/s would require reducing the cable length beyond practicality for many industrial or auto-
motive embedded systems. Thus, constraints on the minimum usable cable length impose a fundamental
limit on the maximum CAN bitrate.
It is claimed in [24] that CAN bitwise arbitration can guarantee latency times for messages. Such
guarantees are essential for hard real-time systems. It has been shown in [12] that if every message in a
CAN workload is periodic (give or take some maximum queuing jitter), rate monotonic (RM) scheduling
can be performed on a CAN workload. Using RM scheduling, a hard upper bound can be calculated for the
message delay (latency) associated with a particular IDENTIFIER, as claimed in [12]. RM scheduling is
an optimal static-priority scheduling algorithm which guarantees that if any scheduling algorithm can pro-
duce a feasible schedule, so can RM [20]. However, in order to use the RM algorithm for static scheduling,
all messages must be assigned a period. Interarrival times cannot deviate from this period by more than a
maximum queuing jitter. Therefore, static scheduling can be applied, but only so long as care is taken to
buffer aperiodic messages in such a way that their interarrival times are never shorter than the value
assumed for scheduling.
In summary, CAN was designed to handle time-driven messages without wasting time resolving col-
lisions, as Ethernet does. It is possible to statically and optimally schedule a CAN workload. However,
CAN implementations cannot run faster than approximately 1 Mbit/s, an order of magnitude slower than
Ethernet.

Standard Ethernet as an Embedded Communication Network June 8, 1999 8
3.0 Embedded real-time workloads
Embedded real-time workloads typically exhibit a higher degree of synchronization and periodicity
than non-real-time workloads [Addison, 98][Hutchinson, 87][Elkins, 86]. This is because real-time sys-
tems are often time-driven, inherently sampled systems. In such systems, synchronization can occur
because there are specific instances when data must be collected and transmitted. Further, ordinary dis-
crete-time control theory is based on cyclic sampling of system states at a time-invariant sampling rate.
Thus, sampled data electromechanical control systems will need to send periodic sense-process-actuate
messages between sensors, programmable logic controllers (PLC), and actuators. After a data value is
sampled, it must be delivered to the controller before it becomes stale, and is no longer usable by the con-
trol algorithm [Backman, 93][Nilsson, 98]. Likewise, the control message from the controller to the actua-
tor must be delivered before its useful lifetime expires. When a state variable must be sampled or updated
at a particular instant, the system is inherently time-driven.
In addition to time-driven traffic, Poisson messages represent another type of traffic that is found in
embedded systems [Tindell, 94]. For example, the Society of Automotive Engineers [SAE93] describes a
list of signals sent between the various subsystems of a typical automobile. Many of the messages are peri-
odic, such as brake pressure and vehicle speed readings. However, sporadic signals are also generated
when the driver turns the ignition key or when a gear shift is in progress. These messages can be modeled
as Poisson streams.
We formulate three simple workloads, based on the Poisson and time-driven messages that are
present in typical embedded control applications.
• Poisson workload. The Poisson workload is the model of traffic often assumed for LAN traffic. Mes-
sage arrivals are exponentially distributed with average interarrival time α.

Standard Ethernet as an Embedded Communication Network June 8, 1999 9
• Time-driven workload. The time-driven workload is comprised entirely of synchronized, periodic
messages with arrival period α. This workload resembles the worst case behavior of an inherently sam-
pled system in which all sense/process/actuate loops are in lock step.
• Mixed workload. The mixed workload is comprised of 50% Poisson traffic and 50% time driven traf-
fic. The same interarrival parameter α is used for both types of traffic.
Number of stations is another important consideration for embedded systems. For typical embedded
systems such as vehicles or robots, we consider 32 to be a reasonable upper bound on the number of net-
work interfaces that would be present.
4.0 Results
4.1 LAN Baseline
Before simulating Ethernet using cable lengths typical of embedded systems, we first simulated a
balanced star LAN. We provide the LAN results because significant differences exist between the LAN
and embedded throughput and delay characteristics. Comparisons between section 4.1 and 4.2 show that
simulation results obtained for the LAN topology will be quite pessimistic if used for designing embedded
Ethernet. Since our LAN simulation results are well validated (Section 6) we can infer that much of the
simulation and observational data collected on the Ethernet LAN in prior studies must be taken with a
grain of salt when applied to embedded Ethernet.
We first ran simulations to establish the performance of our three workloads in the LAN environ-
ment. We simulated a 10 Mbit/s Ethernet with frame sizes of 64 bytes, 512 bytes, and 1500 bytes. A bal-
anced star topology was considered, and no packet buffering was used. We used a one way propagation
delay of 30us which is reported in [Gonsalves, 85] for a 1500m LAN. For simulations of the Poisson and
time-driven workloads, 35 stations were used. For the mixed workload, 17 stations generated Poisson traf-
fic and 17 generated time-driven traffic.

Standard Ethernet as an Embedded Communication Network June 8, 1999 10
Throughput data for the Poisson and mixed workload is presented in section 6 as part of the simula-
tor validation. The results are sufficiently close to those in [Gonsalves, 85] that they are not presented as
new data. Fig. 1 shows the throughput curve vs. offered load for the time-driven workload, which has not
been simulated in prior studies, even on the LAN topology. For 64 byte frames the throughput tracks the
offered load until the offered load is about 1 Mbit/s. For offered loads greater than 1Mbit/s the throughput
does not exceed 2 Mbit/s because incoming frames are dropped while the network interface is busy. For
512 and 1500 byte frames, throughput tracks the offered load until the offered load is around 5 Mbit/s. The
throughput of the larger frames is closer to the ideal because larger frames are generated less frequently for
the same offered load, so contention becomes an issue at higher offered loads than for small frames.
FIGURE 1. LAN Throughput Vs. Offered Load, Time-Driven Workload
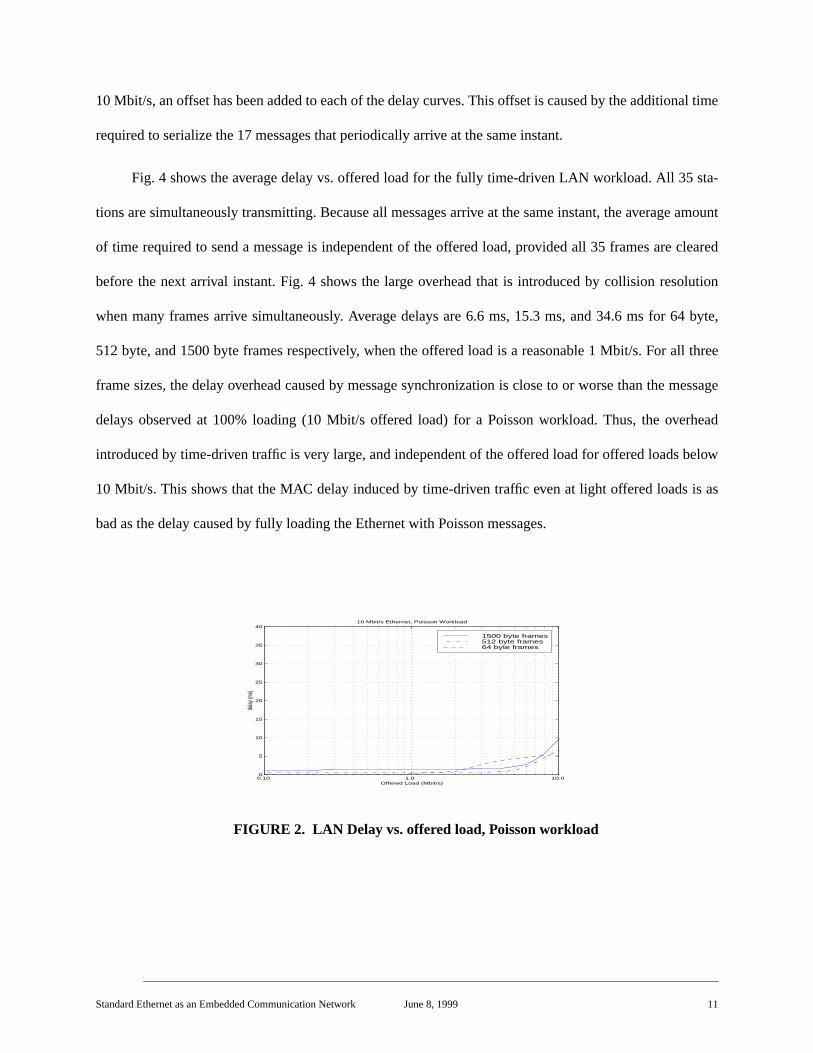
Fig. 2 shows the average message delay characteristics for the Poisson workload as a function of
offered load. Fig. 2 matches well with Gonsalves’ results in [Gonsalves, 85] and are again presented as a
baseline to which we contrast the delay performance for time-driven and mixed workloads. Below an
offered load of 1 Mbit/s, the delay is relatively constant for all three frame sizes. Above 1 Mbit/s, the num-
ber of collisions increases and frames are delayed while they wait to access the channel.
Fig. 3 shows how the average message delay varies as a function of the offered load for the mixed
workload. Here we see a noticeable change from the Poisson workload of Fig 2. For offered loads below
0.10 1.0 10.0 0
1
2
3
4
5
6
7
8
9
10
1110 Mbps Ethernet, Throughput Vs Offered Load
Offered Load (Mbit/s)
Net T
hrou
ghpu
t (M
bit/s)
ideal
1500 byte
512 byte
64 byte
ideal1500 byte frames512 byte frames64 byte frames
Standard Ethernet as an Embedded Communication Network June 8, 1999 11
10 Mbit/s, an offset has been added to each of the delay curves. This offset is caused by the additional time
required to serialize the 17 messages that periodically arrive at the same instant.
Fig. 4 shows the average delay vs. offered load for the fully time-driven LAN workload. All 35 sta-
tions are simultaneously transmitting. Because all messages arrive at the same instant, the average amount
of time required to send a message is independent of the offered load, provided all 35 frames are cleared
before the next arrival instant. Fig. 4 shows the large overhead that is introduced by collision resolution
when many frames arrive simultaneously. Average delays are 6.6 ms, 15.3 ms, and 34.6 ms for 64 byte,
512 byte, and 1500 byte frames respectively, when the offered load is a reasonable 1 Mbit/s. For all three
frame sizes, the delay overhead caused by message synchronization is close to or worse than the message
delays observed at 100% loading (10 Mbit/s offered load) for a Poisson workload. Thus, the overhead
introduced by time-driven traffic is very large, and independent of the offered load for offered loads below
10 Mbit/s. This shows that the MAC delay induced by time-driven traffic even at light offered loads is as
bad as the delay caused by fully loading the Ethernet with Poisson messages.
FIGURE 2. LAN Delay vs. offered load, Poisson workload
0.10 1.0 10.0 0
5
10
15
20
25
30
35
40
Offered Load (Mbit/s)
delay
(ms)
10 Mbit/s Ethernet, Poisson Workload
1500 byte frames512 byte frames64 byte frames

Standard Ethernet as an Embedded Communication Network June 8, 1999 12
FIGURE 3. LAN Delay vs. offered load, mixed workload
FIGURE 4. LAN Delay vs. offered load, time-driven workload
Figs. 2, 3, and 4 only provide information about the average message delays. In addition to the aver-
age message delays, we need to know how the delays are distributed in order to evaluate the probability
that a message will miss its deadline. From a soft real-time perspective, perhaps the most important infor-
mation to have before building an embedded communication system is the fraction of messages that miss
their deadlines. The cumulative distribution function of message delays allows this fraction to be deter-
mined. In order to generate CDFs, we ran our simulator in trace mode and recorded the delay experienced
by every message in the simulation. We ran the simulations at an offered load of 1 Mbit/s, 10% of the avail-
able bandwidth. We chose 10% based on figs.2-4, that show average delays are still in the “flat” region for
10% offered load (1 Mbit/s).
0.10 1.0 10.0 0
5
10
15
20
25
30
35
40
Offered Load (Mbit/s)
delay
(ms)
10 Mbit/s Ethernet, Mixed−Workload
1500 byte frames512 byte frames64 byte frames
0.10 1.0 10.0 0
5
10
15
20
25
30
35
40
Offered Load (Mbit/s)
Delay
(ms)
10 Mbit/s Ethernet LAN, Time−Driven Workload
1500 byte frames512 byte frames64 byte frames

Standard Ethernet as an Embedded Communication Network June 8, 1999 13
FIGURE 5. LAN CDF of normalized message delay
Fig. 5 shows CDFs of normalized frame delay for Poisson, time-driven, and mixed workloads. We
normalized the frame delays by dividing the delay by the length of time required to transmit all the bits in
the frame. Frame sizes shown are 64 bytes and 512 bytes. The CDFs of 1500 byte messages were not
shown in Fig. 5 in order to simplify the plot. The 1500 byte CDFs were very close to those of the 512 byte
frames, running about 0.05 above the 512 byte CDFs. The CDF for the Poisson workload shows that virtu-
ally all of the messages experienced normalized delays of less than 30 frames. Because there is no syn-
chronization in the Poisson workload, collisions are infrequent and quickly resolved by the BEB
mechanism. This behavior is the best-case behavior of an Ethernet LAN and is close to the ideal CDF. The
ideal CDF is a step function that changes from 0 to 1 after a single normalized frame delay, indicating that
no collisions took place at all and all messages were delivered in the amount of time required to send a sin-
gle frame.
Fig.5 also shows the CDFs of the mixed and time-driven workloads. Because the mixed and time-
driven workloads contain synchronized, periodic messages, the CDF shows large deviation from the ideal
CDF as collision resolution takes longer to serialize the synchronized arrivals. The mixed and time-driven
CDFs show more “rolloff” because message delays are spread over a wider range of times due to conten-
0 50 100 150 200 250 3000
0.2
0.4
0.6
0.8
1
Normalized delay (frames)
fract
ion
of p
acke
ts
CDF of normalized delay for sporadic, mixed, and time−driven workloads
time−driven
mixed
Poisson
64−byte frames512−byte frames

Standard Ethernet as an Embedded Communication Network June 8, 1999 14
tion. This shows that the introduction of time-driven traffic significantly increases the delay in a LAN envi-
ronment for all frame sizes but has the greatest effect on small frames.
Table 1 summarizes the normalized mean frame delays at 1Mbit/s offered load. For a given type of
traffic, the mean normalized delay improves as frame sizes increase, as we saw in Figs. 3, 4, and 5. This is
no surprise since for larger frame sizes fewer messages need to be sent to generate the 1 Mbit/s offered
load. Fewer frames mean fewer collisions and less waiting, on average. However, the difference between
columns in the same row is quite large. The difference is most pronounced between Poisson 64 byte frames
and time-driven 64 byte frames. For the same offered load of 1 Mbit/s, messages in the 64 byte time-driven
workload wait, on average, 48 times as long as messages in the 64 byte Poisson load.
While mean delays are certainly an important metric for soft real-time systems, the utility of the
CDF is that it allows us to evaluate the probability of arbitrary message delays. Of particular interest is the
longest delay that a frame is likely to experience. Table 2 summarizes the 99 percentile delay. The choice
of the 99 percentile is somewhat arbitrary but allows the system designer to place a probabilistic bound on
how long it will take to send a frame. Hutchinson and Merabti cite 95% as a reasonable guarantee for
Ethernet in real-time applications [Hutchinson, 87] but we consider this to be a bit too lax for applications
we have seen. Since we are assuming the system issoftreal-time, we consider 99% to be sufficient. Table 2
shows us the normalized 99 percentile frame delay for all three workloads across frame sizes. Again, the
differences between the time-driven and sporadic workloads is notable. 64 byte time-driven frames have a
normalized 99 percentile delay more than 21 times that of 64 byte frames in the Poisson workload
.
TABLE 1. Normalized mean frame delays (number of frames)
Poisson MixedTime-Driven
64 byte 2.7329 43.4435 129.4792
512 bye 1.0823 10.4476 37.3981
1500 byte 1.0600 8.0530 28.8220

Standard Ethernet as an Embedded Communication Network June 8, 1999 15
The baseline LAN simulation serves as a point of departure, to which we will compare our results as
we simulate Poisson, time-driven, and mixed workloads using cable lengths typical of embedded systems.
4.2 Embedded-sized networks
In this section we simulate our three workloads using cable lengths typical of an embedded system.
We assume a 15m cable length and a conservative propagation velocity of 1/2 the speed of light. This
results in a propagation delay of 100ns.
Fig. 6 shows throughput vs. offered load for the embedded-sized network with the time-driven work-
load. Of particular interest is the throughput for 64 byte frames, which tracks the ideal curve much more
closely than it does in Fig. 2, and reaches a throughput of over 5 Mbit/s at an offered load of 10 Mbit/s. For
short cable lengths, the efficiency of Ethernet improves considerably. This means that the embedded topol-
ogy is more bandwidth efficient than the LAN topology for small frames that are characteristic of embed-
ded workloads. Since an embedded real-time network should never offer more load than the available
bandwidth, we consider the region of interest to be offered loads below 100% (10Mbit/s). For embedded
real-time systems, reasonable offered loads should be kept well below 100%. The throughput is very close
to ideal for all frame sizes when the offered load is below 10% (1Mbit/s). Because we do not use packet
buffering, this implies that few frames are being dropped at an offered load of 1Mbit/s. Therefore, as a
rule-of-thumb for embedded Ethernet, the offered load should be kept below approximately 10%.
TABLE 2. Normalized 99 percentile frame delays (number of frames)
Poisson MixedTime-Driven
64 byte 29.88 273.43 635.01
512 bye 3.00 58.50 139.50
1500 byte 1.50 46.50 82.50

Standard Ethernet as an Embedded Communication Network June 8, 1999 16
FIGURE 6. 15m throughput Vs. Offered load, Time-driven Workload
Figs. 7, 8,and 9 show the delay characteristics for the embedded Ethernet for Poisson, mixed, and
time-driven workloads. For all three workloads, the delays for all frame sizes are lower for the embedded
topology than the LAN topology owing to the decreased collision detection and propagation time. For the
fully time-driven workload of Fig. 9, delays are about 5 ms less for the embedded topology than for the
LAN. For all three workloads, the delay is still fairly constant until the offered load exceeds 1Mbit/s. This
bolsters our conclusion that 1 Mbit/s is a reasonable offered load for the embedded topology as well as for
the LAN.
FIGURE 7. 15m Delay vs. Offered Load, Poisson workload
0.10 1.0 10.0 0
1
2
3
4
5
6
7
8
9
10
1110 Mbps Ethernet, Throughput Vs Offered Load
Offered Load (Mbit/s)
Net T
hrou
ghpu
t (M
bit/s)
ideal
1500 byte
512 byte
64 byte
ideal1500 byte frames512 byte frames64 byte frames
0.10 1.0 10.0 0
5
10
15
20
25
30
35
40
Offered Load (Mbit/s)
delay
(ms)
10 Mbit/s Ethernet, Poisson Workload
1500 byte frames512 byte frames64 byte frames

Standard Ethernet as an Embedded Communication Network June 8, 1999 17
FIGURE 8. 15m Delay vs. offered Load, mixed workload
FIGURE 9. 15m Delay Vs. Offered Load, time-driven workload
Fig. 10 shows the CDFs generated for an Ethernet with a 100ns propagation delay and 64, 512 and
1500 byte frames, respectively. The offered load was 1 Mbit/s. The CDFs of the embedded topology are
quite different than the CDFs obtained for the LAN topology. The most improvement over the LAN CDFs
is seen for 64 byte frames, which is good news for embedded systems because most messages in a time-
driven workload are likely to be small control messages. For each workload there is not as much variation
between the delay CDFs for small and large frames as there was for the LAN topology, and all of the CDFs
have tightened up considerably. This is significant for an embedded system because it means the determin-
0.10 1.0 10.0 0
5
10
15
20
25
30
35
40
Offered Load (Mbit/s)
delay
(ms)
10 Mbit/s Ethernet, Mixed Workload
1500 byte frames512 byte frames64 byte frames
0.10 1.0 10.0 0
5
10
15
20
25
30
35
40
Offered Load (Mbit/s)
delay
(ms)
10 Mbit/s Ethernet, Time−Driven Workload
1500 byte frames512 byte frames64 byte frames

Standard Ethernet as an Embedded Communication Network June 8, 1999 18
ism of the network has increased compared to the LAN topology. Average delays are shorter, and the tail of
the CDF reaches 0.99 at smaller frame delays than for the LAN case.
FIGURE 10. 15m CDF of normalized message delay
Tables 3 and 4 summarize the properties of the CDFs shown in Fig. 10. Comparing the normalized
mean frame delays in Table 3 to those in table to Table 1, we note that for 64 byte frames, the average delay
has fallen from 129.47 frames to 35.8 frames. The normalized 99 percentile delay for the 64 byte time
driven workload has fallen from 635.01 to 135 frames. Converting the normalized delays back to seconds
for 64 byte frames, we find that the average delay in the time driven workload is 1.8ms and the 99 percen-
tile delay is 6.9 ms.
TABLE 3. Normalized mean frame delays (number of frames)
Poisson MixedTime-Driven
64 byte 1.0624 10.3565 35.855
512 bye 1.0578 7.4851 27.0592
1500 byte 1.0547 6.7605 24.9357
0 50 100 1500
0.2
0.4
0.6
0.8
1
time−driven
mixed
Poisson
CDFs of normalized delay
Normalized delay (frames)
Frac
tion
of fr
ames
1500 byte frames512 byte frames64 byte frames

Standard Ethernet as an Embedded Communication Network June 8, 1999 19
\
4.3 Improving Ethernet delays for mixed and time-driven workloads
Fig. 11 shows a timeline from the perspective of a representative time-driven message which we
refer to as mi. The timeline depicts the simultaneous arrival of mi and several other time-driven messages.
FIGURE 11. Timeline of a time-driven message, mi
Before mi is able to seize the channel, it experiences several collisions and subsequent backoffs. Col-
lisions are guaranteed for time-driven messages because simultaneous arrivals result in simultaneous
attempts to transmit as soon as the channel becomes idle. Statistically, half the time-driven messages will
immediately try to retransmit after the collision and half will backoff for 51.2us, due to the binary expo-
TABLE 4. Normalized 99% frame delays (number of frames)
Poisson MixedTime-Driven
64 byte 1.50 61.50 135.00
512 bye 1.50 43.5 96
1500 byte 1.50 36 76.5
T2 T3T1 (Time)
• T1: mi is generated and attempts to trans-mit along with several other time-drivenmessages.
• T2: mi seizes the channel after a conten-tion interval T2-T1.
• T3: mi completes transmission with delayT3-T1.

Standard Ethernet as an Embedded Communication Network June 8, 1999 20
nential backoff (BEB) specified in IEEE 802.3. Collisions will occur again for the group of messages that
retried immediately and for the group that backed off. The cycle of collisions and backoffs repeats for mi
until mi seizes the channel. If mi is lucky, it can seize the channel after just a few collisions. If mi is unlucky
it will have to wait until its backoff counter and the backoff counters of the remaining messages have
become so large that the chance of collision is very small. Unfortunately, as the backoff counters become
large for the unlucky contenders and the backoff intervals increase exponentially, the channel is actually
idle much of the time. During this idle time any of the backed off messages could transmit successfully if
they were not locked into their large backoffs. The more messages present in the first collision, the longer
it takes to serialize the messages by the BEB procedure. However, we can help the BEB mechanism by
spacing the messages out so that a large number of simultaneous arrivals does not occur and the backoff
counters are kept low. It is somewhat counterintuitive, but by delaying the transmission of mi we can actu-
ally successfully transmit mi sooner by avoiding the inefficiency of the BEB for large backoff counters.
It is possible to improve Ethernet’s performance for time-driven and mixed workloads by introduc-
ing a controlled amount of random queuing jitter that breaks the lock-step collision resolution cycle. The
effect of this jitter is to prevent collisions from happening by spacing out the messages and reducing syn-
chronization. Fig. 12 illustrates the scheme. Message mi is generated along with other time-driven mes-
sages at time T1. Instead of immediately attempting transmission, mi and the other time-driven messages
are delayed by a jitter that is uniformly distributed between 0 and MAXJIT. If MAXJIT is judiciously cho-
sen, the total delay experienced by mi and the other time-driven messages can be reduced.

Standard Ethernet as an Embedded Communication Network June 8, 1999 21
FIGURE 12. Timeline for mi with controlled jitter
The value of MAXJIT greatly effects the CDF of message delays and can increase the average and
“worst-case” delay if chosen poorly. For example, if MAXJIT is chosen too large, the added delay will
swamp any improvement gained by reducing the number of collisions. On the other hand, if MAXJIT is
chosen too small it will not space out the messages enough to reduce collisions.
We have developed a simple heuristic for picking a value of MAXJIT. Consider that the CDF of a
uniformly distributed random variable U[0,MAXJIT] is a straight line from (0,0) to (MAXJIT,1). If
MAXJIT is significantly larger than the mean delay, the number of collisions will be negligible and the
delay experienced by a given message will be U[0,MAXJIT+TRANS], where TRANS is the time required
to transmit all the bits of the message. As a first guess at MAXJIT, choose a value greater than the average
normalized frame delay of the original CDF.
T3 T4T1 (Time)T2
• T1: mi is generated but waitsU[0,MAXJIT], as do all time-driven mes-sages generated at T1.
• T2: mi attempts to transmit.
• T3: mi seizes the channel.
• T4: mi completes transmission with totaldelay T4-T1.
Standard Ethernet as an Embedded Communication Network June 8, 1999 22
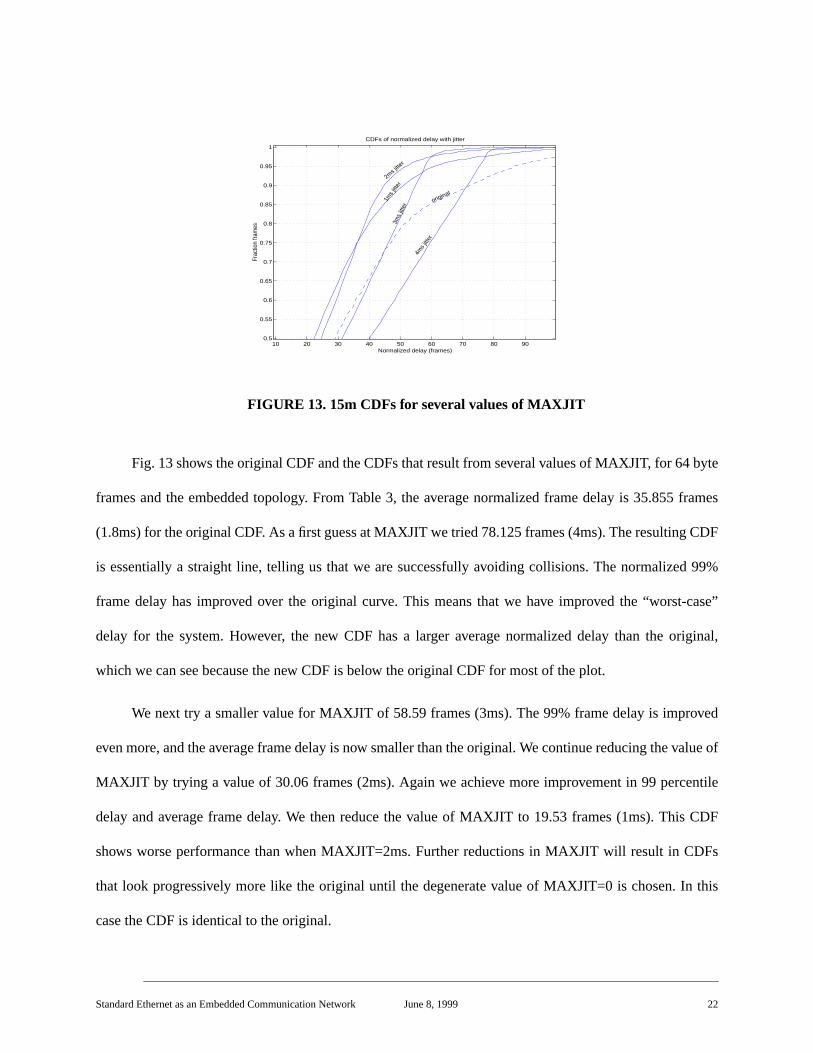
FIGURE 13. 15m CDFs for several values of MAXJIT
Fig. 13 shows the original CDF and the CDFs that result from several values of MAXJIT, for 64 byte
frames and the embedded topology. From Table 3, the average normalized frame delay is 35.855 frames
(1.8ms) for the original CDF. As a first guess at MAXJIT we tried 78.125 frames (4ms). The resulting CDF
is essentially a straight line, telling us that we are successfully avoiding collisions. The normalized 99%
frame delay has improved over the original curve. This means that we have improved the “worst-case”
delay for the system. However, the new CDF has a larger average normalized delay than the original,
which we can see because the new CDF is below the original CDF for most of the plot.
We next try a smaller value for MAXJIT of 58.59 frames (3ms). The 99% frame delay is improved
even more, and the average frame delay is now smaller than the original. We continue reducing the value of
MAXJIT by trying a value of 30.06 frames (2ms). Again we achieve more improvement in 99 percentile
delay and average frame delay. We then reduce the value of MAXJIT to 19.53 frames (1ms). This CDF
shows worse performance than when MAXJIT=2ms. Further reductions in MAXJIT will result in CDFs
that look progressively more like the original until the degenerate value of MAXJIT=0 is chosen. In this
case the CDF is identical to the original.
10 20 30 40 50 60 70 80 900.5
0.55
0.6
0.65
0.7
0.75
0.8
0.85
0.9
0.95
1
original
4ms
jitter
1ms
jitter
2ms jitte
r
3ms
jitte
r
Normalized delay (frames)
Frac
tion
fram
es
CDFs of normalized delay with jitter

Standard Ethernet as an Embedded Communication Network June 8, 1999 23
To summarize the procedure for selecting a value of MAXJIT:
1. Start with a value of MAXJIT significantly larger than the average delay - we found that using
twice the original average delay was sufficient to produce a CDF that looked like a straight line
and was thus relatively collision free.
2. Reduce the value of MAXJIT until the average and 99% normalized delay stops improving.
Fig 14. shows the improvement that is possible by inserting a controlled jitter before attempting to
send periodic messages. For the time-driven workload, using the above procedure, we selected a controlled
jitter that was distributed U[0,2ms]. For the mixed workload we selected a controlled jitter distributed
U[0,1ms]. The improved curves have less rolloff than the originals and reach 0.99 at smaller frame delays
than the original. No attempt was made to improve the Poisson CDF since the arrival stream contains no
periodic messages that would benefit from controlled jitter. Because few collisions occur in the sporadic
case, any jitter introduced would simply increase the delay experienced by each message.
FIGURE 14. CDFs of 64 byte frames with and without jitter
Table 5 shows the improvements in the mean delay and 99 percentile delay that results from the
introduction of jitter, for 64 byte frames. For both the mixed and the time-driven workload, the mean is
0 10 20 30 40 50 60 70
0.1
0.2
0.3
0.4
0.5
0.6
0.7
0.8
0.9
1
Normalized delay (frames)
fracti
on o
f fra
mes
CDF of normalized delay, 64 byte frames, Tpd = 100ns
time−driven
mixed
improved CDForiginal CDF

Standard Ethernet as an Embedded Communication Network June 8, 1999 24
improved significantly. Even more improvement is seen in the 99 percentile delay. Further refinement of
MAXJIT will result in slight improvements beyond what we have accomplished.
Because one of the primary reasons for using Ethernet in embedded systems is the availability and
familiarity of commodity off-the-shelf PLCs, OSs, and Ethernet network interface cards, any scheme to
improve Ethernet’s performance for embedded systems would ideally not require any modifications to net-
work drivers or hardware. Controlled queuing jitter can be implemented by simply delaying at the user-
level the software call that is ordinarily used to queue messages for transmission. Furthermore, the soft-
ware at the user-level is aware of which messages are time-driven, and can therefore selectively insert
delays for only the time-driven component of the workload. This scheme is preferable to TDM-like move-
able slots proposed in [Hutchinson, 87] because it does not require any modifications to the Ethernet MAC,
either in software or hardware.
5.0 Comparison of Ethernet to CAN
In this section we compare the delay performance of standard 10base-T Ethernet to Controller Area
Network (CAN). The two networks operate at different bit rates but we believe a performance comparison
for embedded systems is fair, considering that CAN was specifically designed for embedded workloads.
CAN’s nondestructive bitwise arbitration means that simultaneous transmission attempts are serialized
without wasting bandwidth. The designers of CAN anticipated that time-driven messages would be com-
mon and designed a protocol that was collision free. For hard real-time systems CAN is clearly the better
protocol since an upper bound can theoretically be placed on message delays by static RM scheduling.
TABLE 5. delay reduction for 64 byte frames
MixedTime-Driven
meandelay
24.43% 26.47%
99%delay
34.15% 46.67%

Standard Ethernet as an Embedded Communication Network June 8, 1999 25
However, we will show that Ethernet has better average message delays, and that 99% of Ethernet mes-
sages are delivered with a delay comparable to that of CAN.
Despite its slow bit rate, CAN’s bus arbitration allows for efficient handling of simultaneous arrivals.
In Fig.15 we have plotted the blocking probability against offered load for our three workloads.We define
blocking probability as the probability that a message arrives at the node’s outgoing message queue when
the queue is full. Such messages are “blocked” from entering the queue and are discarded. For CAN mes-
sages, a single outgoing slot exists for each CAN IDENTIFIER. Therefore, if the previous message with a
given IDENTIFIER has not been cleared from the node’s outgoing slot, the incoming message is blocked.
One byte of data was sent in each CAN message, making the total message length just over 8 bytes. The
blocking probability of the time-driven workload is pegged at 0 and only rises when the offered load
exceeds 1Mbit/s, the network capacity. This shows us just how efficient CAN is at serializing time-driven
messages. No messages are blocked when the arrivals are fully deterministic. However, for Poisson and
mixed workloads, the blocking probability reaches 6% and 8% respectively, when the network is fully
loaded at 1 Mbit/s. For Poisson-type messages, an exponential distribution of interarrival times means that
it is possible for messages to be generated with an arbitrarily small interarrival time. If a message arrives
before the previous one has been cleared from the network interface, the message will be blocked. This
accounts for the 6% blocking probability of the Poisson workload. For the mixed workload, fewer poisson
messages are present, but these messages are likely to be delayed longer due to the serialization of the peri-
odic messages that make up the other half of the workload. Thus, the Poisson messages are even more
likely to be blocked than when no periodic messages are present. So, while CAN handles time-driven traf-
fic well, it will still drop a small fraction of messages when Poisson sources are present.

Standard Ethernet as an Embedded Communication Network June 8, 1999 26
FIGURE 15. Blocking probability Vs. offered load for CAN
Fig. 16 shows the average delay vs. offered load for CAN. For the time-driven workload message
delays are fully deterministic and do not depend on the offered load. An analogy can be made between
periodically filling a queue with messages, and then transmitting the messages one by one until the queue
empties. The interval between queue fillings determines the offered load. As long as the total offered load
does not exceed 1 Mbit/s, it will take the same amount of time to clear the queue regardless of the interval
between queue fillings. For the mixed and Poisson workloads the delay increases as the offered load
approaches 1 Mbit/s, the network capacity. The increase in delay is in fact responsible for the increased
blocking probability seen in Fig. 15. As messages linger in the network interface, the chance that incoming
messages are blocked increases.
FIGURE 16. Average delay Vs. offered load for CAN
0.01 0.10 1.00 0
0.05
0.1
0.15
0.2
0.25
0.3
0.351 Mbit/s CAN, Blocking Probability Vs Offered Load, 8−byte Frames
Offered Load, Mbps
block
ing p
roba
bility
Poissonmixedtime−driven
0.01 0.10 1.00 0
0.5
1
1.5
2
2.5
3
Offered Load (Mbit/s)
dela
y (m
s)
1 Mbit/s CAN, Delay Vs Offered Load, 8−byte Frames
Poissonmixedtime−driven
Standard Ethernet as an Embedded Communication Network June 8, 1999 27
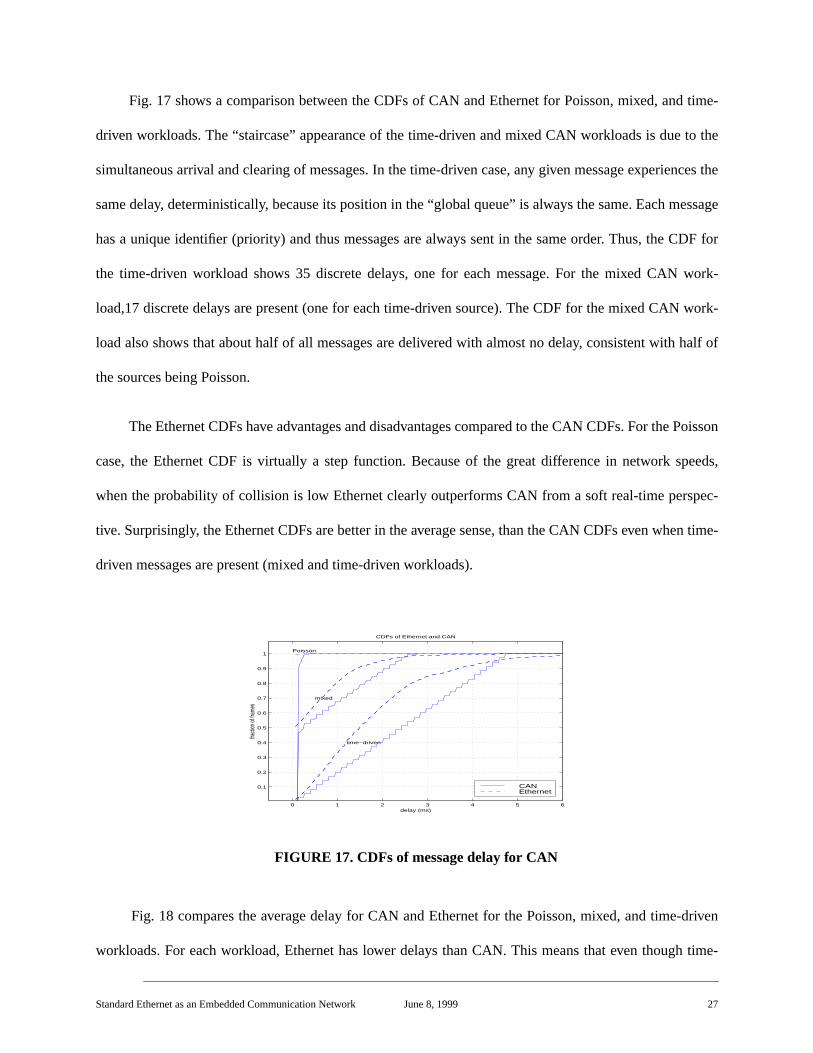
Fig. 17 shows a comparison between the CDFs of CAN and Ethernet for Poisson, mixed, and time-
driven workloads. The “staircase” appearance of the time-driven and mixed CAN workloads is due to the
simultaneous arrival and clearing of messages. In the time-driven case, any given message experiences the
same delay, deterministically, because its position in the “global queue” is always the same. Each message
has a unique identifier (priority) and thus messages are always sent in the same order. Thus, the CDF for
the time-driven workload shows 35 discrete delays, one for each message. For the mixed CAN work-
load,17 discrete delays are present (one for each time-driven source). The CDF for the mixed CAN work-
load also shows that about half of all messages are delivered with almost no delay, consistent with half of
the sources being Poisson.
The Ethernet CDFs have advantages and disadvantages compared to the CAN CDFs. For the Poisson
case, the Ethernet CDF is virtually a step function. Because of the great difference in network speeds,
when the probability of collision is low Ethernet clearly outperforms CAN from a soft real-time perspec-
tive. Surprisingly, the Ethernet CDFs are better in the average sense, than the CAN CDFs even when time-
driven messages are present (mixed and time-driven workloads).
FIGURE 17. CDFs of message delay for CAN
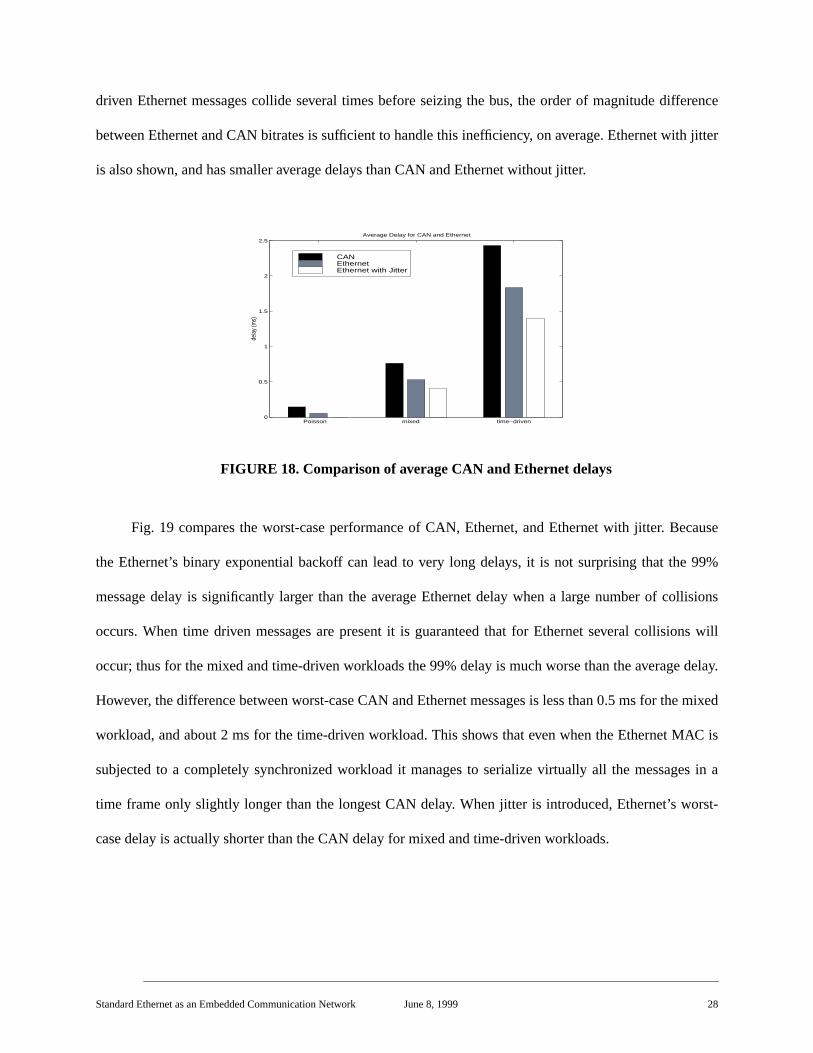
Fig. 18 compares the average delay for CAN and Ethernet for the Poisson, mixed, and time-driven
workloads. For each workload, Ethernet has lower delays than CAN. This means that even though time-
0 1 2 3 4 5 6
0.1
0.2
0.3
0.4
0.5
0.6
0.7
0.8
0.9
1
CDFs of Ethernet and CAN
fracti
on of
fram
es
delay (ms)
time−driven
mixed
Poisson
CANEthernet
Standard Ethernet as an Embedded Communication Network June 8, 1999 28
driven Ethernet messages collide several times before seizing the bus, the order of magnitude difference
between Ethernet and CAN bitrates is sufficient to handle this inefficiency, on average. Ethernet with jitter
is also shown, and has smaller average delays than CAN and Ethernet without jitter.
FIGURE 18. Comparison of average CAN and Ethernet delays
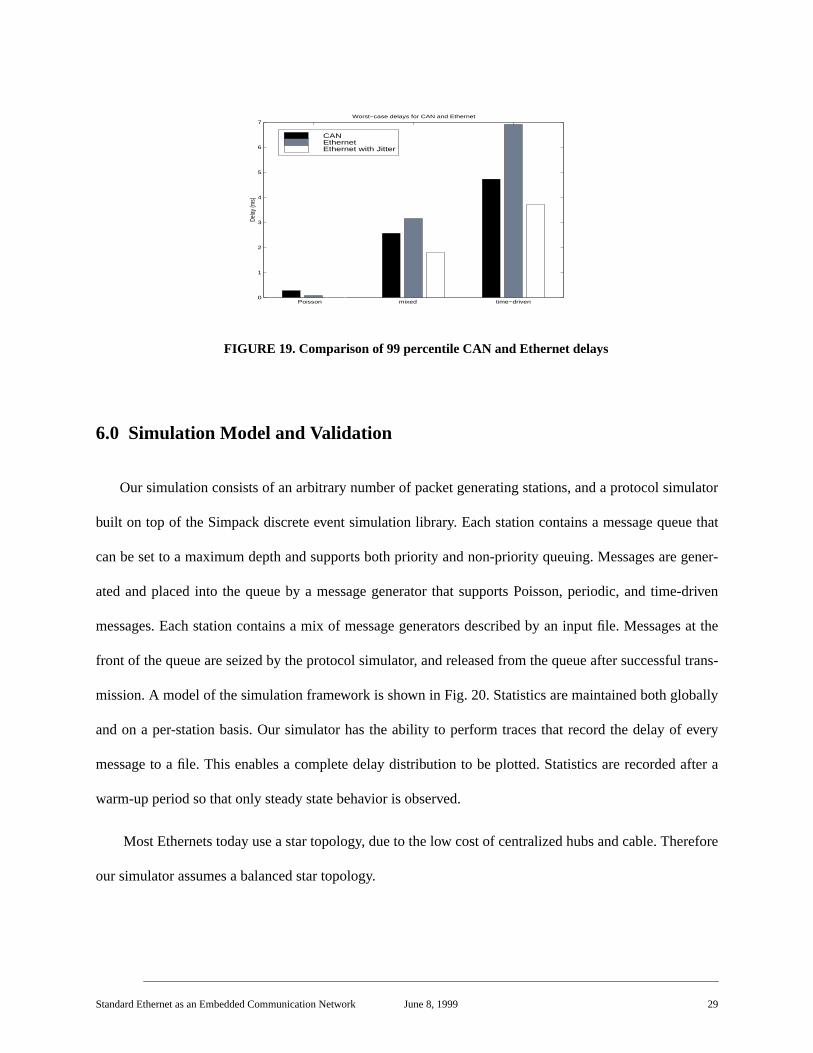
Fig. 19 compares the worst-case performance of CAN, Ethernet, and Ethernet with jitter. Because
the Ethernet’s binary exponential backoff can lead to very long delays, it is not surprising that the 99%
message delay is significantly larger than the average Ethernet delay when a large number of collisions
occurs. When time driven messages are present it is guaranteed that for Ethernet several collisions will
occur; thus for the mixed and time-driven workloads the 99% delay is much worse than the average delay.
However, the difference between worst-case CAN and Ethernet messages is less than 0.5 ms for the mixed
workload, and about 2 ms for the time-driven workload. This shows that even when the Ethernet MAC is
subjected to a completely synchronized workload it manages to serialize virtually all the messages in a
time frame only slightly longer than the longest CAN delay. When jitter is introduced, Ethernet’s worst-
case delay is actually shorter than the CAN delay for mixed and time-driven workloads.
Poisson mixed time−driven0
0.5
1
1.5
2
2.5
dela
y (m
s)
Average Delay for CAN and Ethernet
CANEthernetEthernet with Jitter
Standard Ethernet as an Embedded Communication Network June 8, 1999 29
FIGURE 19. Comparison of 99 percentile CAN and Ethernet delays
6.0 Simulation Model and Validation
Our simulation consists of an arbitrary number of packet generating stations, and a protocol simulator
built on top of the Simpack discrete event simulation library. Each station contains a message queue that
can be set to a maximum depth and supports both priority and non-priority queuing. Messages are gener-
ated and placed into the queue by a message generator that supports Poisson, periodic, and time-driven
messages. Each station contains a mix of message generators described by an input file. Messages at the
front of the queue are seized by the protocol simulator, and released from the queue after successful trans-
mission. A model of the simulation framework is shown in Fig. 20. Statistics are maintained both globally
and on a per-station basis. Our simulator has the ability to perform traces that record the delay of every
message to a file. This enables a complete delay distribution to be plotted. Statistics are recorded after a
warm-up period so that only steady state behavior is observed.
Most Ethernets today use a star topology, due to the low cost of centralized hubs and cable. Therefore
our simulator assumes a balanced star topology.
Poisson mixed time−driven0
1
2
3
4
5
6
7Worst−case delays for CAN and Ethernet
Delay
(ms)
CANEthernetEthernet with Jitter

Standard Ethernet as an Embedded Communication Network June 8, 1999 30
FIGURE 20. Simulation framework
There are three methods used by prior simulation studies to validate simulation results. These meth-
ods are trace analysis, comparison to observational studies, and comparison with existing simulators
[Mazraani, 91] [Gonsalves, 88] [Hughes, 82]. All three methods were used to validate the performance of
our Ethernet simulator. For simple scenarios, trace files were analyzed in order to verify that the simulation
algorithms were working properly, and to track down bugs. The trace files consisted of a sequential list of
time stamped simulation events from which a time line was produced that verified that all observable
aspects of the simulation were working properly.
Simulation results were compared to the results reported by Gonsalves and Tobagi in their simula-
tion of a balanced star Ethernet. Our simulation matches closely with the results obtained by Tobagi [Gon-
salves, 88] for comparable operating conditions.
Protocol Simulator
station
Message Generators
Simpack Discrete Event Simulator
Message Generators
station

Standard Ethernet as an Embedded Communication Network June 8, 1999 31
FIGURE 21. Throughput Vs. Offered load, Poisson Workload
We also validated our simulator by running our LAN baseline, using a setup very much like that used
by Gonsalves in his oft-cited observational study [Gonsalves, 85]. Our throughput curves are shown in Fig.
21 for a LAN with Poisson sources. Gonsalves’ curves reach a throughput a few percent higher than ours,
which is attributable to the decreased efficiency of the star topology noted by Gonsalves and Tobagi. The
delay characteristics shown in Fig 2. are also very close to those observed by Gonsalves. There were sev-
eral unknowns that we made a best guess at, in order to come as close as possible to Gonsalves’ observa-
tions. Gonsalves gives an estimate of the propagation delay (30us) on his network, not an exact figure. We
used the 30us estimate in our simulation. Furthermore, for a given experiment, Gonsalves states only that
33-38 stations were present. We used 35 stations to validate against Gonsalves’ observations.
7.0 Conclusion
The presence of time-driven messages in embedded systems results in large delays for collision based
protocols like Ethernet. Message delays, which are an important issue for real-time communication system
design, are significantly worse for mixed and time-driven Ethernet workloads than for Poisson workloads.
However, the delays are shorter for embedded systems than for LANs because of the increased efficiency
of the MAC at short cable lengths.
0.10 1.0 10.0 0
1
2
3
4
5
6
7
8
9
10
1110 Mbit/s Ethernet, Poisson Workload
Net T
hrou
ghpu
t (Mb
it/s)
ideal1500 byte frames512 byte frames64 byte frames

Standard Ethernet as an Embedded Communication Network June 8, 1999 32
In order to determine a bound on just how badly Ethernet might perform when subjected to time-
driven traffic, one of our simulation workloads was fully time-driven. That is, all the messages arrived in
lock step. We used 35 stations since we consider 35 to be a reasonable upper bound on the number of
nodes in an embedded system. When simulating cable lengths typical of a LAN, time-driven workloads
had delays on the order of 100 times longer than Poisson workloads for small frames. When cable lengths
typical of embedded systems were considered, our time-driven workloads had delays approximately 35
times longer than Poisson workloads. The difference in delay degradation (100x for the LAN, 35x for the
embedded system) shows that Ethernet actually handles message pileups much better as an embedded net-
work than a LAN.
We also found a way to improve time-driven message delays. By introducing a controlled, uniformly
distributed jitter, the lock-step arrival of time-driven messages can be broken. While this jitter actually
delays the message slightly, it results in an overall improved message delay because the time-driven mes-
sage is more likely to find the bus idle, thus avoiding multiple backoffs. Using controlled jitter, the average
delays for embedded time-driven workloads were improved by roughly 26% and the 99 percentile delays
were improved by roughly 47%. Picking a reasonable maximum jitter value is a simple iterative procedure.
The jitter can be implemented in user level code without any modifications to network hardware or drivers.
Finally, we compared the performance of embedded Ethernet to CAN, a widely used embedded net-
work. A comparison of average delays revealed that despite its collision-based MAC, Ethernet actually has
lower average message delays than CAN because it runs at a significantly higher bitrate. This is true even
when Ethernet is subjected to fully time-driven workloads which induce significant delays regardless of the
offered load. Furthermore, we found that 99% of delays for Ethernet are just a few ms longer than the
slowest CAN message. When our controlled jitter is introduced, Ethernet is actually able to provide shorter
message delays than CAN for both the average and 99 percentile. Therefore, in situations when hard real-
time delays are not required, we found that standard 10 Mbit/s Ethernet can actually provide delay perfor-
mance comparable to or better than CAN, a dedicated embedded communication protocol.

Standard Ethernet as an Embedded Communication Network June 8, 1999 33
8.0 References
[Addison, 98] J. Addison, W. Cole, “Ethernet rules closed-loop system“,InTech, vol.45, no.6, pp. 39-42,
June, 1998.
[Backman, 93] U. Backman, M. Torngren, “Evaluation of real-time communication systems for machine
control“, Proc. of the Swedish National Association on Real-Time Systems Conference, August 1993.
[Boggs, 88] D.R.Boggs, J.C. Mogul, C.A. Kent, “Measured capacity of an Ethernet: myths an reality”,
Computer Communication Review, vol. 18, no. 4, pp. 222-34, August 1988.
[CAN, 91] CAN Specification Version 2.0, Robert Bosch GmbH, 1991.
[Daniel, 97] R.A. Daniel, “A case for communicating sensor data via Ethernet”,I&CS, vol.70, no.10, pp.
37-40, October 1997.
[Daniel, 98] R.Daniel, “Embedded Ethernet connectivity”,Embedded Systems Programming, April 1998.
[Elkins, 82] E.P. Elkins, “Data acquisition and control using ETHERNET”,Nuclear Instrumentation
Methods Phys. Res. A., vol. A247, no.1, pp. 197-201, June 1986.
[Glaze, 96] S. Glaze, “Smart Distributed System Accumulation Conveyer Control”,Third International
CAN Conference, pp. 13-2 - 13-8, 1996.
[Gonsalves, 83] Gonsalves, T.A., “Packet-voice communications on an Ethernet local computer network:
an experimental study”,Computer Communication Review, Vol. 13, no. 2, pp. 178-185, 1983.
[Gonsalves, 85] T.A. Gonsalves, “Performance characteristics of 2 Ethernets: an experimental study”,Pro-
ceedings of the 1985 ACM SIGMETRICS Conference on Measurement and Modeling of Computer Sys-
tems, pp. 78-86, 1985.

Standard Ethernet as an Embedded Communication Network June 8, 1999 34
[Gonsalves, 88] T.A. Gonsalves, F.A. Tobagi, “On the performance effects of station locations and access
protocol parameters in Ethernet networks”,IEEE Transactions on Communications, vol.36, no.4, pp. 441-
9, April 1988.
[Hughes, 82] H.D. Hughes, L. Li, “Simulation model of an Ethernet”,Computer Performance, Vol.3, no.
4, pp. 211-217, December 1982.
[Hutchinson, 87] D. Hutchinson, M. Merabti, “Ethernet for real-time applications”,IEE Proceedings E
(Computers and Digital Techniques), vol. 134, no. 1, pp. 47-53, January 1987.
[IEEE, 85]IEEE Standards for Local Area Networks Carrier Sense Multiple Access With Collision Detec-
tion (CSMA/CD) Access Method and Physical Layer Specifications, ANSI/IEEE Std 802.3-1985, 1985.
[Koopman, 96] P. Koopman, “Tracking down lost messages and system failures”,Embedded Systems Pro-
gramming, vol. 9, no. 11, pp. 38-52 October 1996.
[Krishna, 97] C.M. Krishna, K.G. Shin,Real-Time Systems, McGraw-Hill, 1997.
[Leu, 95] T. Leu, M. Neilson, B. Leu, “Simulation analysis of a controller area network subject to asym-
metric traffic loads”,Proceedings of the SCS’95, pp. 784-789, July 1995.
[Mazraani, 91] T.Y. Mazraani, G.M. Parulkar, “Performance of the Ethernet under conditions of bursty
traffic”, Washington University, St. Louis, Missouri,Tech Report WUCS-91-12, February 1991.
[Moon, 96] T. Moon, “Control in automotive body networks”,Proceedings of the Third International CAN
Conference”, pp. 12-23 - 12-28, 1996.
[MTL, 98] MTL Instruments Group, “Fieldbuses: Look before you leap”,EDN, November 5, 1998.
[Nilsson, 98] J. Nilsson, “Real-Time Control Systems with Delays“,Phd Thesis, Department of Automatic
Control, Lund Institute of Technology, 1998.
[SAE, 93] ”Class C Application Requirement Considerations”,SAE Technical Report J2056/1, June 1993.

Standard Ethernet as an Embedded Communication Network June 8, 1999 35
[Shear, 97] D. Shear, “Going global in the real world: putting an embedded system on the internet”,EDN,
September 1997.
[Shwarts, 87] Shwartz, Mischa,Telecommunication Networks Protocols, Modeling, and analysis, Addison
Wesley, 1987.
[Tindell, 94] K. Tindell, A. Burns, “Guaranteed Message Latencies For Distributed Safety-Critical Hard
Real-Time Control Networks”,University of York Technical Report YCS 229, 1994
[Quintell, 97] R.A.Quintell, “Web servers in embedded systems enhance user interaction”,EDN, April
1997.
[Wittenmar, 95] Wittenmar, B., Nillson, J., Torngren, M., “Timing problems in real-time control systems”,
Proceedings of the American Control Conference, pp. 2000-2005 1995.
[[Zuberi, 97] K.M. Zuberi, K.G. Shin, “Scheduling messages on controller area network for real-time CIM
applications”,IEEE Transactions On Robotics And Automation, vol. 13, no. 2, pp. 310-314, April 1997.


