Standard Operating Procedure
for the USGS Reston Biogeochemical Processes in Groundwater Laboratory
(RBPGL)
Determination of Low Molecular Weight Organic Acid (LMWOA)
in Water Samples
By Tracey A. Spencer, Jeanne B. Jaeschke, and Isabelle M. Cozzarelli
This SOP documents research work in progress and is intended for internal USGS use only.
Any use of trade, firm, or product names is for descriptive purposes only and does not imply
endorsement by the U.S. Government.
Although this information product, for the most part, is in the public domain, it also may contain
copyrighted materials as noted in the text. Permission to reproduce copyrighted items must be
secured from the copyright owner.
ii
Contents
Acronyms and Abbreviations ........................................................................................................................ iv
Symbols .......................................................................................................................................................... v
Summary of Procedure ................................................................................................................................... 1
Operating Range ............................................................................................................................................. 2
Reference Materials and Documentation ....................................................................................................... 2
Reference Materials Used, Storage Requirements, and Stablility .............................................................. 2
Documentation ............................................................................................................................................ 2
Sample Collection, Preparation, Analysis, Retention Times and Disposal .................................................... 2
Field Sampling, Containers, Collection Procedures, and Handling Requirements . .................................. 2
Sample Preparation ..................................................................................................................................... 4
Holding Time, Sample Analysis, and Time Requirements ......................................................................... 4
Problematic Samples ................................................................................................................................... 5
Sample Retention Time and Disposal ......................................................................................................... 5
The Analytical System and Measurement of LMWOAS, Dionex Ion Chromatograph ................................ 6
Equipment ................................................................................................................................................... 6
Reagents, Blanks, Standards, Quality Assurance and Quality Control ................................................... 8
Preparation of Reagents ......................................................................................................................... 10
Preparation of Standards ........................................................................................................................ 10
Pyruvate Standards ............................................................................................................................ 10
Calibration Standards ........................................................................................................................ 11
Quality Assurance and Quality Control ............................................................................................. 11
Detection Limits ....................................................................................................................................... 11
Potential Interferences .............................................................................................................................. 12
iii
Sample Run .............................................................................................................................................. 12
Data Management and Records ................................................................................................................ 13
Health, Safety, and Waste-Disposal Information ......................................................................................... 13
Applicable Health and Safety Issues ......................................................................................................... 13
Personal Protection ................................................................................................................................ 13
Chemical Hazards .................................................................................................................................. 13
Specific Waste Disposal Requirements .................................................................................................... 13
References Cited and Recommended Readings ........................................................................................... 14
Figures
1. Thermo Scientific ™ Dionex ™ IonPac AS11-HC Anion-Exchange Column Chromatogram ................. 7
2. Pictorial Representation of the Thermo Scientific ™ Dionex ™ ICS 2100 for LMWOA in Water
samples………….. ......................................................................................................................................... 8
3 . Typical Calibration Curve for the Determination of lactate in water samples………….. ...................... 10
Tables
1. Batch Data with Peak Areas, Concentrations, and Calculations for LMWOA Analyses From Blanks .... 9
2. Batch Data with Peak Areas, Concentrations, and Calculations for LMWOA Analyses From
Concentration Standard………………. ....................................................................................................... 12
Temperature in degrees Celsius (°C) may be converted to degrees Fahrenheit (°F) as follows:
°F= (1.8×°C) + 32
Temperature in degrees Fahrenheit (°F) may be converted to degrees Celsius (°C) as follows:
°C= (°F-32)/1.8
iv
Concentrations of chemical constituents in water are given either in milligrams per liter (mg/L) or
micrograms per liter (µg/L).
Acronyms and Abbreviations
Ag Silver
ASTM American Society for Testing and Materials
Ba Barium
CV Coefficient Variation
g Gram
IC Ion chromatography
ID Identification
KOH Potassium hydroxide
LIMS-LMWOA Laboratory Information Management System for Low-molecular Weight
Organic Acid
LMWOA Low-molecular Weight Organic Acid
mg/L Milligram per liter
MDL Method detection limit
mL Milliliter
mL/min Milliliter Per Minute
n Number
OSHA Occupational Safety and Health Administration
P/N Part number
%RSD Percent Relative Standard Deviation
RBPGL Reston Biogeochemical Processes in Groundwater Laboratory
RSD Relative Standard Deviation
R2 Coefficient of Determination
SD Standard Deviation
SDS Safety Data Sheet
Std Standard
SOP Standard Operating Procedure
TM Trademark
USGS United States Geological Survey
USEPA United States Environmental Protection Agency
VFW Volatile Free Water
VOA Volatile Organic Analysis 18.2 Ω 18.2 Ohm Milli-Q

v
Symbols
Ω Ohm
≤ Less than or equal to
% Percent
°C Degree Celsius

vi

1
Determination of Low-molecular Weight Organic Acid
(LMWOA) in Water Samples
By Tracey A. Spencer, Jeanne B. Jaeschke, and Isabelle M. Cozzarelli
Summary of Procedure
This document describes the Standard Operating Procedure (SOP) for the determination of low
molecular weight organic acids (LMWOA) of the U.S. Geological Survey Reston Biogeochemical
Processes in Groundwater Laboratory (RBPGL), Reston Virginia;
http://water.usgs.gov/nrp/biogeochemical-processes-in-groundwater/. Water samples are analyzed for
LMWOA by ion chromatography using a Thermo Scientific ™ Dionex ™ Ion Chromatograph with a
Dionex ™ ICS Series 2100 AS DV auto sampler, herein referred to as IC, and Chromeleon® software.
Prior to analysis, frozen raw water samples are thawed. Each sample is analyzed initially at a 1:5 and
1:20 dilution for quantative results. Once the analyst has determined the approximate concentration of
the samples, the dilution factor is adjusted so that the sample is analyzed as close to a 1:1 dilution as
possible. If there are matrix interferences, the sample will be filtered using a Dionex ™ OnGuard Ag,
OnGuard AgII, or OnGuard Ba cartridge prior to analysis. A Thermo Scientific™ Dionex™ IonPac
AS11-HC Anion-Exchange Column is used for identifying each analyte. A detailed description of the
sampling methodology can be found at the USGS RBPGL web site
http://water.usgs.gov/nrp/biogeochemical-processes-in-groundwater/.
2
Operating Range
The typical analytical linear range of this method is 0.1 to 10 mg/L. Samples with higher
concentrations must be diluted. Some samples with matrix interferences must be filtered using a Thermo
Scientific™ Dionex™ OnGuard Ag, OnGuard AgII, or OnGuard Ba cartridge prior to analysis. Data
are reported with two significant figures.
Reference Materials and Documentation
Reference Materials Used, Storage Requirements, and Stability
The RBPGL uses two standards, a 100 mg/L mixture of Lactate, Acetate, Propionate, Formate,
Butyrate, and Benzoate from Inorganic Ventures, Christiansburg, VA. The second is a 100 mg/L
concentration standard of Pyruvate that is mixed from a dry chemical (0.1009 g into a 1000 mL
volumetric flask to yield a 100 mg/L solution) from Acros Organics, Geel, Belgium.
Documentation
All calibration results are stored in the Reston Laboratory Information Management System for
Low-molecular Weight Organic Acid Samples (LIMS-LMWOA) associated with field id number,
sample submission date, and project identifier. The requisite Microsoft Excel®data spreadsheet is
created by the RBPGL analyst. Blanks and calibration standards are run with every batch of samples.
Sample Collection, Preparation, Analysis, Retention Time and Disposal
Field Sampling Containers, Collection Procedures and Handling Requirements
Water samples are collected in 20-mL clear borosilicate glass precleaned USEPA certified
Volatile Organic Analysis vials (VOA) with open-top, septa-lined caps (septa are made of Teflon-lined

3
silicone). This is a recommended size, however 40-mL borosilicate glass precleaned EPA certified
(Level II) VOA vials are acceptable. 20-mL or 40-mL vials with septa can be provided by RBPGL at a
cost of $3.00 each plus shipping to the sample submitter on request through e-mail or can be purchased
at Scientific Specialties Service (www.scispec.com). The 20-mL P/N 276720-clear, P/N 276820-amber
glass. The 40-mL P/N 276740-clear, 276840-amber. Other scientific products retailer may also provide
this product. For smaller sample volumes the submitter must first contact RBPGL ([email protected]).
The vials must be labelled clearly with a waterproof marker. All labels must list field id, date and time
of sample collection, analyses to be done. If duplicate samples are collected at one site they should be
labelled “1 of 2” and “2 of 2”. Documentation accompanying the samples must indicate whether or not
any samples contain a known or suspected hazard. If a hazard is noted, please provide a detailed
description. If there is no known or suspected hazard, the documentation must include the word
“None.” Samples to be analyzed by this method can be collected following sampling procedures
outlined in the “USGS National field manual, variously dated” available at
http://water.usgs.gov/owq/FieldManual/. Samples are collected raw, unfiltered and the vial is filled 2/3-
rds leaving enough headspace for sample expansion when frozen. A minimum of 15-mL of sample in a
20-mL vial or a minimum of 30-mL of sample in the 40-mL vial is required for analysis unless special
arrangements are made in advance. Screw the cap onto the vial firmly, but do not overtighten. If the
septum appears to be creased or if it is off-center, the vial may leak.
Place each vial into a foam sleeve, then into a Ziploc-type bag. Freeze with dry ice if available in
the field before shipping, if not, the sample will be frozen when received at the lab. Keep all vials from
the same site together. Secure the vials with additional packing materials and tape so they will not
break during transport. Sample vials should be shipped, if available, on dry ice overnight, notifying
RBPGL by e-mail that the samples having been shipped. The coolers must be sent Monday-Thursday
4
by overnight delivery. If samples cannot be shipped on the day of collection, they should be frozen if
possible. Label the inside lid of the cooler with return address and telephone number using a waterproof
marker. Coolers will be returned by RBPGL to the sample submitter at the submitter’s expense. Shipper
must include either a Federal Express shipping label identifying the USGS internal cost code or Federal
Express account number, or a return mailing label and metered with correct postage for return of the
cooler by parcel post. RBPGL is not open on Saturday, Sunday or Federal holidays, therefore, coolers
should not be sent the day before a holiday. Any cooler or container not accompanied by a prepaid
shipping return label will not be returned automatically. For answers to additional questions sample
submitters should email [email protected].
Sample Preparation
Sample preparation at the RBPGL includes logging samples into LIMS-LMWOA in batches of
1-50 samples per batch, printing labels for each sample and a summary project report. Each sample label
contains the field id (the identifier by which the sample submitter knows each sample) and the unique
RBPGL lab id assigned by the LIMS-LMWOA log in procedure. This information is e-mailed to the
submitter of the samples for identification of any errors. The processing of samples involves including
the field id and dates correspond to the list provided by the submitter.
Holding Time, Sample Analysis, and Time Requirements
The maximum time that raw, frozen samples can be held prior to analysis is 45 days. A sample
template for as many as 15 samples per day is created in LIMS-LMWOA. The analyst sets up blanks,
duplicate or triplicate samples, and calibration standards in the template. Each sample is run in duplicate
at a minimum. The standard error for duplicate runs of the same sample should be ≤ 3%. An average of
the duplicates is the reported value. Average, median, standard deviation (SD), and percent relative
5
standard deviation (%RSD) for duplicate or triplicate samples are reported. The LIMS-LMWOA will
not release preliminary data to submitters until the statistics are acceptable. The time requirement for
performing the LMWOA analyses is a minimum of twenty days for every 15 samples. If a submitter
requires a shorter turnaround time for the analyses, contact RBPGL directly at [email protected].
Problematic Samples
Problematic samples can include surface water and groundwater impacted by landfill leachate,
brines, industrial and domestic wastewater, hydraulic fracturing and oil exploration sites. Such samples
may require additional preparation in order to improve analytical results and/or remove interferences.
Insufficient dilution or filtration of samples may lead to instrument interferences that can preclude
obtaining acceptable results from the RBPGL.
Sample Retention Time and Disposal
Water samples are retained by the RBPGL for 30 days after data are reported. Samples are
then discarded unless the submitter requests that the samples be returned. Return shipping costs are
paid for by the sample submitter. Sample-analysis raw-data files generated from the Chromeleon®
software are exported in Microsoft Excel®
format and copies are kept for 6 months on two different
servers, one on the instrument computer and one on a shared network.
6
The Analytical System and Measurement of LMWOA, Thermo Scientific™
Dionex™ Ion Chromatograph, Thermo Scientific™ Dionex™ ICS 2100 Series AS
DV Auto Sampler
Equipment
The LMWOA are analyzed on the Thermo Scientific™ Dionex™ Ion Chromatograph and
Thermo Scientific™ Dionex™ ICS Series 2100 AS DV (referred to herein as IC) using a
Thermo Scientific™ Dionex™ IonPac AS11-HC Anion-Exchange Column
(http://www.dionex.com/en-us/webdocs/4157-PS-Dionex-IonPac-AS11-AS11-HC-28Mar2012-
PS70024_E-R2.pdf). This column uses a potassium hydroxide gradient eluent to provide fast
profiling of organic acids. It is designed for use in complex matrices with a large number of
organic acid constituents.

7
Figure 1. Thermo Scientific ™ Dionex ™ IonPac AS11-HC Anion-Exchange Column
Chromatogram

8
Figure 2. Pictorial Representation of the Thermo Scientific ™ Dionex ™ ICS 2100 for LMWOA
in Water Samples.
The IC and Chromeleon® Software are the major components of the analytical system. The
average analytical run time is approximately 45 minutes per sample. Replicate analyses of each
sample are measured to meet the system-specified range of a SD of ≤3%. The sample tray holds a
maximum of (6) 6-mL vials. The auto sampler can hold 50 samples. The carrier gas is high purity
helium. For instrument operating instructions and parameters, refer to Appendix A.
Reagents, Blanks, Standards, Quality Assurance and Quality Control
Distilled 18.2 Ω water is used in preparation of reagents, blanks, standards, reference material
and dilution of samples. Class A volumetric flasks and pipettes are used to prepare all solutions. All
glassware is thoroughly cleaned by soaking for several hours in Alconox®, (White Plains, NY) and then
rinsed one time with tap water and multiple times with 18.2 Ω water. Foil is used to wrap the glassware,
and non-volumetric items are baked in a muffle furnace for 4 hours at 425 oC. Pasteur Pipettes are
9
rinsed three times with 18.2 Ω water, and then air-dried. After air-drying over night, they are baked in a
muffle furnace for 4 hours at 225 oC, allowed to cool, and then wrapped in foil. Volumetric glassware is
dried for 4 hours at 225 oC. Glassware is cooled to room temperature before use. 18.2 Ω water is used as
blanks for each run. A minimum of two blanks are run at the beginning of each batch and at the end of
each batch. The blanks are run at the end of the batch to confirm a stable baseline was attained. A
median value of the blanks is determined to be the absolute value of the y-intercept from peaks
integrated with Chromeleon® Software.
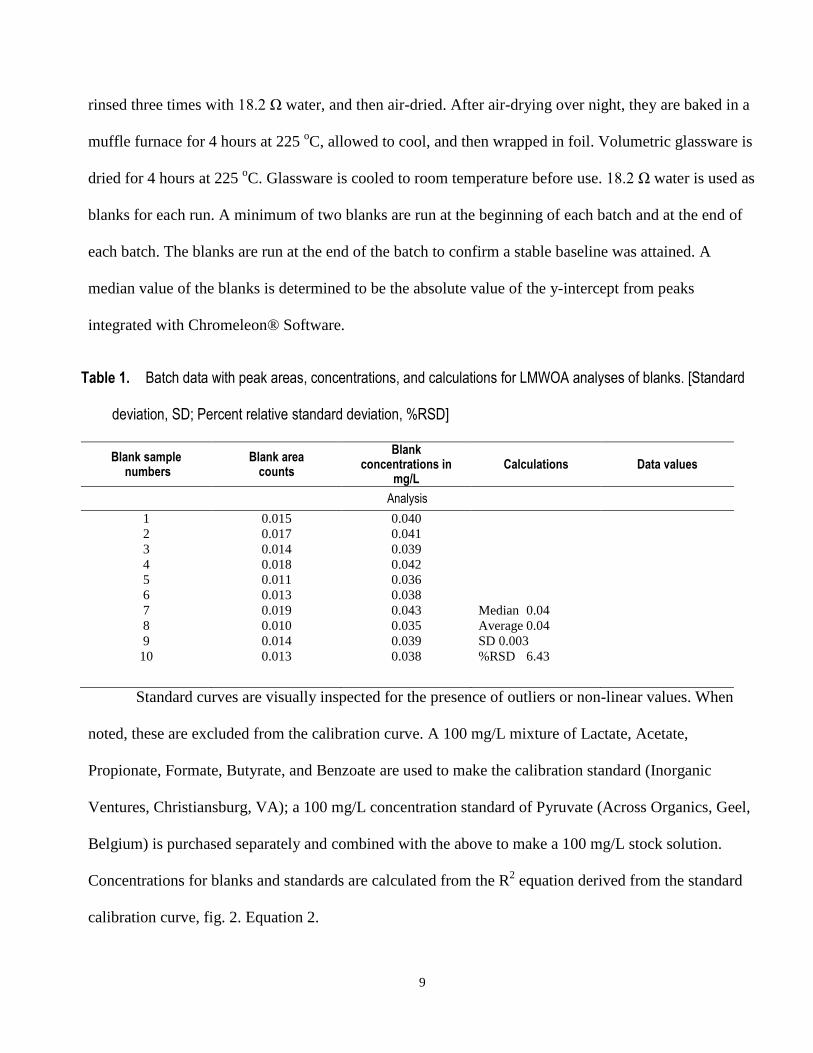
Table 1. Batch data with peak areas, concentrations, and calculations for LMWOA analyses of blanks. [Standard
deviation, SD; Percent relative standard deviation, %RSD]
Blank sample numbers
Blank area counts
Blank concentrations in
mg/L Calculations Data values
Analysis
1
2
3
4
5
6
7
8
9
10
0.015
0.017
0.014
0.018
0.011
0.013
0.019
0.010
0.014
0.013
0.040
0.041
0.039
0.042
0.036
0.038
0.043
0.035
0.039
0.038
Median 0.04
Average 0.04
SD 0.003
%RSD 6.43
Standard curves are visually inspected for the presence of outliers or non-linear values. When
noted, these are excluded from the calibration curve. A 100 mg/L mixture of Lactate, Acetate,
Propionate, Formate, Butyrate, and Benzoate are used to make the calibration standard (Inorganic
Ventures, Christiansburg, VA); a 100 mg/L concentration standard of Pyruvate (Across Organics, Geel,
Belgium) is purchased separately and combined with the above to make a 100 mg/L stock solution.
Concentrations for blanks and standards are calculated from the R2 equation derived from the standard
calibration curve, fig. 2. Equation 2.
10
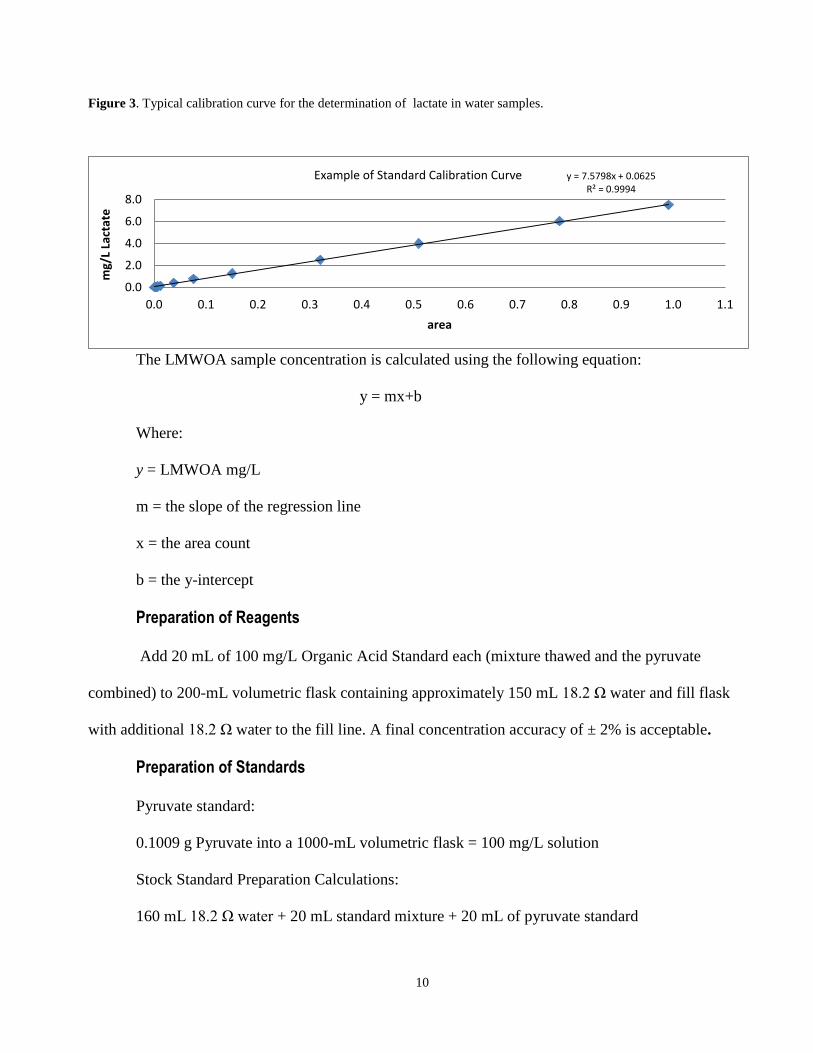
Figure 3. Typical calibration curve for the determination of lactate in water samples.
The LMWOA sample concentration is calculated using the following equation:
y = mx+b
Where:
y = LMWOA mg/L
m = the slope of the regression line
x = the area count
b = the y-intercept
Preparation of Reagents
Add 20 mL of 100 mg/L Organic Acid Standard each (mixture thawed and the pyruvate
combined) to 200-mL volumetric flask containing approximately 150 mL 18.2 Ω water and fill flask
with additional 18.2 Ω water to the fill line. A final concentration accuracy of ± 2% is acceptable.
Preparation of Standards
Pyruvate standard:
0.1009 g Pyruvate into a 1000-mL volumetric flask = 100 mg/L solution
Stock Standard Preparation Calculations:
160 mL 18.2 Ω water + 20 mL standard mixture + 20 mL of pyruvate standard
y = 7.5798x + 0.0625 R² = 0.9994
0.0
2.0
4.0
6.0
8.0
0.0 0.1 0.2 0.3 0.4 0.5 0.6 0.7 0.8 0.9 1.0 1.1
mg/
L La
ctat
e
area
Example of Standard Calibration Curve
11
Calibration Standards:
Calibrations standards are made from a multi-analyte mixture and pyruvate standard. Appendix I.
contains exact standard concentrations.
Quality Assurance and Quality Control
Raw field samples are run in duplicate or triplicate with blanks and calibration standards in each
batch. The blanks are run to establish a stable baseline and monitor any carryover contamination during
analysis of samples. Conditioning blanks are run before and after the calibration curve. They help in
decreasing the instrument blank concentrations by reducing carryover and help restore baseline
conditions. Calibration standards are used to calibrate the instrument.
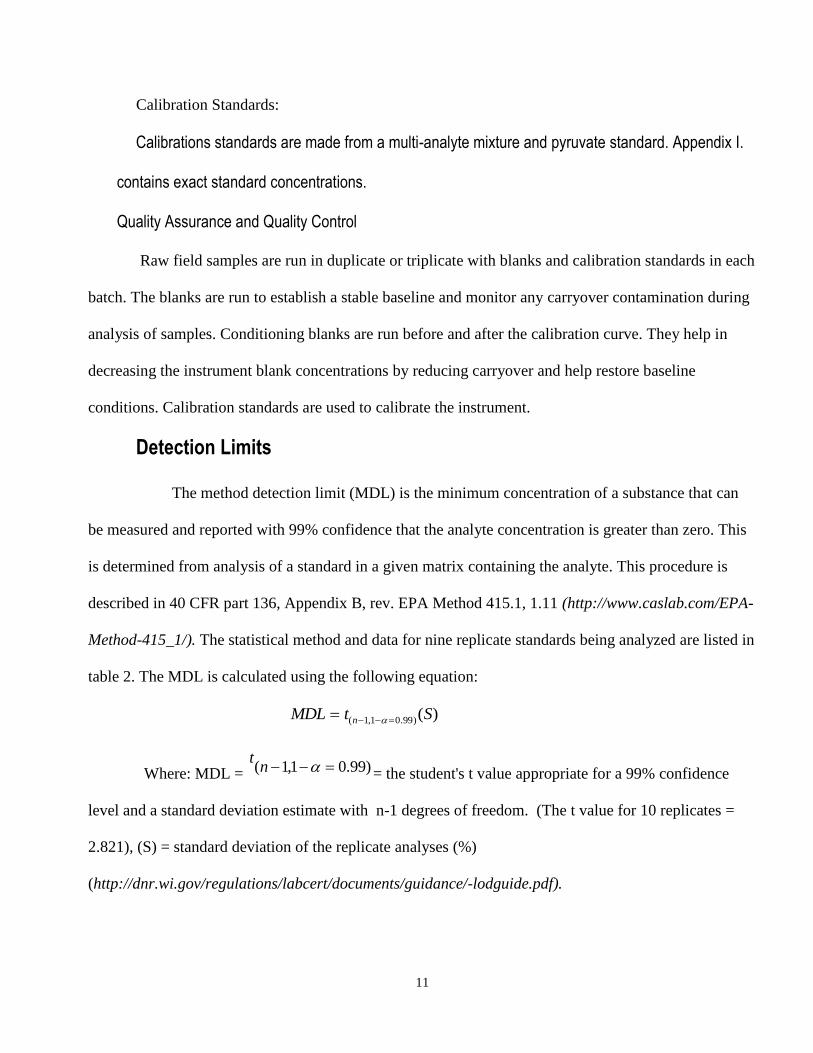
Detection Limits
The method detection limit (MDL) is the minimum concentration of a substance that can
be measured and reported with 99% confidence that the analyte concentration is greater than zero. This
is determined from analysis of a standard in a given matrix containing the analyte. This procedure is
described in 40 CFR part 136, Appendix B, rev. EPA Method 415.1, 1.11 (http://www.caslab.com/EPA-
Method-415_1/). The statistical method and data for nine replicate standards being analyzed are listed in
table 2. The MDL is calculated using the following equation:
MDL t Sn ( , . )( )1 1 0 99
Where: MDL = )99.01,1( nt
= the student's t value appropriate for a 99% confidence
level and a standard deviation estimate with n-1 degrees of freedom. (The t value for 10 replicates =
2.821), (S) = standard deviation of the replicate analyses (%)
(http://dnr.wi.gov/regulations/labcert/documents/guidance/-lodguide.pdf).

12
Table 2. Batch Data With Peak Areas, Concentrations, and Calculations for LMWOA Analyses of lactate
n of stds analyzed Lactate area
Lactate concentrations in
mg/L Calculations Data values
Analysis
1
0.023
0.100
Median (mg/L)
0.101
2 0.027 0.101 Average (mg/L) 0.101
3 0.021 0.099 SD (mg/L) 0.036
4 0.029 0.114 %RSD (mg/L) 34.35
5 0.033 0.127
6 0.019 0.091
7 0.026 0.101 MDL (mg/L) 0.090
8 0.034 0.128
9 0.038 0.128
10 0.022 0.100
Potential Interferences
Certain matrices can cause interferences during sample analysis, yielding a high bias. If necessary,
lab personnel will use IC OnGuard Ag, OnGuard II Ag, or OnGuard II Ba filters to filter samples to
remove particles in the water samples. The IC OnGuard Ag and II Ag cartridges contain a silver form,
high capacity, sulfonated, cation-exchange resin (Dionex.com) and may be used to remove chloride,
bromide, and iodide from concentrated matrices. The IC OnGuard II Ba cartridge is a styrene-based,
sulfonic acid resin in the form of barium (Dionex.com) and may be used to remove high concentrations
of sulfate from sample matrices.
Sample Run
A batch of 50 samples including duplicates or triplicates is run with blanks and a calibration curve.
An analyst examines the raw data and calculates the LMWOA concentrations. Average, median, SD and

13
% RSD are calculated. If the % RSD exceeds 3% for any sample, that sample is re-examined and is
added back on the next available day’s analytical template.
Data Management and Records
Reported results are sent to submitters. Raw data runs are filed by project and date. Schedule
calendars are updated as new submission and sample analyses requests are received.
Health, Safety, and Waste-Disposal Information
Applicable Health and Safety Issues
Personal Protection
Safety glasses, protective gloves, enclosed shoes and lab coats are required whenever samples
area analyzed for LMWOA, especially when the samples are of biological origin. For other precautions
and safety procedures, consult Safety Data Sheets (SDSs), (http://www.ilpi.com/msds/index.html).
Chemical Hazards
Site specific hazards will be documented and handled accordingly to OSHA regulations.
Specific Waste Disposal Requirements
Sample containers may be disposed of in the regular trash receptacle unless hazards are noted.
14
References Cited and Recommended Readings
American Society for Testing and Material, 1991, Standard Specifications for Reagent Water.
D1193-77 (Reapproved 1983). Annual Book of ASTM Standards, Vole 11.01. ASTM:
Philadelphia, PA.
U.S. Environmental Protection Agency Method Detection Limit (MDL) procedure found in Title 40
Code of Federal Regulations Part 136 (40 CFR 136, Appendix B, revision 1.11).
U.S. Environmental Protection Agency Report EPA 2000, 2000-National water quality inventory—
1998 report 841–F–00–006, 45 p.
U.S. Environmental Protection Agency Report 40 CFR 136, Guidelines for Establishing Test
Procedures for the Analysis of Pollutants, 1984 pp5-335
U.S. Geological Survey, 2002, USGS Handbook 445-3-H, Safety and Environmental Health
Handbook, 435 p
U.S. Geological Survey, variously dated, National field manual For the collection of water-quality
data: U.S. Geological Survey Techniques of Water-Resources Investigations,
http://water.usgs.gov/owq/Fieldprocedures.html, chapter 4, collection of water samples
Book9, chaps. A1-A9. (Also available at http://pubs.er.usgs.gov/publication/twri09)
http://www.caslab.com/EPA-Method-415_1/ access date 4_23_2015
Dionex.com access date 04_29_2015
http://www.dionex.com/en-us/webdocs/4157-PS-Dionex-IonPac-AS11-AS11-HC-28Mar2012-
PS70024_E-R2.pdf access date 4_23_2015
http://dnr.wi.gov/regulations/labcert/documents/guidance/-lodguide.pdf access date 4_23-2015
http://www.ilpi.com/msds/index.html access date 02_19_2014
water.usgs.gov/nrp/biogeochemical-processes-in-groundwater (USGS, 2015)


