Download - Star Formation in Ring Galaxies

East Tennessee State UniversityDigital Commons @ East Tennessee State University
Undergraduate Honors Theses Student Works
5-2016
Star Formation in Ring GalaxiesSusan C. OlmstedEast Tennessee State Universtiy
Follow this and additional works at: https://dc.etsu.edu/honors
Part of the Astrophysics and Astronomy Commons, and the Physics Commons
This Honors Thesis - Open Access is brought to you for free and open access by the Student Works at Digital Commons @ East Tennessee StateUniversity. It has been accepted for inclusion in Undergraduate Honors Theses by an authorized administrator of Digital Commons @ East TennesseeState University. For more information, please contact [email protected].
Recommended CitationOlmsted, Susan C., "Star Formation in Ring Galaxies" (2016). Undergraduate Honors Theses. Paper 322. https://dc.etsu.edu/honors/322

1
Star Formation in Ring Galaxies
Susan Olmsted
Honors Thesis
May 5, 2016
Student: Susan Olmsted: ______________________________________
Mentor: Dr. Beverly Smith: ____________________________________
Reader 1: Dr. Mark Giroux: ____________________________________
Reader 2: Dr. Michele Joyner: __________________________________

2
Abstract:
Ring galaxies are specific types of interacting galaxies in which a smaller galaxy has
passed through the center of the disk of another larger galaxy. The intrusion of the smaller
galaxy causes the structure of the larger galaxy to compress as the smaller galaxy falls through,
and to recoil back after the smaller galaxy passes through, hence the ring-like shape. In our
research, we studied the star-forming regions of a sample of ring galaxies and compared to those
of other interacting galaxies and normal galaxies. Using UV, optical, and IR archived images in
twelve wavelengths from three telescopes, we analyzed samples of star-forming regions in ring
and normal spiral galaxies using photometry. To measure the star formation rates of the star
forming regions, we used computer software that picked out the regions and measured their
luminosities in all twelve wavelengths, before comparing the luminosities in these wavelengths
to determine the rate of star formation. We have determined that ring galaxies have
proportionally more clumps with higher star formation rates than spirals, and a similar trend was
suggested when comparing ring galaxies to other interacting galaxies (though more data is
required for that comparison). These findings can help us understand galaxy evolution, including
the evolution of our own galaxy.

3
Introduction:
Galaxy interactions occur when two or more galaxies are close enough together that their
mutual tidal forces disrupt their shapes. In most cases, the galaxies will eventually merge. These
encounters have a significant effect on the galaxies’ evolution and structure. Interactions and
mergers are now considered to be an important aspect of galaxy evolution (Struck 2011).
Researchers Boris A. Vorontsov-Velyaminov and Halton Arp began to assemble catalogs of
interacting galaxies in atlases called the VV Atlas (1959) and the Arp Atlas (1966). Computer
simulations showed that the long tails and bridges seen near some peculiar galaxies could be
produced by gravitational interactions (Toomre and Toomre 1977).
Ring galaxies are the result of a specific type of galaxy interaction. They are formed from
the simplest kind of collision: an intruder galaxy falls right down the axis of rotation of a larger
disc galaxy. The larger galaxy reacts to the intrusion of the smaller galaxy, and the collision
produces a characteristic expanding ring-shaped wave that travels through the disk (Theys and
Spiegel 1976; Lynds and Toomre 1976). Over time, the dynamics of ring galaxy formation have
become very well-understood through the use of computer models as well as analytic
calculations (Struck-Marcell and Lotan 1990; Struck-Marcell and Higdon 1993; Struck 2010).
As the intruder galaxy passes through the disk of the target galaxy, matter from the
intruder becomes superimposed on the target galaxy. Because the extra matter adds gravity, the
stars pull towards the center of the galaxy. Once the intruder galaxy passes through, however, the
centrifugal forces become unbalanced, so the inward motion of the stars slows down and
reverses. The stars then accelerate outward, overshooting their original position. This causes the
stars to oscillate about their original orbital radius in an effort to maintain gravitational balance
long after the intruder galaxy is gone. This star movement within the galaxy produces the
4
expansion of the galaxy’s newly formed “ring.” Note that ring galaxies are relatively rare‒ only
about 1% of strongly interacting galaxies are observed to be ring galaxies (Madore et al. 2009).
One unique aspect of galaxy interactions lies in their involvement in the formation of
stars. In fact, a galaxy’s evolution is primarily described by its interstellar gas turning into stars.
The star-forming regions of galaxies appear as bright beads or knots, shining with the clusters of
stars that they forge. Galaxy interactions enhance the rate of star formation. That is, the average
star formation rate (SFR) of samples of interacting galaxies has been compared to that of
samples of isolated galaxies, and it was found that the interacting galaxies have higher stellar-
mass-normalized star formation rates on average, relative to the older stellar population
(Bushouse 1987; Kennicutt et al. 1987; Smith et al. 2007). However, there is a large variation
from galaxy to galaxy.
Smith et al. (2016) went one step further and found, when studying a sample of
interacting galaxies, their relatively higher SFR was due to the higher rate of star formation in
the star-forming regions themselves (as opposed to merely having more individual star forming
regions). This study provided the most significant question for our current research. Though
Smith et al. showed that the interacting galaxies in their sample had more productive star
forming regions, could the same be said about ring galaxies in particular? While the galaxy
sample of the previous research focused on more typical interacting galaxies, the present study
sought to perform the same analysis on a sample of ring galaxies.
To analyze the star forming regions within galaxies, one must study the object’s “color.”
This property is different from the traditional understanding of the word color; for astronomers,
color refers to the ratio of measured fluxes in two bands of light. Additionally, the wavelengths
of light used to find the color do not have to be optical wavelengths; the comparison could be

5
made between UV or infrared wavelengths as well. For example, comparing the UV brightness
with that in the mid-infrared gives a measure of the interstellar absorption, so one can correct for
dust absorption (Leroy et al. 2008; Hao et al. 2011). Since the higher UV luminosity of star
forming regions implies higher star forming rates (Hao et al. 2011), one can compare star
forming rates by comparing absolute UV luminosities, as long as the data is corrected for dust
absorption.
For the present research, we sought to compare the star forming rates of the star forming
regions of three samples of galaxies: ring galaxies, normal spiral galaxies, and other interacting
galaxies.
Data and Sample:
For our galaxy samples, we collected images from three telescope data archives. For
infrared wavelengths, we used the NASA Spitzer Infrared Telescope; for ultraviolet
wavelengths, we used the NASA Galaxy Evolution Explorer (or GALEX) archive; and for
optical wavelengths, we used the Sloan Digital Sky Survey (or SDSS) archive. The five infrared
wavelength bands have effective wavelength of 3.6 microns, 4.5 microns, 5.8 microns, 8
microns, and 24 microns; the two ultraviolet bands have effective wavelengths of 220
nanometers (near-ultraviolet) and 155 nanometers (far-ultraviolet); and the five optical bands
have effective wavelengths of 3551 Angstroms (u), 4686 Angstroms (g), 6165 Angstroms (r),
7481 Angstroms (i), and 8931 Angstroms (z). These multiple wavelength bands (infrared,
ultraviolet, optical) were used to compare luminosities of star forming regions and to determine
their star forming rates.
6
We compared three galaxy samples: a sample of thirty-nine spiral galaxies, a sample of
forty-six interacting pairs of galaxies, and a sample of twelve ring galaxies. The interacting and
spiral samples were selected from the Smith et al. (2007, 2010, 2016) samples, to have 8 micron
Spitzer data available. The ring galaxies were selected from Madore et al. (2009) and have 8
micron data. Note that two of the galaxies in the interacting galaxies sample are also in the
Madore catalog of ring galaxies; those galaxies were excluded from the ring galaxy sample.
From these samples, we used a computer program to pick out the star forming regions for
analysis.
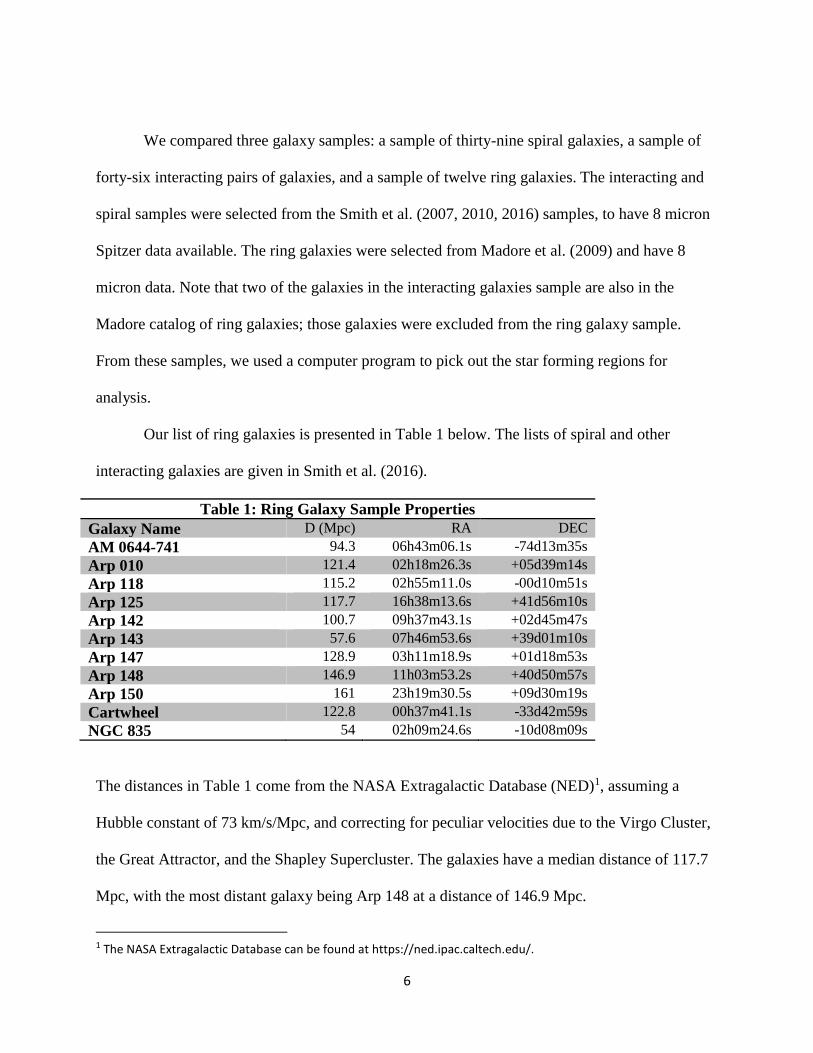
Our list of ring galaxies is presented in Table 1 below. The lists of spiral and other
interacting galaxies are given in Smith et al. (2016).
Table 1: Ring Galaxy Sample Properties
Galaxy Name D (Mpc) RA DEC
AM 0644-741 94.3 06h43m06.1s -74d13m35s
Arp 010 121.4 02h18m26.3s +05d39m14s
Arp 118 115.2 02h55m11.0s -00d10m51s
Arp 125 117.7 16h38m13.6s +41d56m10s
Arp 142 100.7 09h37m43.1s +02d45m47s
Arp 143 57.6 07h46m53.6s +39d01m10s
Arp 147 128.9 03h11m18.9s +01d18m53s
Arp 148 146.9 11h03m53.2s +40d50m57s
Arp 150 161 23h19m30.5s +09d30m19s
Cartwheel 122.8 00h37m41.1s -33d42m59s
NGC 835 54 02h09m24.6s -10d08m09s
The distances in Table 1 come from the NASA Extragalactic Database (NED)1, assuming a
Hubble constant of 73 km/s/Mpc, and correcting for peculiar velocities due to the Virgo Cluster,
the Great Attractor, and the Shapley Supercluster. The galaxies have a median distance of 117.7
Mpc, with the most distant galaxy being Arp 148 at a distance of 146.9 Mpc.
1 The NASA Extragalactic Database can be found at https://ned.ipac.caltech.edu/.
7
In addition to the 8 micron band, ten of the eleven galaxies have images in the FUV, all
eleven have images in the NUV, and all eleven have images in the 24 micron filter. These bands
were used to determine star formation rates (see below).
Method: Clump Selection and Photometry
To analyze the images, we used the Image Reduction and Analysis Facility (IRAF)
software package. First, we used IRAF to smooth the images to the same physical resolution.
Then, we used the package’s daofind software to pick out all of the bright sources in the images.
Galactic nuclei were identified based on the 3.6 micron Spitzer peaks and were excluded from
the analysis. Disk and tail clumps were identified separately. We used the SDSS g band surface
brightness to determine which sources are part of the galaxy, assuming all regions with SDSS g
surface brightness greater than 24.58 magnitudes per arcsec2 are part of the galaxy (see Smith et
al. 2016).
After picking out the star-forming clumps, we used a process called photometry to determine
their luminosities. To do this, we used the IRAF routine phot. This program places a circular
aperture around a particular star-forming clump and sums the flux from the object that is within
the aperture. The initial aperture radius used was 2.5 kiloparsecs (kpc) (note that we are
measuring the same physical size on each galaxy). For the most distant galaxy in the sample, a
radius of 2.5 kpc corresponds to 3 arcseconds. This is the minimum aperture radius for which we
can reliably get fluxes from the GALEX and Spitzer 24 micron images (see below for discussion
on aperture correction).
Next, we deleted contributions to the flux due to the background. The background light was
determined by picking a sky annulus around the region with an inner radius of 2.5 kpc and an

8
outer radius of 5.0 kpc. Then, the background was subtracted from the counts measured in the
aperture, to get the counts from the region itself. We then converted the information to
comparable fluxes and magnitudes using calibration information in the image header. In
addition, we corrected the fluxes for absorption by foreground dust in the Milky Way.
Aperture Correction
Before we can get to our final results on star formation rates, however, we had to correct
the observed flux of a given region for missed light outside the aperture. This aperture correction
accounts for spillage outside the aperture due to image blurring, which is especially important for
distant galaxies.
While the aperture correction was simple for the Spitzer images because standard
correction values are available in the Spitzer Data Handbook, we had to find the correction
manually for the GALEX and Sloan images. To do this, we picked several foreground stars
isolated on the image, and we used a couple of aperture sizes to calculate the fraction of the total
flux contained within a given aperture radius. The results of this technique are given in the plots
below.
Figure 1: Aperture Corrections. This graph plots each galaxy's aperture correction vs.
aperture radius for both the NUV and FUV images. Green: Ring galaxies. Blue circles:
Spiral and interacting galaxies.

9
The above graphs plot each galaxy’s aperture correction versus the actual aperture radius in
angular size (in arcseconds), which depends on the distance. The aperture correction is a
multiplicative factor: for the smallest apertures, the observed flux is increased by a factor of 2-3
due to this correction. As one would expect, the aperture correction is larger for galaxies with
smaller aperture radii, because the light is more likely to spill outside the aperture radius. In the
above plots, the green marks represent the ring galaxies, while the black marks represent spiral
and other interacting galaxies. Also, we have the plots separated between far ultraviolet (FUV)
and near ultraviolet (NUV) images. The FUV images tend to need a little more correction
because the shorter wavelength tends to lead to blurrier images. After making our measurements
and corrections, we were finally ready to compare star formation rates.
Star Formation Rates:
Note that the ultraviolet light is a measure of the hot, young, massive stars, since such
stars produce strong UV emission, while lower mass, colder stars do not. However, UV light
10
from stars can be absorbed by interstellar dust. Therefore, UV measurements alone can
underestimate the number of young stars. On the other hand, mid-infrared light, such as the
twenty-four micron wavelength light, comes from the interstellar dust heated by the ultraviolet
light. Thus, mid-IR observations give us a measure of the hot, young stars unseen in the UV.
Together, UV and mid-IR observations can give a complete inventory of all of the young
massive stars.
For each of the regions, we calculated the star formation rate using a combination of the
UV and the mid-IR flux. This calculation was done as in Smith et al. (2016), using relations from
Leroy et al. (2008) and Hao et al. (2011). When a region was detected in the FUV, we
preferentially used the FUV instead of the NUV, since the shorter wavelength FUV light is
dominated by higher mass stars than NUV. When a region was detected at 24 microns, we used
that preferentially instead of 8 microns, since the 8 micron flux is powered in part by lower mass,
colder stars.
Results
The histograms shown below compare the star formation rates of star forming clumps in
ring galaxies to those in both spiral galaxies and other interacting galaxies. The high luminosity
end of each distribution was fitted to a power law. The drop off at low SFRs is due to
incompleteness of the clump sample because of lack of sensitivity and clump crowding. The
small histograms in the lower two panels of the figures show the distribution of sensitivities for
the sample galaxies, derived from the 8 micron images. The hashed areas of the histograms are
regions in the tidal tails and bridges. The blue histograms are regions that have infrared colors

11
consistent with star forming regions. In other words, the blue histograms omits objects that are
likely foreground stars or background quasars not associated with the galaxies.
The high SFR end of the plot is expected to be complete, so we focused on that end. Note
that the slope of the best fit line is flatter for ring galaxies than for spiral galaxies. Similarly, the
slope for the ring galaxies is less steep than for the interacting galaxies. This implies that clumps
in ring galaxies have proportionally higher rates of star formation than both spiral galaxies and
other interacting galaxies.
Figure 2: Star Formation Rates. These histograms show the star formation rates of the star
forming regions within the interacting and spiral galaxies using the 2.5 kpc radius aperture.
To test if the above results are statistically significant, we used the two-sample
Kolmogorov-Smirnov test, to see if the ring galaxy clumps are statistically distinguishable from
the other samples. We found that, when compared to the spiral galaxy sample, there was only a
4.4 percent probability that the ring galaxy clumps came from the same parent sample. However,

12
when we compared the ring sample and the interacting sample, there was a 42 percent chance
that they came from the same sample.
Additionally, if one were to compare the error bars of the slopes in the star formation
graphs above, one would find that the slope of the best fit line for the ring galaxy sample does
not agree with that of the spiral galaxy sample within their uncertainties, implying that the
difference is statistically significant. However, the slopes of the ring regions and those in other
interacting galaxies agree within their uncertainties. This ultimately means that, in our
comparison between ring galaxies and other interacting galaxies, the results are inconclusive, and
more ring galaxies are required to produce a reliable conclusion.
If one were to examine the star formation graphs again, one would find that there are two
star forming clumps in the ring galaxies sample that have higher star formation rates than the
others in the sample. One of those clumps was found to be in the Cartwheel galaxy, and it was
found to have a star formation rate of 1.6 solar masses per year. The other productive region was
found in the Arp 118 galaxy, and the region had a star formation rate of 8.7 solar masses per
year. Compared to the star formation rate of the entire Milky Way galaxy (1.9 ± 0.4 solar mass
per year; Chomiuk and Povich 2011), these star formation rates are significant for individual star
forming regions.
These results bring up some interesting questions. First, why do interacting galaxies have
more productive star forming regions than spiral galaxies? A comparison of the star formation
rates for the regions with their NUV-[24] colors provides some clues (see the plot below).

13
Figure 3: Color-color plot. Color-color
diagrams compare the brightness of star
formation regions at different wavelengths of
light. Green: Disk (Ring); Blue: Tail (Ring);
Black: Disk (Interacting); Pink: Tail
(Interacting); Red: Spiral (Disk)
In this plot, NUV-[24] refers to the NUV magnitude minus the 24 micron magnitude.
Regions with high NUV-[24] colors have strong 24 micron fluxes compared to the NUV,
meaning they are very obscured by dust. In contrast, regions with low NUV-[24] are bright in the
UV compared to 24 microns, and so they have less dust. Thus, regions with more interstellar dust
have higher star formation rates. If regions have more dust, they likely have more interstellar gas
as well.
Could this interstellar gas lead to more star formation? Why, then, would interacting
galaxies have more gas in some regions, such as the regions in the Cartwheel and Arp 118
galaxies that we mentioned before? Our best explanation is that the galaxy interaction pushes
interstellar gas clouds together, compressing them together and causing more star formation.
Conclusion

14
We concluded from our research that ring galaxies have proportionally more clumps with
higher star formation rates than spiral galaxies. We also found that, although the data comparing
ring galaxies to interacting galaxies was inconclusive, we were able to find two highly
productive star forming regions in ring galaxies, which will be the subject of future research.
These finding can ultimately help us to understand galaxy evolution in a more complete way.
Future work should include the use of more wavelengths for the analysis of ring galaxy
clump star formation, such as the use of images from Chandra’s X-ray Observatory.
Additionally, further activities could use high resolution imaging from Hubble to resolve
individual star forming regions.

15
Acknowledgements: This research was funded by National Science Foundation Extragalactic
Astronomy grant AST-1311935. We also acknowledge an Honors Scholars scholarship.
Works Cited
Arp, H. (1966). Astrophysical Journal Supplement, 14, 1
Bushouse, H.A. (1987). Astrophysical Journal, 320, 49.
Chomiuk, L.; Povich, M.S. (2011). Astronomical Journal, 142, 16
Hao C.-N.; Kennicutt, R.C.; Johnson, B.D.; Calzetti, D.; Dale, D.A.; Moustakas, J. (2011).
Astronomical Journal, 741, 12.
Leroy, A.K.; Walter, F.; Brinks, E.; et al. (2008). Astronomical Journal, 136, 2782.
Lynds, R.; Toomre, A. (1976). Astrophysical Journal, 209, 382.
Madore, B. F., et al. (2009). Astrophysical Journal, 695, 988
Smith, B.J. et al. (2007). Astronomical Journal, 133, 791
Smith, B.J., et al. (2010). Astronomical Journal, 139, 1212
Smith, B.J., et al. (2016). Astronomical Journal, 151, 63
Struck, C. (2011). Galaxy Collisions, (New York: Springer)
Struck-Marcell, C.; Higdon, J.L. (1993). Astrophysical Journal, 411, 108.
Struck-Marcell, C.; Lotan, P. (1990). Astronomical Journal, 358, 99.
Theys, J.C.; Spiegel, E.A. (1976). Astronomical Journal. 208, 650.
Toomre, A.; Toomre, J. (1977). The New Astronomy and Space Science Reader, 271.
Vorontsov-Velyaminov, B. A. (1959). Atlas and Catalog of Interacting Galaxies.


