Virtual Desktop Infrastructure
State of WashingtonDepartment of Financial Institutions
Ron Seymour
CSBS 2011

What is VDI? Rebirth of the dumb
terminal Striped down client
◦ PC with pretty much just Windows and some drivers
◦ Thin Client Appliance
◦ And a Bunch of Servers

Washington VDI Config

Opportunity to reduce cost Increased efficiency, reliability, and
productivity Supports Disaster Recovery Supports Business Continuity Standardization Reduced hardware refresh cycles
Why Do VDI?
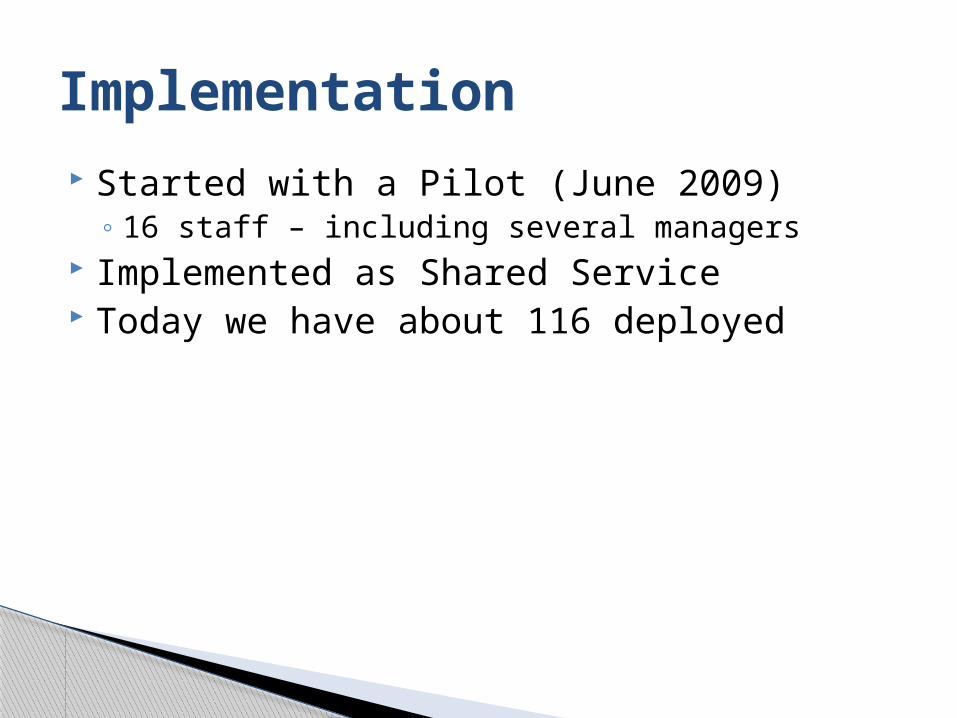
Started with a Pilot (June 2009)◦ 16 staff – including several managers
Implemented as Shared Service Today we have about 116 deployed
Implementation

Citrix XenDesktop◦ Standard Windows Configuration◦ MS Office◦ Antivirus◦ Device Drivers
Citrix XenApp ◦ Special Apps – (MS Project, Visio, STAR …)
Appsense◦ Personalization Software◦ Keeps folks look and feel
Wyse Thin Clients
Washington Configuration

Support is much easier Standardization Available anywhere there is a good network
connection Almost any device will work Reduces/eliminated the refresh cycles Ease of deploying patches Ease of updating or deploying new software
Advantages

Bandwidth Gets blamed for everything Requires techs to clear things at the server
on occasion Upfront Cost does not save money When you are dead you are really dead
Challenges

Cumulative 3 Year Comparison
Continue with
Current Environment
(a)
Implement Desktop
Virtualization(b)
Difference(a) - (b) Savings
Desktop and Laptop Capital Expenditure $ 398,318 $ 98,900 $ 299,418 75%Desktop Power and Cooling $ 21,229 $ 3,397 $ 17,833 84%
Software Expenditure $ - $ 147,017 $ (147,017)Server Capital Expenditure $ - $ 184,060 $ (184,060)Server Storage $ - $ - $ - Switches - Network Infrst. $ - $ -
Total Direct $ 419,547 $ 433,373 $ (13,826) -3%
Desktop Downtime $ - $ - $ - Redirected staff time 200,221$ 11,886$ $ 188,335
Total Indirect $ 200,221 $ 11,886 $ 188,335 94%
Total Cost of Ownership (3 years) $ 619,768 $ 445,259 $ 174,509 28%
Direct
Proposed Costs
Indirect
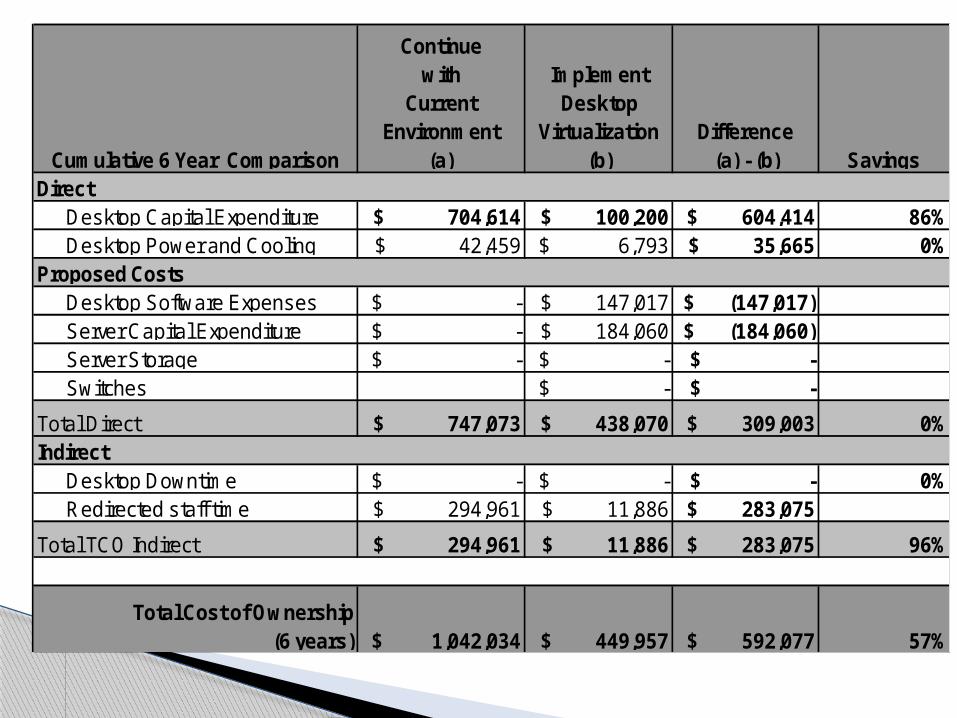
Cumulative 6 Year Comparison
Continue with
Current Environment
(a)
Implement Desktop
Virtualization(b)
Difference(a) - (b) Savings
Desktop Capital Expenditure $ 704,614 $ 100,200 $ 604,414 86%Desktop Power and Cooling $ 42,459 $ 6,793 $ 35,665 0%
Desktop Software Expenses $ - $ 147,017 $ (147,017)Server Capital Expenditure $ - $ 184,060 $ (184,060)Server Storage $ - $ - $ - Switches $ - $ -
Total Direct $ 747,073 $ 438,070 $ 309,003 0%
Desktop Downtime $ - $ - $ - 0%Redirected staff time $ 294,961 $ 11,886 $ 283,075
Total TCO Indirect $ 294,961 $ 11,886 $ 283,075 96%
Total Cost of Ownership (6 years) $ 1,042,034 $ 449,957 $ 592,077 57%
Direct
Proposed Costs
Indirect

VDI- Applications Presentations