
Rajiv Gandhi Institute of Petroleum Technology, Rae Bareli -229316, UP, India.
Email: [email protected]
10th Biennial International Conference & Exposition
P 382
Static Reservoir Characterization and Volumetric Estimation of
K-Sand in Cambay Basin: An Integrated Approach
Ajendra Singh*, Amit Kumar Singh, and Dr. Satish K. Sinha
Summary
We present results from reservoir characterization study of a thin bedded sandstone reservoir located in the Cambay basin
using 3D seismic data interpretation. The purpose of the study is to estimate formation properties (porosity and water
saturation) of the reservoir zones. Our analysis includes horizon interpretation, synthetic seismogram, seismic attributes,
petrophysical analyses and incorporating these information into a Static Geocellular Model for determining the initial
hydrocarbon in-place which would help in developing production strategies for improved reservoir management.
Keywords: Seismic interpretation, Reservoir characterization, Geocellular modeling
Introduction
Reservoir characterization requires a complete integration
of all the available data from different domain including
seismic data, well log data, outcrop studies etc. Our field
of study has a complex subsurface structure. Within the
field, the zone of interest ‘K Sand’ formation consists of
multiple vertically-stacked thin sand bodies present
between low impedance coal. The objective of this work is
to illustrate the processes of iterative seismic
interpretation, structural modeling and to develop an
understanding of the spatial reservoir heterogeneity. This
leads to development of a comprehensive reservoir with
internal reservoir architecture and distribution of reservoir
properties needed for evaluation of this field.
A multi-disciplinary approach, which included
petrophysics, seismic, and volumetric methods, is
undertaken to achieve the above mentioned objectives. A
combination of seismic based geometrical model and well
log data is used to constrain the interpretation for better
reservoir description.
Geological Framework
Cambay Basin has been characterized as a narrow
elongated intra-cratonic rift-graben surrounded by
Saurashtra Uplift in the west, Aravalli-Delhi fold-belt in
the northeast, and Deccan craton in the southeast. The
major tectonic trend is roughly N-S, extending from
Sanchor in the north to Gulf of Cambay in the south and
further opening up into Arabian Sea. The basin is about
425 km long and having width varying between 40 and 80
km. About 5 to 7 km of sedimentary thickness is envisaged
in the basin (Pandey et al., 1993). The major trend of the
lineament in North Cambay Basin is NNW-SSE and NE-
SW. In the southern part, however, the main trend is ENE-
WSW (Chandra et al., 1969)
Cambay basin has been geographically divided into North
and South Cambay basin separated by Mahi river. Based
on the cross trend, the basin has been divided into five
tectonic blocks from north to south as shown in Figure 1.

2
Figure 1: Tectonic framework of Cambay Basin
The field of study is located in the southern part of
Mehsana–Ahmedabad block. The basin has linear grabens
with NNW-SSE orientation, but adjoining Tarapur-
Cambay and Jambusar-Baroch grabens trend in NS
direction. The Deccan trap forms the technical basement
and the overlying sedimentary section from deeper to
shallower consist of Olpad, Older Cambay Shale, Kadi,
Kalol, Tarapur shale and other younger sequences. Kadi
formation is further subdivided into Mehsana and
Mandhali member.
Thick Cambay Shale in the basin has been the main
hydrocarbon source rock. The peak of oil generation and
migration is understood to have taken place during Early
to Middle Miocene. Tarapur Shale acts as the regional cap
rock.
Combination traps are observed in the Olpad formation.
The lithological heterogeneity gave rise to permeability
barriers which facilitated entrapment of hydrocarbon.
The K-Sand was deposited in paralic environment under
unstable shelf conditions with alternating regressive and
transgressive conditions. The oscillating conditions gave
rise to incomplete coal cyclothems, thin marine shale and
lensoidal sand bodies. There are a total of 108 wells drilled
in the field of study. Among other producing reservoir
zone, K-Sand is producing both oil & gas.
Seismic Interpretation
Dataset
In this study, seismic interpretation and structural analysis
of seismic survey was confined to an area of about 50 sq.
km. Poststack time migrated seismic data of the field was
used along with log data from 19 wells for interpretation
purposes. These log data include Gamma Ray, Neutron-
Density, Resistivity, Sonic, Caliper Log etc. VSP (Vertical
Seismic Profile) data from three wells were also available
for time to depth conversion. The base map of the survey
area along with all the wells is shown below in Figure 2.
Figure 2 : Base Map of the study area
Horizon interpretation
Synthetic seismograms were generated using sonic and
density logs from four wells with check shot from the same
wells. Figure 3 shows synthetic seismogram from one
well. Seismic-to-well tie is reasonably good and has been
achieved with a –4 ms time shift. Based on seismic-to-well
tie horizons were marked on seismic data. Mapping of the
seismic reflections, picking of faults, loop tying were
carried out. A total of three horizons among were mapped
(Figure 4). The time structure map of three horizons Sand
Top is shown in Figure 5. Time to depth conversion of the
mapped time structures was carried out using a velocity
model based on migration velocities calibrated with
checkshot and VSP data.
3
Figure 3 : Synthetic Seismogram generated along well A-8
N S
Figure 4 : Seismic section along Inline 290 is shown with
interpreted horizons
Figure 5: Time structure map of Sand Top
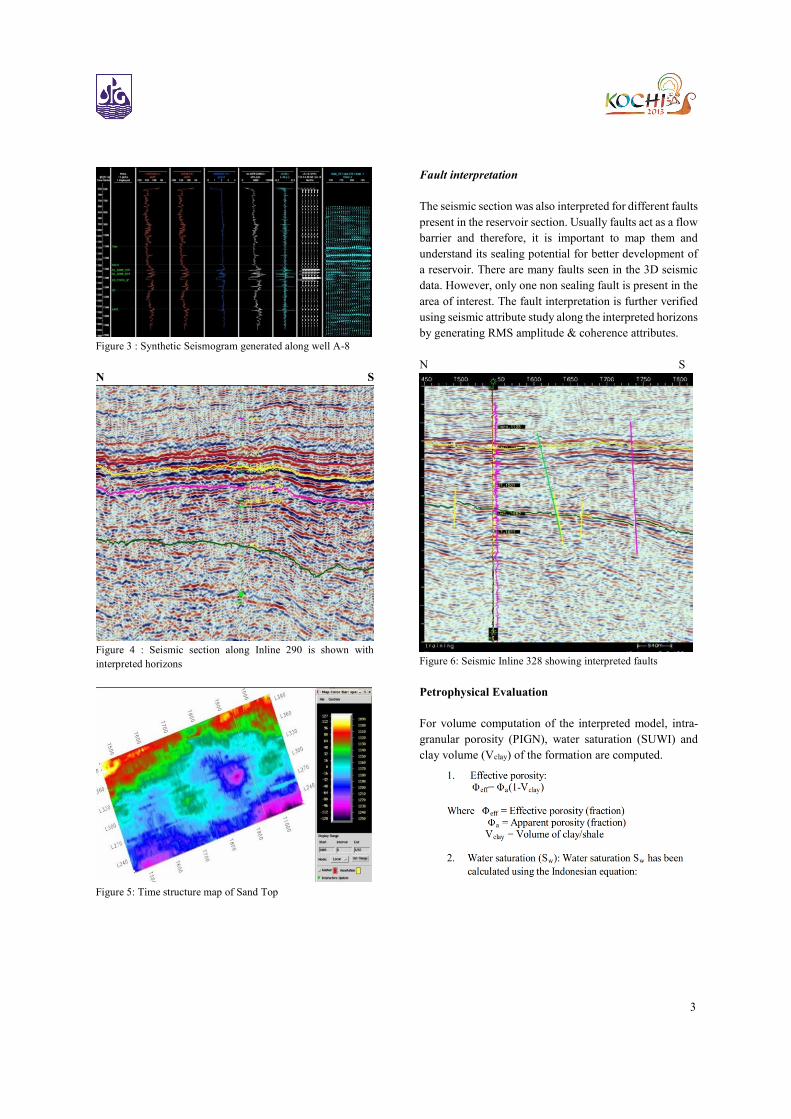
Fault interpretation
The seismic section was also interpreted for different faults
present in the reservoir section. Usually faults act as a flow
barrier and therefore, it is important to map them and
understand its sealing potential for better development of
a reservoir. There are many faults seen in the 3D seismic
data. However, only one non sealing fault is present in the
area of interest. The fault interpretation is further verified
using seismic attribute study along the interpreted horizons
by generating RMS amplitude & coherence attributes.
N S
Figure 6: Seismic Inline 328 showing interpreted faults
Petrophysical Evaluation
For volume computation of the interpreted model, intra-
granular porosity (PIGN), water saturation (SUWI) and
clay volume (Vclay) of the formation are computed.
4
Cementation exponent (m), Saturation exponent (n), and
Tortuosity factor (a) are obtained from Pickett Plot (Fig 7)
and are given in Table 1.
Figure 7: Pickett plot with the highlighted K-Sand section.
Parameter Rw a m n
value 0.299 0.62 2.15 2.06 Table 1: Parameters obtained from Pickett plot (Figure 7) to
compute water saturation.
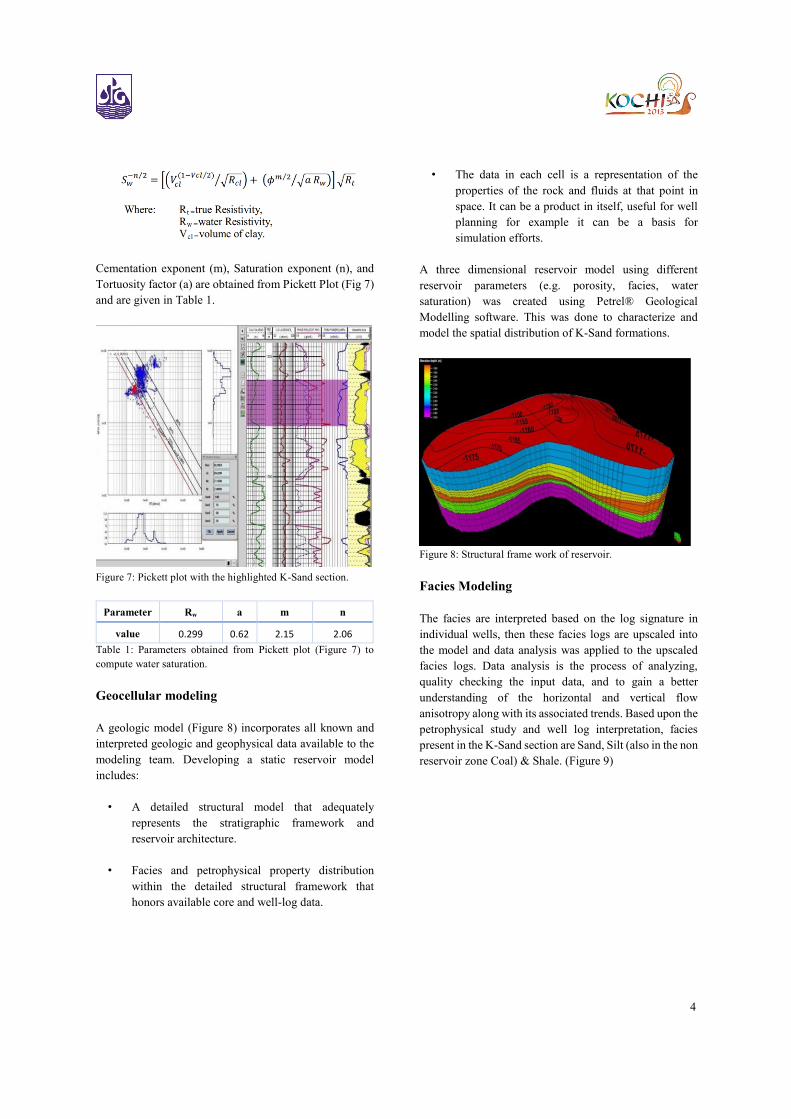
Geocellular modeling
A geologic model (Figure 8) incorporates all known and
interpreted geologic and geophysical data available to the
modeling team. Developing a static reservoir model
includes:
• A detailed structural model that adequately
represents the stratigraphic framework and
reservoir architecture.
• Facies and petrophysical property distribution
within the detailed structural framework that
honors available core and well-log data.
• The data in each cell is a representation of the
properties of the rock and fluids at that point in
space. It can be a product in itself, useful for well
planning for example it can be a basis for
simulation efforts.
A three dimensional reservoir model using different
reservoir parameters (e.g. porosity, facies, water
saturation) was created using Petrel® Geological
Modelling software. This was done to characterize and
model the spatial distribution of K-Sand formations.
Figure 8: Structural frame work of reservoir.
Facies Modeling
The facies are interpreted based on the log signature in
individual wells, then these facies logs are upscaled into
the model and data analysis was applied to the upscaled
facies logs. Data analysis is the process of analyzing,
quality checking the input data, and to gain a better
understanding of the horizontal and vertical flow
anisotropy along with its associated trends. Based upon the
petrophysical study and well log interpretation, facies
present in the K-Sand section are Sand, Silt (also in the non
reservoir zone Coal) & Shale. (Figure 9)

5
Figure 9: Facies distribution for K Sand
Property Modeling
The initial step to property modeling is to upscale the well
logs used in the reservoir modeling process. Multiple types
of well logs or log data are upscaled for the modeling
procedure in Petrel®. The purpose of upscaling well logs
is to assign well log values to the cells in the 3D grid that
are penetrated by the well bore. Each cell in the model can
hold only one value; therefore, the log data is averaged, or
upscaled, to distribute the property data between the wells
where data is not present. The SUWI and PIGN log that
were generated from the petrophysical analysis of the
wells were used for property modeling in the K-Sand
section of the reservoir (Figure 10). Geostatistical
techniques, such as Kriging (for water saturation) and
Kriging Interpolation (for porosity) were used for
propagating the upscaled log property throughout the
reservoir.
Figure 10: Porosity and Water saturation distribution
respectively in K Sand zone
Volumetric Estimation
The objective of the GCM model is to evaluate the
hydrocarbon potential of the K-Sand interval. After
performing the volumetric study of the reservoir,
following dataset is obtained:
Reservoir K Sand
Bulk volume 68.45 MMT
Net Pore volume 10.42 MMT
Net to Gross 0.9
Water saturation 65 %
Porosity 0.3
Formation volume
factor
1.4
Stock tank oil 1.35 MMT
Recovery factor 0.25
Recoverable oil 0.339 MMT
Conclusions
In this study, seismic and well logs have been analyzed for
determining reservoir architecture along with reservoir
parameters using 3D seismic interpretation, and static
geocellular modeling methods. The challenge has been to
map these thin-bed reservoirs using seismic. The problem
is magnified in this case because of the presence of coal
beds. Lithological variations indicate that the K-Sand has
a better reservoir characteristic in the east and northeast.
References
Chandra, P.K, and L.R. Chowdhary, 1969, Stratigraphy of
the Cambay Basin: Bulletin of the Oil and Natural Gas
Commision, Dehradun, India, v.6/2, p. 37-50
Pandey, J., Singh, N.P., Krishna, B.R., Sharma, D.D.,
Parekh, A.K. and Nath, S.S., 1993, Lithostratigraphy of
Indian Petroliferous Basins–Cambay Basin, KDMIPE,
ONGC, Dehradun publication.


