
Mostafa EE et al Haya Saudi J Life Sci Vol-1 Iss-1(Jan-Mar 2016)1-17
Available Online httpscholarsmepubcomhaya 1
Original Research Article
Haya The Saudi Journal of Life Sciences ISSN 2415-623X (Print) Scholars Middle East Publishers ISSN 2415-6221 (Online)
Dubai United Arab Emirates
Website httpscholarsmepubcom
Statistical Process Control in the Evaluation of Microbiological Surface
Cleanliness Quality and Spotting the Defects in Clean Area of Pharmaceutical
Manufacturing Facility Mostafa Essam Eissa
1 Ahmed Mohamed Mahmoud
2 Ahmed Saber Nouby
3
1Microbiological quality control section head in HIKMA Pharma pharmaceutical company PO Box 1913 Cairo 11511
Egypt 2Microbiology laboratory supervisor in HIKMA Pharma pharmaceutical company PO Box 1913 Cairo 11511 Egypt
3Microbiology laboratory senior analyst in HIKMA Pharma pharmaceutical company PO Box 1913 Cairo 11511
Egypt
Corresponding Author Mostafa Essam Eissa
Email mostafaessameissayahoocom
Abstract Regular environmental monitoring (EM) system is indispensable routine activity in assessing the microbiological quality of the manufacturing environment surfaces for the production of medicinal products However
the release of the full potential of such regular activity will not be achieved nor the elucidation for points of defects and
improvements cannot be appropriately investigated unless systematic analysis of the results can be ensured and
performed periodically In the current study statistical process control (SPC) and six sigma tools were used in the study of the quality of microbiological surface cleanliness in clean rooms in pharmaceutical manufacturing plant during ten
months period on weekly basis using contact plates Initial evaluation of data distribution showed that ten out of 11
partitions of the manufacturing area followed distributions other than the Gaussian ones which required logarithmic
transformation to approach normalization for further statistical analysis When control charts were constructed for
transformed data material followed by personnel airlocks showed the greatest risk of microbial excursions then the
corridor with the overall risk of failure 995 suggesting that there was a state of significant imbalance between cleaning
program and its frequency with the work type and load in these sections The present work provided insight for the area
of defects that could not be observed using conventional data trending and provided focus on defined sections that could
impact the overall microbiological quality This analysis provided a promising mean for designing quantitative risk
assessment for microbiological quality control in pharmaceutical human consumables manufacturing and other
healthcare industries
Keywords environmental monitoring statistical process control contact plates control charts airlocks
INTRODUCTION Controlling measures for quality control of
pharmaceutical manufacturing facility begin from the
initial design of the industrial plant [1] Controlled area
is basically devised as utilitarian units for particular
objectives by providing and maintaining environment
with specific quality A properly-laid out clean room is
built with articles and items that take into consideration
the facilitation of decontamination and disinfection
Seamless and smooth floor to wall intersections in
addition to readily reachable niches are part of good
design practice when clean area construction is
considered Floors area-divisions and roofs are built of smooth and hard covers that can be readily sanitized
according to CDER 2003 [23]
Effectively isolated regions for manufacturing
activities are a crucial need in contamination control In
order to sustain appropriate environment quality of in
compartments of higher classification it is essential to attain an appropriate airflow and a relatively higher
pressure in comparison with the surrounding regions of
lower degree of classification Chambers of greater air
quality ought to have a considerable positive pressure
differential in respect to adjoining rooms of lower air
cleanliness For instance a positive pressure differential
of no less than 125 Pascals are required to be kept up at
the interface between classified and non-classified
regions higher air cleanliness should have a substantial
positive pressure differential relative to adjacent rooms
of lower air cleanliness This requirement has been
addressed by FDA 2002 [4]
Practical surface monitoring is mandated by
USP lt797gt so as to evaluate the accomplishment of the
cleaning program in keeping surfaces free of microbial
defilement While USP lt797gt commands regular
surface examining it doesnt determine an authoritative
Mostafa EE et al Haya Saudi J Life Sci Vol-1 Iss-1(Jan-Mar 2016)1-17
Available Online httpscholarsmepubcomhaya 2
time frame outline for inspecting A plausible choice is
for surface examining to occur in the meantime as air
inspecting The contact plate system is suggested when
quantitative information are looked for from level non-
porous surfaces Contact plates are filled so that the
media shapes a vault The supplement medium utilized
as a part of the contact plate might likewise contain a
substances that neutralize antimicrobial chemicals The
surface of the media is squeezed against the surface
being inspected The subsequent inspected zones for a
50 mm diameter plates are roughly 25 cm2 The plates
are incubated for the required measure of time and the visualized microbial colonies if present are then
numbered [567]
The current study was designed to analyze
bioburden results of surfaces of class C manufacturing
facility using Shewhart control charts derived from
microbiological counts from contact plates The present
work aimed to use statistical process control and six
sigma tools to assess the quality identify the
distribution of microbial count locate regions of
defects demonstrate the trend of data and the correlation between the compartments
MATERIAL and METHODS
Surface samples using contact plates were
taken from pharmaceutical manufacturing plant using
methods and limits described by Eissa 2014 [8] The
total number of samples was 94 different surface
samples from class C All microbiological culture
media and chemicals were purchased from OXOID
(Basingstoke Hampshire) and Sigma-Alrich (St Louis
MO 63103) respectively All prepared cultures were
sterilized by high pressure saturated steam in autoclave (steam sterilizer) (FEDEGARI FOB3 Fedegari
Autoclavi SpA SS 235 km 8 27010 Albuzzano (PV)
Italy) Contact 55 mm sterile plastic plates were
obtaineded from Sterilin Limited (solaar house 19
mercers row Cambridge UK) Results of samples were
obtained from the microbiology laboratory in the
quality control department after incubation in Series BD
115 Incubators with natural convection (BINDER
GmbH Im Mittleren Oumlsch 5 78532 Tuttlingen
Germany) Sampling of surface bioburden and
personnel monitoring activities were done using contact plates (surface area of approximately 25 cm2) filled with
an appropriate recovery medium (supplemented with
Tween 80 and lecithin) [9-12] All statistical analysis
and six sigma tools along with their criteria were used
as detailed by Kastango and Douglass 2001 and Eissa
et al 2015 [1314] Culture media used in surface
monitoring were subjected to growth promotion tests
according to the methods and specifications by USP
lt61gt 2015 and passed the acceptance criteria [15]
Microbial enumeration was performed using digital
colony counter (Digital Colony Counter Model 361
Laxman Mahtre Rd Navagaon Dahisar West Mumbai) Illustrations of generated data and
calculations were performed using Microsoft Office
Excel 2007 Control charts cause enumeration diagram
(CausendashandndashEffect Diagram) and Pareto diagram were
constructed using Minitabreg v1710 GraphPad Prism
v601 for windows was used for statistical analysis at α
= 005
RESULTS and DISCUSSION
Microbial count from surface samples using
Replicate Organism Detection and Counting (RODAC)
system in class C production facility followed
distributions for discrete values as shown in Table 1 Trends of data during ten month period showed that the
bioburden distribution of most compartments followed
or approximate Poisson followed by geometric and
negative binomial distribution Table 2 demonstrated
statistical comparisons between untransformed and
log10 transformed results of each section in the area
With the exception of semisolid material airlock all
original data did not pass DAgostino amp Pearson
omnibus normality test while the transformation
normalized all data In addition skewness and kurtosis
values had been significantly improved to approach a
Gaussian distribution Moreover the process of transformation significantly reduced numbers of outliers
from 38 to two and from 25 to zero values only when
using Robust regression and Outlier removal (ROUT)
analysis at less strict (Q = 1000 ) and moderately
strict (Q = 100 (recommended by the program))
threshold for defining excursions [16] On the other
hand a graphical summary of the distribution of the
samples illustrating the samples central tendencies and
variability were demonstrated in Figure 1 for both
normalized and raw data The default interval plot
displays a mean symbol with a 95 confidence interval (CI) bar Interval plots are especially useful for
comparing groups It should be noted that data scatter
around the mean were minimum for logarithmically
transformed in comparison with original untransformed
counterparts [17]
The overall cleaning efficiency of the class C
production area met and exceeded the 6 Sigma (σ) level
with defects much less than 34 part per million (PPM)
[18] as illustrated in Figure 2 The results as such
revealed that the net microbiological cleanliness of the
area was apparently ideal and achieved the target level of the microbial quality The upper control limit (UCL)
of 10 CFU25 cm2 may be used as a general alarming
alert threshold for bioburden trend of the surfaces from
the control chart Similar concept but in a different way
was demonstrated by other researchers [19] There were
no signs of out-of-control states observed on the control
charts On the same line the time-series-plot of the each
partition in the manufacturing facility showed the
microbial trend in Figure 3 Trending of the results as
such could reveal little information about the microbial
quality of surfaces in each zone An empirical cumulative distribution function (CDF) plot was used to
show the fitness of the normal distribution to data
Mostafa EE et al Haya Saudi J Life Sci Vol-1 Iss-1(Jan-Mar 2016)1-17
Available Online httpscholarsmepubcomhaya 3
estimate percentiles and compare different sample
distributions [20] as illustrated in Figure 4
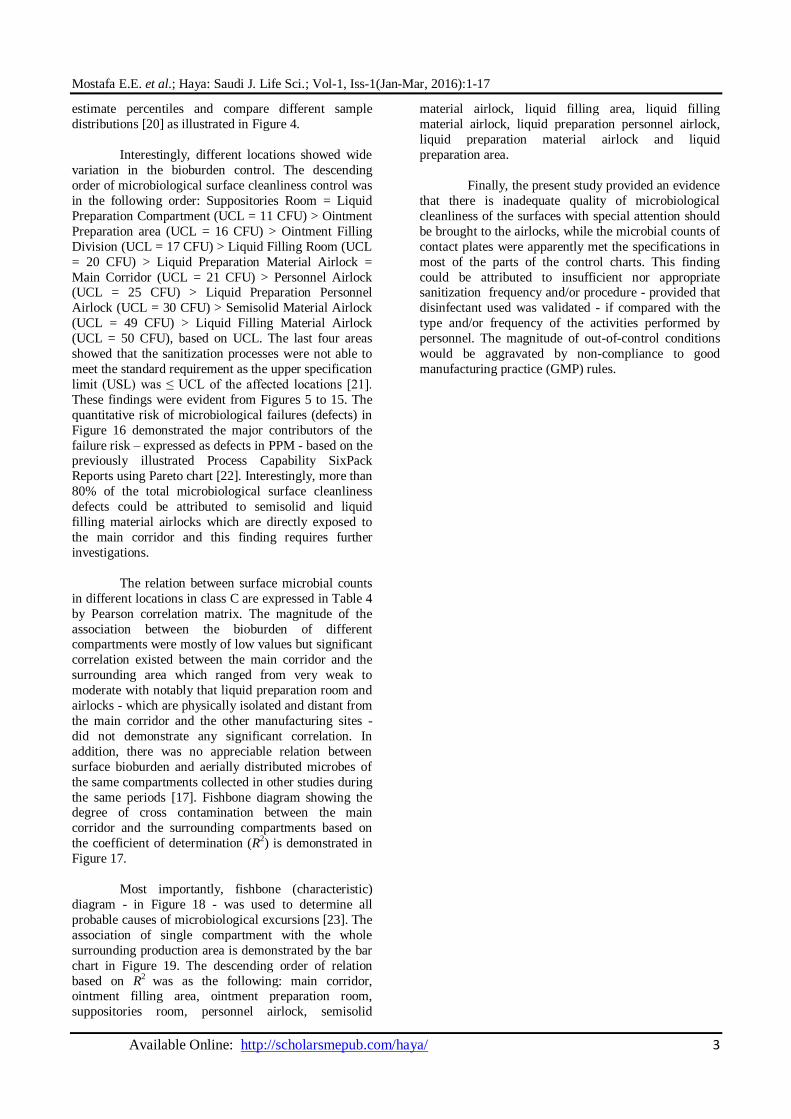
Interestingly different locations showed wide
variation in the bioburden control The descending
order of microbiological surface cleanliness control was
in the following order Suppositories Room = Liquid
Preparation Compartment (UCL = 11 CFU) gt Ointment
Preparation area (UCL = 16 CFU) gt Ointment Filling
Division (UCL = 17 CFU) gt Liquid Filling Room (UCL
= 20 CFU) gt Liquid Preparation Material Airlock =
Main Corridor (UCL = 21 CFU) gt Personnel Airlock (UCL = 25 CFU) gt Liquid Preparation Personnel
Airlock (UCL = 30 CFU) gt Semisolid Material Airlock
(UCL = 49 CFU) gt Liquid Filling Material Airlock
(UCL = 50 CFU) based on UCL The last four areas
showed that the sanitization processes were not able to
meet the standard requirement as the upper specification
limit (USL) was le UCL of the affected locations [21]
These findings were evident from Figures 5 to 15 The
quantitative risk of microbiological failures (defects) in
Figure 16 demonstrated the major contributors of the
failure risk ndash expressed as defects in PPM - based on the previously illustrated Process Capability SixPack
Reports using Pareto chart [22] Interestingly more than
80 of the total microbiological surface cleanliness
defects could be attributed to semisolid and liquid
filling material airlocks which are directly exposed to
the main corridor and this finding requires further
investigations
The relation between surface microbial counts
in different locations in class C are expressed in Table 4
by Pearson correlation matrix The magnitude of the
association between the bioburden of different compartments were mostly of low values but significant
correlation existed between the main corridor and the
surrounding area which ranged from very weak to
moderate with notably that liquid preparation room and
airlocks - which are physically isolated and distant from
the main corridor and the other manufacturing sites -
did not demonstrate any significant correlation In
addition there was no appreciable relation between
surface bioburden and aerially distributed microbes of
the same compartments collected in other studies during
the same periods [17] Fishbone diagram showing the degree of cross contamination between the main
corridor and the surrounding compartments based on
the coefficient of determination (R2) is demonstrated in
Figure 17
Most importantly fishbone (characteristic)
diagram - in Figure 18 - was used to determine all
probable causes of microbiological excursions [23] The
association of single compartment with the whole
surrounding production area is demonstrated by the bar
chart in Figure 19 The descending order of relation
based on R2 was as the following main corridor ointment filling area ointment preparation room
suppositories room personnel airlock semisolid
material airlock liquid filling area liquid filling
material airlock liquid preparation personnel airlock
liquid preparation material airlock and liquid
preparation area
Finally the present study provided an evidence
that there is inadequate quality of microbiological
cleanliness of the surfaces with special attention should
be brought to the airlocks while the microbial counts of
contact plates were apparently met the specifications in
most of the parts of the control charts This finding
could be attributed to insufficient nor appropriate sanitization frequency andor procedure - provided that
disinfectant used was validated - if compared with the
type andor frequency of the activities performed by
personnel The magnitude of out-of-control conditions
would be aggravated by non-compliance to good
manufacturing practice (GMP) rules
Mostafa EE et al Haya Saudi J Life Sci Vol-1 Iss-1(Jan-Mar 2016)1-17
Available Online httpscholarsmepubcomhaya 4
Table 1 Goodness-of-fit for data of microbiological surface cleanliness in clean area of class C
Area Distri-bution Test
Distribution
Poisson Binomial or Neg Binomial D Uniform Geometric Logarithmic
Statistic Rank Statistic Rank Statistic Rank Statistic Rank Statistic Rank
Ointment
Preparation
Kolmogorov
Smirnov 019 1 034 2 035 3 042 4 NA NA
Anderson
Darling 244 1 472 2 1852 4 700 3 NA NA
Ointment
Filling
Kolmogorov
Smirnov 024 2 030 3 023 1 035 4 NA NA
Anderson
Darling 226 1 377 2 1203 4 670 3 NA NA
Personnel
Airlock
Kolmogorov
Smirnov 022 1 034 4 025 2 031 3 NA NA
Anderson
Darling 500 3 457 2 2024 4 336 1 NA NA
Suppositori- es
Room
Kolmogorov
Smirnov 022 1 038 3 031 2 038 4 NA NA
Anderson
Darling 246 1 783 3 1387 4 635 2 NA NA
Semisolid
Corridor
Kolmogorov
Smirnov 019 1 024 2 025 3 034 4 NA NA
Anderson
Darling 253 2 215 1 1093 4 514 3 NA NA
Liquid
Filling
Kolmogorov
Smirnov 016 1 039 4 023 2 037 3 NA NA
Anderson
Darling 208 1 813 3 1517 4 631 2 NA NA
Liquid
Preparation
Kolmogorov
Smirnov 030 2 031 3 020 1 044 4 NA NA
Anderson
Darling 318 1 387 2 1480 4 947 3 NA NA
Liquid
Filling Mat Airlock
Kolmogorov
Smirnov 023 3 021 2 015 1 025 4 NA NA
Anderson
Darling 737 3 247 1 1501 4 346 2 NA NA
Liquid Prep Personnel Airlock
Kolmogorov
Smirnov 026 2 NA NA 029 3 022 1 NA NA
Anderson
Darling 934 2 NA NA 1604 3 179 1 NA NA
Liquid Prep
Material
Airlock
Kolmogorov
Smirnov 021 1 NA NA 029 3 024 2 NA NA
Anderson
Darling 590 2 NA NA 1444 3 242 1 NA NA
Semisolid
Mat
Airlock
Kolmogorov
Smirnov 024 3 018 2 012 1 024 4 038 5
Anderson
Darling 884 4 192 1 783 3 415 2 1050 5
= Followed Binomial distribution while all non-marked data followed negative binomial distribution
Mostafa EE et al Haya Saudi J Life Sci Vol-1 Iss-1(Jan-Mar 2016)1-17
Available Online httpscholarsmepubcomhaya 5
Table 2 Descriptive statistics confidence intervals and Gaussian distribution tests of the original untransformed and transformed data of the microbial counts on contact
plates for each sector in the class C manufacturing facility
Column Statistics
Oin
tmen
t P
rep
arat
ion
Oin
tmen
t F
illi
ng
Per
son
nel
Air
lock
sup
po
sito
ries
roo
m
Sem
iso
lid
Co
rrid
or
Liq
uid
Fil
ling
Liq
uid
Pre
p
Per
son
nel
Air
lock
Liq
uid
Pre
par
atio
n
Liq
uid
Pre
p
Mat
eria
l A
irlo
ck
Sem
iso
lid
Mat
A
irlo
ck
Liq
uid
Fil
ling
Mat
A
irlo
ck
Oin
tmen
t P
rep
arat
ion
(T
)
Oin
tmen
t F
illi
ng
(T
)
Per
son
nel
Air
lock
(T
)
Su
pp
osi
tori
es R
oo
m (
T)
Sem
iso
lid
Co
rrid
or
(T)
Liq
uid
Fil
ling
(T
)
Liq
uid
Pre
p
Per
son
nel
Air
lock
(T)
Liq
uid
Pre
par
atio
n (
T)
Liq
uid
Pre
p
Mat
eria
l A
irlo
ck
(T)
Sem
iso
lid
Mat
A
irlo
ck (
T)
Liq
uid
Fil
ling
Mat
A
irlo
ck (
T)
Minimum 00 00 00 00 00 00 00 00 00 00 10 00 00 00 012 00 012 00 010 00 00 030
25 Percentile 10 10 10 10 20 20 05 20 05 30 40 03 03 03 02 05 04 02 04 02 06 07
Median 20 20 20 20 30 30 20 20 20 60 80 048 048 048 043 054 060 048 051 048 085 095
75 Percentile 35 30 40 35 60 45 50 40 35 11 13 06 06 07 07 08 07 08 07 07 11 12
Maximum 12 90 16 10 15 11 17 70 18 17 17 11 10 12 11 12 11 13 092 13 13 13
10 Percentile 10 00 02 00 10 10 00 10 00 12 20 02 00 01 01 03 03 00 02 00 03 05
90 Percentile 68 58 10 48 80 70 10 50 80 15 17 087 080 10 075 095 090 10 079 095 12 13
Mean 29 27 34 24 41 35 35 27 31 68 87 049 046 053 047 061 059 049 052 047 080 091
Std Deviation 24 20 37 20 31 26 43 16 40 46 52 024 025 031 024 025 023 038 020 035 031 028
Std Error of Mean 037 032 058 031 048 040 067 024 063 071 081 004 004 005 004 004 004 006 003 006 005 004
Lower 95 CI of
mean 22 20 22 17 31 26 21 22 18 54 71 042 038 043 039 053 052 037 045 036 070 082
Upper 95 CI of
mean 36 33 46 30 50 43 48 32 44 83 10 057 054 062 054 069 067 061 058 058 090 10
Lower 95 CI of
median 20 20 10 10 20 20 10 20 10 40 60 040 040 030 030 048 048 030 044 030 070 085
Upper 95 CI of
median 30 30 30 30 50 40 30 30 30 80 12 054 054 060 064 074 070 060 060 060 095 11
DAgostino amp Pearson omnibus normality test
K2 27 14 25 22 18 15 24 63 34 33 83 16 039 12 23 020 087 20 026 094 51 33
P value lt 00001 00011 lt 00001 lt 00001 00001 00004 lt 00001 00423 lt 00001 01940 00161 04488 08210 05497 03115 09064 06476 03683 08791 06253 00791 01908
Passed normality
test (alpha=005) No No No No No No No No No Yes No Yes Yes Yes Yes Yes Yes Yes Yes Yes Yes Yes
P value summary ns ns ns ns ns ns ns ns ns ns ns ns
P value summary ns ns ns ns ns ns ns ns ns
Coefficient of
variation 8146 7598 10975 8388 7595 7448 12471 5737 12916 6701 5948 4873 5478 5898 5149 4097 3820 7693 3778 7533 3884 3057
Skewness 19 12 19 15 15 14 19 090 23 05 03 05 -02 04 02 02 03 03 -01 03 -08 -06
Kurtosis 46 21 34 41 27 18 33 057 59 -07 -12 -00 -01 -01 -08 -01 -03 -07 -04 -03 04 -06
Sum 119 109 139 97 167 142 142 111 128 280 356 20 19 22 19 25 24 20 21 19 33 37
Mostafa EE et al Haya Saudi J Life Sci Vol-1 Iss-1(Jan-Mar 2016)1-17
Available Online httpscholarsmepubcomhaya 6
Table 3 Robust regression and Outlier removal (ROUT) method showing the difference between both
raw and transformed data
RO
UT
Oin
tmen
t P
rep
arat
ion
Oin
tmen
t F
illi
ng
Per
son
nel
Air
lock
sup
po
sito
ries
ro
om
Sem
iso
lid
Co
rrid
or
Liq
uid
Fil
lin
g
Liq
uid
Pre
p
Per
son
nel
Air
lock
Liq
uid
Pre
par
atio
n
Liq
uid
Pre
p
Mat
eria
l
Air
lock
Sem
iso
lid
Mat
Air
lock
Liq
uid
Fil
lin
g M
at
Air
lock
Oin
tmen
t P
rep
arat
ion
Oin
tmen
t F
illi
ng
Per
son
nel
Air
lock
sup
po
sito
ries
ro
om
Sem
iso
lid
Co
rrid
or
Liq
uid
Fil
lin
g
Liq
uid
Pre
p
Per
son
nel
Air
lock
Liq
uid
Pre
par
atio
n
Liq
uid
Pre
p
Mat
eria
l
Air
lock
Sem
iso
lid
Mat
Air
lock
Liq
uid
Fil
lin
g M
at
Air
lock
Raw untransformed data Transformed microbial count to log10 (CFU+1)
An
aly
zed
41 41 41 41 41 41 41 41 41 41 41 41 41 41 41 41 41 41 41 41 41 41
Ou
tlie
rs (
Q =
10
00
)
8 2 5 1 2 5 8 1 6 0 0 0 0 0 0 0 0 0 0 0 2 0
Ou
tlie
rs (
Q =
10
00
)
5 2 5 0 1 3 6 0 3 0 0 0 0 0 0 0 0 0 0 0 0 0
Sa
mp
le
d P
ar
titio
n
- 5 0 5 1 0 1 5 2 0
o in t m e n t p r e p a r a t io n
o in t m e n t f i l l in g
p e r so n n e l a ir lo c k
sup p o s i t o r ie s r o o m
se m iso ild c o r r ido r
l iqu id f i l l in g
l iqu id p r e p p e r so n n e l a ir lo c k
liqu id p r e p a r a t io n
l iqu id p r e p m a t e r ia l a ir lo c k
se m iso l id m a t a ir lo c k
liqu id f i l l in g m a t a ir lo c k
o in t m e n t p r e p a r a t io n ( T )
o in t m e n t f i l l in g ( T )
p e r so n n e l a ir lo c k ( T )
sup p o s i t o r ie s r o o m ( T )
se m iso l id c o r r ido r ( T )
l iqu id f i l l in g ( T )
l iqu id p r e p p e r so n n e l a ir lo c k ( T )
l iqu id p r e p a r a t io n ( T )
l iqu id p r e p m a t e r ia l a ir lo c k ( T )
se m iso l id m a t a ir lo c k ( T )
l iqu id f i l l in g m a t a ir lo c k ( T )
B io b u r d e n 2 5 c m2
Fig-1 Interval plot showing the means and the confidence intervals (CI) for the raw and transformed
surface bioburden in each zone of class C manufacturing facility
Mostafa EE et al Haya Saudi J Life Sci Vol-1 Iss-1(Jan-Mar 2016)1-17
Available Online httpscholarsmepubcomhaya 7
Fig-2 Assessment of the process stability and capability for the overall averaged and transformed contact
plates microbiological counts in addition to the normality of data when it is assumed to follow normal
distribution
Fig-3 Chronologically plotted transformed microbiological surface bioburden count per 25 cm
2
approximately in different manufacturing partitions of class C
Mostafa EE et al Haya Saudi J Life Sci Vol-1 Iss-1(Jan-Mar 2016)1-17
Available Online httpscholarsmepubcomhaya 8
Fig-4 Cumulative distribution function (CDF) of the 11 partitions of the pharmaceutical manufacturing
area showing the relative abundance distribution and pattern of microbial surface bioburden based on
replicate organism detection and counting (RODAC) samples
Fig-5 Assessment of the process stability and capability for the averaged and transformed contact plates
microbiological counts of ointment preparation area in addition to the normality of data when it is
assumed to follow normal distribution
Mostafa EE et al Haya Saudi J Life Sci Vol-1 Iss-1(Jan-Mar 2016)1-17
Available Online httpscholarsmepubcomhaya 9
Fig-6 Assessment of the process stability and capability for the averaged and transformed contact plates
microbiological counts of ointment filling room in addition to the normality of data when it is assumed to
follow normal distribution
Fig-7 Assessment of the process stability and capability for the averaged and transformed contact plates
microbiological counts of personnel airlock in addition to the normality of data when it is assumed to
follow normal distribution
Mostafa EE et al Haya Saudi J Life Sci Vol-1 Iss-1(Jan-Mar 2016)1-17
Available Online httpscholarsmepubcomhaya 10
Fig-8 Assessment of the process stability and capability for the averaged and transformed contact plates
microbiological counts of suppositories room in addition to the normality of data when it is assumed to
follow normal distribution
Fig-9 Assessment of the process stability and capability for the averaged and transformed contact plates
microbiological counts of semisolid corridor in addition to the normality of data when it is assumed to
follow normal distribution
Mostafa EE et al Haya Saudi J Life Sci Vol-1 Iss-1(Jan-Mar 2016)1-17
Available Online httpscholarsmepubcomhaya 11
Fig-10 Assessment of the process stability and capability for the averaged and transformed contact plates
microbiological counts of liquid filling compartment in addition to the normality of data when it is
assumed to follow normal distribution
Fig-11 Assessment of the process stability and capability for the averaged and transformed contact plates
microbiological counts of liquid preparation personnel airlock in addition to the normality of data when it
is assumed to follow normal distribution
Mostafa EE et al Haya Saudi J Life Sci Vol-1 Iss-1(Jan-Mar 2016)1-17
Available Online httpscholarsmepubcomhaya 12
Fig-12 Assessment of the process stability and capability for the averaged and transformed contact plates
microbiological counts of liquid preparation partition in addition to the normality of data when it is
assumed to follow normal distribution
Fig-13 Assessment of the process stability and capability for the averaged and transformed contact plates
microbiological counts of liquid preparation material airlock in addition to the normality of data when it
is assumed to follow normal distribution
Mostafa EE et al Haya Saudi J Life Sci Vol-1 Iss-1(Jan-Mar 2016)1-17
Available Online httpscholarsmepubcomhaya 13
Fig-14 Assessment of the process stability and capability for the averaged and transformed contact plates
microbiological counts of semisolid material airlock in addition to the normality of data when it is
assumed to follow normal distribution
Fig-15 Assessment of the process stability and capability for the averaged and transformed contact plates
microbiological counts of liquid filling material airlock in addition to the normality of data when it is
assumed to follow normal distribution
Mostafa EE et al Haya Saudi J Life Sci Vol-1 Iss-1(Jan-Mar 2016)1-17
Available Online httpscholarsmepubcomhaya 14
Fig-16 Pareto chart of the manufacturing zones in class C pharmaceutical plant displaying defects of
microbiological surface quality in decreasing magnitude of frequency in order to determine the area of
priority for improvements
LFMA = Liquid Filling Material Airlock SMAL = Semisolid Material Airlock LPPA = Liquid Preparation
Personnel Airlock LPMA = Liquid Preparation Material Airlock PRAL = Personnel Airlock SSCR =
Semisolid Corridor LQFL = Liquid Filling area OFLL = Ointment Filling room OPRP = Ointment Preparation
room SPRM = Suppositories Room and LQPR = Liquid Preparation Room
Table 4 Pearson correlation matrix with Two-tailed P at 95 CI and α = 005 for microbiological surface
cleanliness of Class C productions partitions
Pearson Correlation Matrix
Co
rrid
or
Oin
tmen
t
Pre
par
atio
n
Oin
tmen
t
Fil
lin
g
Per
son
nel
Air
lock
Su
pp
osi
tori
e
s R
oom
Liq
uid
Fil
lin
g
Liq
uid
Pre
p
Per
son
nel
Liq
uid
Pre
par
atio
n
Liq
uid
Pre
p
Mat
eria
l
Air
lock
Sem
isoli
d
Mat
Air
lock
Liq
uid
Fil
lin
g M
at
Air
lock
Corridor
033 039 043
yen
059
yen 022 013 001 -004 018 031
Ointment Preparation 033
056
yen 033 021 021 -001 013 019 017 001
Ointment Filling 039 056
yen 022 039 026 003 -006 010 030 012
Personnel Airlock 043
yen 033 022
038 005 009 012 -005 003 029
Suppositories Room 059
yen 021 039 038
031 006 -002 -008 017 024
Liquid Filling 022 021 026 005 031
015 015 -010 013 -011
Liquid Prep
Personnel 013 -001 003 009 006 015
018 -016 -025 -003
Liquid Preparation 001 013 -006 012 -002 015 018
-007 012 -015
Liquid Prep Material
Airlock -004 019 010 -005 -008 -010 -016 -007
024 003
Semisolid Mat
Airlock 018 017 030 003 017 013 -025 012 024
019
Liquid Filling Mat Airlock
031 001 012 029 024 -011 -003 -015 003 019
= Significant correlation yen = Moderate correlation while all the other showed either weak or very weak
association
Mostafa EE et al Haya Saudi J Life Sci Vol-1 Iss-1(Jan-Mar 2016)1-17
Available Online httpscholarsmepubcomhaya 15
Fig- 17 Ishikawa Diagram showing the degree of the relation between surface bioburden of the main
corridor and the other manufacturing partitions using coefficient of determination (R2)
SM = Semisolid Material Airlock LP = Liquid Preparation room LF = Liquid Filling area PA = Personnel
Airlock OP = Ointment Preparation room LFM = Liquid Filling Material Airlock LPM = Liquid Preparation
Material Airlock LPP = Liquid Preparation Personnel Airlock SR = Suppositories Room and OF = Ointment
Filling Area
Fig-18 Ishikawa Diagram showing all the possible causes of microbiological out-of-control states
Fig-19 Total coefficient of determination (R
2) of each manufacturing location in class C
Surfaces
Partitions
with Other
of Corridor
Contamination
Cross
LFM
SM
LPM
LP
LPP
LF
SR
PA
OF
OP
0110175
00957205 0150033
0185972
0350669
00494594
00165297
5824296e-00
000157264
00315363
Cause-and-Effect Diagram
000
010
020
030
040
050
060
070
080
090
100
Corridor Ointment
Preparation
Ointment
Filling
Personnel
Airlock
Suppositories
Room
Liquid Filling Liquid Prep
Personnel
Liquid
Preparation
Liquid
PrepMaterial
Airlock
Semisolid
Mat Airlock
Liquid Filling
Mat Airlock
Mostafa EE et al Haya Saudi J Life Sci Vol-1 Iss-1(Jan-Mar 2016)1-17
Available Online httpscholarsmepubcomhaya 16
CONCLUSION
Airlocks - especially for material transfer -
are locations of high risk of failure in
microbiological quality for pharmaceutical facility
A balance between sanitization practice and the
activity encountered in specific production area should be established An optimization between the
two events could be determined using statistical
process control as demonstrated in the current study
In addition the use of control charts could take the
routine microbiological environmental monitoring
beyond just pass or fail to meet acceptance criteria
Six Sigma tools provide insight of the state of
control identifying defective spots and assisting in
the investigation of any excursion in
microbiological results At the same time the
applied methodology is simple not expensive yet
effective in supporting quality control (QC)quality assurance (QA) tasks with the promising ability to
apply quantitative risk analysis for production area
that could impact the final microbiological quality
of pharmaceutical products and bioburden of the
medicinal drugs
ACKNOWLEDGEMENT
This work was supported partially
financially by HIKMA Pharma pharmaceutical
company ndash 2nd Industrial zone - 6th of October city
Reference and writing style review was performed by Dr Engy Refaat Rashed Data gathering and
collection was performed by the microbiology
laboratory team of the quality control department
REFERENCES
1 Owusu S A (2007) Modern Trends in
Tropical Pharmaceutical Industry
Design (Master dissertation Department of
Architecture Kwame Nkrumah University of
Science and Technology) Available from
httpirknustedughbitstream1234567894311PHARMACEUTICAL20INDUSTRY20
DESIGNpdf
2 Denyer S P amp Baird R M (2nd ed)
(1990) Guide to microbiological control in
pharmaceuticals Ellis horwood
3 Clontz L (2nd ed) (2008) Microbial Limit
and Bioburden Tests Validation approaches
and global requirements CRC Press
4 US Food and Drug Administration (2004)
Guidance for Industry Sterile Drug Products
Produced by Aseptic ProcessingmdashCurrent
Good Manufacturing Practice FDA Center for Drug Evaluation and Research (CDER) Center
for Biologics Evaluation and Research (CBER)
and Office of Regulatory Affairs (ORA)
Washington DC
httpwwwfdagovdownloadsDrugsGuida
ncesucm070342pdf
5 United States Pharmacopeia (2008) USP
lt797gt Guidebook to Pharmaceutical
Compounding-Sterile Preparations In Ann
Arbor United States Pharmacopeial
Convention
6 Workshop Report Summary NIST Technical
Note 1737 (2016) Challenges in Microbial
Sampling in the Indoor Environment Retrieved 25 January 2016 from
httpwwwnistgovmmlbbdbiomolecularupl
oadSloan-Roport-Final-TN-1737pdf
7 Dixon A M (Ed) (2006) Environmental
monitoring for cleanrooms and controlled
environments CRC Press
8 Eissa M E (2014) Studies Of Microbial
Resistance Against Some Disinfectants
Microbial Distribution amp Biocidal Resistance in
Pharmaceutical Manufacturing Facility
Saarbruumlcken Lambert Academic Publishing
9 Quisno R Gibby I W amp Foter M J (1946) A neutralizing medium for evaluating the
germicidal potency of the quaternary
ammonium saltsAmerican journal of pharmacy
and the sciences supporting public
health118(9) 320
10 Erlandson A L amp Lawrence C A (1953)
Inactivating medium for hexachlorophene (G-
11) types of compounds and some substituted
phenolic disinfectants Science 118(3062)
274-276
11 Brummer B A R B A R A (1976) Influence of possible disinfectant transfer on
Staphylococcus aureus plate counts after agar
contact samplingApplied and Environmental
Microbiology 32(1) 80-84
12 Vanderzant C amp Splitstoesser D F (1992)
Compendium of methods for the
microbiological examination of foods (3rd ed)
American Public Health
Association Washington DC
13 Kastango E S amp Douglass K (2001)
Quality Assurance for Sterile Products International journal of
pharmaceutical compounding 5(4) 246
14 Eissa ME Seif M Fares M (2015)
Assessment of purified water quality in
pharmaceutical facility using six sigma tools
International Journal of Pharmaceutical Quality
Assurance 6(2) 54-72
15 United States Pharmacopeia (USP 38NF 33)
(2015) USP lt61gt Microbiological
Examination of Non-Sterile Products Microbial
Enumeration Tests Baltimore MD USA United States Pharmacopeia 38National
Formulary 33
16 Motulsky H J amp Brown R E (2006)
Detecting outliers when fitting data with
nonlinear regressionndasha new method based on
robust nonlinear regression and the false
discovery rate BMC bioinformatics 7(1)
123httpwwwgraphpadcomguidesprism5u
Mostafa EE et al Haya Saudi J Life Sci Vol-1 Iss-1(Jan-Mar 2016)1-17
Available Online httpscholarsmepubcomhaya 17
serguideprism5helphtmlreg_correlationchoic
eshtm
17 Graphpadcom (2016) GraphPad Statistics
Guide Retrieved 25 January 2016 from
httpwwwgraphpadcomguidesprism6statis
ticsindexhtmstat_interpreting_results_correlatihtm
18 Tennant G (2001) Six Sigma SPC and TQM
in manufacturing and services Gower
Publishing Ltd
19 Cholayudth P (2006) Establishing Alert
Limits for Microbial Counts in Purified
Water Journal of Validation
Technology 13(1) 44
20 Supportminitabcom (2016) What is an
empirical CDF plot - Minitab Retrieved 25
January 2016 from
httpsupportminitabcomen-usminitab17topic-librarybasic-statistics-and-
graphsgraphsgraphs-of-
distributionsempirical-cdf-plotsempirical-cdf-
plot
21 Supportminitabcom (2016) Specification
limits in capability analysis - Minitab
Retrieved 25 January 2016 from
httpsupportminitabcomen-
usminitab17topic-libraryquality-
toolscapability-analysesdata-and-data
assumptionsspecification-limits 22 Supportminitabcom (2016) Pareto chart
basics - Minitab Retrieved 25 January 2016
from httpsupportminitabcomen-
usminitab17topic-libraryquality-
toolsquality-toolspareto-chart-basics
23 Sutton S (2011) Contamination Control in the
Compliance Program Journal of GXP
Compliance 15(4) 58

Mostafa EE et al Haya Saudi J Life Sci Vol-1 Iss-1(Jan-Mar 2016)1-17
Available Online httpscholarsmepubcomhaya 2
time frame outline for inspecting A plausible choice is
for surface examining to occur in the meantime as air
inspecting The contact plate system is suggested when
quantitative information are looked for from level non-
porous surfaces Contact plates are filled so that the
media shapes a vault The supplement medium utilized
as a part of the contact plate might likewise contain a
substances that neutralize antimicrobial chemicals The
surface of the media is squeezed against the surface
being inspected The subsequent inspected zones for a
50 mm diameter plates are roughly 25 cm2 The plates
are incubated for the required measure of time and the visualized microbial colonies if present are then
numbered [567]
The current study was designed to analyze
bioburden results of surfaces of class C manufacturing
facility using Shewhart control charts derived from
microbiological counts from contact plates The present
work aimed to use statistical process control and six
sigma tools to assess the quality identify the
distribution of microbial count locate regions of
defects demonstrate the trend of data and the correlation between the compartments
MATERIAL and METHODS
Surface samples using contact plates were
taken from pharmaceutical manufacturing plant using
methods and limits described by Eissa 2014 [8] The
total number of samples was 94 different surface
samples from class C All microbiological culture
media and chemicals were purchased from OXOID
(Basingstoke Hampshire) and Sigma-Alrich (St Louis
MO 63103) respectively All prepared cultures were
sterilized by high pressure saturated steam in autoclave (steam sterilizer) (FEDEGARI FOB3 Fedegari
Autoclavi SpA SS 235 km 8 27010 Albuzzano (PV)
Italy) Contact 55 mm sterile plastic plates were
obtaineded from Sterilin Limited (solaar house 19
mercers row Cambridge UK) Results of samples were
obtained from the microbiology laboratory in the
quality control department after incubation in Series BD
115 Incubators with natural convection (BINDER
GmbH Im Mittleren Oumlsch 5 78532 Tuttlingen
Germany) Sampling of surface bioburden and
personnel monitoring activities were done using contact plates (surface area of approximately 25 cm2) filled with
an appropriate recovery medium (supplemented with
Tween 80 and lecithin) [9-12] All statistical analysis
and six sigma tools along with their criteria were used
as detailed by Kastango and Douglass 2001 and Eissa
et al 2015 [1314] Culture media used in surface
monitoring were subjected to growth promotion tests
according to the methods and specifications by USP
lt61gt 2015 and passed the acceptance criteria [15]
Microbial enumeration was performed using digital
colony counter (Digital Colony Counter Model 361
Laxman Mahtre Rd Navagaon Dahisar West Mumbai) Illustrations of generated data and
calculations were performed using Microsoft Office
Excel 2007 Control charts cause enumeration diagram
(CausendashandndashEffect Diagram) and Pareto diagram were
constructed using Minitabreg v1710 GraphPad Prism
v601 for windows was used for statistical analysis at α
= 005
RESULTS and DISCUSSION
Microbial count from surface samples using
Replicate Organism Detection and Counting (RODAC)
system in class C production facility followed
distributions for discrete values as shown in Table 1 Trends of data during ten month period showed that the
bioburden distribution of most compartments followed
or approximate Poisson followed by geometric and
negative binomial distribution Table 2 demonstrated
statistical comparisons between untransformed and
log10 transformed results of each section in the area
With the exception of semisolid material airlock all
original data did not pass DAgostino amp Pearson
omnibus normality test while the transformation
normalized all data In addition skewness and kurtosis
values had been significantly improved to approach a
Gaussian distribution Moreover the process of transformation significantly reduced numbers of outliers
from 38 to two and from 25 to zero values only when
using Robust regression and Outlier removal (ROUT)
analysis at less strict (Q = 1000 ) and moderately
strict (Q = 100 (recommended by the program))
threshold for defining excursions [16] On the other
hand a graphical summary of the distribution of the
samples illustrating the samples central tendencies and
variability were demonstrated in Figure 1 for both
normalized and raw data The default interval plot
displays a mean symbol with a 95 confidence interval (CI) bar Interval plots are especially useful for
comparing groups It should be noted that data scatter
around the mean were minimum for logarithmically
transformed in comparison with original untransformed
counterparts [17]
The overall cleaning efficiency of the class C
production area met and exceeded the 6 Sigma (σ) level
with defects much less than 34 part per million (PPM)
[18] as illustrated in Figure 2 The results as such
revealed that the net microbiological cleanliness of the
area was apparently ideal and achieved the target level of the microbial quality The upper control limit (UCL)
of 10 CFU25 cm2 may be used as a general alarming
alert threshold for bioburden trend of the surfaces from
the control chart Similar concept but in a different way
was demonstrated by other researchers [19] There were
no signs of out-of-control states observed on the control
charts On the same line the time-series-plot of the each
partition in the manufacturing facility showed the
microbial trend in Figure 3 Trending of the results as
such could reveal little information about the microbial
quality of surfaces in each zone An empirical cumulative distribution function (CDF) plot was used to
show the fitness of the normal distribution to data
Mostafa EE et al Haya Saudi J Life Sci Vol-1 Iss-1(Jan-Mar 2016)1-17
Available Online httpscholarsmepubcomhaya 3
estimate percentiles and compare different sample
distributions [20] as illustrated in Figure 4
Interestingly different locations showed wide
variation in the bioburden control The descending
order of microbiological surface cleanliness control was
in the following order Suppositories Room = Liquid
Preparation Compartment (UCL = 11 CFU) gt Ointment
Preparation area (UCL = 16 CFU) gt Ointment Filling
Division (UCL = 17 CFU) gt Liquid Filling Room (UCL
= 20 CFU) gt Liquid Preparation Material Airlock =
Main Corridor (UCL = 21 CFU) gt Personnel Airlock (UCL = 25 CFU) gt Liquid Preparation Personnel
Airlock (UCL = 30 CFU) gt Semisolid Material Airlock
(UCL = 49 CFU) gt Liquid Filling Material Airlock
(UCL = 50 CFU) based on UCL The last four areas
showed that the sanitization processes were not able to
meet the standard requirement as the upper specification
limit (USL) was le UCL of the affected locations [21]
These findings were evident from Figures 5 to 15 The
quantitative risk of microbiological failures (defects) in
Figure 16 demonstrated the major contributors of the
failure risk ndash expressed as defects in PPM - based on the previously illustrated Process Capability SixPack
Reports using Pareto chart [22] Interestingly more than
80 of the total microbiological surface cleanliness
defects could be attributed to semisolid and liquid
filling material airlocks which are directly exposed to
the main corridor and this finding requires further
investigations
The relation between surface microbial counts
in different locations in class C are expressed in Table 4
by Pearson correlation matrix The magnitude of the
association between the bioburden of different compartments were mostly of low values but significant
correlation existed between the main corridor and the
surrounding area which ranged from very weak to
moderate with notably that liquid preparation room and
airlocks - which are physically isolated and distant from
the main corridor and the other manufacturing sites -
did not demonstrate any significant correlation In
addition there was no appreciable relation between
surface bioburden and aerially distributed microbes of
the same compartments collected in other studies during
the same periods [17] Fishbone diagram showing the degree of cross contamination between the main
corridor and the surrounding compartments based on
the coefficient of determination (R2) is demonstrated in
Figure 17
Most importantly fishbone (characteristic)
diagram - in Figure 18 - was used to determine all
probable causes of microbiological excursions [23] The
association of single compartment with the whole
surrounding production area is demonstrated by the bar
chart in Figure 19 The descending order of relation
based on R2 was as the following main corridor ointment filling area ointment preparation room
suppositories room personnel airlock semisolid
material airlock liquid filling area liquid filling
material airlock liquid preparation personnel airlock
liquid preparation material airlock and liquid
preparation area
Finally the present study provided an evidence
that there is inadequate quality of microbiological
cleanliness of the surfaces with special attention should
be brought to the airlocks while the microbial counts of
contact plates were apparently met the specifications in
most of the parts of the control charts This finding
could be attributed to insufficient nor appropriate sanitization frequency andor procedure - provided that
disinfectant used was validated - if compared with the
type andor frequency of the activities performed by
personnel The magnitude of out-of-control conditions
would be aggravated by non-compliance to good
manufacturing practice (GMP) rules
Mostafa EE et al Haya Saudi J Life Sci Vol-1 Iss-1(Jan-Mar 2016)1-17
Available Online httpscholarsmepubcomhaya 4
Table 1 Goodness-of-fit for data of microbiological surface cleanliness in clean area of class C
Area Distri-bution Test
Distribution
Poisson Binomial or Neg Binomial D Uniform Geometric Logarithmic
Statistic Rank Statistic Rank Statistic Rank Statistic Rank Statistic Rank
Ointment
Preparation
Kolmogorov
Smirnov 019 1 034 2 035 3 042 4 NA NA
Anderson
Darling 244 1 472 2 1852 4 700 3 NA NA
Ointment
Filling
Kolmogorov
Smirnov 024 2 030 3 023 1 035 4 NA NA
Anderson
Darling 226 1 377 2 1203 4 670 3 NA NA
Personnel
Airlock
Kolmogorov
Smirnov 022 1 034 4 025 2 031 3 NA NA
Anderson
Darling 500 3 457 2 2024 4 336 1 NA NA
Suppositori- es
Room
Kolmogorov
Smirnov 022 1 038 3 031 2 038 4 NA NA
Anderson
Darling 246 1 783 3 1387 4 635 2 NA NA
Semisolid
Corridor
Kolmogorov
Smirnov 019 1 024 2 025 3 034 4 NA NA
Anderson
Darling 253 2 215 1 1093 4 514 3 NA NA
Liquid
Filling
Kolmogorov
Smirnov 016 1 039 4 023 2 037 3 NA NA
Anderson
Darling 208 1 813 3 1517 4 631 2 NA NA
Liquid
Preparation
Kolmogorov
Smirnov 030 2 031 3 020 1 044 4 NA NA
Anderson
Darling 318 1 387 2 1480 4 947 3 NA NA
Liquid
Filling Mat Airlock
Kolmogorov
Smirnov 023 3 021 2 015 1 025 4 NA NA
Anderson
Darling 737 3 247 1 1501 4 346 2 NA NA
Liquid Prep Personnel Airlock
Kolmogorov
Smirnov 026 2 NA NA 029 3 022 1 NA NA
Anderson
Darling 934 2 NA NA 1604 3 179 1 NA NA
Liquid Prep
Material
Airlock
Kolmogorov
Smirnov 021 1 NA NA 029 3 024 2 NA NA
Anderson
Darling 590 2 NA NA 1444 3 242 1 NA NA
Semisolid
Mat
Airlock
Kolmogorov
Smirnov 024 3 018 2 012 1 024 4 038 5
Anderson
Darling 884 4 192 1 783 3 415 2 1050 5
= Followed Binomial distribution while all non-marked data followed negative binomial distribution
Mostafa EE et al Haya Saudi J Life Sci Vol-1 Iss-1(Jan-Mar 2016)1-17
Available Online httpscholarsmepubcomhaya 5
Table 2 Descriptive statistics confidence intervals and Gaussian distribution tests of the original untransformed and transformed data of the microbial counts on contact
plates for each sector in the class C manufacturing facility
Column Statistics
Oin
tmen
t P
rep
arat
ion
Oin
tmen
t F
illi
ng
Per
son
nel
Air
lock
sup
po
sito
ries
roo
m
Sem
iso
lid
Co
rrid
or
Liq
uid
Fil
ling
Liq
uid
Pre
p
Per
son
nel
Air
lock
Liq
uid
Pre
par
atio
n
Liq
uid
Pre
p
Mat
eria
l A
irlo
ck
Sem
iso
lid
Mat
A
irlo
ck
Liq
uid
Fil
ling
Mat
A
irlo
ck
Oin
tmen
t P
rep
arat
ion
(T
)
Oin
tmen
t F
illi
ng
(T
)
Per
son
nel
Air
lock
(T
)
Su
pp
osi
tori
es R
oo
m (
T)
Sem
iso
lid
Co
rrid
or
(T)
Liq
uid
Fil
ling
(T
)
Liq
uid
Pre
p
Per
son
nel
Air
lock
(T)
Liq
uid
Pre
par
atio
n (
T)
Liq
uid
Pre
p
Mat
eria
l A
irlo
ck
(T)
Sem
iso
lid
Mat
A
irlo
ck (
T)
Liq
uid
Fil
ling
Mat
A
irlo
ck (
T)
Minimum 00 00 00 00 00 00 00 00 00 00 10 00 00 00 012 00 012 00 010 00 00 030
25 Percentile 10 10 10 10 20 20 05 20 05 30 40 03 03 03 02 05 04 02 04 02 06 07
Median 20 20 20 20 30 30 20 20 20 60 80 048 048 048 043 054 060 048 051 048 085 095
75 Percentile 35 30 40 35 60 45 50 40 35 11 13 06 06 07 07 08 07 08 07 07 11 12
Maximum 12 90 16 10 15 11 17 70 18 17 17 11 10 12 11 12 11 13 092 13 13 13
10 Percentile 10 00 02 00 10 10 00 10 00 12 20 02 00 01 01 03 03 00 02 00 03 05
90 Percentile 68 58 10 48 80 70 10 50 80 15 17 087 080 10 075 095 090 10 079 095 12 13
Mean 29 27 34 24 41 35 35 27 31 68 87 049 046 053 047 061 059 049 052 047 080 091
Std Deviation 24 20 37 20 31 26 43 16 40 46 52 024 025 031 024 025 023 038 020 035 031 028
Std Error of Mean 037 032 058 031 048 040 067 024 063 071 081 004 004 005 004 004 004 006 003 006 005 004
Lower 95 CI of
mean 22 20 22 17 31 26 21 22 18 54 71 042 038 043 039 053 052 037 045 036 070 082
Upper 95 CI of
mean 36 33 46 30 50 43 48 32 44 83 10 057 054 062 054 069 067 061 058 058 090 10
Lower 95 CI of
median 20 20 10 10 20 20 10 20 10 40 60 040 040 030 030 048 048 030 044 030 070 085
Upper 95 CI of
median 30 30 30 30 50 40 30 30 30 80 12 054 054 060 064 074 070 060 060 060 095 11
DAgostino amp Pearson omnibus normality test
K2 27 14 25 22 18 15 24 63 34 33 83 16 039 12 23 020 087 20 026 094 51 33
P value lt 00001 00011 lt 00001 lt 00001 00001 00004 lt 00001 00423 lt 00001 01940 00161 04488 08210 05497 03115 09064 06476 03683 08791 06253 00791 01908
Passed normality
test (alpha=005) No No No No No No No No No Yes No Yes Yes Yes Yes Yes Yes Yes Yes Yes Yes Yes
P value summary ns ns ns ns ns ns ns ns ns ns ns ns
P value summary ns ns ns ns ns ns ns ns ns
Coefficient of
variation 8146 7598 10975 8388 7595 7448 12471 5737 12916 6701 5948 4873 5478 5898 5149 4097 3820 7693 3778 7533 3884 3057
Skewness 19 12 19 15 15 14 19 090 23 05 03 05 -02 04 02 02 03 03 -01 03 -08 -06
Kurtosis 46 21 34 41 27 18 33 057 59 -07 -12 -00 -01 -01 -08 -01 -03 -07 -04 -03 04 -06
Sum 119 109 139 97 167 142 142 111 128 280 356 20 19 22 19 25 24 20 21 19 33 37
Mostafa EE et al Haya Saudi J Life Sci Vol-1 Iss-1(Jan-Mar 2016)1-17
Available Online httpscholarsmepubcomhaya 6
Table 3 Robust regression and Outlier removal (ROUT) method showing the difference between both
raw and transformed data
RO
UT
Oin
tmen
t P
rep
arat
ion
Oin
tmen
t F
illi
ng
Per
son
nel
Air
lock
sup
po
sito
ries
ro
om
Sem
iso
lid
Co
rrid
or
Liq
uid
Fil
lin
g
Liq
uid
Pre
p
Per
son
nel
Air
lock
Liq
uid
Pre
par
atio
n
Liq
uid
Pre
p
Mat
eria
l
Air
lock
Sem
iso
lid
Mat
Air
lock
Liq
uid
Fil
lin
g M
at
Air
lock
Oin
tmen
t P
rep
arat
ion
Oin
tmen
t F
illi
ng
Per
son
nel
Air
lock
sup
po
sito
ries
ro
om
Sem
iso
lid
Co
rrid
or
Liq
uid
Fil
lin
g
Liq
uid
Pre
p
Per
son
nel
Air
lock
Liq
uid
Pre
par
atio
n
Liq
uid
Pre
p
Mat
eria
l
Air
lock
Sem
iso
lid
Mat
Air
lock
Liq
uid
Fil
lin
g M
at
Air
lock
Raw untransformed data Transformed microbial count to log10 (CFU+1)
An
aly
zed
41 41 41 41 41 41 41 41 41 41 41 41 41 41 41 41 41 41 41 41 41 41
Ou
tlie
rs (
Q =
10
00
)
8 2 5 1 2 5 8 1 6 0 0 0 0 0 0 0 0 0 0 0 2 0
Ou
tlie
rs (
Q =
10
00
)
5 2 5 0 1 3 6 0 3 0 0 0 0 0 0 0 0 0 0 0 0 0
Sa
mp
le
d P
ar
titio
n
- 5 0 5 1 0 1 5 2 0
o in t m e n t p r e p a r a t io n
o in t m e n t f i l l in g
p e r so n n e l a ir lo c k
sup p o s i t o r ie s r o o m
se m iso ild c o r r ido r
l iqu id f i l l in g
l iqu id p r e p p e r so n n e l a ir lo c k
liqu id p r e p a r a t io n
l iqu id p r e p m a t e r ia l a ir lo c k
se m iso l id m a t a ir lo c k
liqu id f i l l in g m a t a ir lo c k
o in t m e n t p r e p a r a t io n ( T )
o in t m e n t f i l l in g ( T )
p e r so n n e l a ir lo c k ( T )
sup p o s i t o r ie s r o o m ( T )
se m iso l id c o r r ido r ( T )
l iqu id f i l l in g ( T )
l iqu id p r e p p e r so n n e l a ir lo c k ( T )
l iqu id p r e p a r a t io n ( T )
l iqu id p r e p m a t e r ia l a ir lo c k ( T )
se m iso l id m a t a ir lo c k ( T )
l iqu id f i l l in g m a t a ir lo c k ( T )
B io b u r d e n 2 5 c m2
Fig-1 Interval plot showing the means and the confidence intervals (CI) for the raw and transformed
surface bioburden in each zone of class C manufacturing facility
Mostafa EE et al Haya Saudi J Life Sci Vol-1 Iss-1(Jan-Mar 2016)1-17
Available Online httpscholarsmepubcomhaya 7
Fig-2 Assessment of the process stability and capability for the overall averaged and transformed contact
plates microbiological counts in addition to the normality of data when it is assumed to follow normal
distribution
Fig-3 Chronologically plotted transformed microbiological surface bioburden count per 25 cm
2
approximately in different manufacturing partitions of class C
Mostafa EE et al Haya Saudi J Life Sci Vol-1 Iss-1(Jan-Mar 2016)1-17
Available Online httpscholarsmepubcomhaya 8
Fig-4 Cumulative distribution function (CDF) of the 11 partitions of the pharmaceutical manufacturing
area showing the relative abundance distribution and pattern of microbial surface bioburden based on
replicate organism detection and counting (RODAC) samples
Fig-5 Assessment of the process stability and capability for the averaged and transformed contact plates
microbiological counts of ointment preparation area in addition to the normality of data when it is
assumed to follow normal distribution
Mostafa EE et al Haya Saudi J Life Sci Vol-1 Iss-1(Jan-Mar 2016)1-17
Available Online httpscholarsmepubcomhaya 9
Fig-6 Assessment of the process stability and capability for the averaged and transformed contact plates
microbiological counts of ointment filling room in addition to the normality of data when it is assumed to
follow normal distribution
Fig-7 Assessment of the process stability and capability for the averaged and transformed contact plates
microbiological counts of personnel airlock in addition to the normality of data when it is assumed to
follow normal distribution
Mostafa EE et al Haya Saudi J Life Sci Vol-1 Iss-1(Jan-Mar 2016)1-17
Available Online httpscholarsmepubcomhaya 10
Fig-8 Assessment of the process stability and capability for the averaged and transformed contact plates
microbiological counts of suppositories room in addition to the normality of data when it is assumed to
follow normal distribution
Fig-9 Assessment of the process stability and capability for the averaged and transformed contact plates
microbiological counts of semisolid corridor in addition to the normality of data when it is assumed to
follow normal distribution
Mostafa EE et al Haya Saudi J Life Sci Vol-1 Iss-1(Jan-Mar 2016)1-17
Available Online httpscholarsmepubcomhaya 11
Fig-10 Assessment of the process stability and capability for the averaged and transformed contact plates
microbiological counts of liquid filling compartment in addition to the normality of data when it is
assumed to follow normal distribution
Fig-11 Assessment of the process stability and capability for the averaged and transformed contact plates
microbiological counts of liquid preparation personnel airlock in addition to the normality of data when it
is assumed to follow normal distribution
Mostafa EE et al Haya Saudi J Life Sci Vol-1 Iss-1(Jan-Mar 2016)1-17
Available Online httpscholarsmepubcomhaya 12
Fig-12 Assessment of the process stability and capability for the averaged and transformed contact plates
microbiological counts of liquid preparation partition in addition to the normality of data when it is
assumed to follow normal distribution
Fig-13 Assessment of the process stability and capability for the averaged and transformed contact plates
microbiological counts of liquid preparation material airlock in addition to the normality of data when it
is assumed to follow normal distribution
Mostafa EE et al Haya Saudi J Life Sci Vol-1 Iss-1(Jan-Mar 2016)1-17
Available Online httpscholarsmepubcomhaya 13
Fig-14 Assessment of the process stability and capability for the averaged and transformed contact plates
microbiological counts of semisolid material airlock in addition to the normality of data when it is
assumed to follow normal distribution
Fig-15 Assessment of the process stability and capability for the averaged and transformed contact plates
microbiological counts of liquid filling material airlock in addition to the normality of data when it is
assumed to follow normal distribution
Mostafa EE et al Haya Saudi J Life Sci Vol-1 Iss-1(Jan-Mar 2016)1-17
Available Online httpscholarsmepubcomhaya 14
Fig-16 Pareto chart of the manufacturing zones in class C pharmaceutical plant displaying defects of
microbiological surface quality in decreasing magnitude of frequency in order to determine the area of
priority for improvements
LFMA = Liquid Filling Material Airlock SMAL = Semisolid Material Airlock LPPA = Liquid Preparation
Personnel Airlock LPMA = Liquid Preparation Material Airlock PRAL = Personnel Airlock SSCR =
Semisolid Corridor LQFL = Liquid Filling area OFLL = Ointment Filling room OPRP = Ointment Preparation
room SPRM = Suppositories Room and LQPR = Liquid Preparation Room
Table 4 Pearson correlation matrix with Two-tailed P at 95 CI and α = 005 for microbiological surface
cleanliness of Class C productions partitions
Pearson Correlation Matrix
Co
rrid
or
Oin
tmen
t
Pre
par
atio
n
Oin
tmen
t
Fil
lin
g
Per
son
nel
Air
lock
Su
pp
osi
tori
e
s R
oom
Liq
uid
Fil
lin
g
Liq
uid
Pre
p
Per
son
nel
Liq
uid
Pre
par
atio
n
Liq
uid
Pre
p
Mat
eria
l
Air
lock
Sem
isoli
d
Mat
Air
lock
Liq
uid
Fil
lin
g M
at
Air
lock
Corridor
033 039 043
yen
059
yen 022 013 001 -004 018 031
Ointment Preparation 033
056
yen 033 021 021 -001 013 019 017 001
Ointment Filling 039 056
yen 022 039 026 003 -006 010 030 012
Personnel Airlock 043
yen 033 022
038 005 009 012 -005 003 029
Suppositories Room 059
yen 021 039 038
031 006 -002 -008 017 024
Liquid Filling 022 021 026 005 031
015 015 -010 013 -011
Liquid Prep
Personnel 013 -001 003 009 006 015
018 -016 -025 -003
Liquid Preparation 001 013 -006 012 -002 015 018
-007 012 -015
Liquid Prep Material
Airlock -004 019 010 -005 -008 -010 -016 -007
024 003
Semisolid Mat
Airlock 018 017 030 003 017 013 -025 012 024
019
Liquid Filling Mat Airlock
031 001 012 029 024 -011 -003 -015 003 019
= Significant correlation yen = Moderate correlation while all the other showed either weak or very weak
association
Mostafa EE et al Haya Saudi J Life Sci Vol-1 Iss-1(Jan-Mar 2016)1-17
Available Online httpscholarsmepubcomhaya 15
Fig- 17 Ishikawa Diagram showing the degree of the relation between surface bioburden of the main
corridor and the other manufacturing partitions using coefficient of determination (R2)
SM = Semisolid Material Airlock LP = Liquid Preparation room LF = Liquid Filling area PA = Personnel
Airlock OP = Ointment Preparation room LFM = Liquid Filling Material Airlock LPM = Liquid Preparation
Material Airlock LPP = Liquid Preparation Personnel Airlock SR = Suppositories Room and OF = Ointment
Filling Area
Fig-18 Ishikawa Diagram showing all the possible causes of microbiological out-of-control states
Fig-19 Total coefficient of determination (R
2) of each manufacturing location in class C
Surfaces
Partitions
with Other
of Corridor
Contamination
Cross
LFM
SM
LPM
LP
LPP
LF
SR
PA
OF
OP
0110175
00957205 0150033
0185972
0350669
00494594
00165297
5824296e-00
000157264
00315363
Cause-and-Effect Diagram
000
010
020
030
040
050
060
070
080
090
100
Corridor Ointment
Preparation
Ointment
Filling
Personnel
Airlock
Suppositories
Room
Liquid Filling Liquid Prep
Personnel
Liquid
Preparation
Liquid
PrepMaterial
Airlock
Semisolid
Mat Airlock
Liquid Filling
Mat Airlock
Mostafa EE et al Haya Saudi J Life Sci Vol-1 Iss-1(Jan-Mar 2016)1-17
Available Online httpscholarsmepubcomhaya 16
CONCLUSION
Airlocks - especially for material transfer -
are locations of high risk of failure in
microbiological quality for pharmaceutical facility
A balance between sanitization practice and the
activity encountered in specific production area should be established An optimization between the
two events could be determined using statistical
process control as demonstrated in the current study
In addition the use of control charts could take the
routine microbiological environmental monitoring
beyond just pass or fail to meet acceptance criteria
Six Sigma tools provide insight of the state of
control identifying defective spots and assisting in
the investigation of any excursion in
microbiological results At the same time the
applied methodology is simple not expensive yet
effective in supporting quality control (QC)quality assurance (QA) tasks with the promising ability to
apply quantitative risk analysis for production area
that could impact the final microbiological quality
of pharmaceutical products and bioburden of the
medicinal drugs
ACKNOWLEDGEMENT
This work was supported partially
financially by HIKMA Pharma pharmaceutical
company ndash 2nd Industrial zone - 6th of October city
Reference and writing style review was performed by Dr Engy Refaat Rashed Data gathering and
collection was performed by the microbiology
laboratory team of the quality control department
REFERENCES
1 Owusu S A (2007) Modern Trends in
Tropical Pharmaceutical Industry
Design (Master dissertation Department of
Architecture Kwame Nkrumah University of
Science and Technology) Available from
httpirknustedughbitstream1234567894311PHARMACEUTICAL20INDUSTRY20
DESIGNpdf
2 Denyer S P amp Baird R M (2nd ed)
(1990) Guide to microbiological control in
pharmaceuticals Ellis horwood
3 Clontz L (2nd ed) (2008) Microbial Limit
and Bioburden Tests Validation approaches
and global requirements CRC Press
4 US Food and Drug Administration (2004)
Guidance for Industry Sterile Drug Products
Produced by Aseptic ProcessingmdashCurrent
Good Manufacturing Practice FDA Center for Drug Evaluation and Research (CDER) Center
for Biologics Evaluation and Research (CBER)
and Office of Regulatory Affairs (ORA)
Washington DC
httpwwwfdagovdownloadsDrugsGuida
ncesucm070342pdf
5 United States Pharmacopeia (2008) USP
lt797gt Guidebook to Pharmaceutical
Compounding-Sterile Preparations In Ann
Arbor United States Pharmacopeial
Convention
6 Workshop Report Summary NIST Technical
Note 1737 (2016) Challenges in Microbial
Sampling in the Indoor Environment Retrieved 25 January 2016 from
httpwwwnistgovmmlbbdbiomolecularupl
oadSloan-Roport-Final-TN-1737pdf
7 Dixon A M (Ed) (2006) Environmental
monitoring for cleanrooms and controlled
environments CRC Press
8 Eissa M E (2014) Studies Of Microbial
Resistance Against Some Disinfectants
Microbial Distribution amp Biocidal Resistance in
Pharmaceutical Manufacturing Facility
Saarbruumlcken Lambert Academic Publishing
9 Quisno R Gibby I W amp Foter M J (1946) A neutralizing medium for evaluating the
germicidal potency of the quaternary
ammonium saltsAmerican journal of pharmacy
and the sciences supporting public
health118(9) 320
10 Erlandson A L amp Lawrence C A (1953)
Inactivating medium for hexachlorophene (G-
11) types of compounds and some substituted
phenolic disinfectants Science 118(3062)
274-276
11 Brummer B A R B A R A (1976) Influence of possible disinfectant transfer on
Staphylococcus aureus plate counts after agar
contact samplingApplied and Environmental
Microbiology 32(1) 80-84
12 Vanderzant C amp Splitstoesser D F (1992)
Compendium of methods for the
microbiological examination of foods (3rd ed)
American Public Health
Association Washington DC
13 Kastango E S amp Douglass K (2001)
Quality Assurance for Sterile Products International journal of
pharmaceutical compounding 5(4) 246
14 Eissa ME Seif M Fares M (2015)
Assessment of purified water quality in
pharmaceutical facility using six sigma tools
International Journal of Pharmaceutical Quality
Assurance 6(2) 54-72
15 United States Pharmacopeia (USP 38NF 33)
(2015) USP lt61gt Microbiological
Examination of Non-Sterile Products Microbial
Enumeration Tests Baltimore MD USA United States Pharmacopeia 38National
Formulary 33
16 Motulsky H J amp Brown R E (2006)
Detecting outliers when fitting data with
nonlinear regressionndasha new method based on
robust nonlinear regression and the false
discovery rate BMC bioinformatics 7(1)
123httpwwwgraphpadcomguidesprism5u
Mostafa EE et al Haya Saudi J Life Sci Vol-1 Iss-1(Jan-Mar 2016)1-17
Available Online httpscholarsmepubcomhaya 17
serguideprism5helphtmlreg_correlationchoic
eshtm
17 Graphpadcom (2016) GraphPad Statistics
Guide Retrieved 25 January 2016 from
httpwwwgraphpadcomguidesprism6statis
ticsindexhtmstat_interpreting_results_correlatihtm
18 Tennant G (2001) Six Sigma SPC and TQM
in manufacturing and services Gower
Publishing Ltd
19 Cholayudth P (2006) Establishing Alert
Limits for Microbial Counts in Purified
Water Journal of Validation
Technology 13(1) 44
20 Supportminitabcom (2016) What is an
empirical CDF plot - Minitab Retrieved 25
January 2016 from
httpsupportminitabcomen-usminitab17topic-librarybasic-statistics-and-
graphsgraphsgraphs-of-
distributionsempirical-cdf-plotsempirical-cdf-
plot
21 Supportminitabcom (2016) Specification
limits in capability analysis - Minitab
Retrieved 25 January 2016 from
httpsupportminitabcomen-
usminitab17topic-libraryquality-
toolscapability-analysesdata-and-data
assumptionsspecification-limits 22 Supportminitabcom (2016) Pareto chart
basics - Minitab Retrieved 25 January 2016
from httpsupportminitabcomen-
usminitab17topic-libraryquality-
toolsquality-toolspareto-chart-basics
23 Sutton S (2011) Contamination Control in the
Compliance Program Journal of GXP
Compliance 15(4) 58
Mostafa EE et al Haya Saudi J Life Sci Vol-1 Iss-1(Jan-Mar 2016)1-17
Available Online httpscholarsmepubcomhaya 3
estimate percentiles and compare different sample
distributions [20] as illustrated in Figure 4
Interestingly different locations showed wide
variation in the bioburden control The descending
order of microbiological surface cleanliness control was
in the following order Suppositories Room = Liquid
Preparation Compartment (UCL = 11 CFU) gt Ointment
Preparation area (UCL = 16 CFU) gt Ointment Filling
Division (UCL = 17 CFU) gt Liquid Filling Room (UCL
= 20 CFU) gt Liquid Preparation Material Airlock =
Main Corridor (UCL = 21 CFU) gt Personnel Airlock (UCL = 25 CFU) gt Liquid Preparation Personnel
Airlock (UCL = 30 CFU) gt Semisolid Material Airlock
(UCL = 49 CFU) gt Liquid Filling Material Airlock
(UCL = 50 CFU) based on UCL The last four areas
showed that the sanitization processes were not able to
meet the standard requirement as the upper specification
limit (USL) was le UCL of the affected locations [21]
These findings were evident from Figures 5 to 15 The
quantitative risk of microbiological failures (defects) in
Figure 16 demonstrated the major contributors of the
failure risk ndash expressed as defects in PPM - based on the previously illustrated Process Capability SixPack
Reports using Pareto chart [22] Interestingly more than
80 of the total microbiological surface cleanliness
defects could be attributed to semisolid and liquid
filling material airlocks which are directly exposed to
the main corridor and this finding requires further
investigations
The relation between surface microbial counts
in different locations in class C are expressed in Table 4
by Pearson correlation matrix The magnitude of the
association between the bioburden of different compartments were mostly of low values but significant
correlation existed between the main corridor and the
surrounding area which ranged from very weak to
moderate with notably that liquid preparation room and
airlocks - which are physically isolated and distant from
the main corridor and the other manufacturing sites -
did not demonstrate any significant correlation In
addition there was no appreciable relation between
surface bioburden and aerially distributed microbes of
the same compartments collected in other studies during
the same periods [17] Fishbone diagram showing the degree of cross contamination between the main
corridor and the surrounding compartments based on
the coefficient of determination (R2) is demonstrated in
Figure 17
Most importantly fishbone (characteristic)
diagram - in Figure 18 - was used to determine all
probable causes of microbiological excursions [23] The
association of single compartment with the whole
surrounding production area is demonstrated by the bar
chart in Figure 19 The descending order of relation
based on R2 was as the following main corridor ointment filling area ointment preparation room
suppositories room personnel airlock semisolid
material airlock liquid filling area liquid filling
material airlock liquid preparation personnel airlock
liquid preparation material airlock and liquid
preparation area
Finally the present study provided an evidence
that there is inadequate quality of microbiological
cleanliness of the surfaces with special attention should
be brought to the airlocks while the microbial counts of
contact plates were apparently met the specifications in
most of the parts of the control charts This finding
could be attributed to insufficient nor appropriate sanitization frequency andor procedure - provided that
disinfectant used was validated - if compared with the
type andor frequency of the activities performed by
personnel The magnitude of out-of-control conditions
would be aggravated by non-compliance to good
manufacturing practice (GMP) rules
Mostafa EE et al Haya Saudi J Life Sci Vol-1 Iss-1(Jan-Mar 2016)1-17
Available Online httpscholarsmepubcomhaya 4
Table 1 Goodness-of-fit for data of microbiological surface cleanliness in clean area of class C
Area Distri-bution Test
Distribution
Poisson Binomial or Neg Binomial D Uniform Geometric Logarithmic
Statistic Rank Statistic Rank Statistic Rank Statistic Rank Statistic Rank
Ointment
Preparation
Kolmogorov
Smirnov 019 1 034 2 035 3 042 4 NA NA
Anderson
Darling 244 1 472 2 1852 4 700 3 NA NA
Ointment
Filling
Kolmogorov
Smirnov 024 2 030 3 023 1 035 4 NA NA
Anderson
Darling 226 1 377 2 1203 4 670 3 NA NA
Personnel
Airlock
Kolmogorov
Smirnov 022 1 034 4 025 2 031 3 NA NA
Anderson
Darling 500 3 457 2 2024 4 336 1 NA NA
Suppositori- es
Room
Kolmogorov
Smirnov 022 1 038 3 031 2 038 4 NA NA
Anderson
Darling 246 1 783 3 1387 4 635 2 NA NA
Semisolid
Corridor
Kolmogorov
Smirnov 019 1 024 2 025 3 034 4 NA NA
Anderson
Darling 253 2 215 1 1093 4 514 3 NA NA
Liquid
Filling
Kolmogorov
Smirnov 016 1 039 4 023 2 037 3 NA NA
Anderson
Darling 208 1 813 3 1517 4 631 2 NA NA
Liquid
Preparation
Kolmogorov
Smirnov 030 2 031 3 020 1 044 4 NA NA
Anderson
Darling 318 1 387 2 1480 4 947 3 NA NA
Liquid
Filling Mat Airlock
Kolmogorov
Smirnov 023 3 021 2 015 1 025 4 NA NA
Anderson
Darling 737 3 247 1 1501 4 346 2 NA NA
Liquid Prep Personnel Airlock
Kolmogorov
Smirnov 026 2 NA NA 029 3 022 1 NA NA
Anderson
Darling 934 2 NA NA 1604 3 179 1 NA NA
Liquid Prep
Material
Airlock
Kolmogorov
Smirnov 021 1 NA NA 029 3 024 2 NA NA
Anderson
Darling 590 2 NA NA 1444 3 242 1 NA NA
Semisolid
Mat
Airlock
Kolmogorov
Smirnov 024 3 018 2 012 1 024 4 038 5
Anderson
Darling 884 4 192 1 783 3 415 2 1050 5
= Followed Binomial distribution while all non-marked data followed negative binomial distribution
Mostafa EE et al Haya Saudi J Life Sci Vol-1 Iss-1(Jan-Mar 2016)1-17
Available Online httpscholarsmepubcomhaya 5
Table 2 Descriptive statistics confidence intervals and Gaussian distribution tests of the original untransformed and transformed data of the microbial counts on contact
plates for each sector in the class C manufacturing facility
Column Statistics
Oin
tmen
t P
rep
arat
ion
Oin
tmen
t F
illi
ng
Per
son
nel
Air
lock
sup
po
sito
ries
roo
m
Sem
iso
lid
Co
rrid
or
Liq
uid
Fil
ling
Liq
uid
Pre
p
Per
son
nel
Air
lock
Liq
uid
Pre
par
atio
n
Liq
uid
Pre
p
Mat
eria
l A
irlo
ck
Sem
iso
lid
Mat
A
irlo
ck
Liq
uid
Fil
ling
Mat
A
irlo
ck
Oin
tmen
t P
rep
arat
ion
(T
)
Oin
tmen
t F
illi
ng
(T
)
Per
son
nel
Air
lock
(T
)
Su
pp
osi
tori
es R
oo
m (
T)
Sem
iso
lid
Co
rrid
or
(T)
Liq
uid
Fil
ling
(T
)
Liq
uid
Pre
p
Per
son
nel
Air
lock
(T)
Liq
uid
Pre
par
atio
n (
T)
Liq
uid
Pre
p
Mat
eria
l A
irlo
ck
(T)
Sem
iso
lid
Mat
A
irlo
ck (
T)
Liq
uid
Fil
ling
Mat
A
irlo
ck (
T)
Minimum 00 00 00 00 00 00 00 00 00 00 10 00 00 00 012 00 012 00 010 00 00 030
25 Percentile 10 10 10 10 20 20 05 20 05 30 40 03 03 03 02 05 04 02 04 02 06 07
Median 20 20 20 20 30 30 20 20 20 60 80 048 048 048 043 054 060 048 051 048 085 095
75 Percentile 35 30 40 35 60 45 50 40 35 11 13 06 06 07 07 08 07 08 07 07 11 12
Maximum 12 90 16 10 15 11 17 70 18 17 17 11 10 12 11 12 11 13 092 13 13 13
10 Percentile 10 00 02 00 10 10 00 10 00 12 20 02 00 01 01 03 03 00 02 00 03 05
90 Percentile 68 58 10 48 80 70 10 50 80 15 17 087 080 10 075 095 090 10 079 095 12 13
Mean 29 27 34 24 41 35 35 27 31 68 87 049 046 053 047 061 059 049 052 047 080 091
Std Deviation 24 20 37 20 31 26 43 16 40 46 52 024 025 031 024 025 023 038 020 035 031 028
Std Error of Mean 037 032 058 031 048 040 067 024 063 071 081 004 004 005 004 004 004 006 003 006 005 004
Lower 95 CI of
mean 22 20 22 17 31 26 21 22 18 54 71 042 038 043 039 053 052 037 045 036 070 082
Upper 95 CI of
mean 36 33 46 30 50 43 48 32 44 83 10 057 054 062 054 069 067 061 058 058 090 10
Lower 95 CI of
median 20 20 10 10 20 20 10 20 10 40 60 040 040 030 030 048 048 030 044 030 070 085
Upper 95 CI of
median 30 30 30 30 50 40 30 30 30 80 12 054 054 060 064 074 070 060 060 060 095 11
DAgostino amp Pearson omnibus normality test
K2 27 14 25 22 18 15 24 63 34 33 83 16 039 12 23 020 087 20 026 094 51 33
P value lt 00001 00011 lt 00001 lt 00001 00001 00004 lt 00001 00423 lt 00001 01940 00161 04488 08210 05497 03115 09064 06476 03683 08791 06253 00791 01908
Passed normality
test (alpha=005) No No No No No No No No No Yes No Yes Yes Yes Yes Yes Yes Yes Yes Yes Yes Yes
P value summary ns ns ns ns ns ns ns ns ns ns ns ns
P value summary ns ns ns ns ns ns ns ns ns
Coefficient of
variation 8146 7598 10975 8388 7595 7448 12471 5737 12916 6701 5948 4873 5478 5898 5149 4097 3820 7693 3778 7533 3884 3057
Skewness 19 12 19 15 15 14 19 090 23 05 03 05 -02 04 02 02 03 03 -01 03 -08 -06
Kurtosis 46 21 34 41 27 18 33 057 59 -07 -12 -00 -01 -01 -08 -01 -03 -07 -04 -03 04 -06
Sum 119 109 139 97 167 142 142 111 128 280 356 20 19 22 19 25 24 20 21 19 33 37
Mostafa EE et al Haya Saudi J Life Sci Vol-1 Iss-1(Jan-Mar 2016)1-17
Available Online httpscholarsmepubcomhaya 6
Table 3 Robust regression and Outlier removal (ROUT) method showing the difference between both
raw and transformed data
RO
UT
Oin
tmen
t P
rep
arat
ion
Oin
tmen
t F
illi
ng
Per
son
nel
Air
lock
sup
po
sito
ries
ro
om
Sem
iso
lid
Co
rrid
or
Liq
uid
Fil
lin
g
Liq
uid
Pre
p
Per
son
nel
Air
lock
Liq
uid
Pre
par
atio
n
Liq
uid
Pre
p
Mat
eria
l
Air
lock
Sem
iso
lid
Mat
Air
lock
Liq
uid
Fil
lin
g M
at
Air
lock
Oin
tmen
t P
rep
arat
ion
Oin
tmen
t F
illi
ng
Per
son
nel
Air
lock
sup
po
sito
ries
ro
om
Sem
iso
lid
Co
rrid
or
Liq
uid
Fil
lin
g
Liq
uid
Pre
p
Per
son
nel
Air
lock
Liq
uid
Pre
par
atio
n
Liq
uid
Pre
p
Mat
eria
l
Air
lock
Sem
iso
lid
Mat
Air
lock
Liq
uid
Fil
lin
g M
at
Air
lock
Raw untransformed data Transformed microbial count to log10 (CFU+1)
An
aly
zed
41 41 41 41 41 41 41 41 41 41 41 41 41 41 41 41 41 41 41 41 41 41
Ou
tlie
rs (
Q =
10
00
)
8 2 5 1 2 5 8 1 6 0 0 0 0 0 0 0 0 0 0 0 2 0
Ou
tlie
rs (
Q =
10
00
)
5 2 5 0 1 3 6 0 3 0 0 0 0 0 0 0 0 0 0 0 0 0
Sa
mp
le
d P
ar
titio
n
- 5 0 5 1 0 1 5 2 0
o in t m e n t p r e p a r a t io n
o in t m e n t f i l l in g
p e r so n n e l a ir lo c k
sup p o s i t o r ie s r o o m
se m iso ild c o r r ido r
l iqu id f i l l in g
l iqu id p r e p p e r so n n e l a ir lo c k
liqu id p r e p a r a t io n
l iqu id p r e p m a t e r ia l a ir lo c k
se m iso l id m a t a ir lo c k
liqu id f i l l in g m a t a ir lo c k
o in t m e n t p r e p a r a t io n ( T )
o in t m e n t f i l l in g ( T )
p e r so n n e l a ir lo c k ( T )
sup p o s i t o r ie s r o o m ( T )
se m iso l id c o r r ido r ( T )
l iqu id f i l l in g ( T )
l iqu id p r e p p e r so n n e l a ir lo c k ( T )
l iqu id p r e p a r a t io n ( T )
l iqu id p r e p m a t e r ia l a ir lo c k ( T )
se m iso l id m a t a ir lo c k ( T )
l iqu id f i l l in g m a t a ir lo c k ( T )
B io b u r d e n 2 5 c m2
Fig-1 Interval plot showing the means and the confidence intervals (CI) for the raw and transformed
surface bioburden in each zone of class C manufacturing facility
Mostafa EE et al Haya Saudi J Life Sci Vol-1 Iss-1(Jan-Mar 2016)1-17
Available Online httpscholarsmepubcomhaya 7
Fig-2 Assessment of the process stability and capability for the overall averaged and transformed contact
plates microbiological counts in addition to the normality of data when it is assumed to follow normal
distribution
Fig-3 Chronologically plotted transformed microbiological surface bioburden count per 25 cm
2
approximately in different manufacturing partitions of class C
Mostafa EE et al Haya Saudi J Life Sci Vol-1 Iss-1(Jan-Mar 2016)1-17
Available Online httpscholarsmepubcomhaya 8
Fig-4 Cumulative distribution function (CDF) of the 11 partitions of the pharmaceutical manufacturing
area showing the relative abundance distribution and pattern of microbial surface bioburden based on
replicate organism detection and counting (RODAC) samples
Fig-5 Assessment of the process stability and capability for the averaged and transformed contact plates
microbiological counts of ointment preparation area in addition to the normality of data when it is
assumed to follow normal distribution
Mostafa EE et al Haya Saudi J Life Sci Vol-1 Iss-1(Jan-Mar 2016)1-17
Available Online httpscholarsmepubcomhaya 9
Fig-6 Assessment of the process stability and capability for the averaged and transformed contact plates
microbiological counts of ointment filling room in addition to the normality of data when it is assumed to
follow normal distribution
Fig-7 Assessment of the process stability and capability for the averaged and transformed contact plates
microbiological counts of personnel airlock in addition to the normality of data when it is assumed to
follow normal distribution
Mostafa EE et al Haya Saudi J Life Sci Vol-1 Iss-1(Jan-Mar 2016)1-17
Available Online httpscholarsmepubcomhaya 10
Fig-8 Assessment of the process stability and capability for the averaged and transformed contact plates
microbiological counts of suppositories room in addition to the normality of data when it is assumed to
follow normal distribution
Fig-9 Assessment of the process stability and capability for the averaged and transformed contact plates
microbiological counts of semisolid corridor in addition to the normality of data when it is assumed to
follow normal distribution
Mostafa EE et al Haya Saudi J Life Sci Vol-1 Iss-1(Jan-Mar 2016)1-17
Available Online httpscholarsmepubcomhaya 11
Fig-10 Assessment of the process stability and capability for the averaged and transformed contact plates
microbiological counts of liquid filling compartment in addition to the normality of data when it is
assumed to follow normal distribution
Fig-11 Assessment of the process stability and capability for the averaged and transformed contact plates
microbiological counts of liquid preparation personnel airlock in addition to the normality of data when it
is assumed to follow normal distribution
Mostafa EE et al Haya Saudi J Life Sci Vol-1 Iss-1(Jan-Mar 2016)1-17
Available Online httpscholarsmepubcomhaya 12
Fig-12 Assessment of the process stability and capability for the averaged and transformed contact plates
microbiological counts of liquid preparation partition in addition to the normality of data when it is
assumed to follow normal distribution
Fig-13 Assessment of the process stability and capability for the averaged and transformed contact plates
microbiological counts of liquid preparation material airlock in addition to the normality of data when it
is assumed to follow normal distribution
Mostafa EE et al Haya Saudi J Life Sci Vol-1 Iss-1(Jan-Mar 2016)1-17
Available Online httpscholarsmepubcomhaya 13
Fig-14 Assessment of the process stability and capability for the averaged and transformed contact plates
microbiological counts of semisolid material airlock in addition to the normality of data when it is
assumed to follow normal distribution
Fig-15 Assessment of the process stability and capability for the averaged and transformed contact plates
microbiological counts of liquid filling material airlock in addition to the normality of data when it is
assumed to follow normal distribution
Mostafa EE et al Haya Saudi J Life Sci Vol-1 Iss-1(Jan-Mar 2016)1-17
Available Online httpscholarsmepubcomhaya 14
Fig-16 Pareto chart of the manufacturing zones in class C pharmaceutical plant displaying defects of
microbiological surface quality in decreasing magnitude of frequency in order to determine the area of
priority for improvements
LFMA = Liquid Filling Material Airlock SMAL = Semisolid Material Airlock LPPA = Liquid Preparation
Personnel Airlock LPMA = Liquid Preparation Material Airlock PRAL = Personnel Airlock SSCR =
Semisolid Corridor LQFL = Liquid Filling area OFLL = Ointment Filling room OPRP = Ointment Preparation
room SPRM = Suppositories Room and LQPR = Liquid Preparation Room
Table 4 Pearson correlation matrix with Two-tailed P at 95 CI and α = 005 for microbiological surface
cleanliness of Class C productions partitions
Pearson Correlation Matrix
Co
rrid
or
Oin
tmen
t
Pre
par
atio
n
Oin
tmen
t
Fil
lin
g
Per
son
nel
Air
lock
Su
pp
osi
tori
e
s R
oom
Liq
uid
Fil
lin
g
Liq
uid
Pre
p
Per
son
nel
Liq
uid
Pre
par
atio
n
Liq
uid
Pre
p
Mat
eria
l
Air
lock
Sem
isoli
d
Mat
Air
lock
Liq
uid
Fil
lin
g M
at
Air
lock
Corridor
033 039 043
yen
059
yen 022 013 001 -004 018 031
Ointment Preparation 033
056
yen 033 021 021 -001 013 019 017 001
Ointment Filling 039 056
yen 022 039 026 003 -006 010 030 012
Personnel Airlock 043
yen 033 022
038 005 009 012 -005 003 029
Suppositories Room 059
yen 021 039 038
031 006 -002 -008 017 024
Liquid Filling 022 021 026 005 031
015 015 -010 013 -011
Liquid Prep
Personnel 013 -001 003 009 006 015
018 -016 -025 -003
Liquid Preparation 001 013 -006 012 -002 015 018
-007 012 -015
Liquid Prep Material
Airlock -004 019 010 -005 -008 -010 -016 -007
024 003
Semisolid Mat
Airlock 018 017 030 003 017 013 -025 012 024
019
Liquid Filling Mat Airlock
031 001 012 029 024 -011 -003 -015 003 019
= Significant correlation yen = Moderate correlation while all the other showed either weak or very weak
association
Mostafa EE et al Haya Saudi J Life Sci Vol-1 Iss-1(Jan-Mar 2016)1-17
Available Online httpscholarsmepubcomhaya 15
Fig- 17 Ishikawa Diagram showing the degree of the relation between surface bioburden of the main
corridor and the other manufacturing partitions using coefficient of determination (R2)
SM = Semisolid Material Airlock LP = Liquid Preparation room LF = Liquid Filling area PA = Personnel
Airlock OP = Ointment Preparation room LFM = Liquid Filling Material Airlock LPM = Liquid Preparation
Material Airlock LPP = Liquid Preparation Personnel Airlock SR = Suppositories Room and OF = Ointment
Filling Area
Fig-18 Ishikawa Diagram showing all the possible causes of microbiological out-of-control states
Fig-19 Total coefficient of determination (R
2) of each manufacturing location in class C
Surfaces
Partitions
with Other
of Corridor
Contamination
Cross
LFM
SM
LPM
LP
LPP
LF
SR
PA
OF
OP
0110175
00957205 0150033
0185972
0350669
00494594
00165297
5824296e-00
000157264
00315363
Cause-and-Effect Diagram
000
010
020
030
040
050
060
070
080
090
100
Corridor Ointment
Preparation
Ointment
Filling
Personnel
Airlock
Suppositories
Room
Liquid Filling Liquid Prep
Personnel
Liquid
Preparation
Liquid
PrepMaterial
Airlock
Semisolid
Mat Airlock
Liquid Filling
Mat Airlock
Mostafa EE et al Haya Saudi J Life Sci Vol-1 Iss-1(Jan-Mar 2016)1-17
Available Online httpscholarsmepubcomhaya 16
CONCLUSION
Airlocks - especially for material transfer -
are locations of high risk of failure in
microbiological quality for pharmaceutical facility
A balance between sanitization practice and the
activity encountered in specific production area should be established An optimization between the
two events could be determined using statistical
process control as demonstrated in the current study
In addition the use of control charts could take the
routine microbiological environmental monitoring
beyond just pass or fail to meet acceptance criteria
Six Sigma tools provide insight of the state of
control identifying defective spots and assisting in
the investigation of any excursion in
microbiological results At the same time the
applied methodology is simple not expensive yet
effective in supporting quality control (QC)quality assurance (QA) tasks with the promising ability to
apply quantitative risk analysis for production area
that could impact the final microbiological quality
of pharmaceutical products and bioburden of the
medicinal drugs
ACKNOWLEDGEMENT
This work was supported partially
financially by HIKMA Pharma pharmaceutical
company ndash 2nd Industrial zone - 6th of October city
Reference and writing style review was performed by Dr Engy Refaat Rashed Data gathering and
collection was performed by the microbiology
laboratory team of the quality control department
REFERENCES
1 Owusu S A (2007) Modern Trends in
Tropical Pharmaceutical Industry
Design (Master dissertation Department of
Architecture Kwame Nkrumah University of
Science and Technology) Available from
httpirknustedughbitstream1234567894311PHARMACEUTICAL20INDUSTRY20
DESIGNpdf
2 Denyer S P amp Baird R M (2nd ed)
(1990) Guide to microbiological control in
pharmaceuticals Ellis horwood
3 Clontz L (2nd ed) (2008) Microbial Limit
and Bioburden Tests Validation approaches
and global requirements CRC Press
4 US Food and Drug Administration (2004)
Guidance for Industry Sterile Drug Products
Produced by Aseptic ProcessingmdashCurrent
Good Manufacturing Practice FDA Center for Drug Evaluation and Research (CDER) Center
for Biologics Evaluation and Research (CBER)
and Office of Regulatory Affairs (ORA)
Washington DC
httpwwwfdagovdownloadsDrugsGuida
ncesucm070342pdf
5 United States Pharmacopeia (2008) USP
lt797gt Guidebook to Pharmaceutical
Compounding-Sterile Preparations In Ann
Arbor United States Pharmacopeial
Convention
6 Workshop Report Summary NIST Technical
Note 1737 (2016) Challenges in Microbial
Sampling in the Indoor Environment Retrieved 25 January 2016 from
httpwwwnistgovmmlbbdbiomolecularupl
oadSloan-Roport-Final-TN-1737pdf
7 Dixon A M (Ed) (2006) Environmental
monitoring for cleanrooms and controlled
environments CRC Press
8 Eissa M E (2014) Studies Of Microbial
Resistance Against Some Disinfectants
Microbial Distribution amp Biocidal Resistance in
Pharmaceutical Manufacturing Facility
Saarbruumlcken Lambert Academic Publishing
9 Quisno R Gibby I W amp Foter M J (1946) A neutralizing medium for evaluating the
germicidal potency of the quaternary
ammonium saltsAmerican journal of pharmacy
and the sciences supporting public
health118(9) 320
10 Erlandson A L amp Lawrence C A (1953)
Inactivating medium for hexachlorophene (G-
11) types of compounds and some substituted
phenolic disinfectants Science 118(3062)
274-276
11 Brummer B A R B A R A (1976) Influence of possible disinfectant transfer on
Staphylococcus aureus plate counts after agar
contact samplingApplied and Environmental
Microbiology 32(1) 80-84
12 Vanderzant C amp Splitstoesser D F (1992)
Compendium of methods for the
microbiological examination of foods (3rd ed)
American Public Health
Association Washington DC
13 Kastango E S amp Douglass K (2001)
Quality Assurance for Sterile Products International journal of
pharmaceutical compounding 5(4) 246
14 Eissa ME Seif M Fares M (2015)
Assessment of purified water quality in
pharmaceutical facility using six sigma tools
International Journal of Pharmaceutical Quality
Assurance 6(2) 54-72
15 United States Pharmacopeia (USP 38NF 33)
(2015) USP lt61gt Microbiological
Examination of Non-Sterile Products Microbial
Enumeration Tests Baltimore MD USA United States Pharmacopeia 38National
Formulary 33
16 Motulsky H J amp Brown R E (2006)
Detecting outliers when fitting data with
nonlinear regressionndasha new method based on
robust nonlinear regression and the false
discovery rate BMC bioinformatics 7(1)
123httpwwwgraphpadcomguidesprism5u
Mostafa EE et al Haya Saudi J Life Sci Vol-1 Iss-1(Jan-Mar 2016)1-17
Available Online httpscholarsmepubcomhaya 17
serguideprism5helphtmlreg_correlationchoic
eshtm
17 Graphpadcom (2016) GraphPad Statistics
Guide Retrieved 25 January 2016 from
httpwwwgraphpadcomguidesprism6statis
ticsindexhtmstat_interpreting_results_correlatihtm
18 Tennant G (2001) Six Sigma SPC and TQM
in manufacturing and services Gower
Publishing Ltd
19 Cholayudth P (2006) Establishing Alert
Limits for Microbial Counts in Purified
Water Journal of Validation
Technology 13(1) 44
20 Supportminitabcom (2016) What is an
empirical CDF plot - Minitab Retrieved 25
January 2016 from
httpsupportminitabcomen-usminitab17topic-librarybasic-statistics-and-
graphsgraphsgraphs-of-
distributionsempirical-cdf-plotsempirical-cdf-
plot
21 Supportminitabcom (2016) Specification
limits in capability analysis - Minitab
Retrieved 25 January 2016 from
httpsupportminitabcomen-
usminitab17topic-libraryquality-
toolscapability-analysesdata-and-data
assumptionsspecification-limits 22 Supportminitabcom (2016) Pareto chart
basics - Minitab Retrieved 25 January 2016
from httpsupportminitabcomen-
usminitab17topic-libraryquality-
toolsquality-toolspareto-chart-basics
23 Sutton S (2011) Contamination Control in the
Compliance Program Journal of GXP
Compliance 15(4) 58

Mostafa EE et al Haya Saudi J Life Sci Vol-1 Iss-1(Jan-Mar 2016)1-17
Available Online httpscholarsmepubcomhaya 8
Fig-4 Cumulative distribution function (CDF) of the 11 partitions of the pharmaceutical manufacturing
area showing the relative abundance distribution and pattern of microbial surface bioburden based on
replicate organism detection and counting (RODAC) samples
Fig-5 Assessment of the process stability and capability for the averaged and transformed contact plates
microbiological counts of ointment preparation area in addition to the normality of data when it is
assumed to follow normal distribution
Mostafa EE et al Haya Saudi J Life Sci Vol-1 Iss-1(Jan-Mar 2016)1-17
Available Online httpscholarsmepubcomhaya 9
Fig-6 Assessment of the process stability and capability for the averaged and transformed contact plates
microbiological counts of ointment filling room in addition to the normality of data when it is assumed to
follow normal distribution
Fig-7 Assessment of the process stability and capability for the averaged and transformed contact plates
microbiological counts of personnel airlock in addition to the normality of data when it is assumed to
follow normal distribution
Mostafa EE et al Haya Saudi J Life Sci Vol-1 Iss-1(Jan-Mar 2016)1-17
Available Online httpscholarsmepubcomhaya 10
Fig-8 Assessment of the process stability and capability for the averaged and transformed contact plates
microbiological counts of suppositories room in addition to the normality of data when it is assumed to
follow normal distribution
Fig-9 Assessment of the process stability and capability for the averaged and transformed contact plates
microbiological counts of semisolid corridor in addition to the normality of data when it is assumed to
follow normal distribution
Mostafa EE et al Haya Saudi J Life Sci Vol-1 Iss-1(Jan-Mar 2016)1-17
Available Online httpscholarsmepubcomhaya 11
Fig-10 Assessment of the process stability and capability for the averaged and transformed contact plates
microbiological counts of liquid filling compartment in addition to the normality of data when it is
assumed to follow normal distribution
Fig-11 Assessment of the process stability and capability for the averaged and transformed contact plates
microbiological counts of liquid preparation personnel airlock in addition to the normality of data when it
is assumed to follow normal distribution
Mostafa EE et al Haya Saudi J Life Sci Vol-1 Iss-1(Jan-Mar 2016)1-17
Available Online httpscholarsmepubcomhaya 12
Fig-12 Assessment of the process stability and capability for the averaged and transformed contact plates
microbiological counts of liquid preparation partition in addition to the normality of data when it is
assumed to follow normal distribution
Fig-13 Assessment of the process stability and capability for the averaged and transformed contact plates
microbiological counts of liquid preparation material airlock in addition to the normality of data when it
is assumed to follow normal distribution
Mostafa EE et al Haya Saudi J Life Sci Vol-1 Iss-1(Jan-Mar 2016)1-17
Available Online httpscholarsmepubcomhaya 13
Fig-14 Assessment of the process stability and capability for the averaged and transformed contact plates
microbiological counts of semisolid material airlock in addition to the normality of data when it is
assumed to follow normal distribution
Fig-15 Assessment of the process stability and capability for the averaged and transformed contact plates
microbiological counts of liquid filling material airlock in addition to the normality of data when it is
assumed to follow normal distribution
Mostafa EE et al Haya Saudi J Life Sci Vol-1 Iss-1(Jan-Mar 2016)1-17
Available Online httpscholarsmepubcomhaya 14
Fig-16 Pareto chart of the manufacturing zones in class C pharmaceutical plant displaying defects of
microbiological surface quality in decreasing magnitude of frequency in order to determine the area of
priority for improvements
LFMA = Liquid Filling Material Airlock SMAL = Semisolid Material Airlock LPPA = Liquid Preparation
Personnel Airlock LPMA = Liquid Preparation Material Airlock PRAL = Personnel Airlock SSCR =
Semisolid Corridor LQFL = Liquid Filling area OFLL = Ointment Filling room OPRP = Ointment Preparation
room SPRM = Suppositories Room and LQPR = Liquid Preparation Room
Table 4 Pearson correlation matrix with Two-tailed P at 95 CI and α = 005 for microbiological surface
cleanliness of Class C productions partitions
Pearson Correlation Matrix
Co
rrid
or
Oin
tmen
t
Pre
par
atio
n
Oin
tmen
t
Fil
lin
g
Per
son
nel
Air
lock
Su
pp
osi
tori
e
s R
oom
Liq
uid
Fil
lin
g
Liq
uid
Pre
p
Per
son
nel
Liq
uid
Pre
par
atio
n
Liq
uid
Pre
p
Mat
eria
l
Air
lock
Sem
isoli
d
Mat
Air
lock
Liq
uid
Fil
lin
g M
at
Air
lock
Corridor
033 039 043
yen
059
yen 022 013 001 -004 018 031
Ointment Preparation 033
056
yen 033 021 021 -001 013 019 017 001
Ointment Filling 039 056
yen 022 039 026 003 -006 010 030 012
Personnel Airlock 043
yen 033 022
038 005 009 012 -005 003 029
Suppositories Room 059
yen 021 039 038
031 006 -002 -008 017 024
Liquid Filling 022 021 026 005 031
015 015 -010 013 -011
Liquid Prep
Personnel 013 -001 003 009 006 015
018 -016 -025 -003
Liquid Preparation 001 013 -006 012 -002 015 018
-007 012 -015
Liquid Prep Material
Airlock -004 019 010 -005 -008 -010 -016 -007
024 003
Semisolid Mat
Airlock 018 017 030 003 017 013 -025 012 024
019
Liquid Filling Mat Airlock
031 001 012 029 024 -011 -003 -015 003 019
= Significant correlation yen = Moderate correlation while all the other showed either weak or very weak
association
Mostafa EE et al Haya Saudi J Life Sci Vol-1 Iss-1(Jan-Mar 2016)1-17
Available Online httpscholarsmepubcomhaya 15
Fig- 17 Ishikawa Diagram showing the degree of the relation between surface bioburden of the main
corridor and the other manufacturing partitions using coefficient of determination (R2)
SM = Semisolid Material Airlock LP = Liquid Preparation room LF = Liquid Filling area PA = Personnel
Airlock OP = Ointment Preparation room LFM = Liquid Filling Material Airlock LPM = Liquid Preparation
Material Airlock LPP = Liquid Preparation Personnel Airlock SR = Suppositories Room and OF = Ointment
Filling Area
Fig-18 Ishikawa Diagram showing all the possible causes of microbiological out-of-control states
Fig-19 Total coefficient of determination (R
2) of each manufacturing location in class C
Surfaces
Partitions
with Other
of Corridor
Contamination
Cross
LFM
SM
LPM
LP
LPP
LF
SR
PA
OF
OP
0110175
00957205 0150033
0185972
0350669
00494594
00165297
5824296e-00
000157264
00315363
Cause-and-Effect Diagram
000
010
020
030
040
050
060
070
080
090
100
Corridor Ointment
Preparation
Ointment
Filling
Personnel
Airlock
Suppositories
Room
Liquid Filling Liquid Prep
Personnel
Liquid
Preparation
Liquid
PrepMaterial
Airlock
Semisolid
Mat Airlock
Liquid Filling
Mat Airlock
Mostafa EE et al Haya Saudi J Life Sci Vol-1 Iss-1(Jan-Mar 2016)1-17
Available Online httpscholarsmepubcomhaya 16
CONCLUSION
Airlocks - especially for material transfer -
are locations of high risk of failure in
microbiological quality for pharmaceutical facility
A balance between sanitization practice and the
activity encountered in specific production area should be established An optimization between the
two events could be determined using statistical
process control as demonstrated in the current study
In addition the use of control charts could take the
routine microbiological environmental monitoring
beyond just pass or fail to meet acceptance criteria
Six Sigma tools provide insight of the state of
control identifying defective spots and assisting in
the investigation of any excursion in
microbiological results At the same time the
applied methodology is simple not expensive yet
effective in supporting quality control (QC)quality assurance (QA) tasks with the promising ability to
apply quantitative risk analysis for production area
that could impact the final microbiological quality
of pharmaceutical products and bioburden of the
medicinal drugs
ACKNOWLEDGEMENT
This work was supported partially
financially by HIKMA Pharma pharmaceutical
company ndash 2nd Industrial zone - 6th of October city
Reference and writing style review was performed by Dr Engy Refaat Rashed Data gathering and
collection was performed by the microbiology
laboratory team of the quality control department
REFERENCES
1 Owusu S A (2007) Modern Trends in
Tropical Pharmaceutical Industry
Design (Master dissertation Department of
Architecture Kwame Nkrumah University of
Science and Technology) Available from
httpirknustedughbitstream1234567894311PHARMACEUTICAL20INDUSTRY20
DESIGNpdf
2 Denyer S P amp Baird R M (2nd ed)
(1990) Guide to microbiological control in
pharmaceuticals Ellis horwood
3 Clontz L (2nd ed) (2008) Microbial Limit
and Bioburden Tests Validation approaches
and global requirements CRC Press
4 US Food and Drug Administration (2004)
Guidance for Industry Sterile Drug Products
Produced by Aseptic ProcessingmdashCurrent
Good Manufacturing Practice FDA Center for Drug Evaluation and Research (CDER) Center
for Biologics Evaluation and Research (CBER)
and Office of Regulatory Affairs (ORA)
Washington DC
httpwwwfdagovdownloadsDrugsGuida
ncesucm070342pdf
5 United States Pharmacopeia (2008) USP
lt797gt Guidebook to Pharmaceutical
Compounding-Sterile Preparations In Ann
Arbor United States Pharmacopeial
Convention
6 Workshop Report Summary NIST Technical
Note 1737 (2016) Challenges in Microbial
Sampling in the Indoor Environment Retrieved 25 January 2016 from
httpwwwnistgovmmlbbdbiomolecularupl
oadSloan-Roport-Final-TN-1737pdf
7 Dixon A M (Ed) (2006) Environmental
monitoring for cleanrooms and controlled
environments CRC Press
8 Eissa M E (2014) Studies Of Microbial
Resistance Against Some Disinfectants
Microbial Distribution amp Biocidal Resistance in
Pharmaceutical Manufacturing Facility
Saarbruumlcken Lambert Academic Publishing
9 Quisno R Gibby I W amp Foter M J (1946) A neutralizing medium for evaluating the
germicidal potency of the quaternary
ammonium saltsAmerican journal of pharmacy
and the sciences supporting public
health118(9) 320
10 Erlandson A L amp Lawrence C A (1953)
Inactivating medium for hexachlorophene (G-
11) types of compounds and some substituted
phenolic disinfectants Science 118(3062)
274-276
11 Brummer B A R B A R A (1976) Influence of possible disinfectant transfer on
Staphylococcus aureus plate counts after agar
contact samplingApplied and Environmental
Microbiology 32(1) 80-84
12 Vanderzant C amp Splitstoesser D F (1992)
Compendium of methods for the
microbiological examination of foods (3rd ed)
American Public Health
Association Washington DC
13 Kastango E S amp Douglass K (2001)
Quality Assurance for Sterile Products International journal of
pharmaceutical compounding 5(4) 246
14 Eissa ME Seif M Fares M (2015)
Assessment of purified water quality in
pharmaceutical facility using six sigma tools
International Journal of Pharmaceutical Quality
Assurance 6(2) 54-72
15 United States Pharmacopeia (USP 38NF 33)
(2015) USP lt61gt Microbiological
Examination of Non-Sterile Products Microbial
Enumeration Tests Baltimore MD USA United States Pharmacopeia 38National
Formulary 33
16 Motulsky H J amp Brown R E (2006)
Detecting outliers when fitting data with
nonlinear regressionndasha new method based on
robust nonlinear regression and the false
discovery rate BMC bioinformatics 7(1)
123httpwwwgraphpadcomguidesprism5u
Mostafa EE et al Haya Saudi J Life Sci Vol-1 Iss-1(Jan-Mar 2016)1-17
Available Online httpscholarsmepubcomhaya 17
serguideprism5helphtmlreg_correlationchoic
eshtm
17 Graphpadcom (2016) GraphPad Statistics
Guide Retrieved 25 January 2016 from
httpwwwgraphpadcomguidesprism6statis
ticsindexhtmstat_interpreting_results_correlatihtm
18 Tennant G (2001) Six Sigma SPC and TQM
in manufacturing and services Gower
Publishing Ltd
19 Cholayudth P (2006) Establishing Alert
Limits for Microbial Counts in Purified
Water Journal of Validation
Technology 13(1) 44
20 Supportminitabcom (2016) What is an
empirical CDF plot - Minitab Retrieved 25
January 2016 from
httpsupportminitabcomen-usminitab17topic-librarybasic-statistics-and-
graphsgraphsgraphs-of-
distributionsempirical-cdf-plotsempirical-cdf-
plot
21 Supportminitabcom (2016) Specification
limits in capability analysis - Minitab
Retrieved 25 January 2016 from
httpsupportminitabcomen-
usminitab17topic-libraryquality-
toolscapability-analysesdata-and-data
assumptionsspecification-limits 22 Supportminitabcom (2016) Pareto chart
basics - Minitab Retrieved 25 January 2016
from httpsupportminitabcomen-
usminitab17topic-libraryquality-
toolsquality-toolspareto-chart-basics
23 Sutton S (2011) Contamination Control in the
Compliance Program Journal of GXP
Compliance 15(4) 58
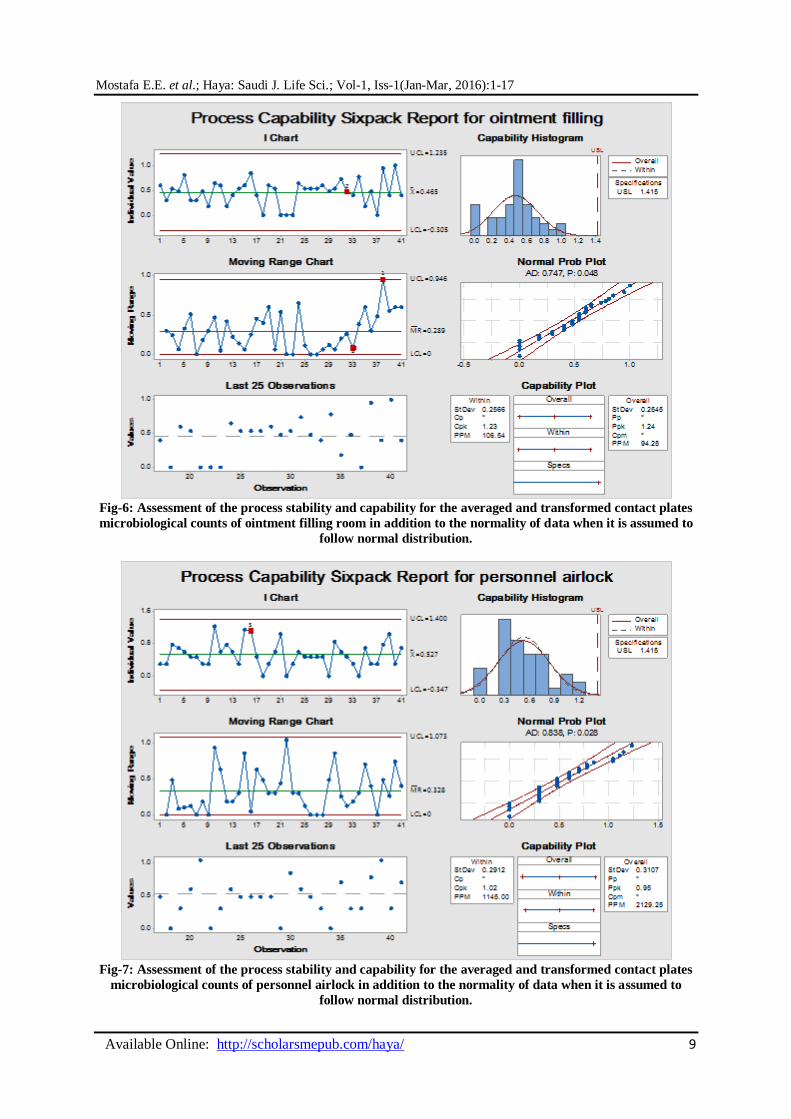
Mostafa EE et al Haya Saudi J Life Sci Vol-1 Iss-1(Jan-Mar 2016)1-17
Available Online httpscholarsmepubcomhaya 10
Fig-8 Assessment of the process stability and capability for the averaged and transformed contact plates
microbiological counts of suppositories room in addition to the normality of data when it is assumed to
follow normal distribution
Fig-9 Assessment of the process stability and capability for the averaged and transformed contact plates
microbiological counts of semisolid corridor in addition to the normality of data when it is assumed to
follow normal distribution
Mostafa EE et al Haya Saudi J Life Sci Vol-1 Iss-1(Jan-Mar 2016)1-17
Available Online httpscholarsmepubcomhaya 11
Fig-10 Assessment of the process stability and capability for the averaged and transformed contact plates
microbiological counts of liquid filling compartment in addition to the normality of data when it is
assumed to follow normal distribution
Fig-11 Assessment of the process stability and capability for the averaged and transformed contact plates
microbiological counts of liquid preparation personnel airlock in addition to the normality of data when it
is assumed to follow normal distribution
Mostafa EE et al Haya Saudi J Life Sci Vol-1 Iss-1(Jan-Mar 2016)1-17
Available Online httpscholarsmepubcomhaya 12
Fig-12 Assessment of the process stability and capability for the averaged and transformed contact plates
microbiological counts of liquid preparation partition in addition to the normality of data when it is
assumed to follow normal distribution
Fig-13 Assessment of the process stability and capability for the averaged and transformed contact plates
microbiological counts of liquid preparation material airlock in addition to the normality of data when it
is assumed to follow normal distribution
Mostafa EE et al Haya Saudi J Life Sci Vol-1 Iss-1(Jan-Mar 2016)1-17
Available Online httpscholarsmepubcomhaya 13
Fig-14 Assessment of the process stability and capability for the averaged and transformed contact plates
microbiological counts of semisolid material airlock in addition to the normality of data when it is
assumed to follow normal distribution
Fig-15 Assessment of the process stability and capability for the averaged and transformed contact plates
microbiological counts of liquid filling material airlock in addition to the normality of data when it is
assumed to follow normal distribution
Mostafa EE et al Haya Saudi J Life Sci Vol-1 Iss-1(Jan-Mar 2016)1-17
Available Online httpscholarsmepubcomhaya 14
Fig-16 Pareto chart of the manufacturing zones in class C pharmaceutical plant displaying defects of
microbiological surface quality in decreasing magnitude of frequency in order to determine the area of
priority for improvements
LFMA = Liquid Filling Material Airlock SMAL = Semisolid Material Airlock LPPA = Liquid Preparation
Personnel Airlock LPMA = Liquid Preparation Material Airlock PRAL = Personnel Airlock SSCR =
Semisolid Corridor LQFL = Liquid Filling area OFLL = Ointment Filling room OPRP = Ointment Preparation
room SPRM = Suppositories Room and LQPR = Liquid Preparation Room
Table 4 Pearson correlation matrix with Two-tailed P at 95 CI and α = 005 for microbiological surface
cleanliness of Class C productions partitions
Pearson Correlation Matrix
Co
rrid
or
Oin
tmen
t
Pre
par
atio
n
Oin
tmen
t
Fil
lin
g
Per
son
nel
Air
lock
Su
pp
osi
tori
e
s R
oom
Liq
uid
Fil
lin
g
Liq
uid
Pre
p
Per
son
nel
Liq
uid
Pre
par
atio
n
Liq
uid
Pre
p
Mat
eria
l
Air
lock
Sem
isoli
d
Mat
Air
lock
Liq
uid
Fil
lin
g M
at
Air
lock
Corridor
033 039 043
yen
059
yen 022 013 001 -004 018 031
Ointment Preparation 033
056
yen 033 021 021 -001 013 019 017 001
Ointment Filling 039 056
yen 022 039 026 003 -006 010 030 012
Personnel Airlock 043
yen 033 022
038 005 009 012 -005 003 029
Suppositories Room 059
yen 021 039 038
031 006 -002 -008 017 024
Liquid Filling 022 021 026 005 031
015 015 -010 013 -011
Liquid Prep
Personnel 013 -001 003 009 006 015
018 -016 -025 -003
Liquid Preparation 001 013 -006 012 -002 015 018
-007 012 -015
Liquid Prep Material
Airlock -004 019 010 -005 -008 -010 -016 -007
024 003
Semisolid Mat
Airlock 018 017 030 003 017 013 -025 012 024
019
Liquid Filling Mat Airlock
031 001 012 029 024 -011 -003 -015 003 019
= Significant correlation yen = Moderate correlation while all the other showed either weak or very weak
association
Mostafa EE et al Haya Saudi J Life Sci Vol-1 Iss-1(Jan-Mar 2016)1-17
Available Online httpscholarsmepubcomhaya 15
Fig- 17 Ishikawa Diagram showing the degree of the relation between surface bioburden of the main
corridor and the other manufacturing partitions using coefficient of determination (R2)
SM = Semisolid Material Airlock LP = Liquid Preparation room LF = Liquid Filling area PA = Personnel
Airlock OP = Ointment Preparation room LFM = Liquid Filling Material Airlock LPM = Liquid Preparation
Material Airlock LPP = Liquid Preparation Personnel Airlock SR = Suppositories Room and OF = Ointment
Filling Area
Fig-18 Ishikawa Diagram showing all the possible causes of microbiological out-of-control states
Fig-19 Total coefficient of determination (R
2) of each manufacturing location in class C
Surfaces
Partitions
with Other
of Corridor
Contamination
Cross
LFM
SM
LPM
LP
LPP
LF
SR
PA
OF
OP
0110175
00957205 0150033
0185972
0350669
00494594
00165297
5824296e-00
000157264
00315363
Cause-and-Effect Diagram
000
010
020
030
040
050
060
070
080
090
100
Corridor Ointment
Preparation
Ointment
Filling
Personnel
Airlock
Suppositories
Room
Liquid Filling Liquid Prep
Personnel
Liquid
Preparation
Liquid
PrepMaterial
Airlock
Semisolid
Mat Airlock
Liquid Filling
Mat Airlock
Mostafa EE et al Haya Saudi J Life Sci Vol-1 Iss-1(Jan-Mar 2016)1-17
Available Online httpscholarsmepubcomhaya 16
CONCLUSION
Airlocks - especially for material transfer -
are locations of high risk of failure in
microbiological quality for pharmaceutical facility
A balance between sanitization practice and the
activity encountered in specific production area should be established An optimization between the
two events could be determined using statistical
process control as demonstrated in the current study
In addition the use of control charts could take the
routine microbiological environmental monitoring
beyond just pass or fail to meet acceptance criteria
Six Sigma tools provide insight of the state of
control identifying defective spots and assisting in
the investigation of any excursion in
microbiological results At the same time the
applied methodology is simple not expensive yet
effective in supporting quality control (QC)quality assurance (QA) tasks with the promising ability to
apply quantitative risk analysis for production area
that could impact the final microbiological quality
of pharmaceutical products and bioburden of the
medicinal drugs
ACKNOWLEDGEMENT
This work was supported partially
financially by HIKMA Pharma pharmaceutical
company ndash 2nd Industrial zone - 6th of October city
Reference and writing style review was performed by Dr Engy Refaat Rashed Data gathering and
collection was performed by the microbiology
laboratory team of the quality control department
REFERENCES
1 Owusu S A (2007) Modern Trends in
Tropical Pharmaceutical Industry
Design (Master dissertation Department of
Architecture Kwame Nkrumah University of
Science and Technology) Available from
httpirknustedughbitstream1234567894311PHARMACEUTICAL20INDUSTRY20
DESIGNpdf
2 Denyer S P amp Baird R M (2nd ed)
(1990) Guide to microbiological control in
pharmaceuticals Ellis horwood
3 Clontz L (2nd ed) (2008) Microbial Limit
and Bioburden Tests Validation approaches
and global requirements CRC Press
4 US Food and Drug Administration (2004)
Guidance for Industry Sterile Drug Products
Produced by Aseptic ProcessingmdashCurrent
Good Manufacturing Practice FDA Center for Drug Evaluation and Research (CDER) Center
for Biologics Evaluation and Research (CBER)
and Office of Regulatory Affairs (ORA)
Washington DC
httpwwwfdagovdownloadsDrugsGuida
ncesucm070342pdf
5 United States Pharmacopeia (2008) USP
lt797gt Guidebook to Pharmaceutical
Compounding-Sterile Preparations In Ann
Arbor United States Pharmacopeial
Convention
6 Workshop Report Summary NIST Technical
Note 1737 (2016) Challenges in Microbial
Sampling in the Indoor Environment Retrieved 25 January 2016 from
httpwwwnistgovmmlbbdbiomolecularupl
oadSloan-Roport-Final-TN-1737pdf
7 Dixon A M (Ed) (2006) Environmental
monitoring for cleanrooms and controlled
environments CRC Press
8 Eissa M E (2014) Studies Of Microbial
Resistance Against Some Disinfectants
Microbial Distribution amp Biocidal Resistance in
Pharmaceutical Manufacturing Facility
Saarbruumlcken Lambert Academic Publishing
9 Quisno R Gibby I W amp Foter M J (1946) A neutralizing medium for evaluating the
germicidal potency of the quaternary
ammonium saltsAmerican journal of pharmacy
and the sciences supporting public
health118(9) 320
10 Erlandson A L amp Lawrence C A (1953)
Inactivating medium for hexachlorophene (G-
11) types of compounds and some substituted
phenolic disinfectants Science 118(3062)
274-276
11 Brummer B A R B A R A (1976) Influence of possible disinfectant transfer on
Staphylococcus aureus plate counts after agar
contact samplingApplied and Environmental
Microbiology 32(1) 80-84
12 Vanderzant C amp Splitstoesser D F (1992)
Compendium of methods for the
microbiological examination of foods (3rd ed)
American Public Health
Association Washington DC
13 Kastango E S amp Douglass K (2001)
Quality Assurance for Sterile Products International journal of
pharmaceutical compounding 5(4) 246
14 Eissa ME Seif M Fares M (2015)
Assessment of purified water quality in
pharmaceutical facility using six sigma tools
International Journal of Pharmaceutical Quality
Assurance 6(2) 54-72
15 United States Pharmacopeia (USP 38NF 33)
(2015) USP lt61gt Microbiological
Examination of Non-Sterile Products Microbial
Enumeration Tests Baltimore MD USA United States Pharmacopeia 38National
Formulary 33
16 Motulsky H J amp Brown R E (2006)
Detecting outliers when fitting data with
nonlinear regressionndasha new method based on
robust nonlinear regression and the false
discovery rate BMC bioinformatics 7(1)
123httpwwwgraphpadcomguidesprism5u
Mostafa EE et al Haya Saudi J Life Sci Vol-1 Iss-1(Jan-Mar 2016)1-17
Available Online httpscholarsmepubcomhaya 17
serguideprism5helphtmlreg_correlationchoic
eshtm
17 Graphpadcom (2016) GraphPad Statistics
Guide Retrieved 25 January 2016 from
httpwwwgraphpadcomguidesprism6statis
ticsindexhtmstat_interpreting_results_correlatihtm
18 Tennant G (2001) Six Sigma SPC and TQM
in manufacturing and services Gower
Publishing Ltd
19 Cholayudth P (2006) Establishing Alert
Limits for Microbial Counts in Purified
Water Journal of Validation
Technology 13(1) 44
20 Supportminitabcom (2016) What is an
empirical CDF plot - Minitab Retrieved 25
January 2016 from
httpsupportminitabcomen-usminitab17topic-librarybasic-statistics-and-
graphsgraphsgraphs-of-
distributionsempirical-cdf-plotsempirical-cdf-
plot
21 Supportminitabcom (2016) Specification
limits in capability analysis - Minitab
Retrieved 25 January 2016 from
httpsupportminitabcomen-
usminitab17topic-libraryquality-
toolscapability-analysesdata-and-data
assumptionsspecification-limits 22 Supportminitabcom (2016) Pareto chart
basics - Minitab Retrieved 25 January 2016
from httpsupportminitabcomen-
usminitab17topic-libraryquality-
toolsquality-toolspareto-chart-basics
23 Sutton S (2011) Contamination Control in the
Compliance Program Journal of GXP
Compliance 15(4) 58
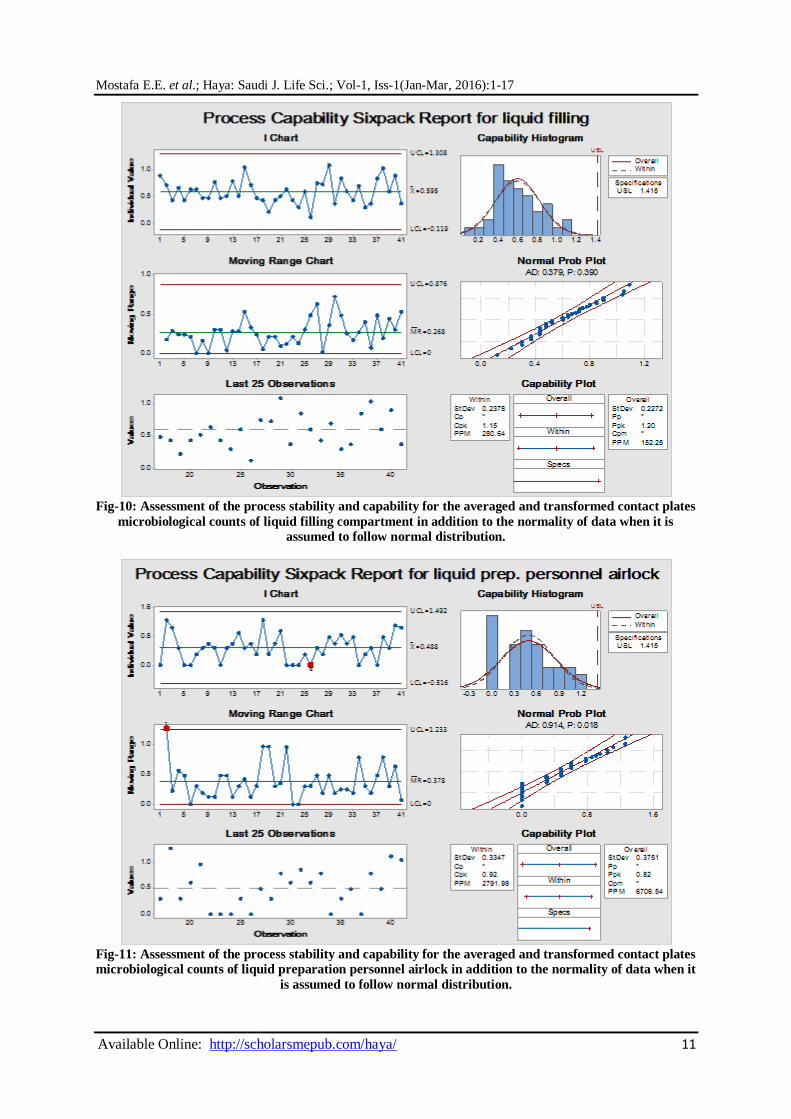
Mostafa EE et al Haya Saudi J Life Sci Vol-1 Iss-1(Jan-Mar 2016)1-17
Available Online httpscholarsmepubcomhaya 11
Fig-10 Assessment of the process stability and capability for the averaged and transformed contact plates
microbiological counts of liquid filling compartment in addition to the normality of data when it is
assumed to follow normal distribution
Fig-11 Assessment of the process stability and capability for the averaged and transformed contact plates
microbiological counts of liquid preparation personnel airlock in addition to the normality of data when it
is assumed to follow normal distribution
Mostafa EE et al Haya Saudi J Life Sci Vol-1 Iss-1(Jan-Mar 2016)1-17
Available Online httpscholarsmepubcomhaya 12
Fig-12 Assessment of the process stability and capability for the averaged and transformed contact plates
microbiological counts of liquid preparation partition in addition to the normality of data when it is
assumed to follow normal distribution
Fig-13 Assessment of the process stability and capability for the averaged and transformed contact plates
microbiological counts of liquid preparation material airlock in addition to the normality of data when it
is assumed to follow normal distribution
Mostafa EE et al Haya Saudi J Life Sci Vol-1 Iss-1(Jan-Mar 2016)1-17
Available Online httpscholarsmepubcomhaya 13
Fig-14 Assessment of the process stability and capability for the averaged and transformed contact plates
microbiological counts of semisolid material airlock in addition to the normality of data when it is
assumed to follow normal distribution
Fig-15 Assessment of the process stability and capability for the averaged and transformed contact plates
microbiological counts of liquid filling material airlock in addition to the normality of data when it is
assumed to follow normal distribution
Mostafa EE et al Haya Saudi J Life Sci Vol-1 Iss-1(Jan-Mar 2016)1-17
Available Online httpscholarsmepubcomhaya 14
Fig-16 Pareto chart of the manufacturing zones in class C pharmaceutical plant displaying defects of
microbiological surface quality in decreasing magnitude of frequency in order to determine the area of
priority for improvements
LFMA = Liquid Filling Material Airlock SMAL = Semisolid Material Airlock LPPA = Liquid Preparation
Personnel Airlock LPMA = Liquid Preparation Material Airlock PRAL = Personnel Airlock SSCR =
Semisolid Corridor LQFL = Liquid Filling area OFLL = Ointment Filling room OPRP = Ointment Preparation
room SPRM = Suppositories Room and LQPR = Liquid Preparation Room
Table 4 Pearson correlation matrix with Two-tailed P at 95 CI and α = 005 for microbiological surface
cleanliness of Class C productions partitions
Pearson Correlation Matrix
Co
rrid
or
Oin
tmen
t
Pre
par
atio
n
Oin
tmen
t
Fil
lin
g
Per
son
nel
Air
lock
Su
pp
osi
tori
e
s R
oom
Liq
uid
Fil
lin
g
Liq
uid
Pre
p
Per
son
nel
Liq
uid
Pre
par
atio
n
Liq
uid
Pre
p
Mat
eria
l
Air
lock
Sem
isoli
d
Mat
Air
lock
Liq
uid
Fil
lin
g M
at
Air
lock
Corridor
033 039 043
yen
059
yen 022 013 001 -004 018 031
Ointment Preparation 033
056
yen 033 021 021 -001 013 019 017 001
Ointment Filling 039 056
yen 022 039 026 003 -006 010 030 012
Personnel Airlock 043
yen 033 022
038 005 009 012 -005 003 029
Suppositories Room 059
yen 021 039 038
031 006 -002 -008 017 024
Liquid Filling 022 021 026 005 031
015 015 -010 013 -011
Liquid Prep
Personnel 013 -001 003 009 006 015
018 -016 -025 -003
Liquid Preparation 001 013 -006 012 -002 015 018
-007 012 -015
Liquid Prep Material
Airlock -004 019 010 -005 -008 -010 -016 -007
024 003
Semisolid Mat
Airlock 018 017 030 003 017 013 -025 012 024
019
Liquid Filling Mat Airlock
031 001 012 029 024 -011 -003 -015 003 019
= Significant correlation yen = Moderate correlation while all the other showed either weak or very weak
association
Mostafa EE et al Haya Saudi J Life Sci Vol-1 Iss-1(Jan-Mar 2016)1-17
Available Online httpscholarsmepubcomhaya 15
Fig- 17 Ishikawa Diagram showing the degree of the relation between surface bioburden of the main
corridor and the other manufacturing partitions using coefficient of determination (R2)
SM = Semisolid Material Airlock LP = Liquid Preparation room LF = Liquid Filling area PA = Personnel
Airlock OP = Ointment Preparation room LFM = Liquid Filling Material Airlock LPM = Liquid Preparation
Material Airlock LPP = Liquid Preparation Personnel Airlock SR = Suppositories Room and OF = Ointment
Filling Area
Fig-18 Ishikawa Diagram showing all the possible causes of microbiological out-of-control states
Fig-19 Total coefficient of determination (R
2) of each manufacturing location in class C
Surfaces
Partitions
with Other
of Corridor
Contamination
Cross
LFM
SM
LPM
LP
LPP
LF
SR
PA
OF
OP
0110175
00957205 0150033
0185972
0350669
00494594
00165297
5824296e-00
000157264
00315363
Cause-and-Effect Diagram
000
010
020
030
040
050
060
070
080
090
100
Corridor Ointment
Preparation
Ointment
Filling
Personnel
Airlock
Suppositories
Room
Liquid Filling Liquid Prep
Personnel
Liquid
Preparation
Liquid
PrepMaterial
Airlock
Semisolid
Mat Airlock
Liquid Filling
Mat Airlock
Mostafa EE et al Haya Saudi J Life Sci Vol-1 Iss-1(Jan-Mar 2016)1-17
Available Online httpscholarsmepubcomhaya 16
CONCLUSION
Airlocks - especially for material transfer -
are locations of high risk of failure in
microbiological quality for pharmaceutical facility
A balance between sanitization practice and the
activity encountered in specific production area should be established An optimization between the
two events could be determined using statistical
process control as demonstrated in the current study
In addition the use of control charts could take the
routine microbiological environmental monitoring
beyond just pass or fail to meet acceptance criteria
Six Sigma tools provide insight of the state of
control identifying defective spots and assisting in
the investigation of any excursion in
microbiological results At the same time the
applied methodology is simple not expensive yet
effective in supporting quality control (QC)quality assurance (QA) tasks with the promising ability to
apply quantitative risk analysis for production area
that could impact the final microbiological quality
of pharmaceutical products and bioburden of the
medicinal drugs
ACKNOWLEDGEMENT
This work was supported partially
financially by HIKMA Pharma pharmaceutical
company ndash 2nd Industrial zone - 6th of October city
Reference and writing style review was performed by Dr Engy Refaat Rashed Data gathering and
collection was performed by the microbiology
laboratory team of the quality control department
REFERENCES
1 Owusu S A (2007) Modern Trends in
Tropical Pharmaceutical Industry
Design (Master dissertation Department of
Architecture Kwame Nkrumah University of
Science and Technology) Available from
httpirknustedughbitstream1234567894311PHARMACEUTICAL20INDUSTRY20
DESIGNpdf
2 Denyer S P amp Baird R M (2nd ed)
(1990) Guide to microbiological control in
pharmaceuticals Ellis horwood
3 Clontz L (2nd ed) (2008) Microbial Limit
and Bioburden Tests Validation approaches
and global requirements CRC Press
4 US Food and Drug Administration (2004)
Guidance for Industry Sterile Drug Products
Produced by Aseptic ProcessingmdashCurrent
Good Manufacturing Practice FDA Center for Drug Evaluation and Research (CDER) Center
for Biologics Evaluation and Research (CBER)
and Office of Regulatory Affairs (ORA)
Washington DC
httpwwwfdagovdownloadsDrugsGuida
ncesucm070342pdf
5 United States Pharmacopeia (2008) USP
lt797gt Guidebook to Pharmaceutical
Compounding-Sterile Preparations In Ann
Arbor United States Pharmacopeial
Convention
6 Workshop Report Summary NIST Technical
Note 1737 (2016) Challenges in Microbial
Sampling in the Indoor Environment Retrieved 25 January 2016 from
httpwwwnistgovmmlbbdbiomolecularupl
oadSloan-Roport-Final-TN-1737pdf
7 Dixon A M (Ed) (2006) Environmental
monitoring for cleanrooms and controlled
environments CRC Press
8 Eissa M E (2014) Studies Of Microbial
Resistance Against Some Disinfectants
Microbial Distribution amp Biocidal Resistance in
Pharmaceutical Manufacturing Facility
Saarbruumlcken Lambert Academic Publishing
9 Quisno R Gibby I W amp Foter M J (1946) A neutralizing medium for evaluating the
germicidal potency of the quaternary
ammonium saltsAmerican journal of pharmacy
and the sciences supporting public
health118(9) 320
10 Erlandson A L amp Lawrence C A (1953)
Inactivating medium for hexachlorophene (G-
11) types of compounds and some substituted
phenolic disinfectants Science 118(3062)
274-276
11 Brummer B A R B A R A (1976) Influence of possible disinfectant transfer on
Staphylococcus aureus plate counts after agar
contact samplingApplied and Environmental
Microbiology 32(1) 80-84
12 Vanderzant C amp Splitstoesser D F (1992)
Compendium of methods for the
microbiological examination of foods (3rd ed)
American Public Health
Association Washington DC
13 Kastango E S amp Douglass K (2001)
Quality Assurance for Sterile Products International journal of
pharmaceutical compounding 5(4) 246
14 Eissa ME Seif M Fares M (2015)
Assessment of purified water quality in
pharmaceutical facility using six sigma tools
International Journal of Pharmaceutical Quality
Assurance 6(2) 54-72
15 United States Pharmacopeia (USP 38NF 33)
(2015) USP lt61gt Microbiological
Examination of Non-Sterile Products Microbial
Enumeration Tests Baltimore MD USA United States Pharmacopeia 38National
Formulary 33
16 Motulsky H J amp Brown R E (2006)
Detecting outliers when fitting data with
nonlinear regressionndasha new method based on
robust nonlinear regression and the false
discovery rate BMC bioinformatics 7(1)
123httpwwwgraphpadcomguidesprism5u
Mostafa EE et al Haya Saudi J Life Sci Vol-1 Iss-1(Jan-Mar 2016)1-17
Available Online httpscholarsmepubcomhaya 17
serguideprism5helphtmlreg_correlationchoic
eshtm
17 Graphpadcom (2016) GraphPad Statistics
Guide Retrieved 25 January 2016 from
httpwwwgraphpadcomguidesprism6statis
ticsindexhtmstat_interpreting_results_correlatihtm
18 Tennant G (2001) Six Sigma SPC and TQM
in manufacturing and services Gower
Publishing Ltd
19 Cholayudth P (2006) Establishing Alert
Limits for Microbial Counts in Purified
Water Journal of Validation
Technology 13(1) 44
20 Supportminitabcom (2016) What is an
empirical CDF plot - Minitab Retrieved 25
January 2016 from
httpsupportminitabcomen-usminitab17topic-librarybasic-statistics-and-
graphsgraphsgraphs-of-
distributionsempirical-cdf-plotsempirical-cdf-
plot
21 Supportminitabcom (2016) Specification
limits in capability analysis - Minitab
Retrieved 25 January 2016 from
httpsupportminitabcomen-
usminitab17topic-libraryquality-
toolscapability-analysesdata-and-data
assumptionsspecification-limits 22 Supportminitabcom (2016) Pareto chart
basics - Minitab Retrieved 25 January 2016
from httpsupportminitabcomen-
usminitab17topic-libraryquality-
toolsquality-toolspareto-chart-basics
23 Sutton S (2011) Contamination Control in the
Compliance Program Journal of GXP
Compliance 15(4) 58
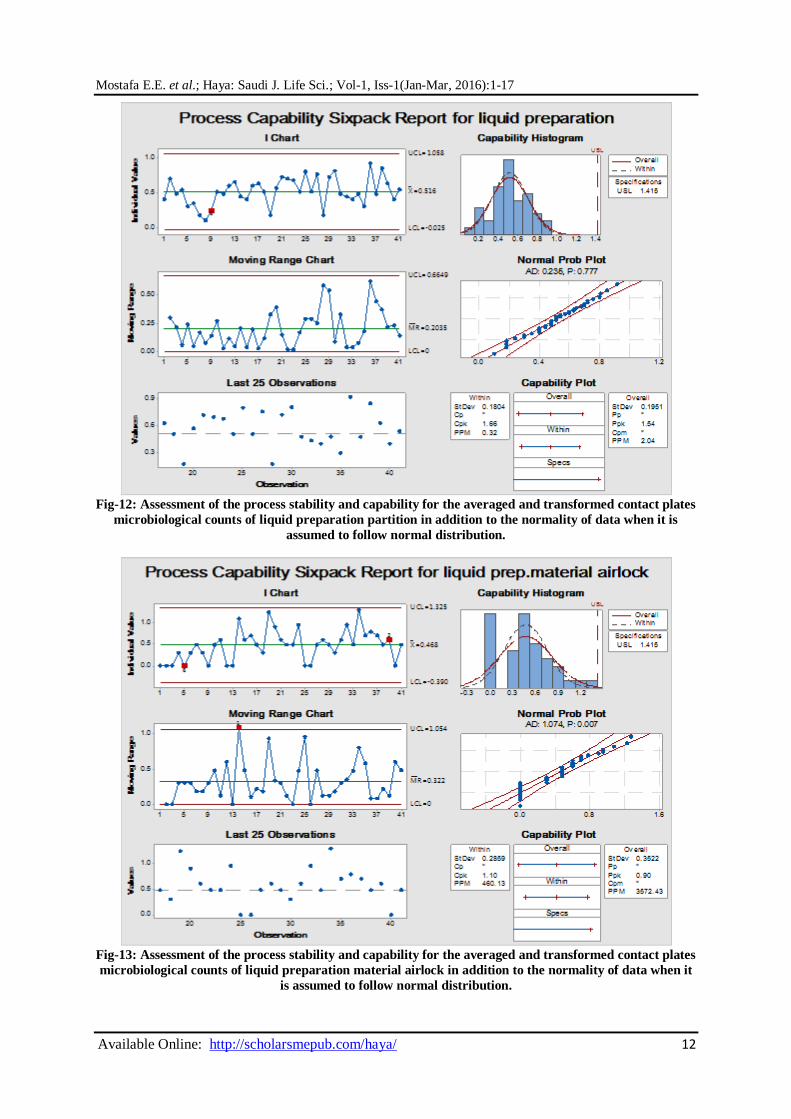
Mostafa EE et al Haya Saudi J Life Sci Vol-1 Iss-1(Jan-Mar 2016)1-17
Available Online httpscholarsmepubcomhaya 17
serguideprism5helphtmlreg_correlationchoic
eshtm
17 Graphpadcom (2016) GraphPad Statistics
Guide Retrieved 25 January 2016 from
httpwwwgraphpadcomguidesprism6statis
ticsindexhtmstat_interpreting_results_correlatihtm
18 Tennant G (2001) Six Sigma SPC and TQM
in manufacturing and services Gower
Publishing Ltd
19 Cholayudth P (2006) Establishing Alert
Limits for Microbial Counts in Purified
Water Journal of Validation
Technology 13(1) 44
20 Supportminitabcom (2016) What is an
empirical CDF plot - Minitab Retrieved 25
January 2016 from
httpsupportminitabcomen-usminitab17topic-librarybasic-statistics-and-
graphsgraphsgraphs-of-
distributionsempirical-cdf-plotsempirical-cdf-
plot
21 Supportminitabcom (2016) Specification
limits in capability analysis - Minitab
Retrieved 25 January 2016 from
httpsupportminitabcomen-
usminitab17topic-libraryquality-
toolscapability-analysesdata-and-data
assumptionsspecification-limits 22 Supportminitabcom (2016) Pareto chart
basics - Minitab Retrieved 25 January 2016
from httpsupportminitabcomen-
usminitab17topic-libraryquality-
toolsquality-toolspareto-chart-basics
23 Sutton S (2011) Contamination Control in the
Compliance Program Journal of GXP
Compliance 15(4) 58


