Statistical Quality
Control
Module 6
July 16, 2014
Overview
Statistical Quality Control Systems
• What is a sample?
• Basic forms of sampling
Statistical Process Control (SPC)
• Control charts
What are they
Interpreting control charts
Constructing control charts
Exampleseptance Sampling
Two Scoops of Raisins in
a Box of Kellogg’s Raisin Bran
1. Cereal production
Highly Automated Process
2. Kellogg’s Uses Quality
Management Techniques Such
as Establishing Conformance
Standards, Sampling, and
Statistical Process Control
Two Scoops of Raisins in
a Box of Kellogg’s Raisin Bran
3. Statistical Quality Control
Charts are Used to Determine
Whether the Variations Observed
from One Cereal Box to the Next
are Random or Have a Specific
Cause
4. Quality Insurance Inspectors
Periodically Open Random Samples
of the Packed Boxes that are Ready
to be Shipped
Statistical Quality Control
1. The use of statistical tools and
analysis to control and improve the
quality of a product or service.
2. One of the sets of tools for
Total Quality Management (TQM)
3. Central to the strategies promoted by
the pioneers of the quality movement,
such as Deming, Juran, and Taguchi
4. “If you can’t describe and measure it,
then you can’t control or improve it.”
Illustrations
1. BASF – catalytic cores for pollution control
A. Percentage of defective cores
2. Milliken – industrial fabrics
A. Number of defects per 100 yards
3. Thermalex – thermal tubing
A. Height and width (variables)
4. Land’s End – customer service, order fulfillment
A. Percentage of correctly filled orders
5. Hospital pharmacy
A. Prescription error rate
Steps in Designing Statistical
Quality Control Systems
Identify critical points
• Incoming materials & services
• Work in process
• Finished product or service
Decide on the type of measurement
• variables
• attribute
Decide on the amount of inspection to be used.
Decide who should do the inspection—end of line
inspectors, or workers inspecting their own work?
When Someone Finds a Defect…
1. Containment: Keep the defective
items from getting to the customer
2. Correction: Find the cause of the
defect and correct it.
3. Prevention: Prevent the cause from
happening again.
4. Continuously improve the system.
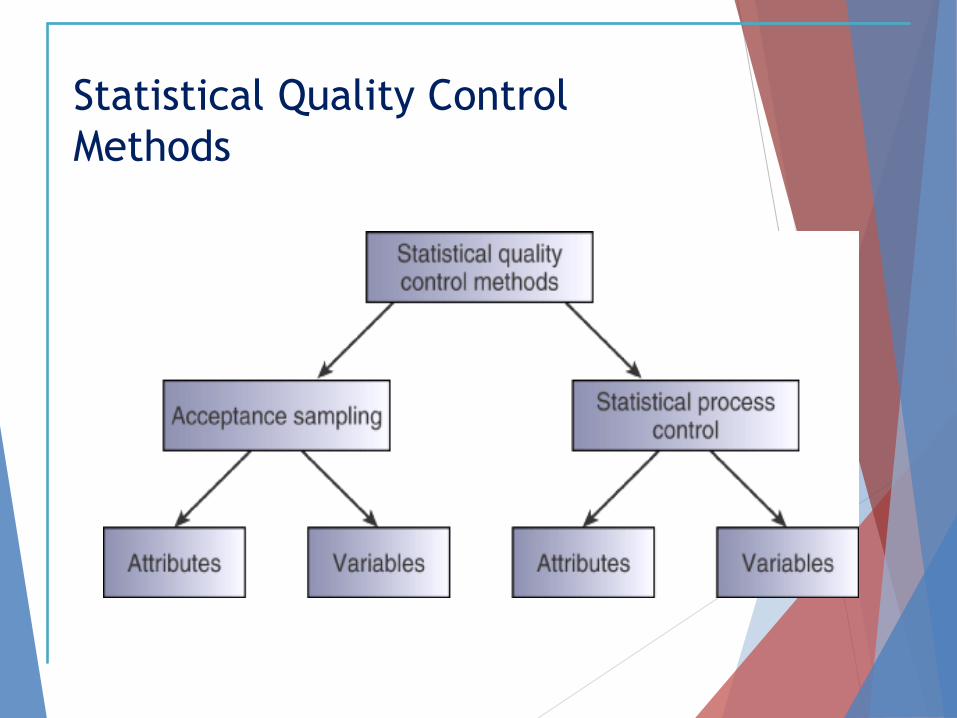
Statistical Quality Control
Methods
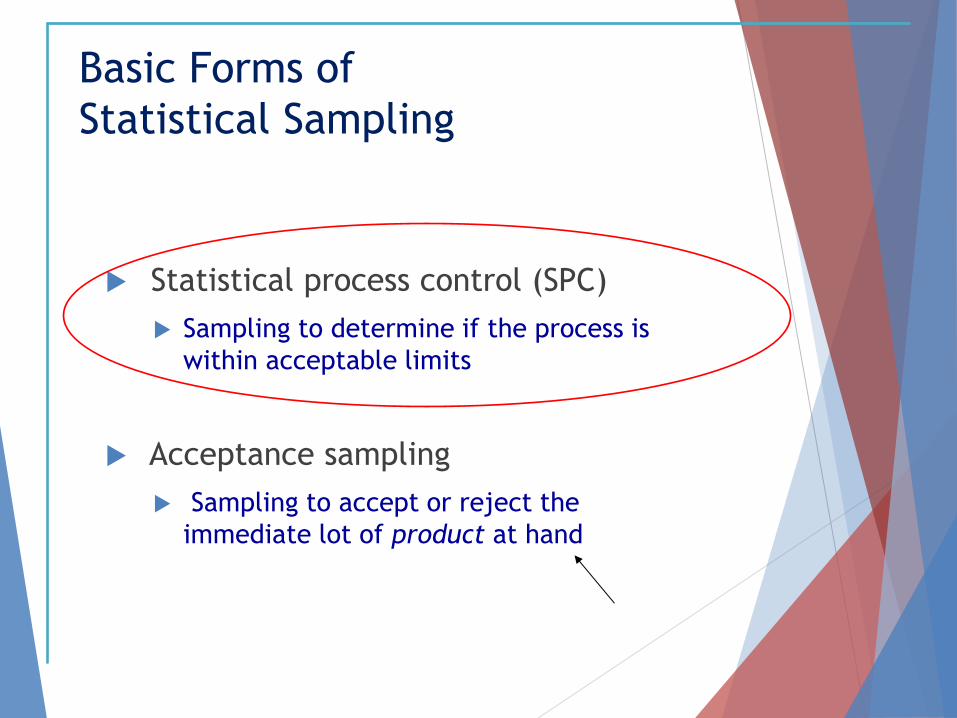
Basic Forms of
Statistical Sampling
Statistical process control (SPC)
Sampling to determine if the process is
within acceptable limits
Acceptance sampling
Sampling to accept or reject the
immediate lot of product at hand
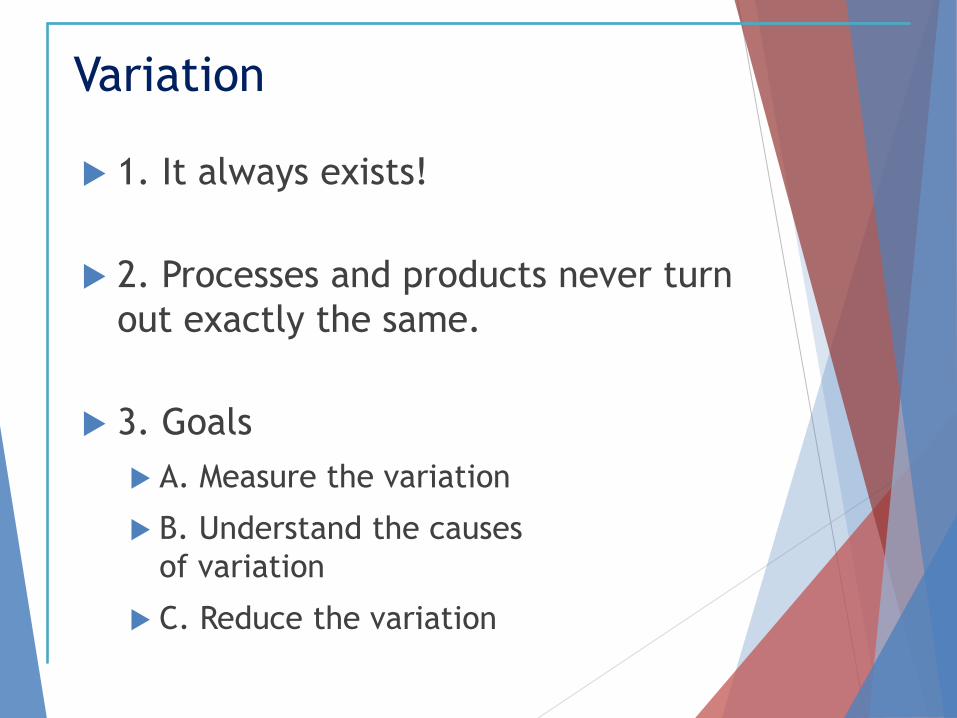
Variation
1. It always exists!
2. Processes and products never turn
out exactly the same.
3. Goals
A. Measure the variation
B. Understand the causes
of variation
C. Reduce the variation
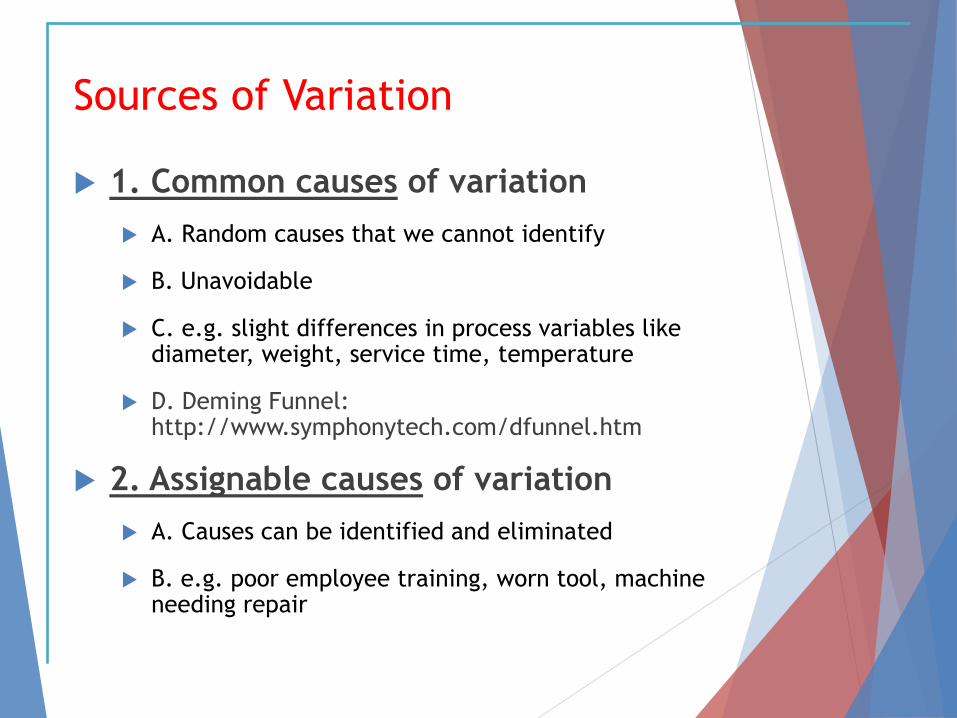
Sources of Variation
1. Common causes of variation
A. Random causes that we cannot identify
B. Unavoidable
C. e.g. slight differences in process variables like diameter, weight, service time, temperature
D. Deming Funnel: http://www.symphonytech.com/dfunnel.htm
2. Assignable causes of variation
A. Causes can be identified and eliminated
B. e.g. poor employee training, worn tool, machine needing repair
Use Control Charts
graphs that visually show if a sample
is within statistical control limits
A managerial tool used to analyze
whether a process is “in control” or
“out of control”
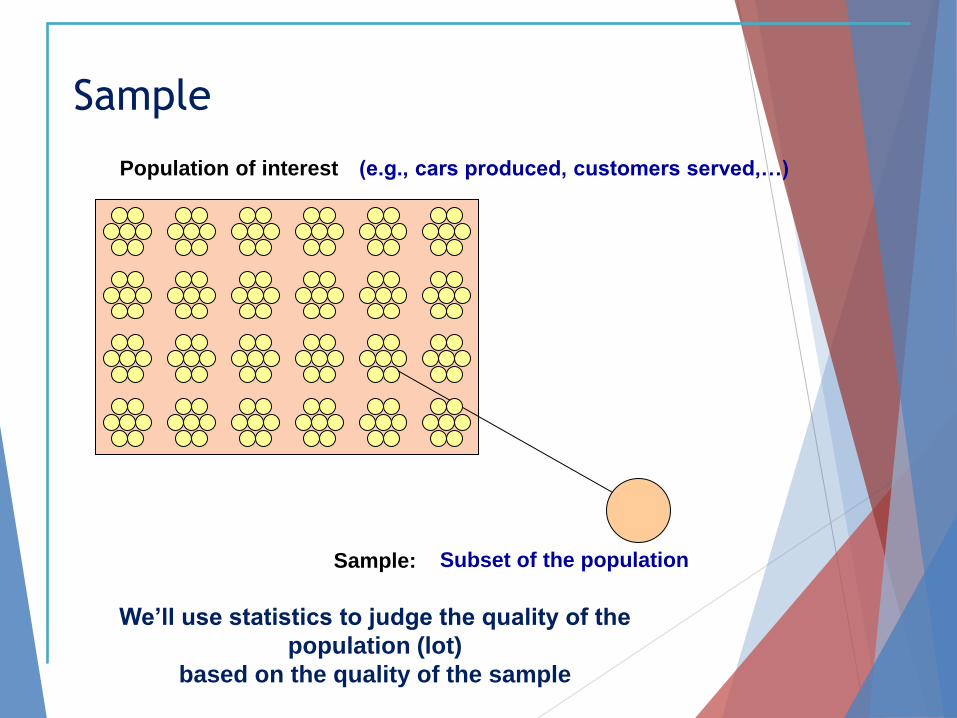
Sample
Population of interest
Subset of the population Sample:
(e.g., cars produced, customers served,…)
We’ll use statistics to judge the quality of the
population (lot)
based on the quality of the sample
Issues in Using Control Charts
Sample Size
large enough to detect defectives
variables can use smaller sample sizes
How often to sample?
Depends upon cost
Control limits vs. product specifications
Is the process capable of producing to specs?
Are the specifications appropriate?
Issues in Using Control Charts
Sample Size
large enough to detect defectives
E.g. if expect one defect per hundred,
sample size should be at least 100.
variables can use smaller sample
sizes
Because computing (e.g. mean)
instead of counting.
Issues in Using Control Charts
How often to sample?
Depends upon cost
What is the cost of the actual sample?
E.g. crash tests for cars
What is the cost of the wrong decision?
E.g. what happens if you decide a bad batch of medicine is good? (This could happen because of randomness.)
Issues in Using Control Charts
Control limits vs. product
specifications
Is the process capable of producing to
specs?
If not, then change the process or change
the specifications.
Are the specifications appropriate?
How long do you expect the product to
last, or under what conditions do you
expect it to survive?
Should your iPod survive being run over by
your car?
Sampling Errors
Type I (α Error or Producer’s Risk)
Occurs when a sample says parts are bad or the
process is out of control when the opposite is
true.
The probability of rejecting good parts as scrap.
Type II (β error or Consumer’s Risk)
Occurs when a sample says parts are good or the
process is in control when the reverse is true.
The probability of a customer getting a bad lot
represented as good.
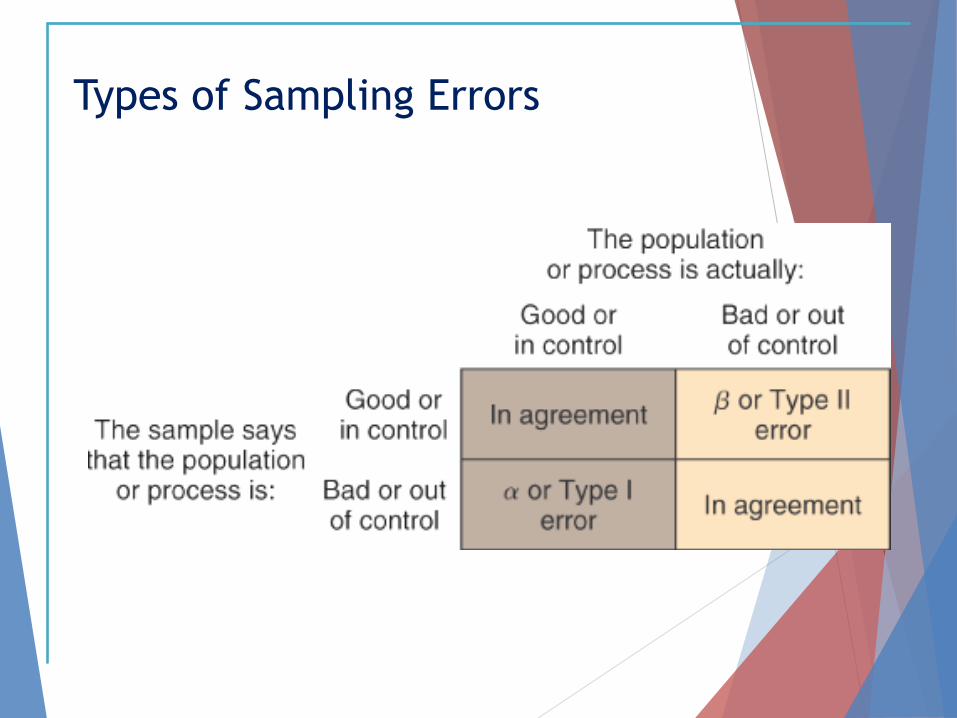
Types of Sampling Errors
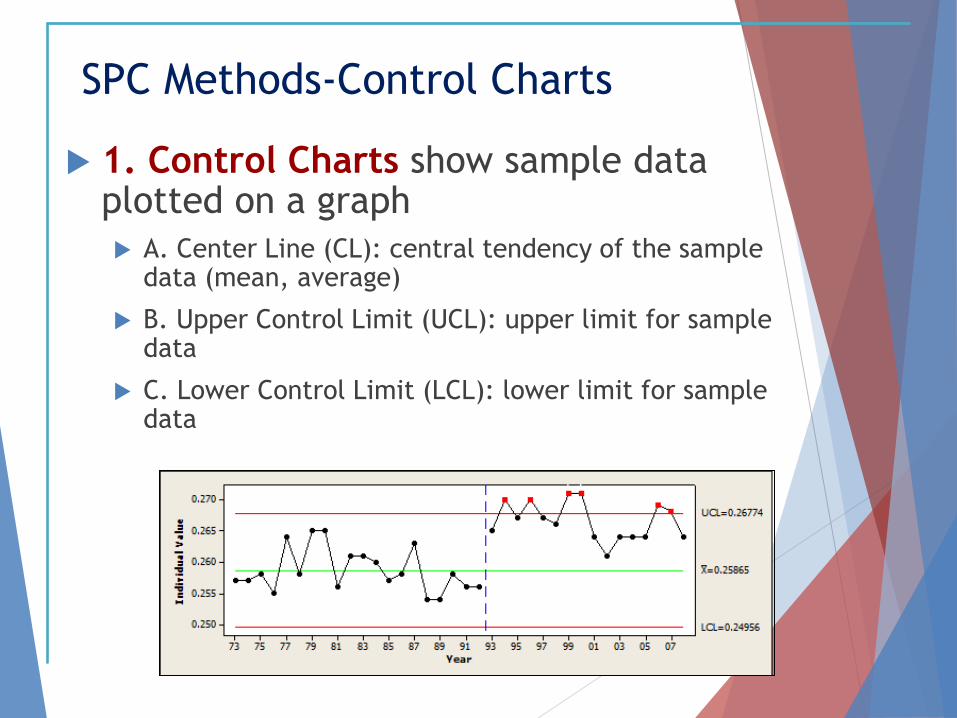
SPC Methods-Control Charts
1. Control Charts show sample data plotted on a graph
A. Center Line (CL): central tendency of the sample data (mean, average)
B. Upper Control Limit (UCL): upper limit for sample data
C. Lower Control Limit (LCL): lower limit for sample data
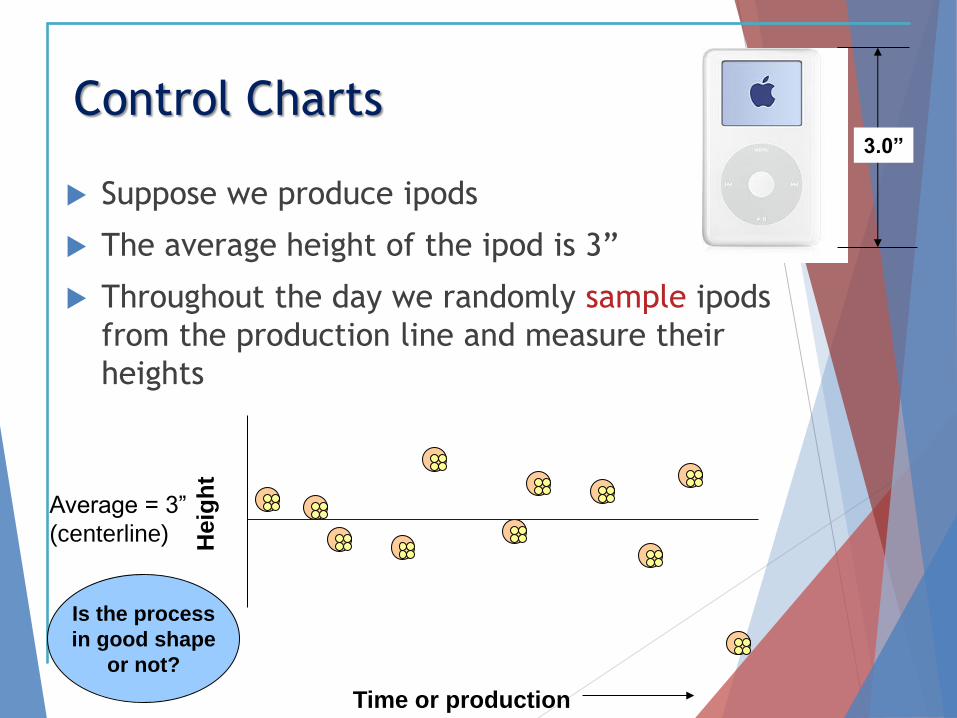
Control Charts
Suppose we produce ipods
The average height of the ipod is 3”
Throughout the day we randomly sample ipods
from the production line and measure their
heights
Average = 3”
(centerline)
Time or production
3.0”
Heig
ht
Is the process
in good shape
or not?
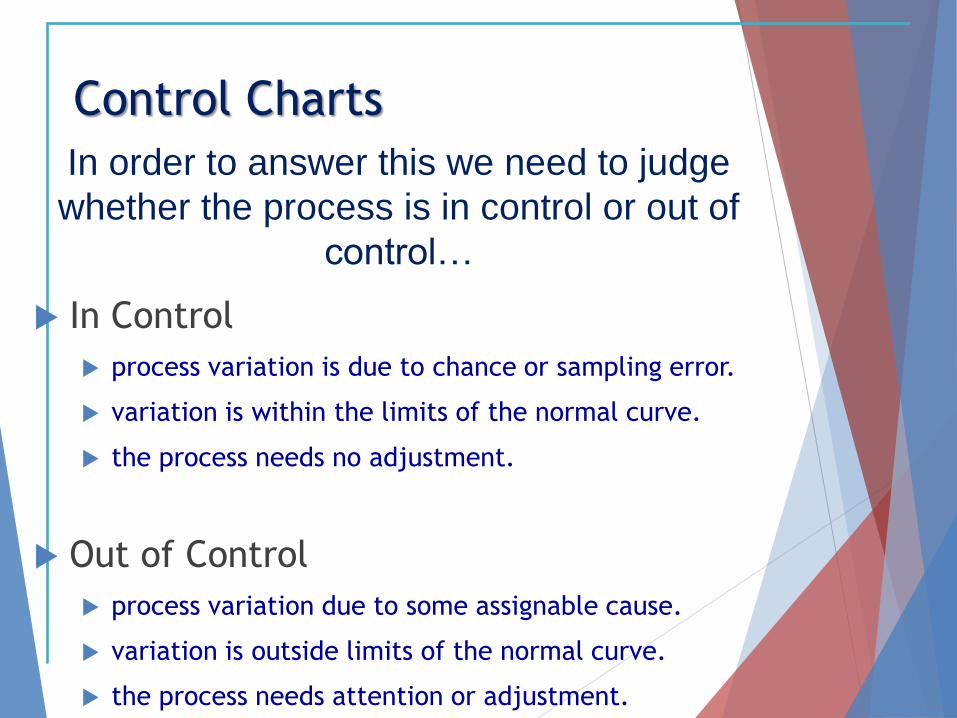
Control Charts
In Control
process variation is due to chance or sampling error.
variation is within the limits of the normal curve.
the process needs no adjustment.
Out of Control
process variation due to some assignable cause.
variation is outside limits of the normal curve.
the process needs attention or adjustment.
In order to answer this we need to judge
whether the process is in control or out of
control…
Control Charts
One way to do this is by adding control limits to our
control charts
Upper control limit: + 3 standard dev
Lower control limit: - 3 standard dev
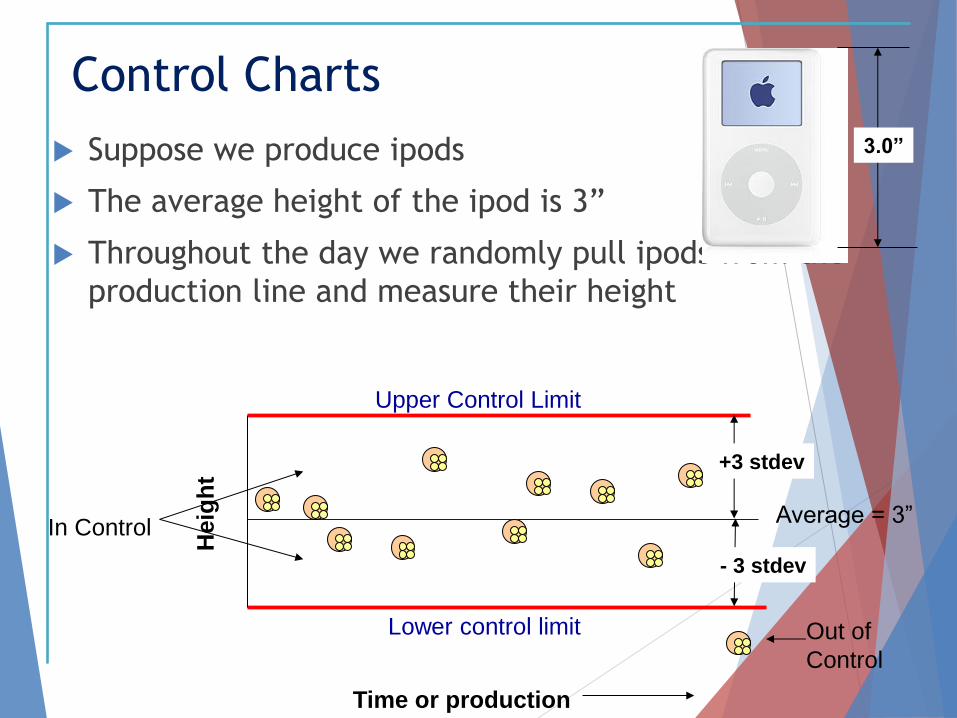
Control Charts
Suppose we produce ipods
The average height of the ipod is 3”
Throughout the day we randomly pull ipods from the
production line and measure their height
Average = 3”
Upper Control Limit
Lower control limit
Time or production
In Control
Out of
Control
3.0”
+3 stdev
- 3 stdev
Heig
ht
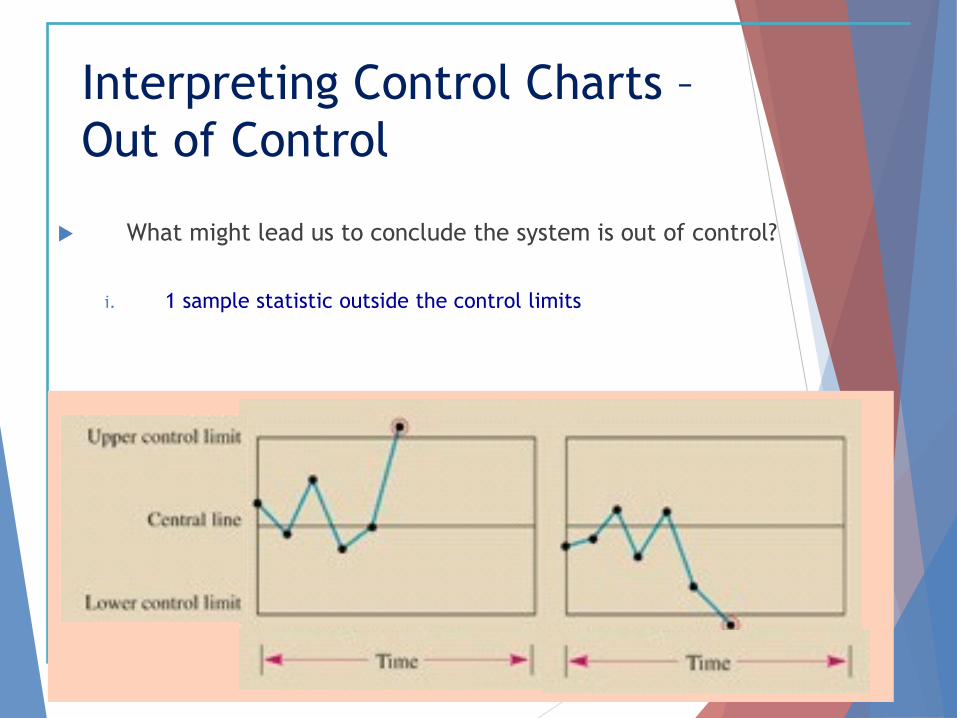
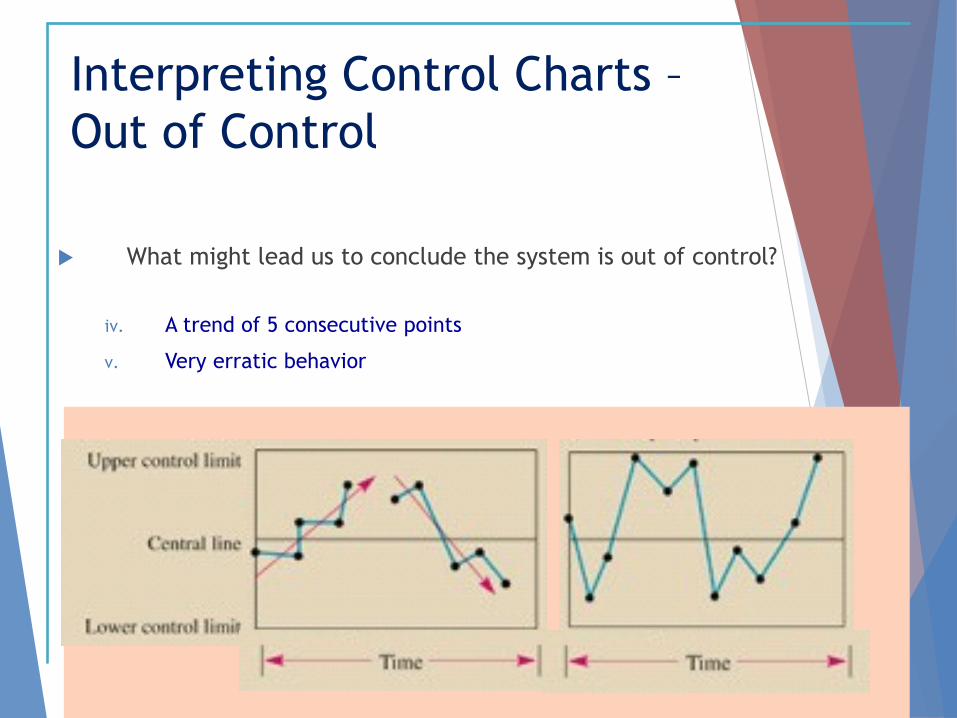
Interpreting Control Charts –
Out of Control
What might lead us to conclude the system is out of control?
i. 1 sample statistic outside the control limits
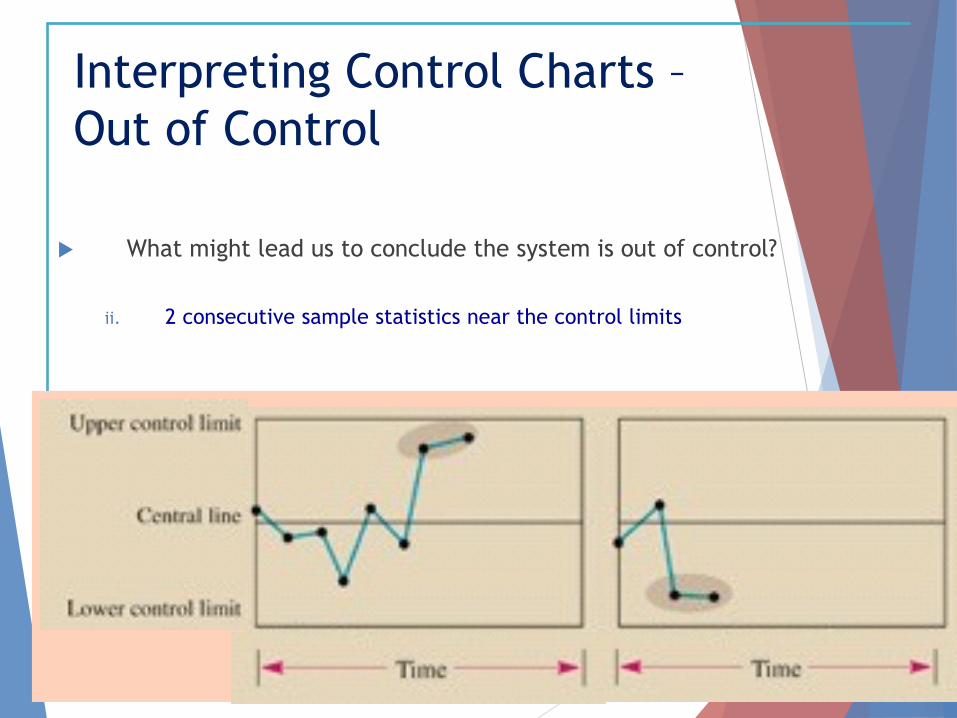
Interpreting Control Charts –
Out of Control
What might lead us to conclude the system is out of control?
ii. 2 consecutive sample statistics near the control limits
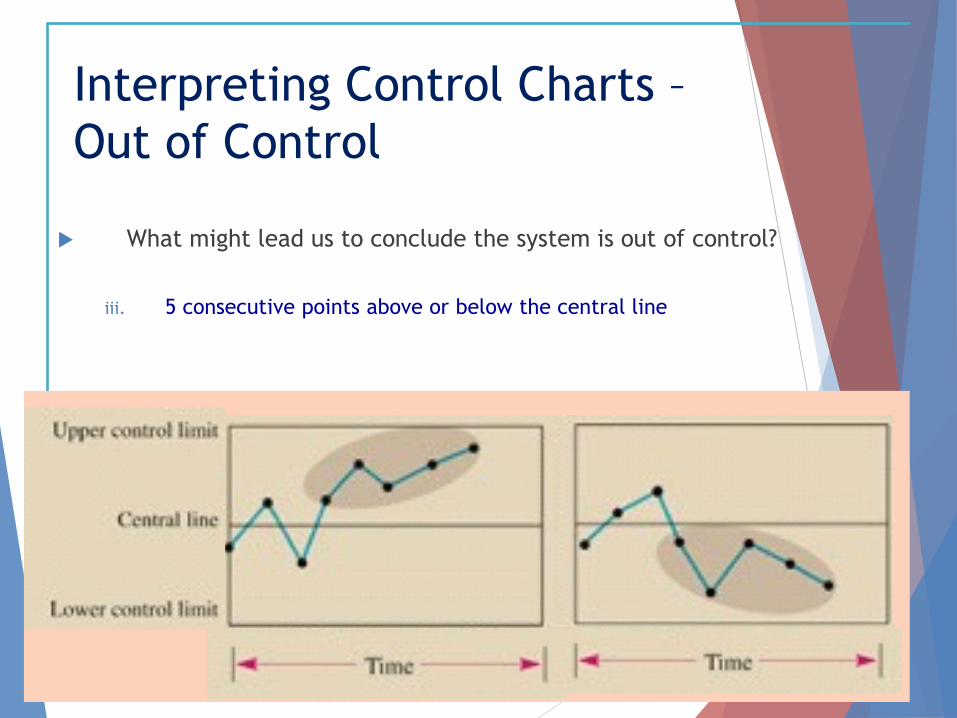
Interpreting Control Charts –
Out of Control
What might lead us to conclude the system is out of control?
iii. 5 consecutive points above or below the central line
Interpreting Control Charts –
Out of Control
What might lead us to conclude the system is out of control?
iv. A trend of 5 consecutive points
v. Very erratic behavior
Types Of Measurement
Attribute measurement
Attributes are counts, such as the number (or proportion) of defects in a sample.
• Product characteristic evaluated with a discrete choice: Good/bad, yes/no
.
Types Of Measurement Variables measurement
Variables are measures (mean & range
or standard deviation) of critical
characteristics in a sample.
Product characteristic that can be measured on a
continuous scale:
Length, size, weight, height, time, velocity
Control Charts for Attributes
p-Charts
1. Calculate the proportion of
defective parts in each sample
2. Use P-Charts for quality
characteristics that are discrete
and involve yes/no or good/bad
decisions
3. Number of leaking caulking
tubes in a box of 48
4. Number of broken eggs in a
carton
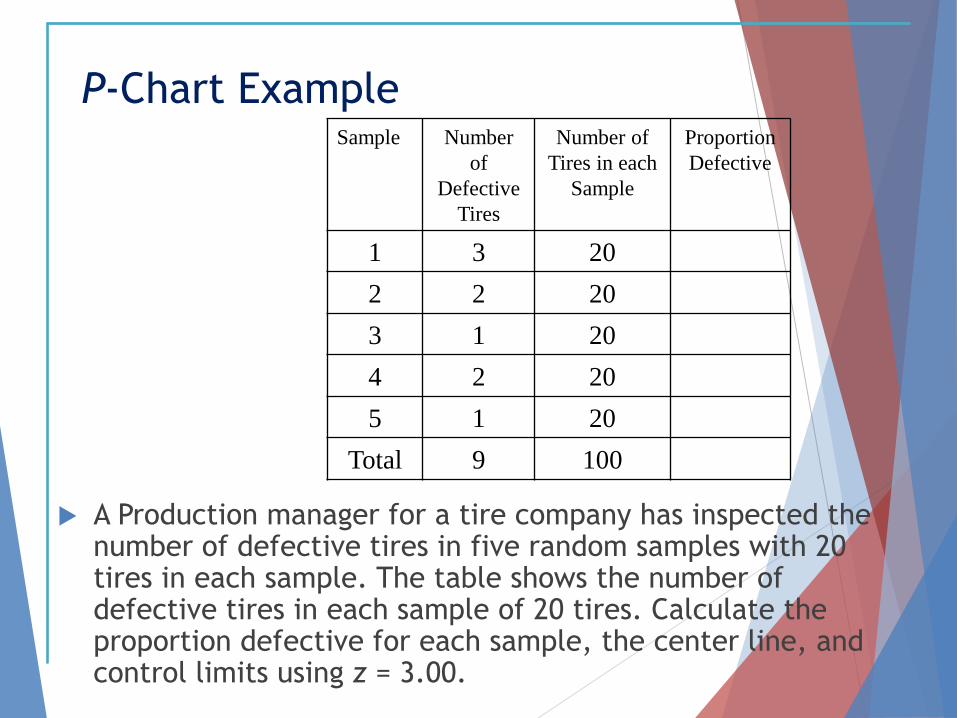
P-Chart Example
Sample Number
of
Defective
Tires
Number of
Tires in each
Sample
Proportion
Defective
1 3 20
2 2 20
3 1 20
4 2 20
5 1 20
Total 9 100
A Production manager for a tire company has inspected the number of defective tires in five random samples with 20 tires in each sample. The table shows the number of defective tires in each sample of 20 tires. Calculate the proportion defective for each sample, the center line, and control limits using z = 3.00.
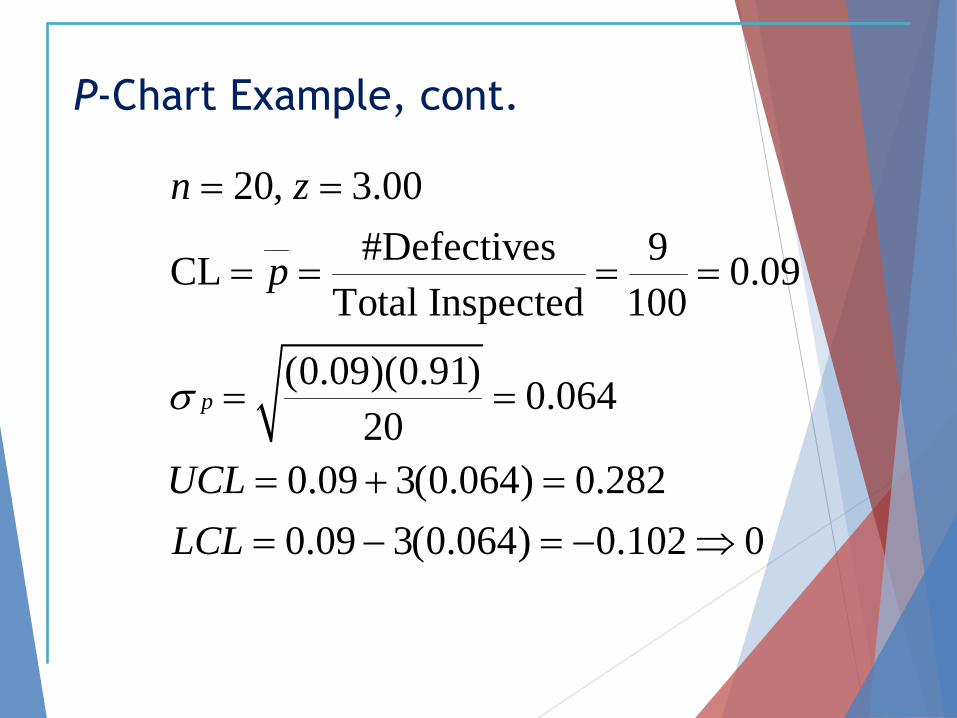
P-Chart Example, cont.
20, 3.00
#Defectives 9CL 0.09
Total Inspected 100
(0.09)(0.91)0.064
20
0.09 3(0.064) 0.282
0.09 3(0.064) 0.102 0
p
n z
p
UCL
LCL
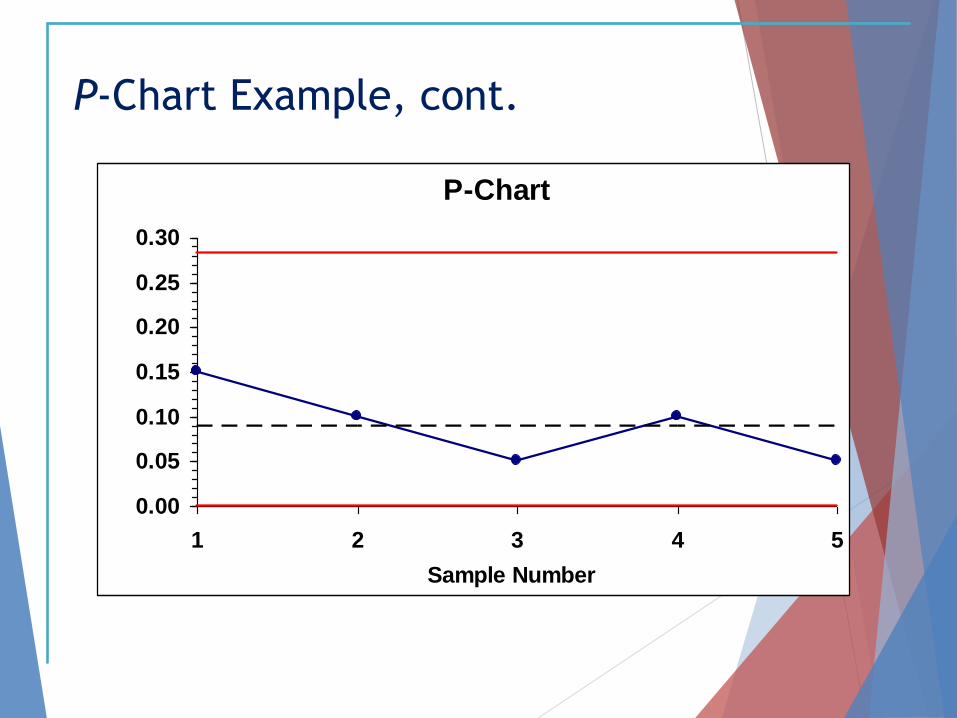
P-Chart Example, cont.
P-Chart
0.00
0.05
0.10
0.15
0.20
0.25
0.30
1 2 3 4 5
Sample Number
Control Charts for Attributes
c-Charts
1. Count the number of defects found in
each sample or observation period
(possibly more than one defect per part)
2. Use C-Charts for discrete defects when
there can be more than one defect per
unit
3. Number of flaws or stains in a carpet
sample cut from a production run
4. Number of complaints per customer at a
hotel
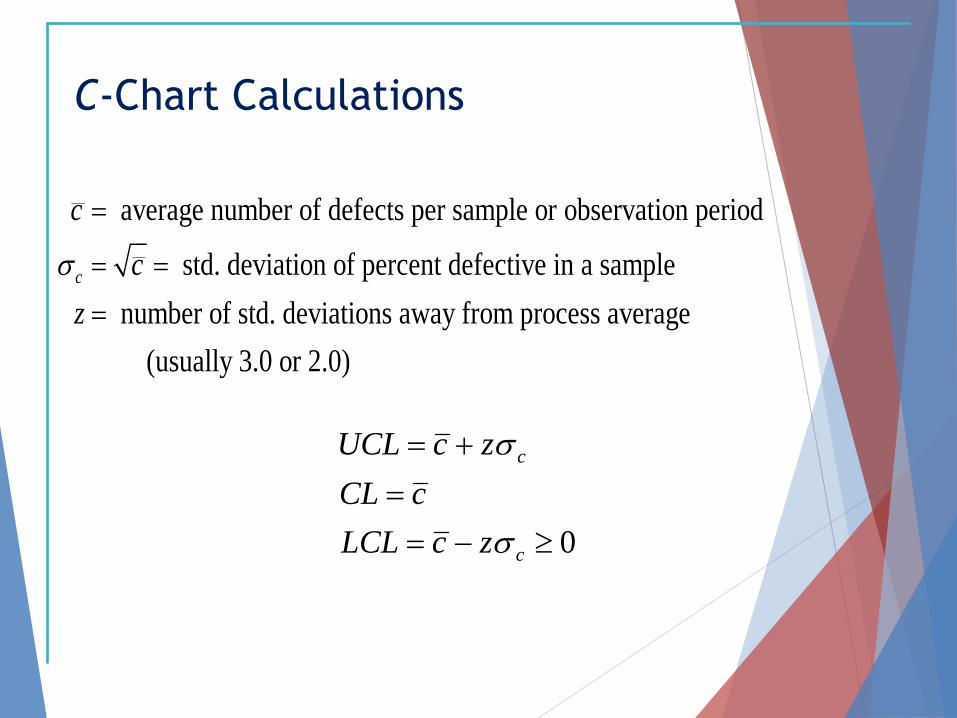
C-Chart Calculations
average number of defects per sample or observation period
std. deviation of percent defective in a sample
number of std. deviations away from process average
(usually 3.0 or 2.0)
c
c
c
z
0
c
c
zcLCL
cCL
zcUCL
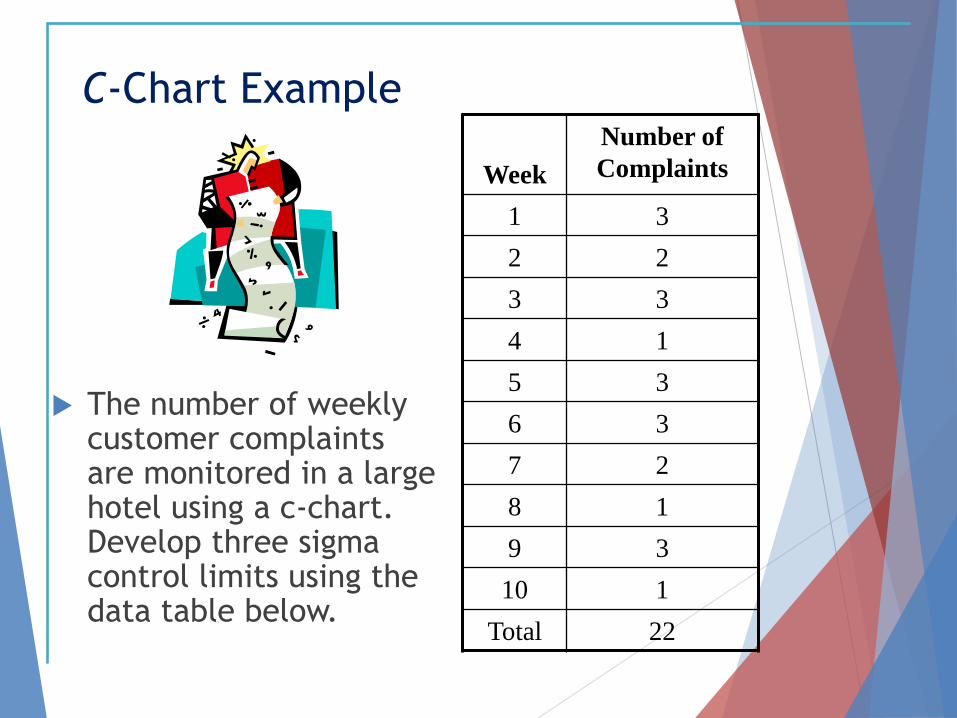
C-Chart Example
Week
Number of
Complaints
1 3
2 2
3 3
4 1
5 3
6 3
7 2
8 1
9 3
10 1
Total 22
The number of weekly customer complaints are monitored in a large hotel using a c-chart. Develop three sigma control limits using the data table below.
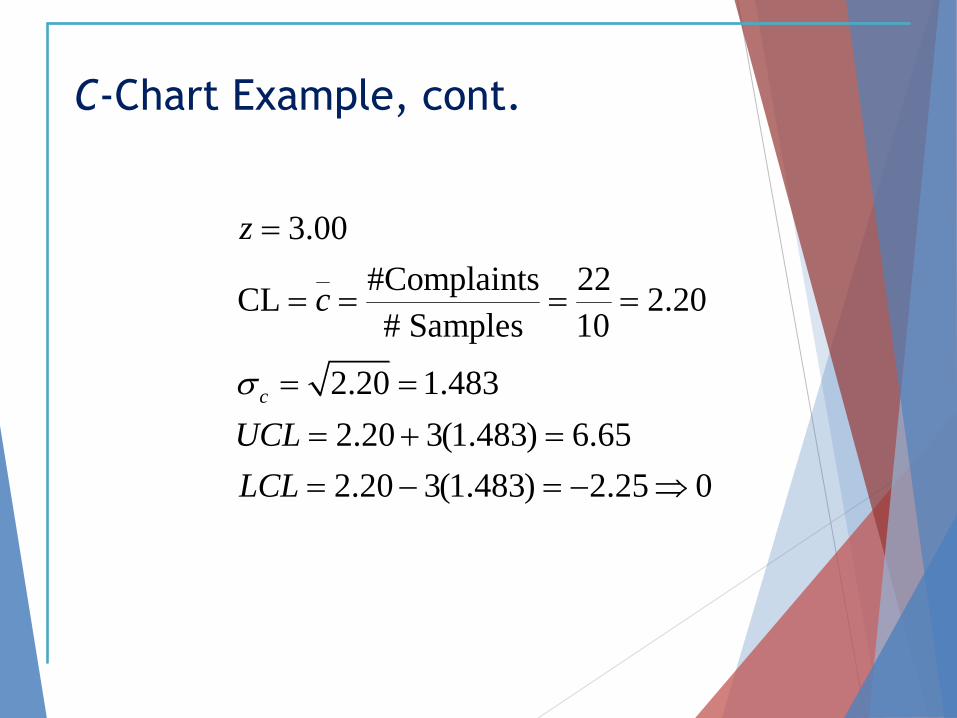
C-Chart Example, cont.
3.00
#Complaints 22CL 2.20
# Samples 10
2.20 1.483
2.20 3(1.483) 6.65
2.20 3(1.483) 2.25 0
c
z
c
UCL
LCL
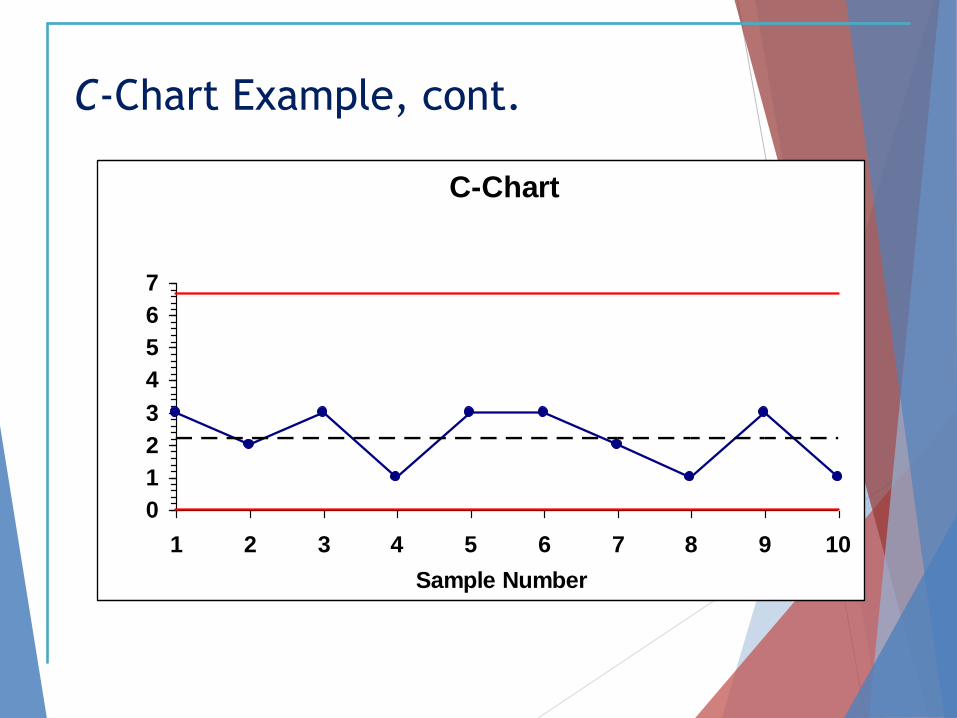
C-Chart Example, cont.
C-Chart
0
1
2
3
4
5
6
7
1 2 3 4 5 6 7 8 9 10
Sample Number
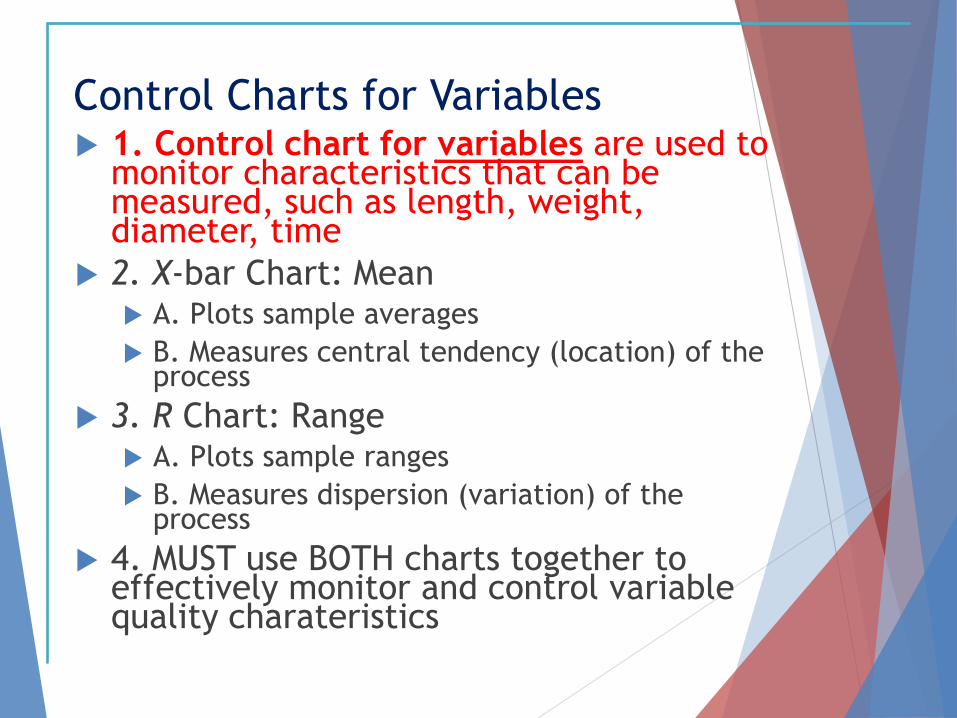
Control Charts for Variables 1. Control chart for variables are used to
monitor characteristics that can be measured, such as length, weight, diameter, time
2. X-bar Chart: Mean A. Plots sample averages
B. Measures central tendency (location) of the process
3. R Chart: Range A. Plots sample ranges
B. Measures dispersion (variation) of the process
4. MUST use BOTH charts together to effectively monitor and control variable quality charateristics
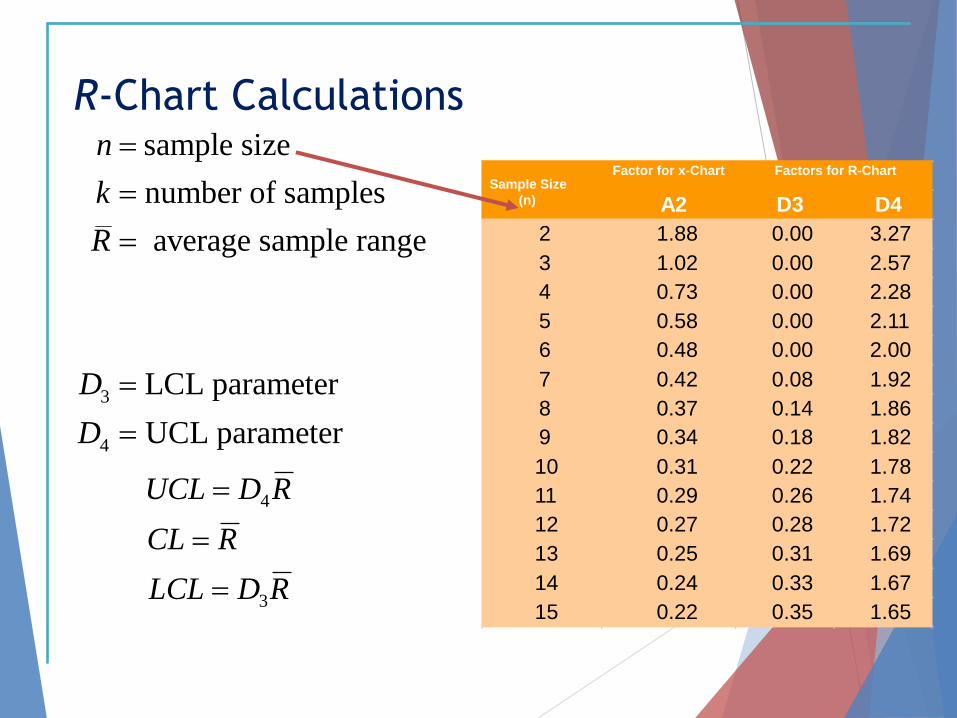
R-Chart Calculations
3
4
sample size
number of samples
average sample range
LCL parameter
UCL parameter
n
k
R
D
D
Factor for x-Chart
A2 D3 D4
2 1.88 0.00 3.27
3 1.02 0.00 2.57
4 0.73 0.00 2.28
5 0.58 0.00 2.11
6 0.48 0.00 2.00
7 0.42 0.08 1.92
8 0.37 0.14 1.86
9 0.34 0.18 1.82
10 0.31 0.22 1.78
11 0.29 0.26 1.74
12 0.27 0.28 1.72
13 0.25 0.31 1.69
14 0.24 0.33 1.67
15 0.22 0.35 1.65
Factors for R-Chart Sample Size
(n)
RDLCL
RCL
RDUCL
3
4
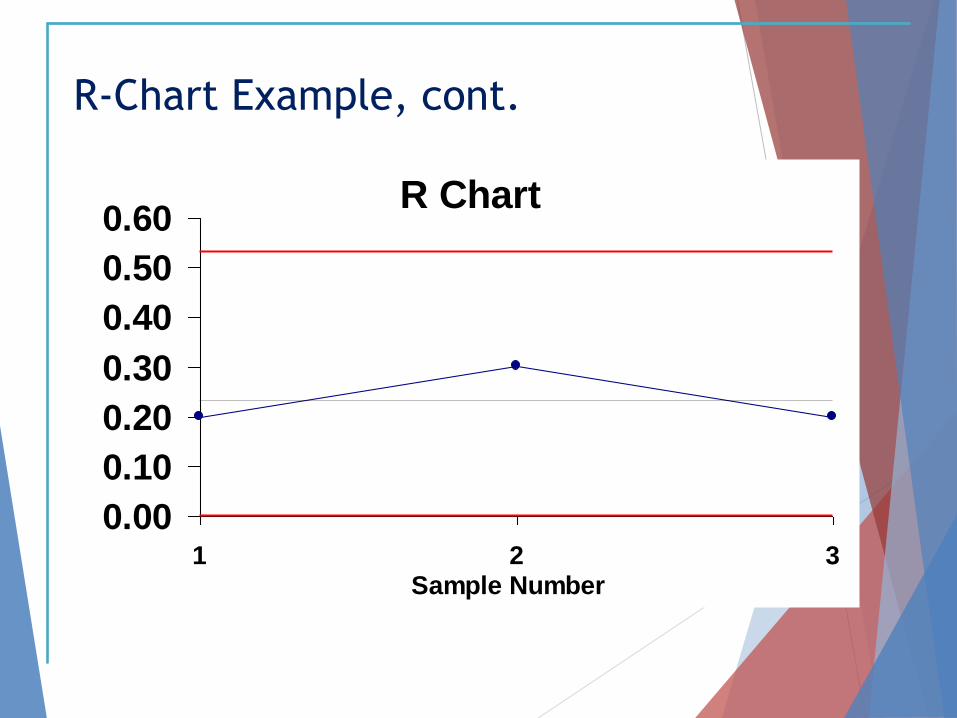
R-Chart Example, cont.
R Chart
0.00
0.10
0.20
0.30
0.40
0.50
0.60
1 2 3Sample Number
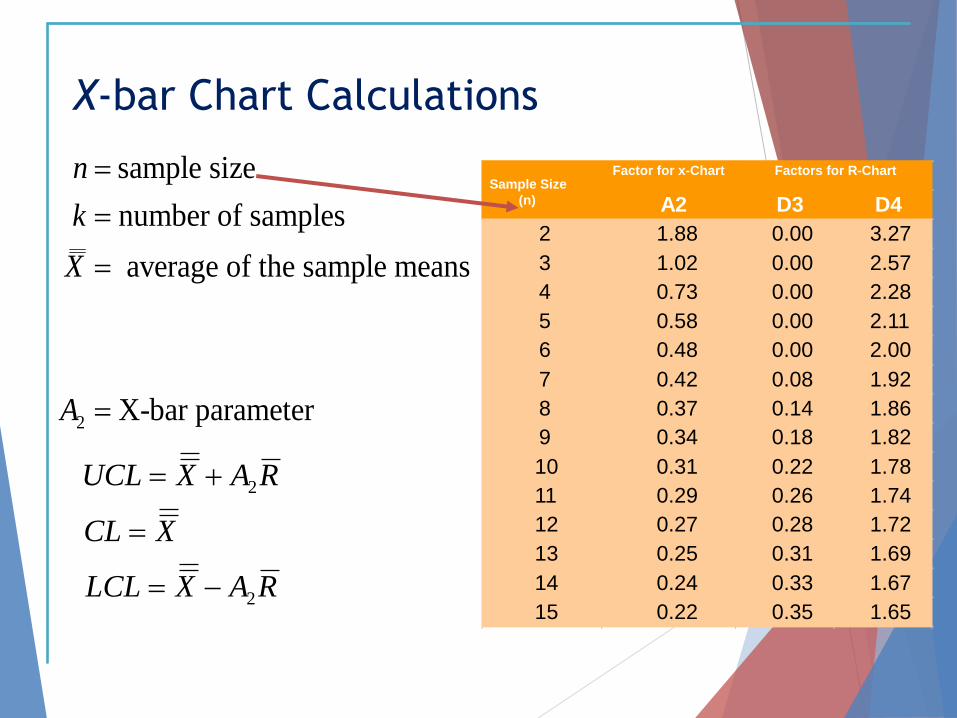
X-bar Chart Calculations
2
sample size
number of samples
average of the sample means
X-bar parameter
n
k
X
A
Factor for x-Chart
A2 D3 D4
2 1.88 0.00 3.27
3 1.02 0.00 2.57
4 0.73 0.00 2.28
5 0.58 0.00 2.11
6 0.48 0.00 2.00
7 0.42 0.08 1.92
8 0.37 0.14 1.86
9 0.34 0.18 1.82
10 0.31 0.22 1.78
11 0.29 0.26 1.74
12 0.27 0.28 1.72
13 0.25 0.31 1.69
14 0.24 0.33 1.67
15 0.22 0.35 1.65
Factors for R-Chart Sample Size
(n)
RAXLCL
XCL
RAXUCL
2
2
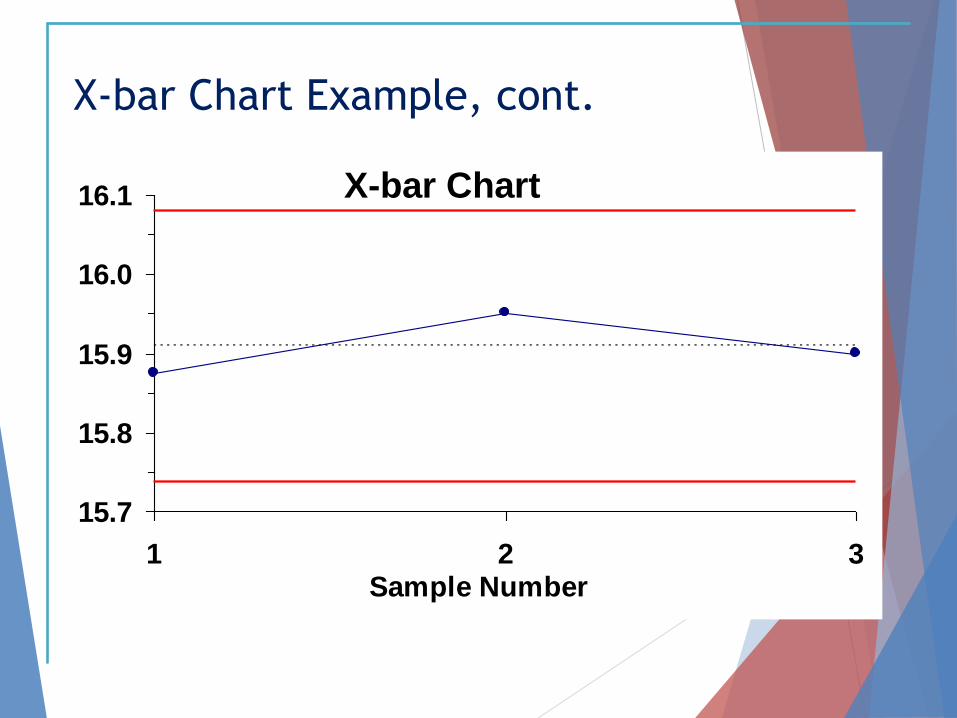
X-bar Chart Example, cont.
X-bar Chart
15.7
15.8
15.9
16.0
16.1
1 2 3Sample Number
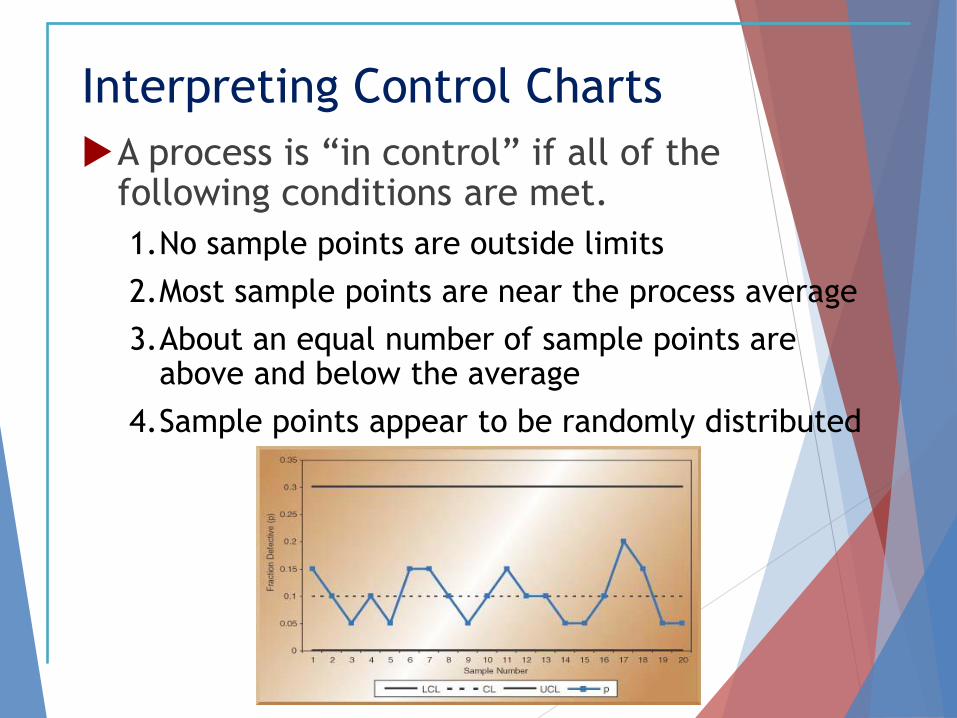
Interpreting Control Charts
A process is “in control” if all of the following conditions are met.
1.No sample points are outside limits
2.Most sample points are near the process average
3.About an equal number of sample points are above and below the average
4.Sample points appear to be randomly distributed
X-bar Chart
24.0
25.0
26.0
27.0
28.0
0 20 40 60 80 100
Sample Number
R Chart
0
2
4
6
8
10
0 10 20 30 40 50 60 70 80 90 100
Sample Number
X-bar Chart
23.0
24.0
25.0
26.0
27.0
28.0
0 20 40 60 80 100
Sample Number
R Chart
0
2
4
6
8
10
0 10 20 30 40 50 60 70 80 90 100
Sample Number
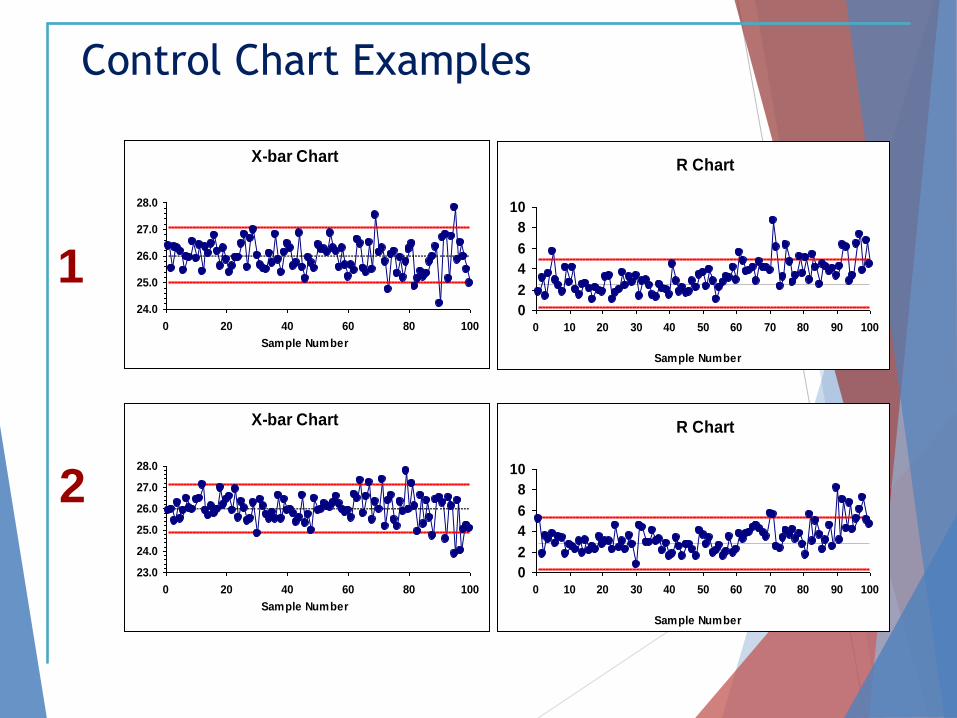
2
1
Control Chart Examples
X-bar Chart
20.0
22.0
24.0
26.0
28.0
30.0
32.0
34.0
0 20 40 60 80 100
Sample Number
R Chart
0
10
20
30
0 10 20 30 40 50 60 70 80 90 100
Sample Number
X-bar Chart
20.0
22.0
24.0
26.0
28.0
30.0
32.0
34.0
0 20 40 60 80 100
Sample Number
R Chart
0
10
20
30
40
0 10 20 30 40 50 60 70 80 90 100
Sample Number
3
4
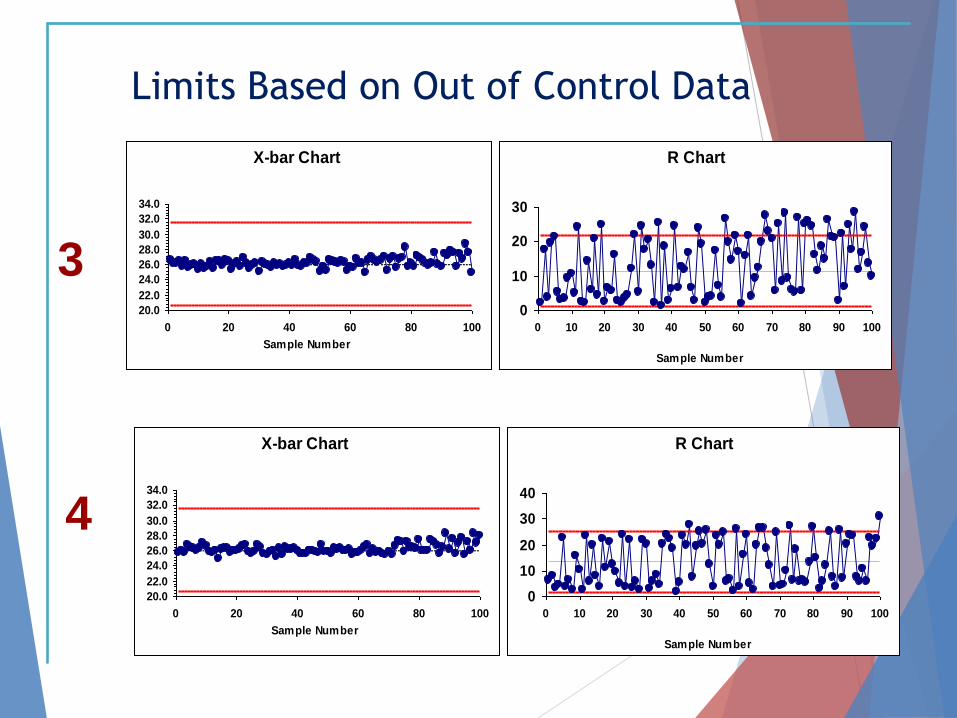
Limits Based on Out of Control Data
What is acceptance sampling?
1. Purposes
A. Determine the quality level of an
incoming shipment or, at the end
production
B. Ensure that the quality level is
within the level that has been
predetermined
What is acceptance sampling?
1. Can be either 100% inspection, or
a few items of a lot.
2. Complete inspection
A. Inspecting each item produced to
see if each item meets the level
desired
B. Used when defective items would be
very detrimental in some way
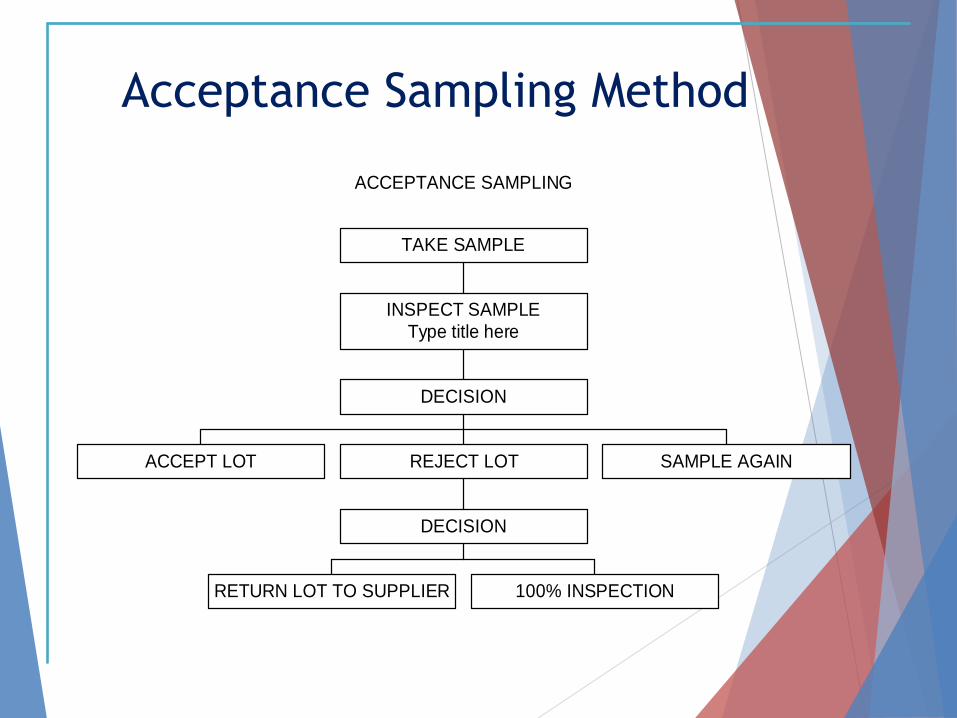
Acceptance Sampling Method
ACCEPTANCE SAMPLING
ACCEPT LOT
RETURN LOT TO SUPPLIER 100% INSPECTION
DECISION
REJECT LOT SAMPLE AGAIN
DECISION
INSPECT SAMPLE
Type title here
TAKE SAMPLE
What is acceptance sampling?
1. Problems with 100% inspection
A. Very expensive
B. When product must be destroyed to
test
C. Inspection must be very tedious so
defective items do not slip through
inspection
Acceptance Sampling –
Advantages
1. Advantages
A. Less handling damages
B. Fewer inspectors to put on payroll
C. 100% inspection costs are to high
D. 100% testing would take to long
Acceptance Sampling –
Disadvantages
1. Disadvantages
A. Risk included in chance of bad lot
“acceptance” and good lot “rejection”
B. Sample taken provides less
information than 100% inspection
When is Acceptance
Sampling Useful?
1. When product testing is:
A. destructive
B. expensive
C. time consuming
2. When developing new products
3. When dealing with new suppliers
4. When a supplier’s product hasn’t had
excellent quality in the past
Risks of Acceptance Sampling
1. Producers Risk
A. The risk associated with a producer
rejecting a lot of materials that
actually have good quality
a. Also referred to as a Type I Error
Risks of Acceptance Sampling
1. Consumers Risk
A. The risk associated with a
consumer accepting a lot of
materials that actually have poor
quality
a. Also referred to as a Type II Error
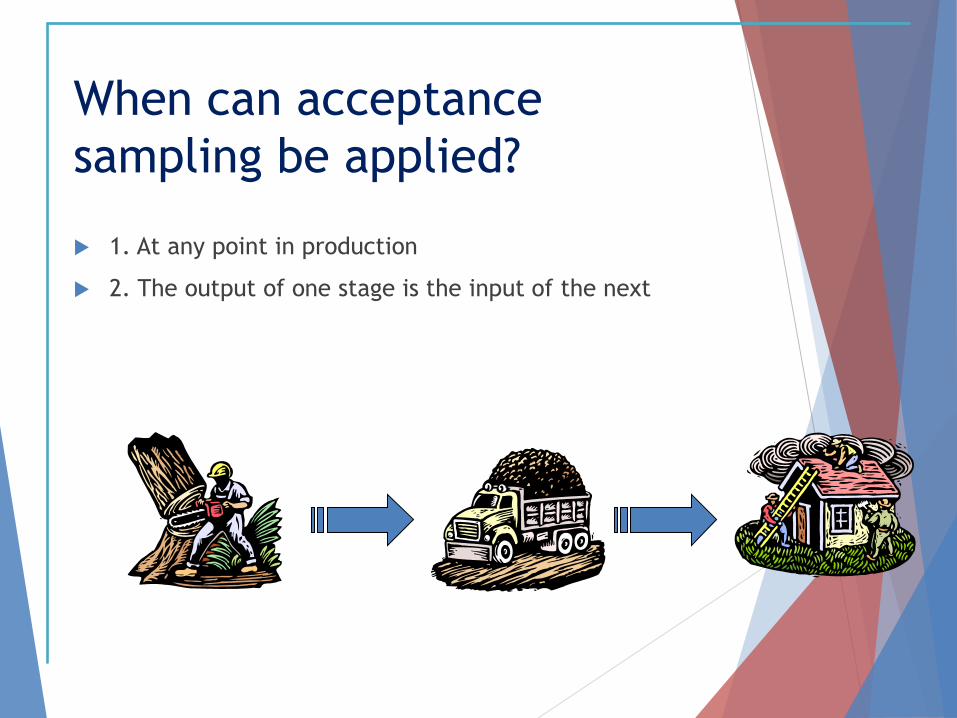
When can acceptance
sampling be applied?
1. At any point in production
2. The output of one stage is the input of the next
When can acceptance
sampling be applied?
1. Sampling at the Input stage
A. Prevents goods that don’t meet
standards from entering into the
process
B. This saves rework time and money
When can acceptance
sampling be applied?
1. Sampling at the Output stage
A. Can reduce the risk of bad quality
being passed on from the process to a
consumer
B. This can prevent the loss of
prestige, customers, and money
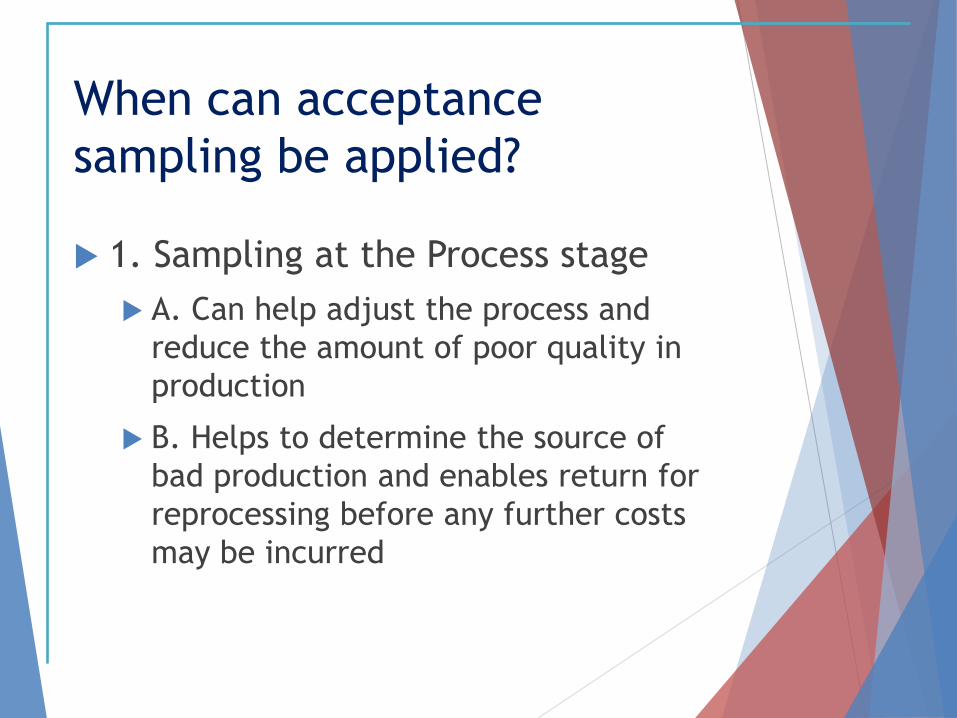
When can acceptance
sampling be applied?
1. Sampling at the Process stage
A. Can help adjust the process and
reduce the amount of poor quality in
production
B. Helps to determine the source of
bad production and enables return for
reprocessing before any further costs
may be incurred
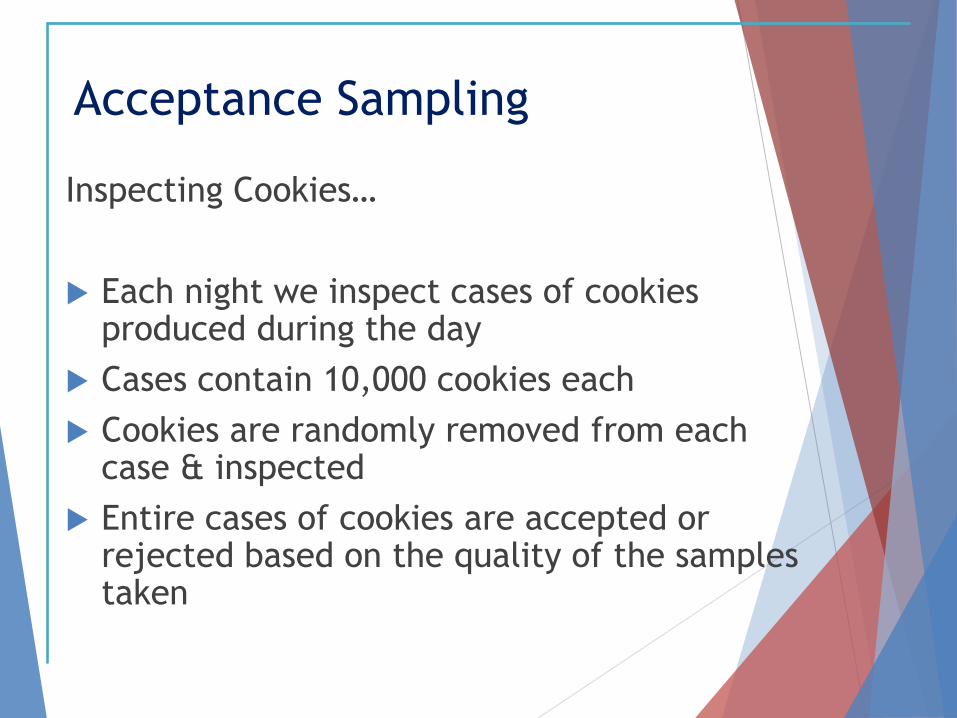
Acceptance Sampling
Inspecting Cookies…
Each night we inspect cases of cookies produced during the day
Cases contain 10,000 cookies each
Cookies are randomly removed from each case & inspected
Entire cases of cookies are accepted or rejected based on the quality of the samples taken
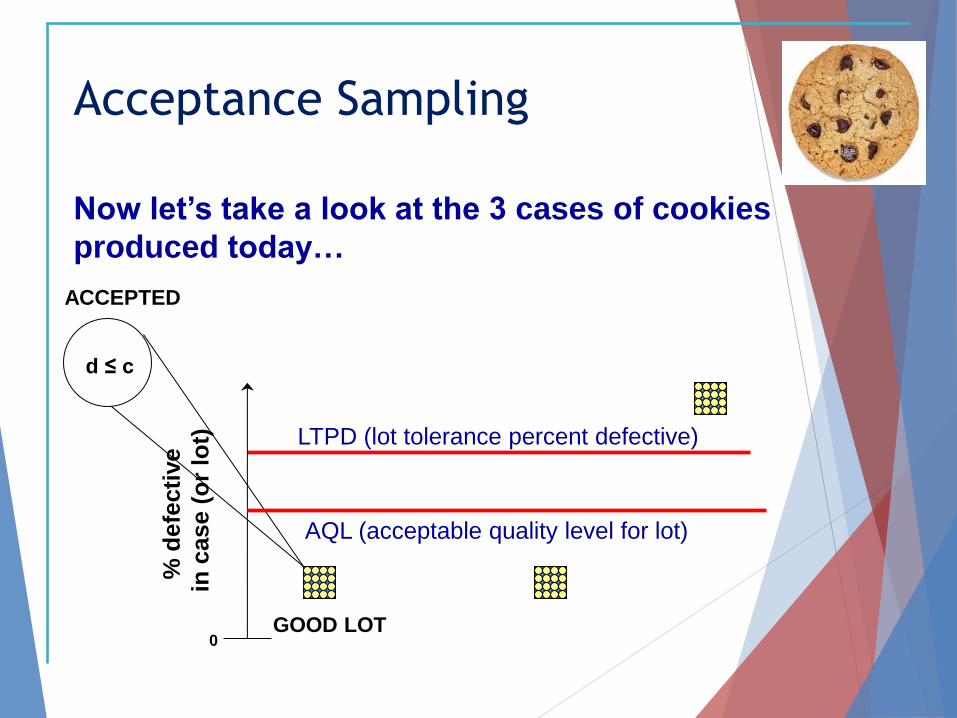
Acceptance Sampling
% d
efe
cti
ve
in c
ase (
or
lot)
d ≤ c
GOOD LOT
ACCEPTED
LTPD (lot tolerance percent defective)
AQL (acceptable quality level for lot)
0
Now let’s take a look at the 3 cases of cookies
produced today…
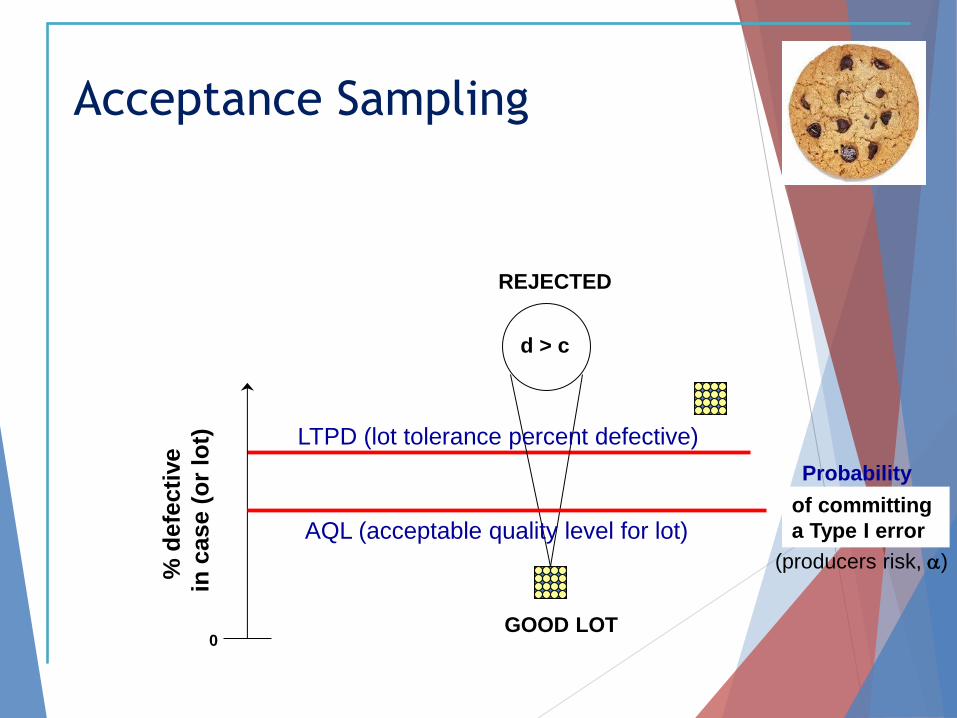
Acceptance Sampling
% d
efe
cti
ve
in c
ase (
or
lot)
d > c
(producers risk, a)
Probability
a good lot
is rejected
GOOD LOT
REJECTED
LTPD (lot tolerance percent defective)
AQL (acceptable quality level for lot) of committing
a Type I error
0
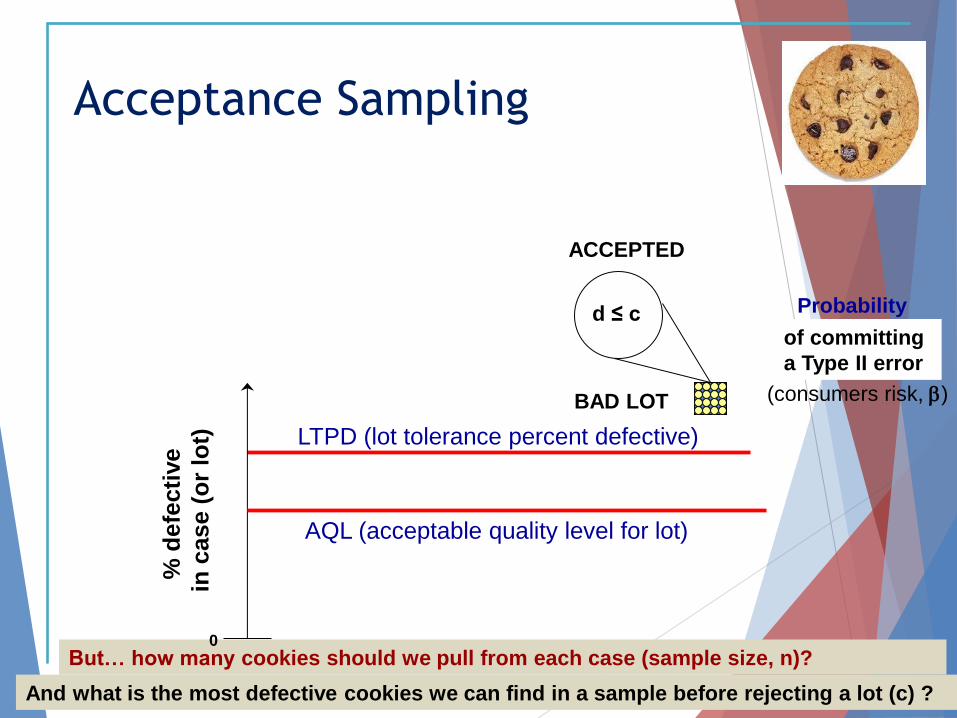
Acceptance Sampling
LTPD (lot tolerance percent defective)
% d
efe
cti
ve
in c
ase (
or
lot)
d ≤ c
BAD LOT
ACCEPTED
Probability
a bad lot
is accepted
(consumers risk, b)
But… how many cookies should we pull from each case (sample size, n)?
And what is the most defective cookies we can find in a sample before rejecting a lot (c) ?
AQL (acceptable quality level for lot)
of committing
a Type II error
0
Wrapup
We looked at SPC and how to use
control charts to monitor processes
…basically an in-control process was one with random
process variation that varied within some control limits
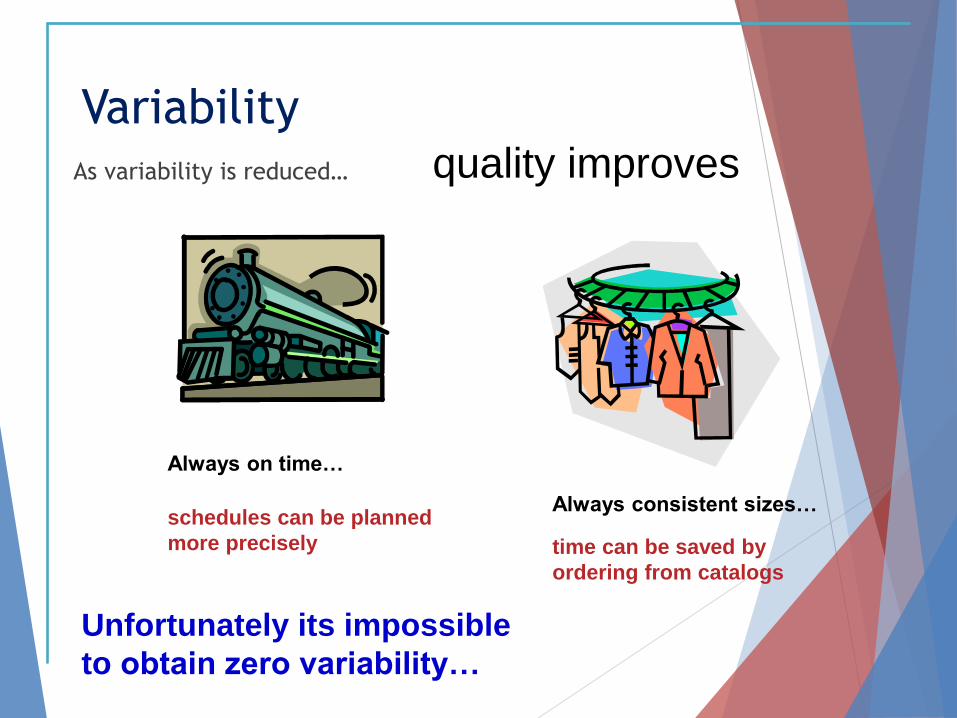
Variability As variability is reduced…
Always on time…
Always consistent sizes… schedules can be planned
more precisely time can be saved by
ordering from catalogs
Unfortunately its impossible
to obtain zero variability…
quality improves
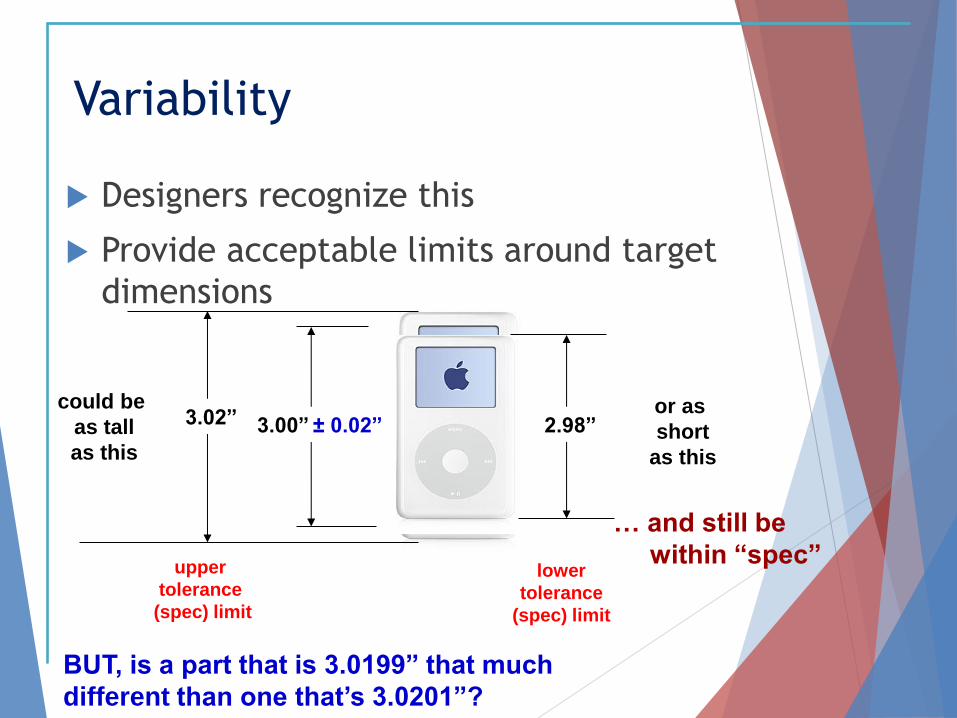
Variability
Designers recognize this
Provide acceptable limits around target
dimensions
± 0.02” 3.02” could be
as tall
as this
… and still be
within “spec” upper
tolerance
(spec) limit
lower
tolerance
(spec) limit
BUT, is a part that is 3.0199” that much
different than one that’s 3.0201”?
2.98” or as
short
as this
3.00”
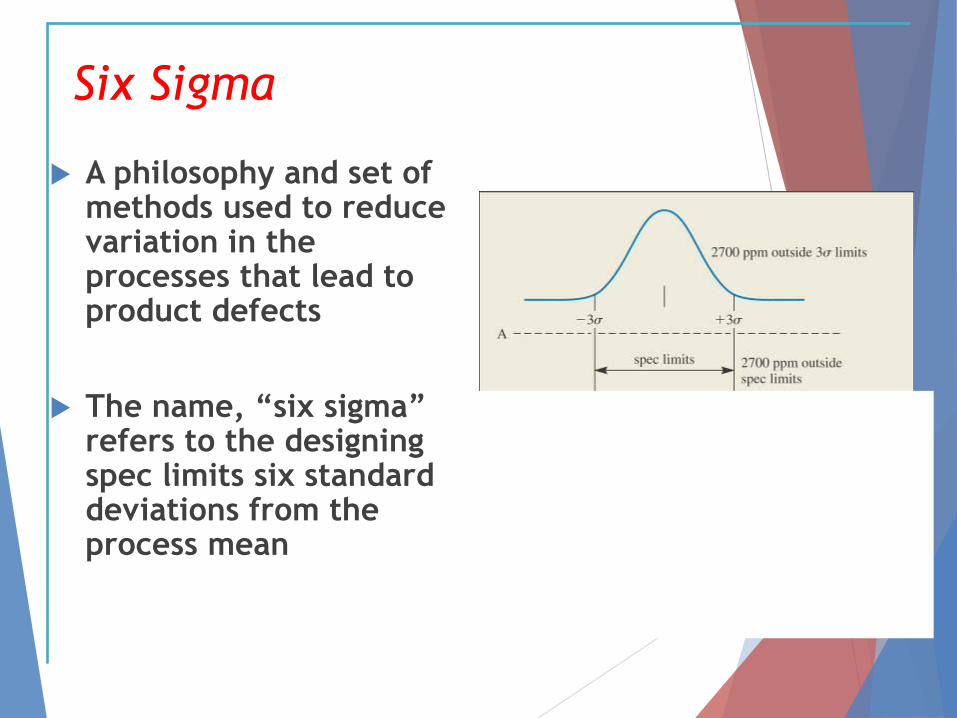
Six Sigma
A philosophy and set of methods used to reduce variation in the processes that lead to product defects
The name, “six sigma” refers to the designing spec limits six standard deviations from the process mean
Summary
Basic concept of Statistical Quality Control
Sources of statistical variations
Types of measurements
Attributes
Variables
Types of Control Charts
Where would each be best used
What is acceptance sampling
Why important
Six Sigma’s basic goal


