Steam Coal vs. Pet Coke Updates and Usage Comparison
Phil Fisher
Pet Coke Consulting
Argus Petroleum Coke Summit
September 16-17, 2010
Houston, TX
www.petcokeconsulting.com cell 01 (415) 265 9324
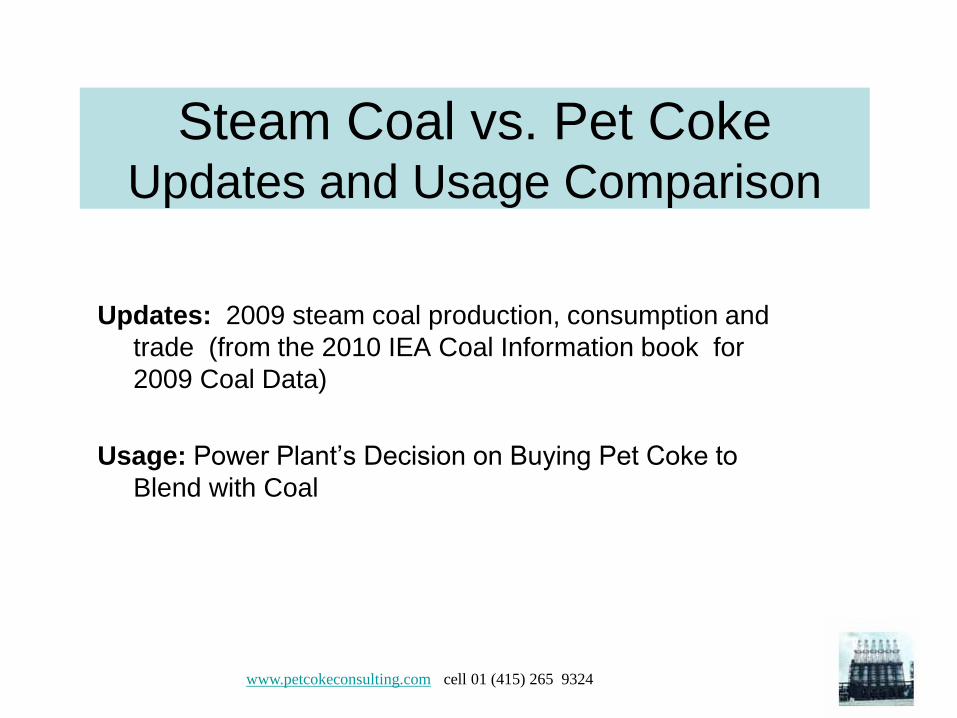
Steam Coal vs. Pet Coke Updates and Usage Comparison
Updates: 2009 steam coal production, consumption and
trade (from the 2010 IEA Coal Information book for
2009 Coal Data)
Usage: Power Plant’s Decision on Buying Pet Coke to
Blend with Coal
www.petcokeconsulting.com cell 01 (415) 265 9324
www.petcokeconsulting.com cell 01 (415) 265 9324
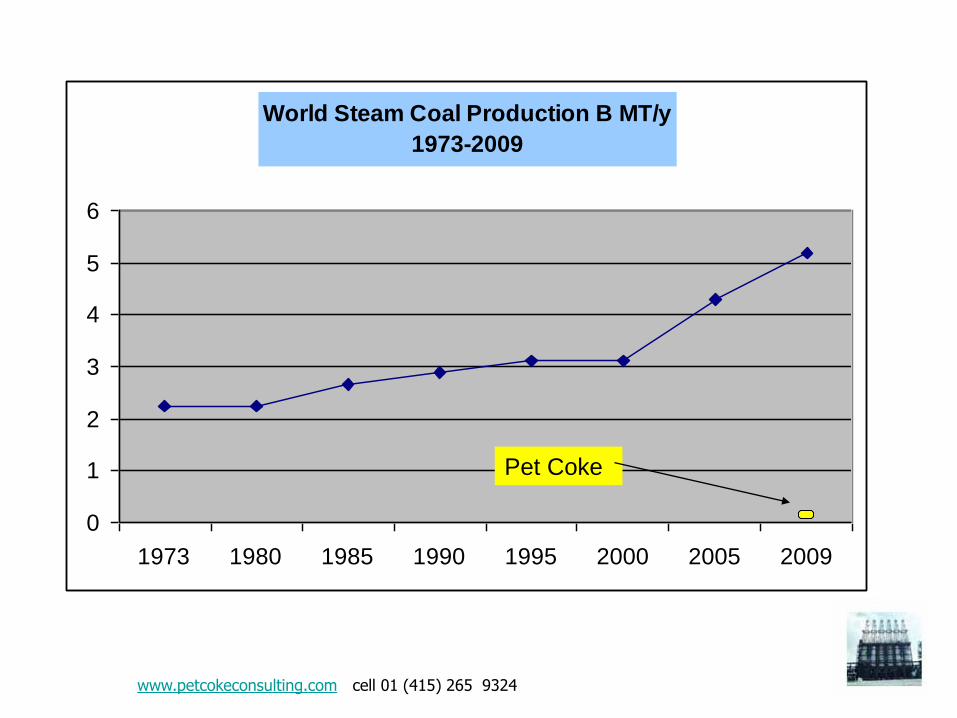
World Steam Coal Production B MT/y
1973-2009
0
1
2
3
4
5
6
1973 1980 1985 1990 1995 2000 2005 2009
Pet Coke
www.petcokeconsulting.com cell 01 (415) 265 9324
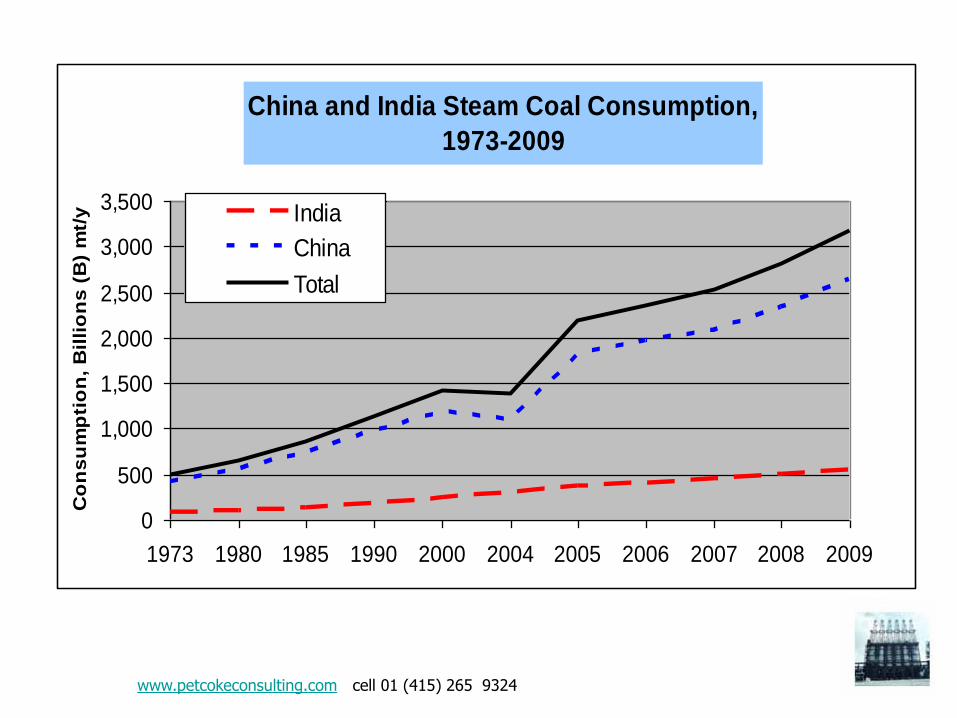
China and India Steam Coal Consumption,
1973-2009
0
500
1,000
1,500
2,000
2,500
3,000
3,500
1973 1980 1985 1990 2000 2004 2005 2006 2007 2008 2009
Co
ns
um
pti
on
, B
illi
on
s (
B)
mt/
y India
China
Total
www.petcokeconsulting.com cell 01 (415) 265 9324
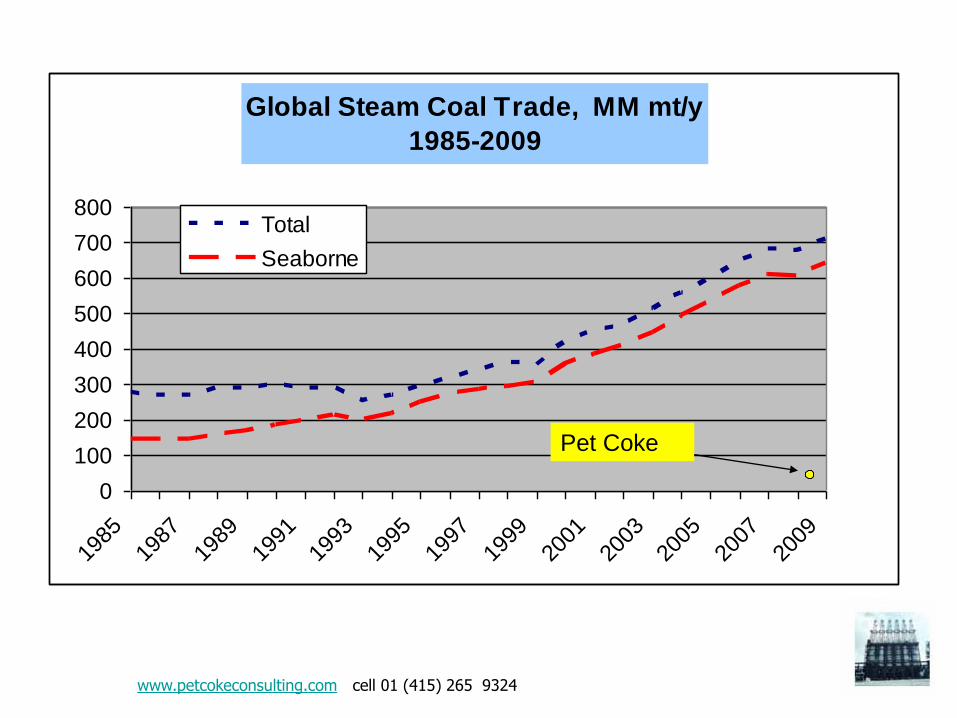
Global Steam Coal Trade, MM mt/y
1985-2009
0
100
200
300
400
500
600
700
800
1985
1987
1989
1991
1993
1995
1997
1999
2001
2003
2005
2007
2009
Total
Seaborne
Pet Coke
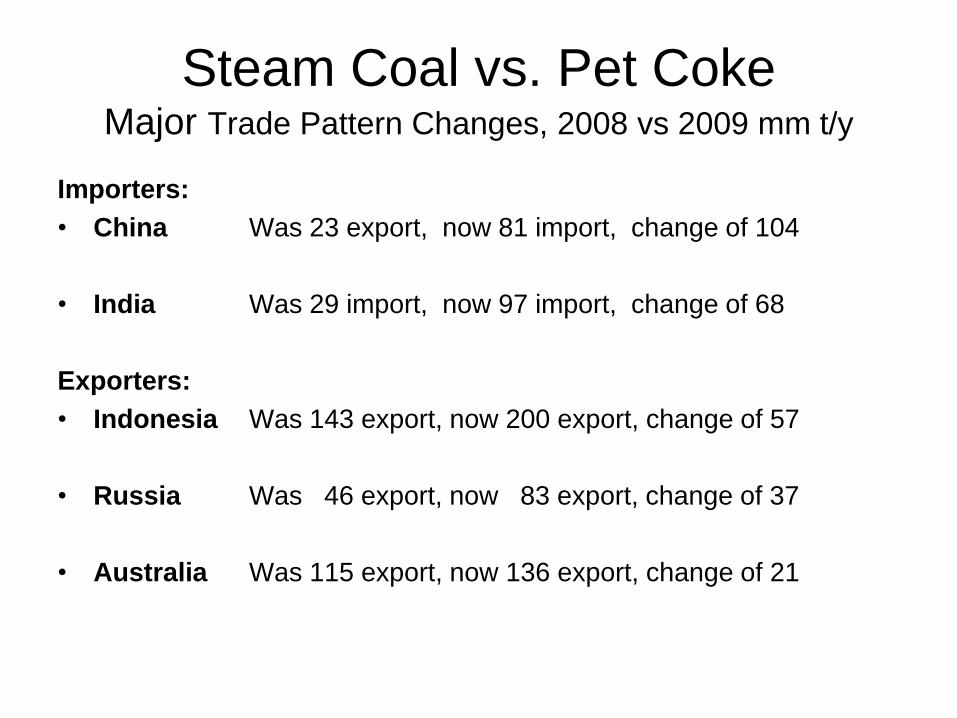
Steam Coal vs. Pet Coke Major Trade Pattern Changes, 2008 vs 2009 mm t/y
Importers:
• China Was 23 export, now 81 import, change of 104
• India Was 29 import, now 97 import, change of 68
Exporters:
• Indonesia Was 143 export, now 200 export, change of 57
• Russia Was 46 export, now 83 export, change of 37
• Australia Was 115 export, now 136 export, change of 21
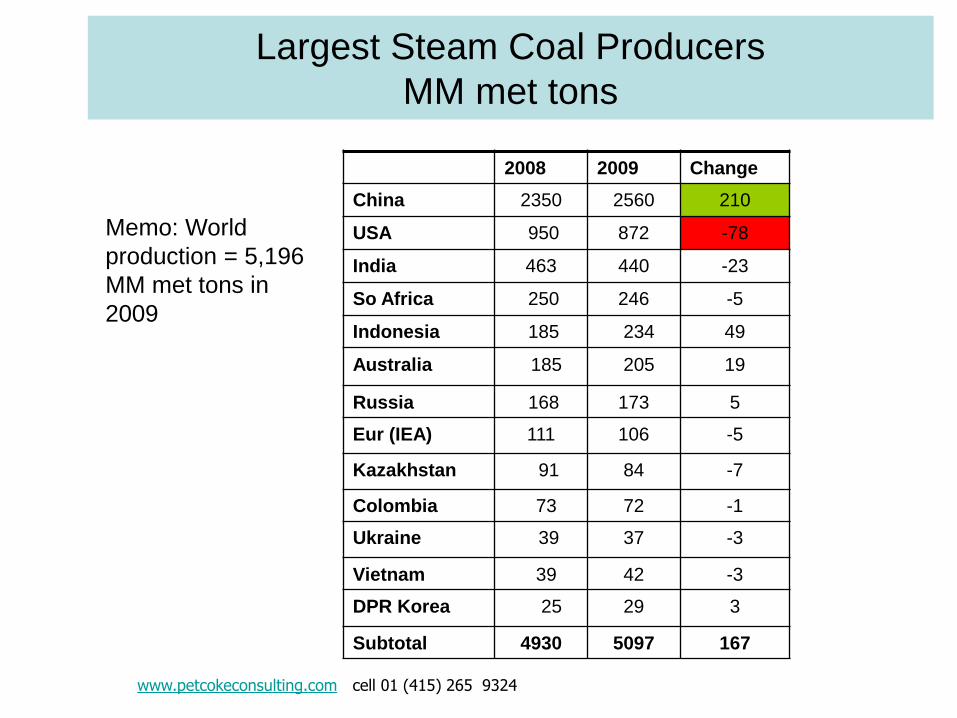
Largest Steam Coal Producers
MM met tons
2008 2009 Change
China 2350 2560 210
USA 950 872 -78
India 463 440 -23
So Africa 250 246 -5
Indonesia 185 234 49
Australia 185 205 19
Russia 168 173 5
Eur (IEA) 111 106 -5
Kazakhstan 91 84 -7
Colombia 73 72 -1
Ukraine 39 37 -3
Vietnam 39 42 -3
DPR Korea 25 29 3
Subtotal 4930 5097 167
www.petcokeconsulting.com cell 01 (415) 265 9324
Memo: World
production = 5,196
MM met tons in
2009
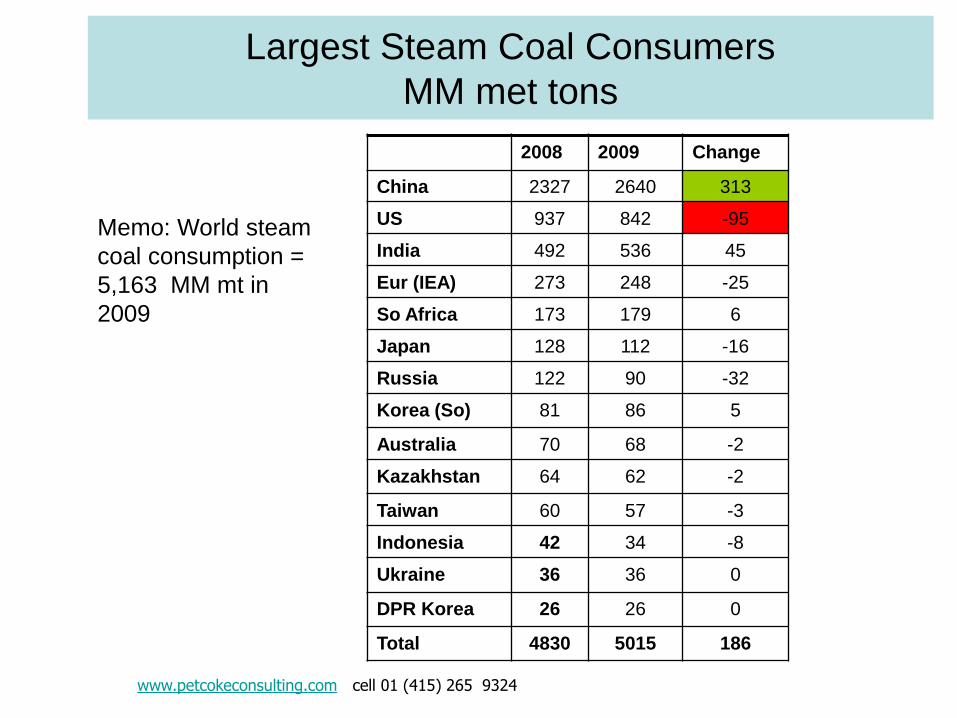
Largest Steam Coal Consumers
MM met tons
2008 2009 Change
China 2327 2640 313
US 937 842 -95
India 492 536 45
Eur (IEA) 273 248 -25
So Africa 173 179 6
Japan 128 112 -16
Russia 122 90 -32
Korea (So) 81 86 5
Australia 70 68 -2
Kazakhstan 64 62 -2
Taiwan 60 57 -3
Indonesia 42 34 -8
Ukraine 36 36 0
DPR Korea 26 26 0
Total 4830 5015 186
www.petcokeconsulting.com cell 01 (415) 265 9324
Memo: World steam
coal consumption =
5,163 MM mt in
2009
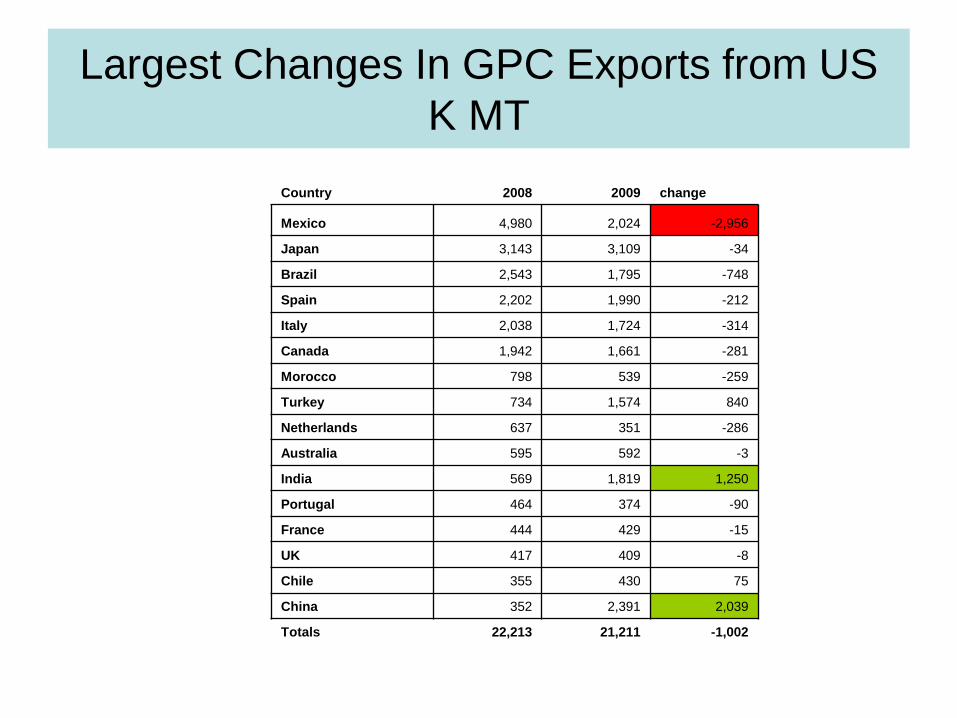
Largest Changes In GPC Exports from US
K MT
Country 2008 2009 change
Mexico 4,980 2,024 -2,956
Japan 3,143 3,109 -34
Brazil 2,543 1,795 -748
Spain 2,202 1,990 -212
Italy 2,038 1,724 -314
Canada 1,942 1,661 -281
Morocco 798 539 -259
Turkey 734 1,574 840
Netherlands 637 351 -286
Australia 595 592 -3
India 569 1,819 1,250
Portugal 464 374 -90
France 444 429 -15
UK 417 409 -8
Chile 355 430 75
China 352 2,391 2,039
Totals 22,213 21,211 -1,002
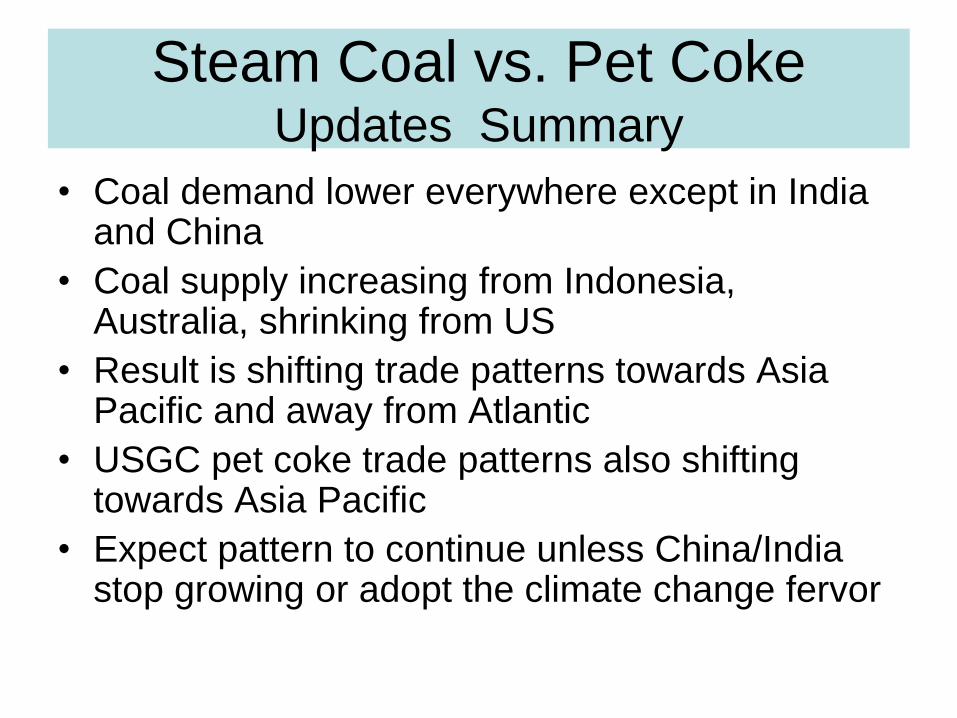
• Coal demand lower everywhere except in India and China
• Coal supply increasing from Indonesia, Australia, shrinking from US
• Result is shifting trade patterns towards Asia Pacific and away from Atlantic
• USGC pet coke trade patterns also shifting towards Asia Pacific
• Expect pattern to continue unless China/India stop growing or adopt the climate change fervor
Steam Coal vs. Pet Coke Updates Summary
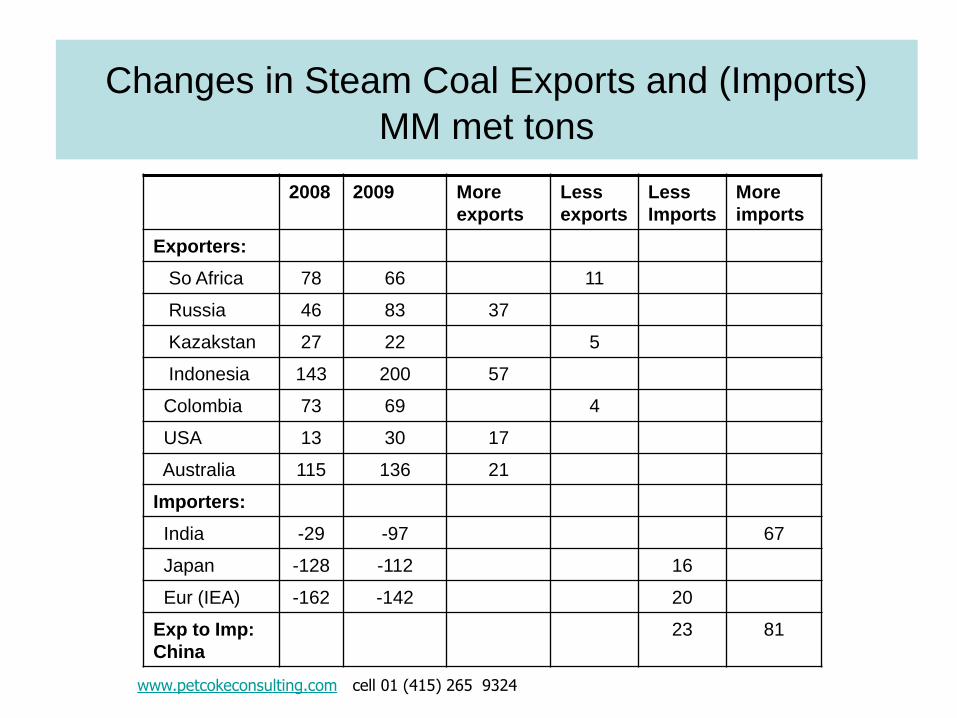
Changes in Steam Coal Exports and (Imports) MM met tons
2008 2009 More
exports
Less
exports
Less
Imports
More
imports
Exporters:
So Africa 78 66 11
Russia 46 83 37
Kazakstan 27 22 5
Indonesia 143 200 57
Colombia 73 69 4
USA 13 30 17
Australia 115 136 21
Importers:
India -29 -97 67
Japan -128 -112 16
Eur (IEA) -162 -142 20
Exp to Imp:
China
23 81
www.petcokeconsulting.com cell 01 (415) 265 9324
Steam Coal vs. Pet Coke:
What do I buy?
A look at a Power Plant’s decision
process
Phil Fisher
Pet Coke Consulting
www.petcokeconsulting.com
cell 01 (415) 265 9324
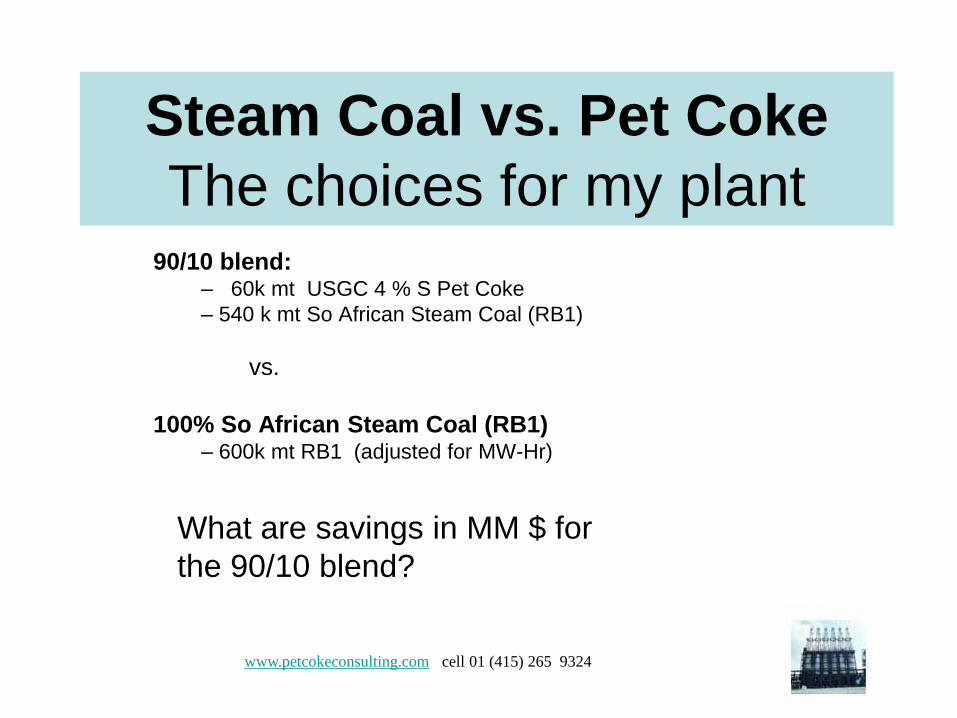
Steam Coal vs. Pet Coke
The choices for my plant 90/10 blend:
– 60k mt USGC 4 % S Pet Coke
– 540 k mt So African Steam Coal (RB1)
vs.
100% So African Steam Coal (RB1) – 600k mt RB1 (adjusted for MW-Hr)
www.petcokeconsulting.com cell 01 (415) 265 9324
What are savings in MM $ for
the 90/10 blend?
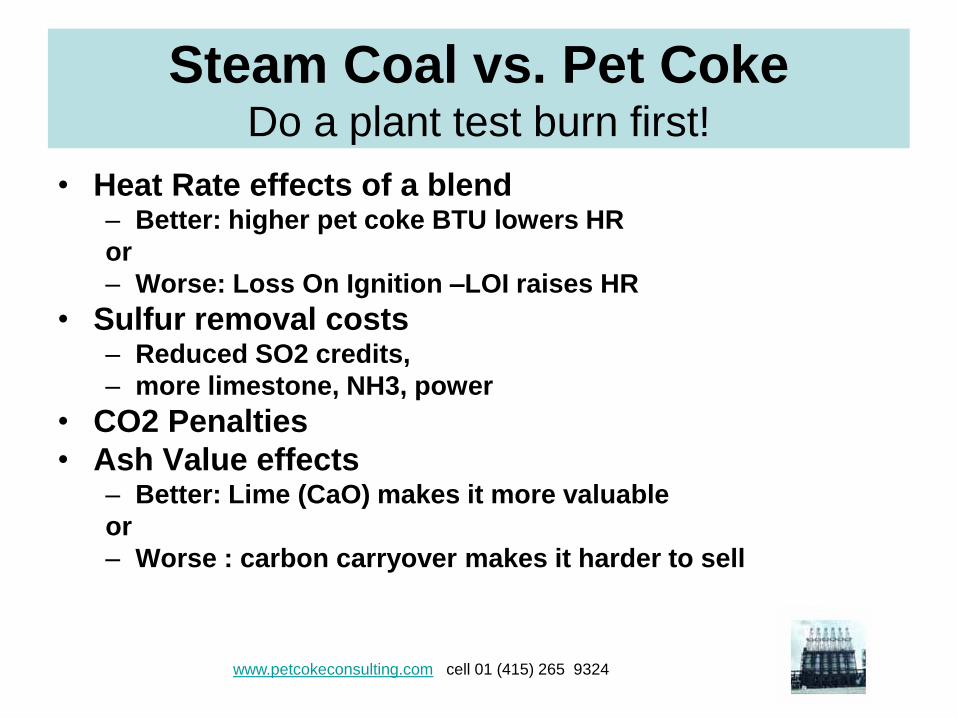
Steam Coal vs. Pet Coke Do a plant test burn first!
• Heat Rate effects of a blend – Better: higher pet coke BTU lowers HR
or
– Worse: Loss On Ignition –LOI raises HR
• Sulfur removal costs – Reduced SO2 credits,
– more limestone, NH3, power
• CO2 Penalties
• Ash Value effects – Better: Lime (CaO) makes it more valuable
or
– Worse : carbon carryover makes it harder to sell
www.petcokeconsulting.com cell 01 (415) 265 9324
Steam Coal vs. Pet Coke After the test burn
• Run calculations using current coal,
coke prices and freight of each
• If savings, is it enough to cover the
“intangibles”
www.petcokeconsulting.com cell 01 (415) 265 9324
Steam Coal vs. Pet Coke Power Plant Major Assumptions:
• Northern Europe (near an ARAGT terminal)
• Truck both from terminal to plant
• Conventional PC boiler designed for RB1 that can burn 10% pet coke (with some associated LOI)
• Assumed effects for the Blend are: – Heat Rate increases (boiler efficiency drops)
– CO2 Penalty for pet coke incurred
– Ash value decreases
– Sulfur Removal costs increase
www.petcokeconsulting.com cell 01 (415) 265 9324
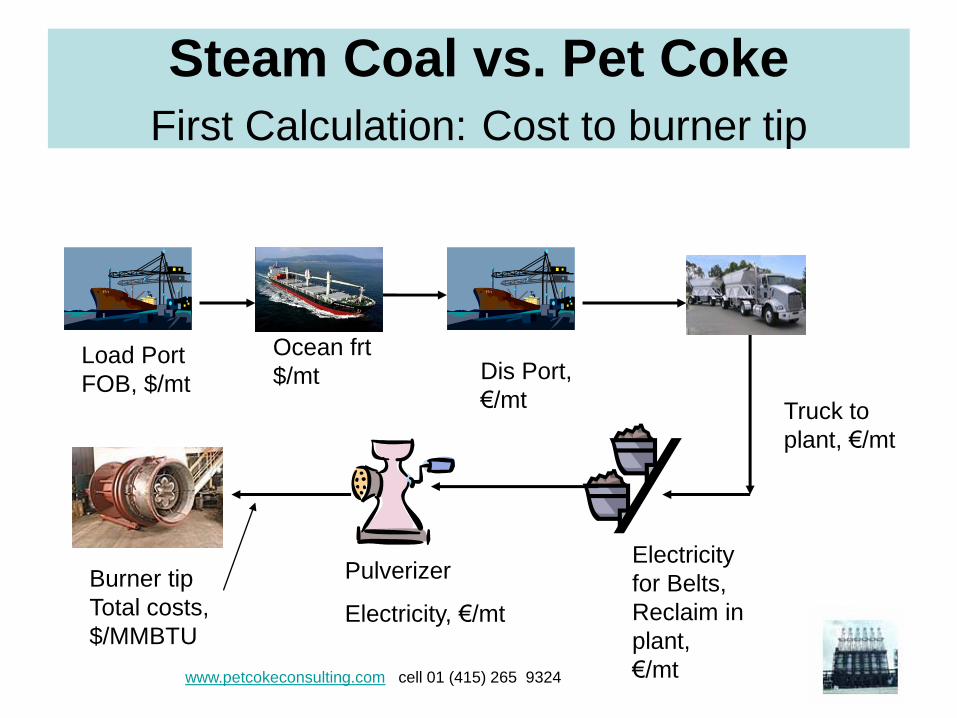
Steam Coal vs. Pet Coke
First Calculation: Cost to burner tip
Load Port
FOB, $/mt
Ocean frt
$/mt Dis Port,
€/mt Truck to
plant, €/mt
Electricity
for Belts,
Reclaim in
plant,
€/mt
Pulverizer
Electricity, €/mt
Burner tip
Total costs,
$/MMBTU
www.petcokeconsulting.com cell 01 (415) 265 9324
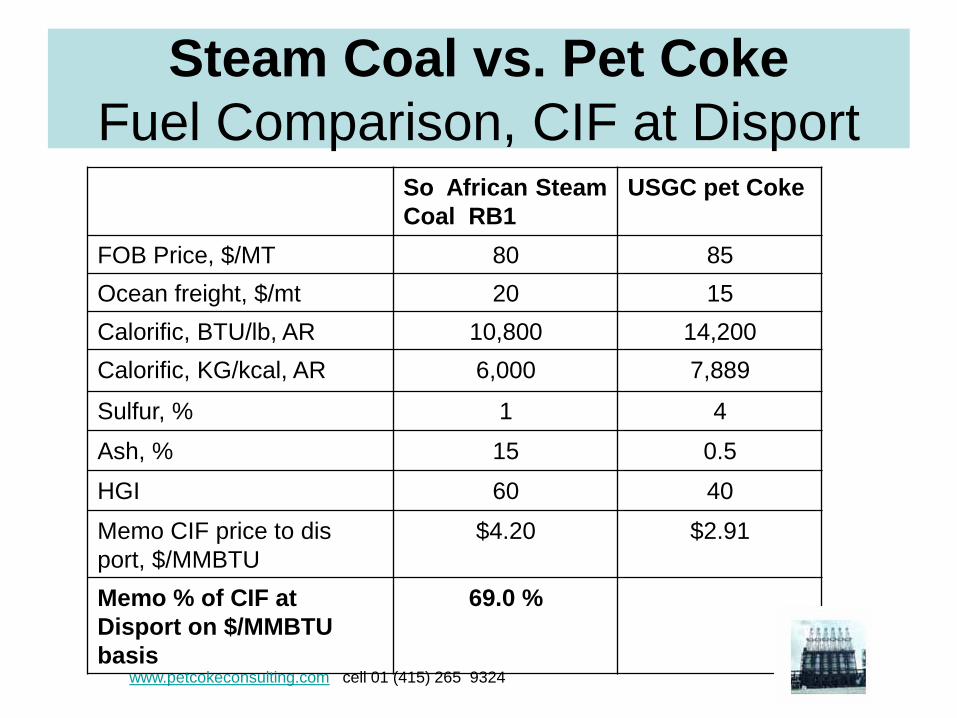
Steam Coal vs. Pet Coke
Fuel Comparison, CIF at Disport So African Steam
Coal RB1
USGC pet Coke
FOB Price, $/MT 80 85
Ocean freight, $/mt 20 15
Calorific, BTU/lb, AR 10,800 14,200
Calorific, KG/kcal, AR 6,000 7,889
Sulfur, % 1 4
Ash, % 15 0.5
HGI 60 40
Memo CIF price to dis
port, $/MMBTU
$4.20 $2.91
Memo % of CIF at
Disport on $/MMBTU
basis
69.0 %
www.petcokeconsulting.com cell 01 (415) 265 9324
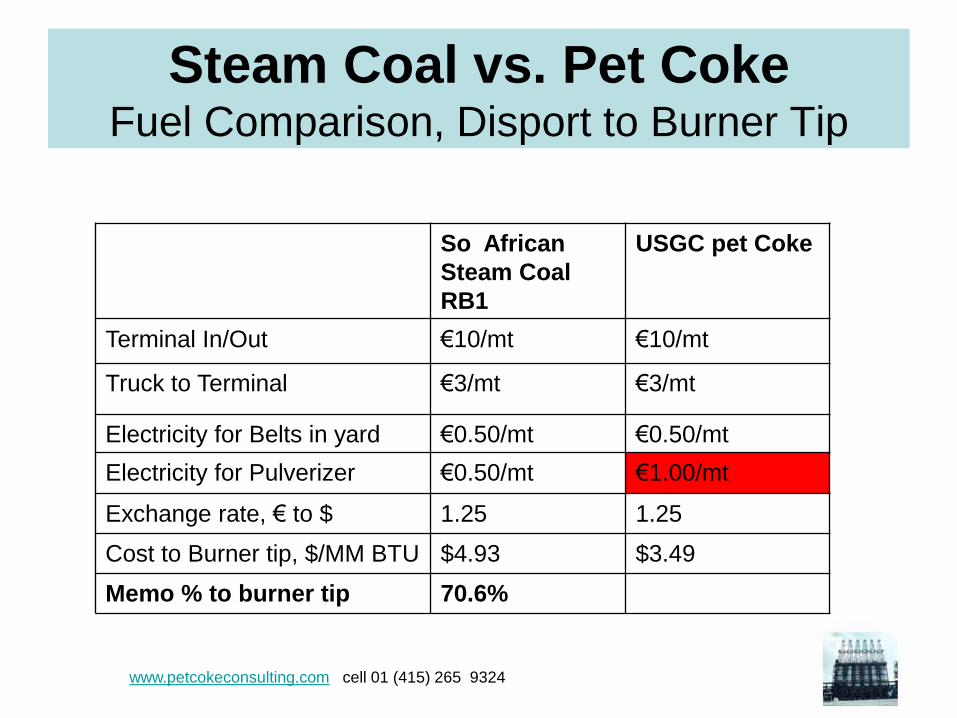
Steam Coal vs. Pet Coke Fuel Comparison, Disport to Burner Tip
So African
Steam Coal
RB1
USGC pet Coke
Terminal In/Out €10/mt €10/mt
Truck to Terminal €3/mt €3/mt
Electricity for Belts in yard €0.50/mt €0.50/mt
Electricity for Pulverizer €0.50/mt €1.00/mt
Exchange rate, € to $ 1.25 1.25
Cost to Burner tip, $/MM BTU $4.93 $3.49
Memo % to burner tip 70.6%
www.petcokeconsulting.com cell 01 (415) 265 9324
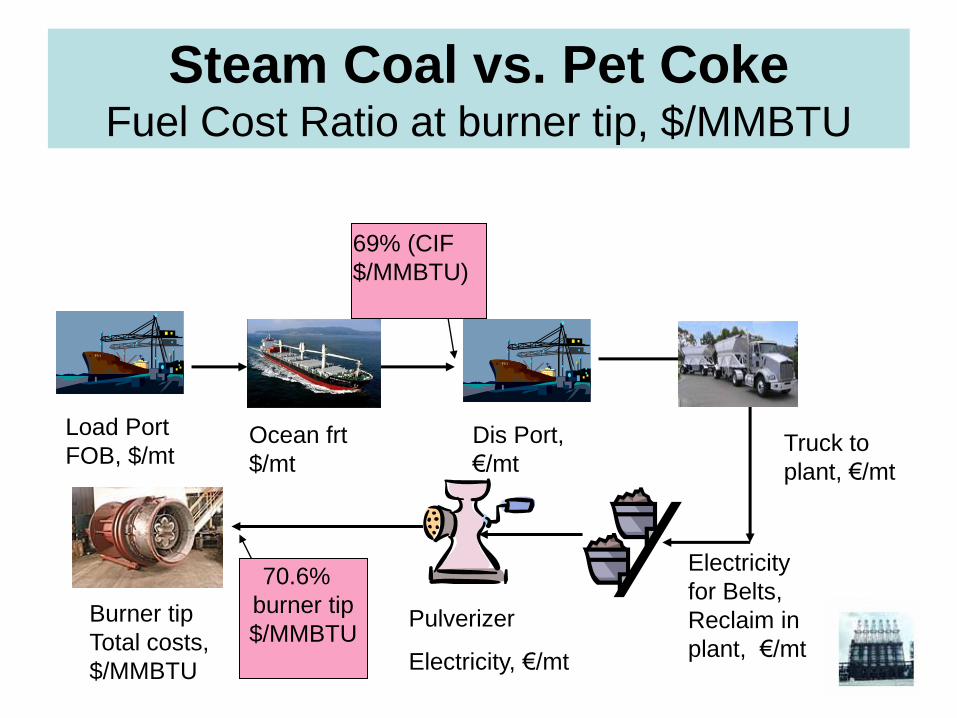
Steam Coal vs. Pet Coke Fuel Cost Ratio at burner tip, $/MMBTU
Load Port
FOB, $/mt Ocean frt
$/mt
Dis Port,
€/mt Truck to
plant, €/mt
Electricity
for Belts,
Reclaim in
plant, €/mt
Pulverizer
Electricity, €/mt
Burner tip
Total costs,
$/MMBTU
69% (CIF
$/MMBTU)
70.6%
burner tip
$/MMBTU
Steam Coal vs. Pet Coke
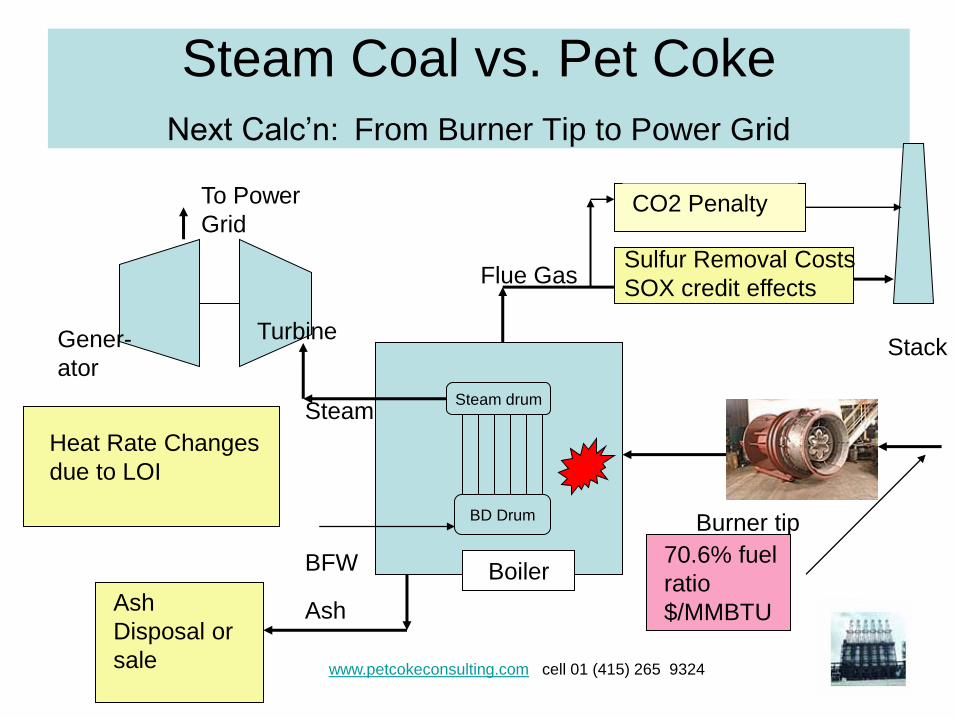
Next Calc’n: From Burner Tip to Power Grid
Burner tip
Sulfur Removal Costs
SOX credit effects
Steam drum
BD Drum
Turbine Gener-
ator
To Power
Grid
Steam
BFW 70.6% fuel
ratio
$/MMBTU
Boiler
Ash
Disposal or
sale
Heat Rate Changes
due to LOI
www.petcokeconsulting.com cell 01 (415) 265 9324
Flue Gas
Ash
Stack
CO2 Penalty
Steam Coal vs. Pet Coke From Burner Tip to Power Grid, Base Case Parameters
Burner tip
Sulfur & SOx
+1$ /mt of feed
Steam drum
BD Drum
Turbine Gener-
ator
To Power
Grid
Steam
BFW 70.6%
fuel ratio
$/MMBTU
Boiler Ash value
difference:
($10/mt)/of
ash
Heat Rate Change:
From 10 to 10.1
MMBTU / MW-Hr
www.petcokeconsulting.com cell 01 (415) 265 9324
Stack CO2
+$3/mt of coke
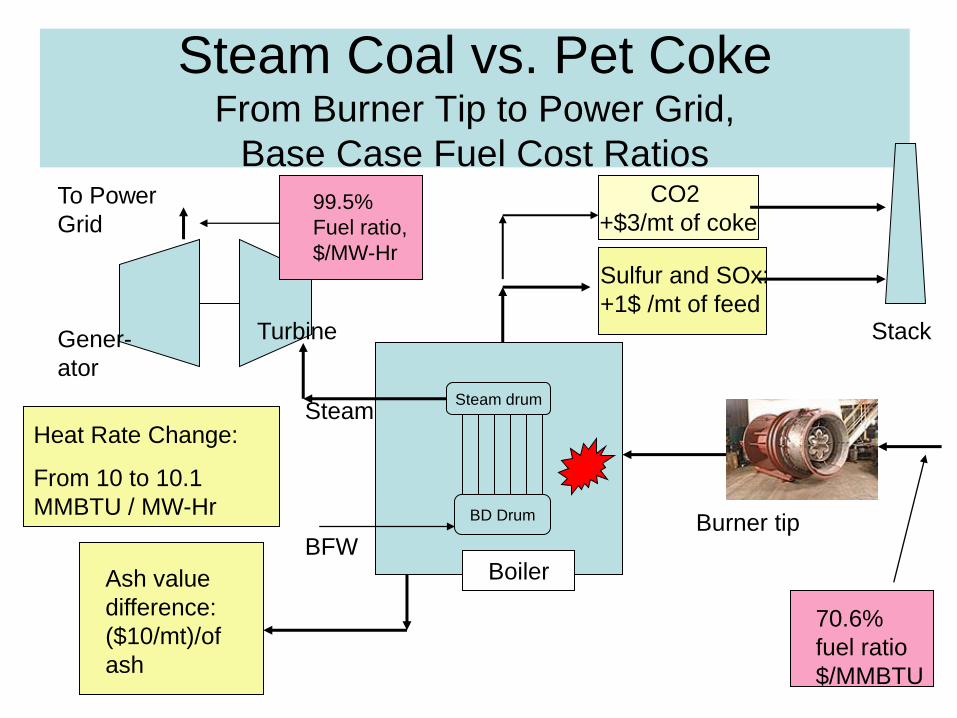
Steam Coal vs. Pet Coke From Burner Tip to Power Grid,
Base Case Fuel Cost Ratios
Burner tip
Sulfur and SOx:
+1$ /mt of feed
Steam drum
BD Drum
Turbine Gener-
ator
To Power
Grid
Steam
BFW
99.5%
Fuel ratio,
$/MW-Hr
70.6%
fuel ratio
$/MMBTU
Boiler Ash value
difference:
($10/mt)/of
ash
Heat Rate Change:
From 10 to 10.1
MMBTU / MW-Hr
Stack
CO2
+$3/mt of coke
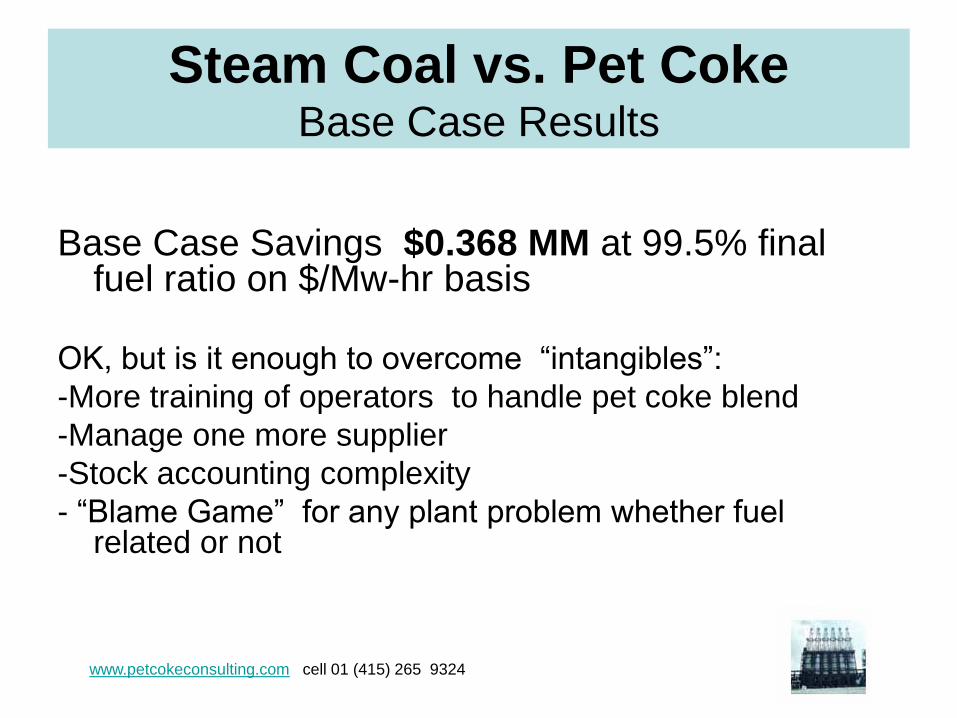
Steam Coal vs. Pet Coke Base Case Results
Base Case Savings $0.368 MM at 99.5% final fuel ratio on $/Mw-hr basis
OK, but is it enough to overcome “intangibles”:
-More training of operators to handle pet coke blend
-Manage one more supplier
-Stock accounting complexity
- “Blame Game” for any plant problem whether fuel related or not
www.petcokeconsulting.com cell 01 (415) 265 9324
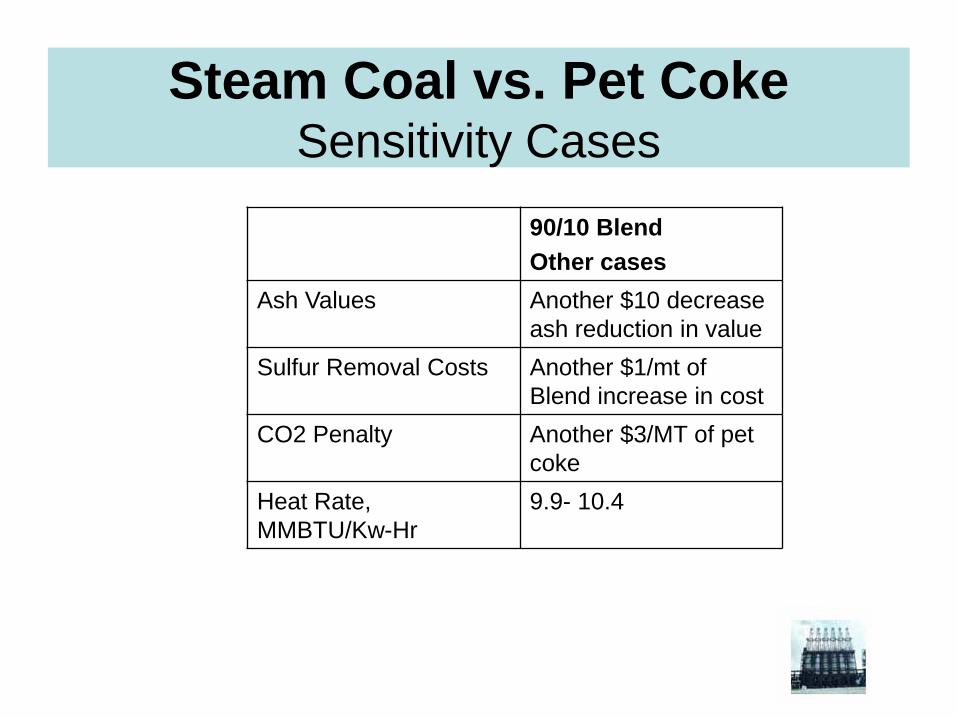
Steam Coal vs. Pet Coke Sensitivity Cases
90/10 Blend
Other cases
Ash Values Another $10 decrease
ash reduction in value
Sulfur Removal Costs Another $1/mt of
Blend increase in cost
CO2 Penalty Another $3/MT of pet
coke
Heat Rate,
MMBTU/Kw-Hr
9.9- 10.4
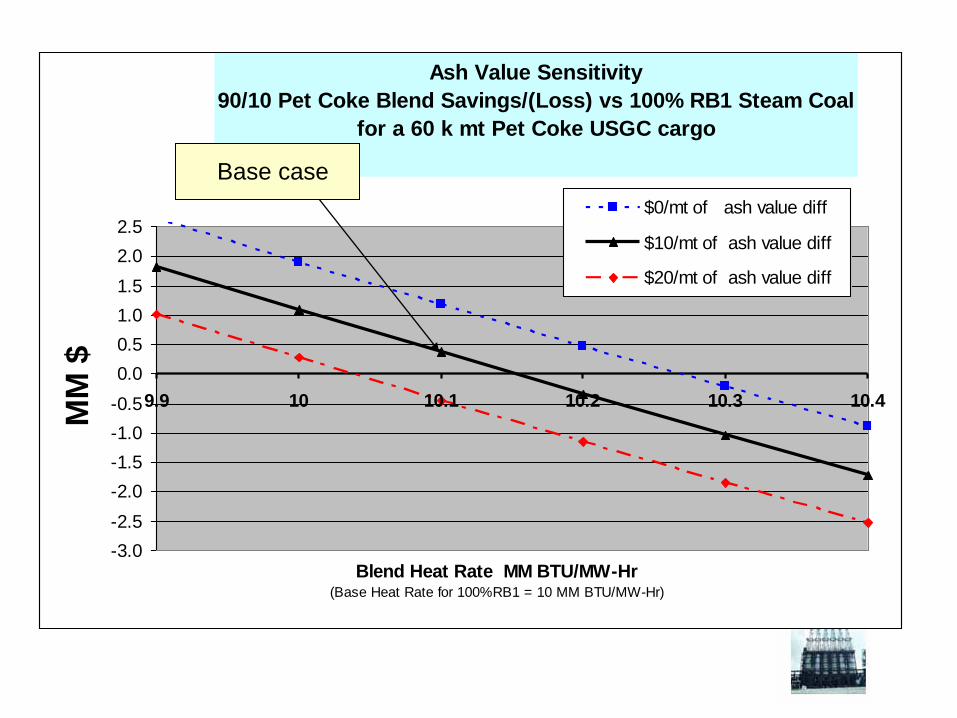
Ash Value Sensitivity
90/10 Pet Coke Blend Savings/(Loss) vs 100% RB1 Steam Coal
for a 60 k mt Pet Coke USGC cargo
-3.0
-2.5
-2.0
-1.5
-1.0
-0.5
0.0
0.5
1.0
1.5
2.0
2.5
9.9 10 10.1 10.2 10.3 10.4
Blend Heat Rate MM BTU/MW-Hr(Base Heat Rate for 100%RB1 = 10 MM BTU/MW-Hr)
MM
$
$0/mt of ash value diff
$10/mt of ash value diff
$20/mt of ash value diff
Base case
Base case
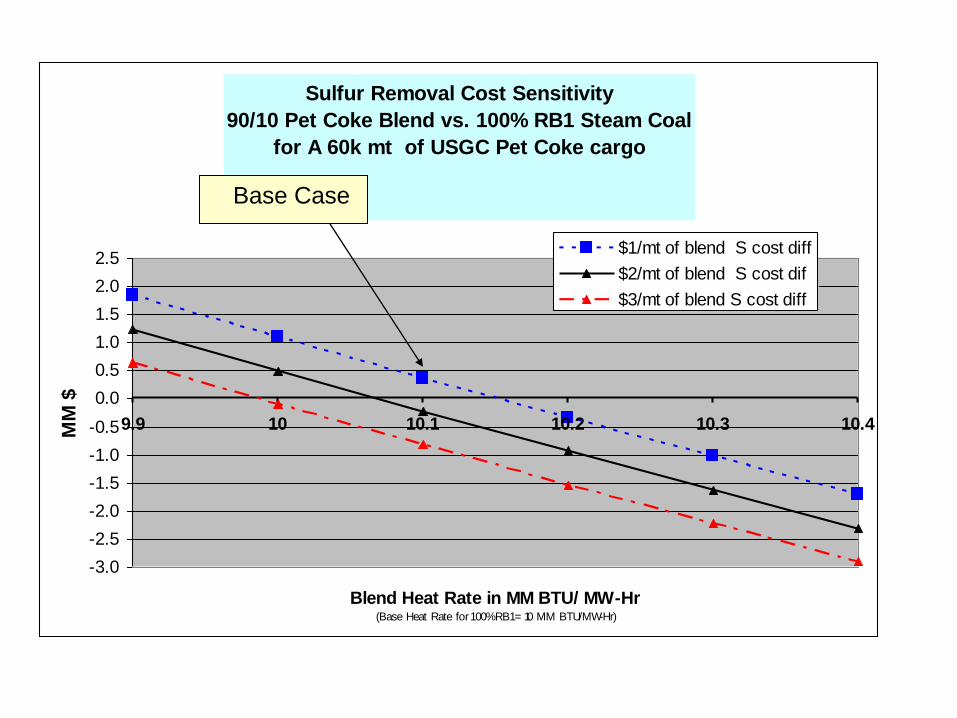
Sulfur Removal Cost Sensitivity
90/10 Pet Coke Blend vs. 100% RB1 Steam Coal
for A 60k mt of USGC Pet Coke cargo
-3.0
-2.5
-2.0
-1.5
-1.0
-0.5
0.0
0.5
1.0
1.5
2.0
2.5
9.9 10 10.1 10.2 10.3 10.4
Blend Heat Rate in MM BTU/ MW-Hr(Base Heat Rate for 1 00% RB1 = 10 MM BTU/MW-Hr)
MM
$
$1/mt of blend S cost diff
$2/mt of blend S cost dif
$3/mt of blend S cost diff
Base Case
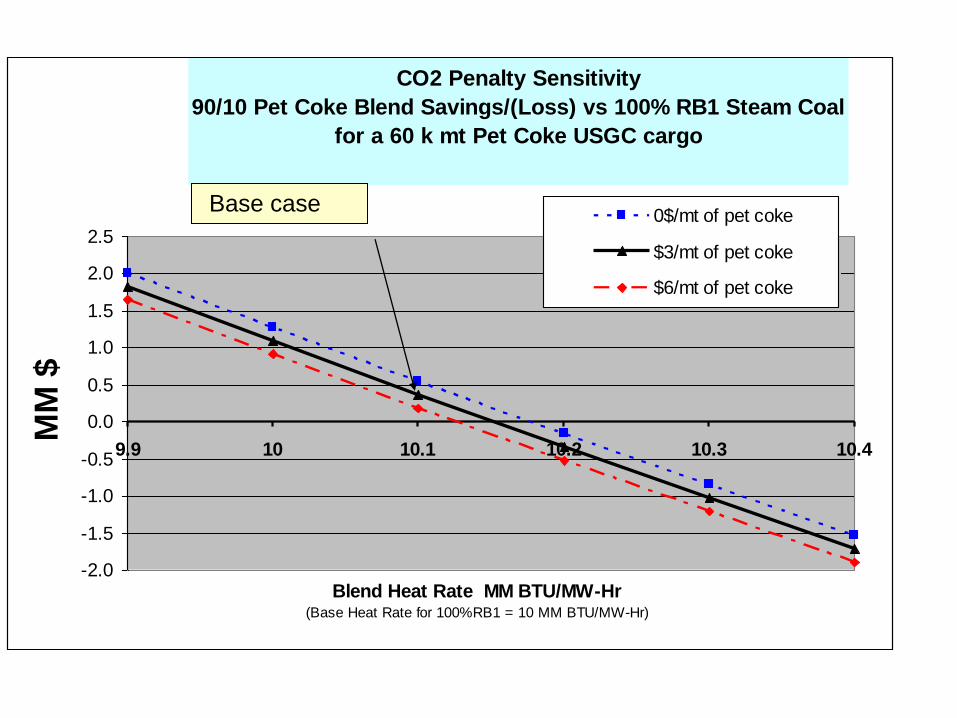
CO2 Penalty Sensitivity
90/10 Pet Coke Blend Savings/(Loss) vs 100% RB1 Steam Coal
for a 60 k mt Pet Coke USGC cargo
-2.0
-1.5
-1.0
-0.5
0.0
0.5
1.0
1.5
2.0
2.5
9.9 10 10.1 10.2 10.3 10.4
Blend Heat Rate MM BTU/MW-Hr(Base Heat Rate for 100%RB1 = 10 MM BTU/MW-Hr)
MM
$
0$/mt of pet coke
$3/mt of pet coke
$6/mt of pet coke
Base case
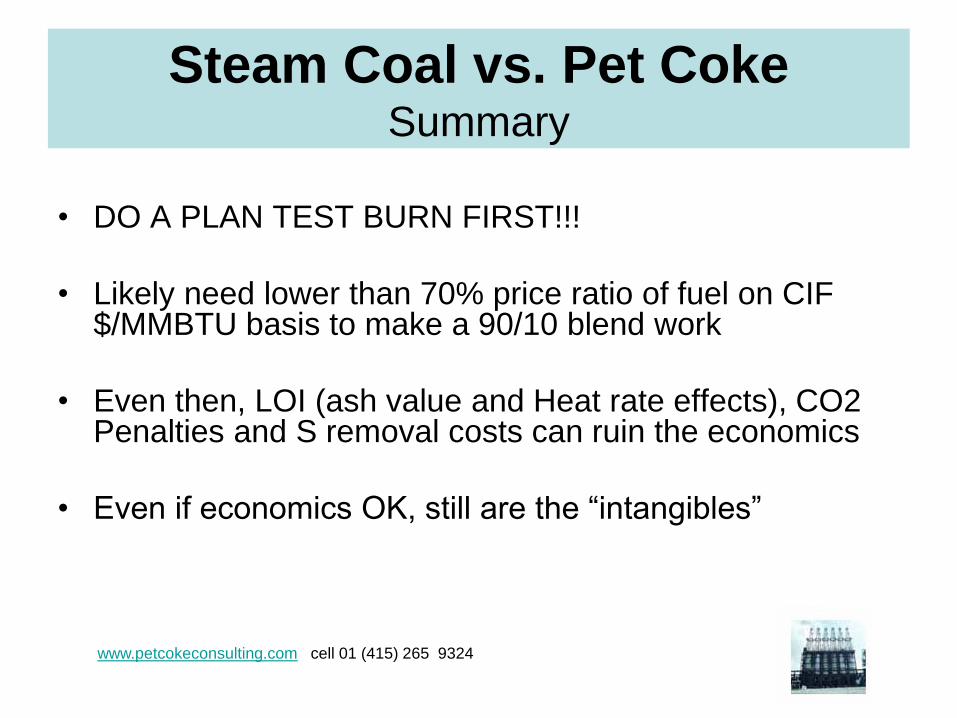
Steam Coal vs. Pet Coke Summary
• DO A PLAN TEST BURN FIRST!!!
• Likely need lower than 70% price ratio of fuel on CIF $/MMBTU basis to make a 90/10 blend work
• Even then, LOI (ash value and Heat rate effects), CO2 Penalties and S removal costs can ruin the economics
• Even if economics OK, still are the “intangibles”
www.petcokeconsulting.com cell 01 (415) 265 9324


