
CE 331, Summer 2013 Analysis of Steel Braced Frame Bldg 1 / 13
Check the strength of each type of member in the one‐story steel‐frame building below.
4 @ 8ft
20f
32ft
20ft
Plan View Side Elevation
Front Elevation
3 @
25ft
A B
1
2
3
4
Fy = 50ksi all members
Fu = 65ksi
Shape
Purlins W12x40
Girders W21x44
Columns W16x36
Loads:
3.5” thick light‐weight concrete slab (unit weight = 120 pcf)
LL = 40 psf
WL = 30 psf
Load Combinations:
1.2D + 1.6L 1.2D + 1.6W
CE 331, Summer 2013 Analysis of Steel Braced Frame Bldg 2 / 13
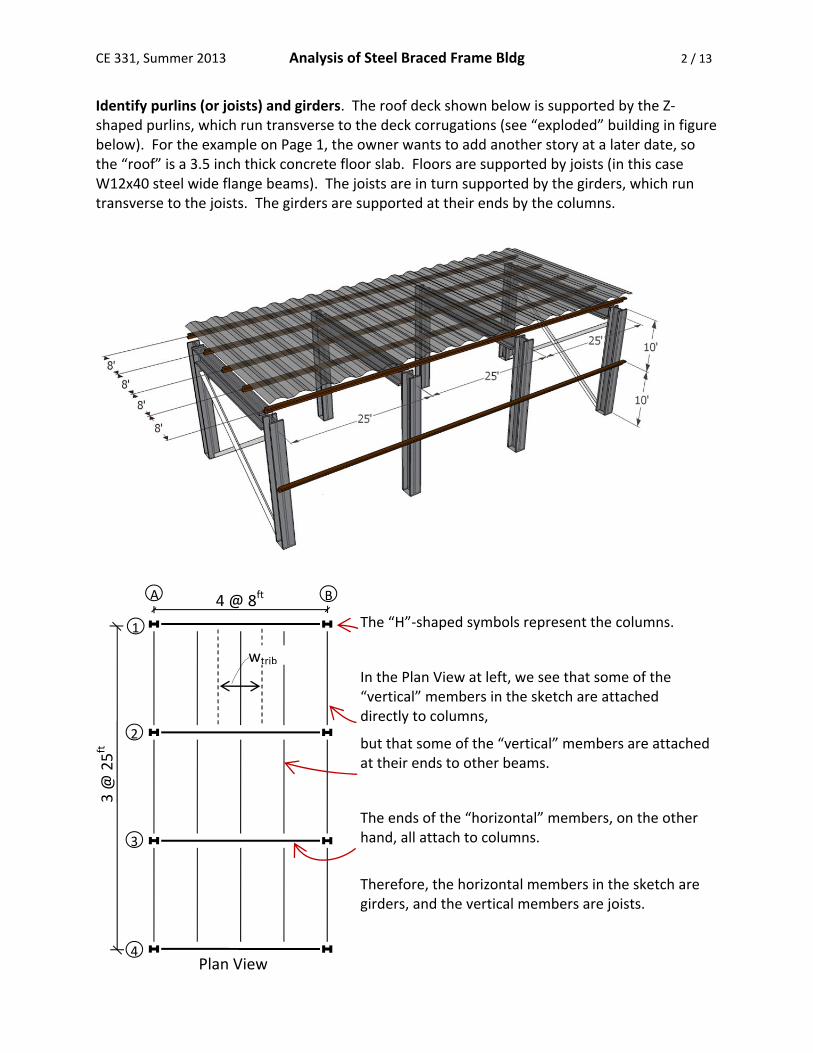
Identify purlins (or joists) and girders. The roof deck shown below is supported by the Z‐shaped purlins, which run transverse to the deck corrugations (see “exploded” building in figure below). For the example on Page 1, the owner wants to add another story at a later date, so the “roof” is a 3.5 inch thick concrete floor slab. Floors are supported by joists (in this case W12x40 steel wide flange beams). The joists are in turn supported by the girders, which run transverse to the joists. The girders are supported at their ends by the columns.
The “H”‐shaped symbols represent the columns.
In the Plan View at left, we see that some of the “vertical” members in the sketch are attached directly to columns,
but that some of the “vertical” members are attached at their ends to other beams.
The ends of the “horizontal” members, on the other hand, all attach to columns.
Therefore, the horizontal members in the sketch are girders, and the vertical members are joists.
4 @ 8ft
Plan View
3 @
25ft
A B
1
2
3
4
wtrib

CE 331, Summer 2013 Analysis of Steel Braced Frame Bldg 3 / 13
Joist –max moment due to factored loads (Mu) The joists are three‐span continuous beams. Loading all of the spans of a continuous beam may not cause the maximum bending moment. Although the position of the dead load is given, the position of live load is variable and the structural engineer must determine the loading causing the maximum bending moment. One way of determining the loading causing the maximum bending moment is to apply all possible load configurations, one at a time, and select the loading causing the maximum effect. In this class we will take a short cut that provides the same answer most of the time: we will assume that the location of the maximum bending moment due to dead plus live loads is the location with the maximum bending moment due to dead loads.
Location of max MD+L = Location of max MD
The statement above is true for continuous beams with equal span lengths. Our procedure for calculating the maximum moment due to factored loads will be:
1. Apply the dead load to all spans and calculate the moment (MD) using the chart from the AISC manual for moments in 3 and 4‐span continuous beams.
2a. Assume that the location of the max MD+L = the location of the max MD. Draw the influence diagram for moment for this location.
2b. Apply the live load to the spans indicated by the influence diagram and calculate the moment (ML) using the AISC charts.
3. Calculate Mu from 1.2 MD + 1.6 ML. 1. Dead Loads: weight of slab = 3.5”/12”/’ x 120pcf = 35 psf self‐weight of W12x40 joist = 40 plf wt in plf
Trib. Width*
Load on Joist
slab 35 psf 8 ft = (35 psf)(8 ft) = 0.280 klf
Joists 40 plf = 0.040 klf
wD = = 0.320 klf *see sketch on bottom of Pg. 2 Max MD = 0.100 wL2 from AISC charts MD = 0.100 (0.320klf)(25ft)2 MD= 20.0k‐ft
wD
MD, k‐
‐0.100wL2 = ‐20.0k‐ft
0.080wL2 0.025wL2
3 @ 25ft

CE 331, Summer 2013 Analysis of Steel Braced Frame Bldg 4 / 13
2. Live Loads: Assume AT = area supported by one span of the joist (conservative)
00.1)200()2(
1525.0
200)25)(8(
)(2
0.14.0,15
25.0
_
_
sffactorreduc
sfftftT
LL
reductionTLL
factorreduc
LL
A
beamsk
LLAk
LL
joistof areatributary
Reference) FE 143 (pg
Therefore wL = (LLreduc_factor)(LL)(tributary width) = (1.0)(40.0
psf)(8ft)/(1000lb/k) = 0.320klf 2a. Assume max MD+L occurs at location of max MD
ML = 23.3k‐ft
3. Mu = moment due to factored loads Use Load Combination for gravity loads (dead and live loads) from page 1: 1.2 D + 1.6 L Mu = 1.2(‐20.0
k‐ft) + 1.6(‐23.3k‐ft) Mu = 61.3k‐ft
‐0.1167wL2 = ‐23.3k‐ft
MLL
Influence Diagram for M at Support 2:
wLL
2b. Span loading to cause max. ‐M at Support
max ML = ‐0.1167(0.320klf)(25ft)2 = ‐23.3k‐ft
CE 331, Summer 2013 Analysis of Steel Braced Frame Bldg 5 / 13
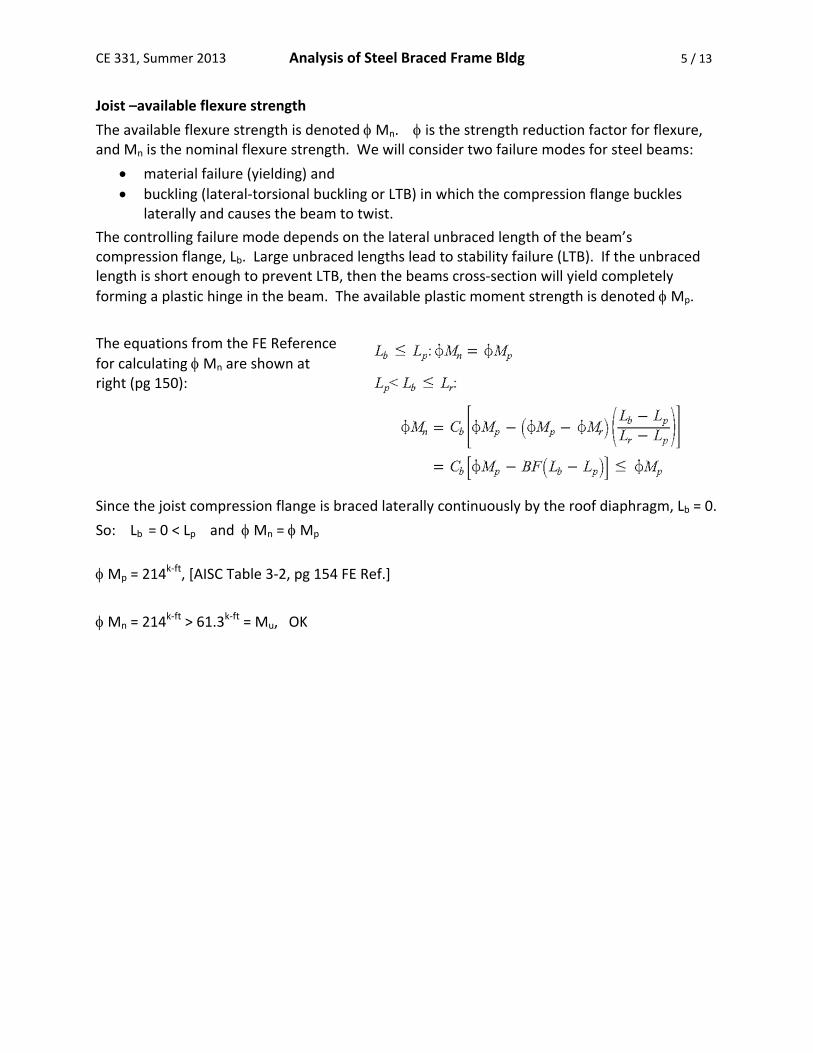
Joist –available flexure strength
The available flexure strength is denoted Mn. is the strength reduction factor for flexure, and Mn is the nominal flexure strength. We will consider two failure modes for steel beams:
material failure (yielding) and
buckling (lateral‐torsional buckling or LTB) in which the compression flange buckles laterally and causes the beam to twist.
The controlling failure mode depends on the lateral unbraced length of the beam’s compression flange, Lb. Large unbraced lengths lead to stability failure (LTB). If the unbraced length is short enough to prevent LTB, then the beams cross‐section will yield completely
forming a plastic hinge in the beam. The available plastic moment strength is denoted Mp.
The equations from the FE Reference
for calculating Mn are shown at right (pg 150):
Since the joist compression flange is braced laterally continuously by the roof diaphragm, Lb = 0.
So: Lb = 0 < Lp and Mn = Mp
Mp = 214k‐ft, [AISC Table 3‐2, pg 154 FE Ref.]
Mn = 214k‐ft > 61.3k‐ft = Mu, OK

CE 331, Summer 2013 Analysis of Steel Braced Frame Bldg 6 / 13
Girder –max. moment due to factored load (Mu) Since all of the girders are the same size, the girder with the largest unity check will be the girder with the largest loads. Therefore, analyze a girder from an interior frame. The loads on this girder are indicated in the sketch below, where Pext = the loads on the girder from exterior joists and Pint = the loads on the girder from interior joists
The tributary areas used to calculate these loads are shown in the sketch at right. Since only the interior loads will cause bending of the girder for this example, we only need to calculate Pint. Dead Loads: weight of slab = 35 psf self‐weight of joist = 40 plf self‐weight of W21x44 girder = 44 plf wt in plf
Trib. Area or Trib. Length
Load on Girder
slab 35 psf = (8 ft)(25 ft) = 200 sf = (35 psf)(200 sf) = 7.00 k
Joists 40 plf 25 ft = (40 plf)(25 ft) = 1.00 k
Girder 44 plf 8 ft = (44 plf)(8ft) = 0.352 k
PD = = 8.35 k
Pext Pint Pint Pint Pext
4 @ 8ft
25’
8’
Atrib for load on girder from exterior joist
Atrib for load on girder from interior joist

CE 331, Summer 2013 Analysis of Steel Braced Frame Bldg 7 / 13
Live Loads: Since the girder is a single span, there is no need to consider span load patterns for live load. For live‐load reduction, tributary area (At) equals tributary width (25’) times the span length (32’). At = 25
ft x 32ft = 800sf
625.0)800()2(
1525.0
sfreductionLL (between
0.4 and 1.0, OK) PL= (40psf)(0.625)(25ft)(8ft) = 5.0k Mu:
Pu = 1.2(8.35k) + 1.6(5.0k) = 18.0k
After drawing the shear and moment diagrams (at right),
Mu = 288k‐ft
Girder – available flexure strength
Use the same equations on pg 150 of the FE reference as were used for the joist.
The top flange of the simply‐connected girder is in compression. The joists are connected to
the top flange of the girder and provide lateral restraint. Therefore the unbraced length of the
compression flange, Lb, equals 8 ft.
Lp =4.45ft, Lr = 13.0
ft [AISC Table 3‐2, pg 154 FE Ref.]
Lp < (Lb = 8ft) < Lr
Mn = Cb [ Mp – BF(Lb – Lp)] < Mp
Cb = 1.0 (always for this class)
Mp = 358k‐ft [AISC Table 3‐2, pg 154 FE Ref.]
BF = 16.8k [AISC Table 3‐2, pg 154 FE Ref.]
Mn = (1) [358k‐ft – 16.8k(8ft – 4.45ft] [pg 150, FE Ref.]
Mn = 298k‐ft (< 358k‐ft = Mp)
Mn = 298k‐ft > 288k‐ft = Mu, OK
18k
27k27k
18k 18k
M
288k‐ft
V
27k
9k
8’

CE 331, Summer 2013 Analysis of Steel Braced Frame Bldg 8 / 13
Column –max. axial force due to factored loads (Pu) The critical column is one of the edge columns (as opposed to a corner column). Dead Loads: weight of slab = 35psf wtjoists = 40
plf wtgirder = 44
plf
Trib. Area or Trib. Length
n
Load on Column
slab 35 psf = (16 ft)(25 ft) = 400 sf = (35 psf)(400 sf) = 14.00 k
Joists 40 plf 25 ft 2.5 = (40 plf)(25 ft)(2.5 joists) = 2.50 k
Girder 44 plf 16 ft = (44 plf)(16 ft) = 0.704 k
PD = = 17.20 k Live Loads:
625.0)200()4(
1525.0
400)25)(16(joist ofareatributary
)(4
Reference) FE 143 (pg 0.14.0,15
25.0
_
_
sffactorreduc
sfftftT
LL
reduction
TLL
factorreduc
LL
A
columnsk
LLAk
LL
PL = (40psf)(0.625)(400sf) = 10.0k
Pu = 1.2(17.2
k) + 1.6(10.0k) Pu = 36.6k
25’
16’
CE 331, Summer 2013 Analysis of Steel Braced Frame Bldg 9 / 13
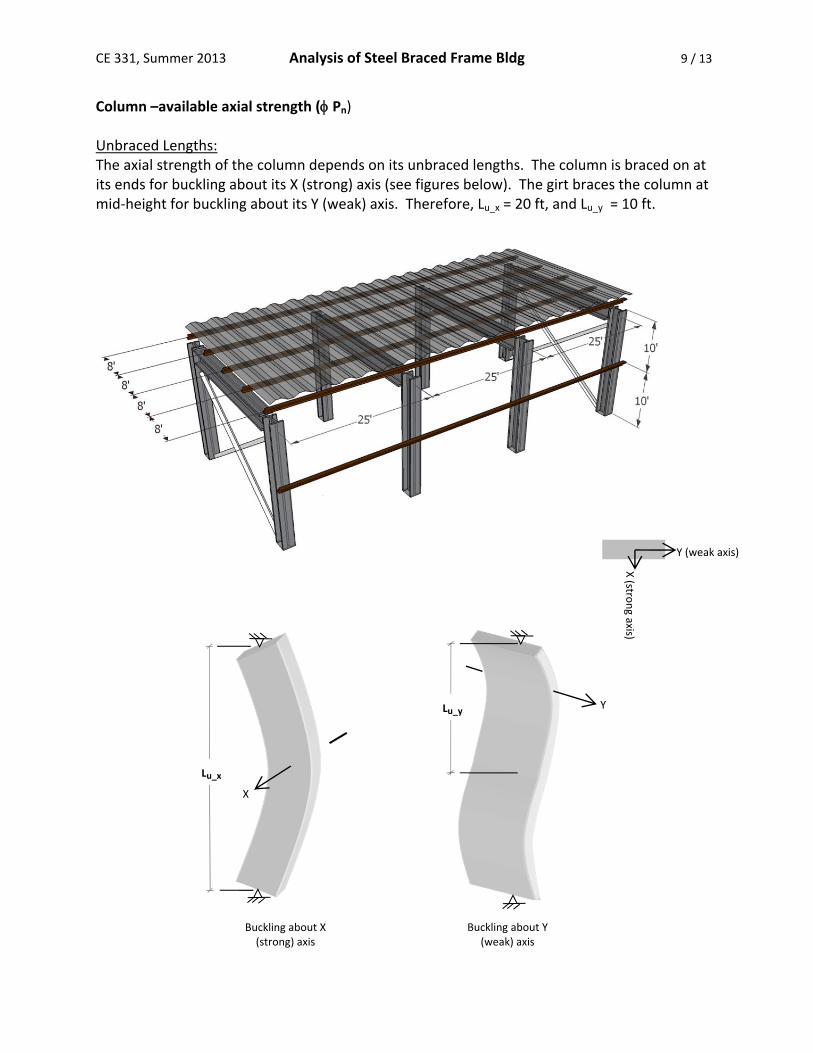
Column –available axial strength ( Pn) Unbraced Lengths: The axial strength of the column depends on its unbraced lengths. The column is braced on at its ends for buckling about its X (strong) axis (see figures below). The girt braces the column at mid‐height for buckling about its Y (weak) axis. Therefore, Lu_x = 20 ft, and Lu_y = 10 ft.
Y
X
Buckling about X (strong) axis
Buckling about Y (weak) axis
Lu_x
Lu_y
X (stro
ng axis)
Y (weak axis)

CE 331, Summer 2013 Analysis of Steel Braced Frame Bldg 10 / 13
The relevant section properties for the column can be looked up in a table in the FE Reference.
Refer]FE 153 pg 1,[Table1 ,52.1,51.6,6.10 2 iny
inx rrinA
The column buckling strength is a function of the slenderness ratio (K L / r); the higher the slenderness ratio, the lower the buckling strength. The slenderness ratio must be calculated for buckling about each axis, with the largest slenderness ratio controlling.
9.7852.1
)1
1210)(0.1(
9.3651.6
)1
1220)(0.1(
_
_
in
ft
inft
y
yuy
in
ft
inft
x
xux
r
Lk
r
Lk
KL/r = 79 (round up)
Fcr =28.5ksi [AISC Table 4‐22, pg 157 FE Ref.]
Pn = Fcr A = (28.5ksi ) (10.6in2) = 302k
Pn = 302k > 36.6k = Pu , OK (but over‐designed) End Wall Cross‐Bracing –max tension due to factored sidesway loads (Tu) Lets follow the wind loads applied to a long wall of the building (see sketch below). Assume that the wall acts like a simply‐supported beam spanning between the foundations on the bottom and the roof diaphragm on the top, then half of the wind load goes to the foundations along the bottom of the wall, and the other half is distributed to the roof or floor diaphragm.
The diaphragm acts like a beam in the horizontal plane: it supports the distributed load from the top of the wall, and is in turn supported at its ends by the end walls. Assume that only the end‐walls are braced against sidesway (x‐bracing on the internal frames would restrict the use of the building). Then half of the wind load to the roof diaphragm is applied to the top of each end wall.
Wind Load
Foundation
End‐Wall
Roof Diaphragm
Wind Load
controls

CE 331, Summer 2013 Analysis of Steel Braced Frame Bldg 11 / 13
The end‐wall acts like a vertical cantilever beam: the horizontal force applied to its free end results in a horizontal reaction at its base and a couple (called the “overturning moment” due to wind load). Rather than specify one diagonal brace that can carry tension or compression (depending on the wind direction), structural engineers usually specify x‐bracing and assume that the diagonal brace in compression buckles elastically. Therefore the horizontal wind load at the top of the end‐wall is resisted by the horizontal component of the tension diagonal brace. The portion of the long wall area that collects the wind load distributed to the top of an end‐wall is indicated in the sketch below.
For the current example, the force at the top of the end‐wall due to factored wind load (see
load combination on Page 1) is:
kcolWwallendU psf
BldgofLengthhWLP 0.18)
2
'75)(
2
'20)(30)(6.1()
2)(
2)()(6.1(
The tension force in the diagonal brace due to factored wind loads is therefore: TU end‐wall brace = (18
k)(37.7ft / 32ft) TU end‐wall brace = 21.2k
For buildings having interior frames with sidesway resistance (either moment frames of braced frames), the distribution of sidesway forces to the frames depends on the type of diaphragm.
wall area collecting wind load applied to top of left end‐wall h/2
Lbldg/2
18k C
21.2k T
End‐Wall Elevation
20ft
32ft
37.7ft
Isometric View

CE 331, Summer 2013 Analysis of Steel Braced Frame Bldg 12 / 13
Flexible diaphragms (for example wood roofs) behave like horizontal beams that are simply‐supported between the frames. The sidesway load to each frame is in proportion to its tributary width.
Rigid diaphragms behave like a rigid horizontal beam. The horizontal deflections at the top of
each frame () are equal. The sidesway load to each frame is proportional to its lateral (sidesway) stiffness.
If all frames resisted sidesway in the steel building of this example, the sidesway loads to the top of the frames would be:
Flexible Diaphragm
Flexible Diaphragm
Flexible Diaphragm
L
L
L
L/2L/2
A
B
C
D
Tributary width for Frame B
L
L
L
A
B
C
D
Rigid Diaphragm
Sidesway loads to frames for flexible diaphragms
Sidesway loads to frames for rigid diaphragms

CE 331, Summer 2013 Analysis of Steel Braced Frame Bldg 13 / 13
a) with a flexible diaphragm:
PFrame A = PFrame D = (1.3) (30 psf) (10 ft) ( 25 ft / 2 ) = 4.88 k
PFrame B = PFrame C = (1.3) (30 psf) (10 ft) ( 25 ft ) = 9.75 k
b) with a rigid diaphragm and frames with identical sidesway stiffness:
PFrame A = PFrame B = PFrame C = PFrame D = (1.3) (30 psf) (10 ft) ( 75 ft ) (1 / 4 ) = 7.31 k
![Design and Detailing of Seismic Connections for Braced Frame Structures[1]](https://cdn.vdocument.in/doc/165x107/577c78bf1a28abe05490aa95/design-and-detailing-of-seismic-connections-for-braced-frame-structures1.jpg)


