Impact of call to balloon time on 30-day mortality in contemporary practice
Richard W. Varcoe1 PhD MRCP
Tim C. Clayton2 MSc
Huon H. Gray3 MD FRCP
Mark A. de Belder4 MA MD FRCP
Peter F. Ludman5 MA MD FRCP
Robert A. Henderson1 DM FRCP
on behalf of the British Cardiovascular Intervention Society (BCIS) and the National Institute for Cardiovascular Outcomes Research (NICOR)
1 Trent Cardiac Centre, Nottingham University Hospitals NHS Trust, Nottingham
2 London School of Hygiene and Tropical Medicine, London
3 Wessex Cardiac Unit, University Hospital Southampton NHS Foundation Trust, Southampton
4 The James Cook University Hospital, Middlesbrough
5 Queen Elizabeth Hospital, University Hospital Birmingham NHS Foundation Trust, Birmingham
Text word count – 3000
Brief title – CTB time and mortality after PPCI for STEMI
The corresponding author has the right to grant on behalf of all authors and does grant on behalf of all authors, an exclusive licence (or non-exclusive licence for government employees) on a worldwide basis to the BMJ publishing group Ltd and its licensees to permit this article (if accepted) to be published in HEART editions and any other BMJPGL products to exploit all subsidiary rights
Keywords: myocardial infarction; STEMI; primary angioplasty; PPCI; call to balloon time.
Address for correspondence:Richard VarcoeTrent Cardiac CentreCity Hospital CampusNottingham University Hospitals NHS TrustHucknall RoadNottinghamNG5 1PBPhone: +44 115 969 1169 ext. 58389Fax: +44 115 962 7968Email: [email protected]
Page 1 of 27
Abstract
Objective
Studies reporting an association between treatment delay and outcome for patients with
STEMI have generally not included patients treated by a PPCI service that systematically
delivers reperfusion therapy to all eligible patients. We set out to determine the association of
CTB time with 30-day mortality after PPCI in a contemporary series of patients treated within
a national reperfusion service.
Methods
We analysed data on 16907 consecutive patients with STEMI treated by PPCI in England and
Wales in 2011 with CTB times of 6 hours or less.
Results
The median CTB and DTB times were 111 and 41 minutes, respectively, with 80.9% of
patients treated within 150 minutes of the call for help. An out of hours call time (58.2% of
patients) was associated with a 10-minute increase in CTB time whereas inter-hospital
transfer for PPCI (18.5% of patients) was associated with a 49-minute increase in CTB time.
CTB time was independently associated with 30-day mortality (p<0.0001) with a hazard ratio
of 1.95 (95% CI 1.54 to 2.47) for a CTB time of >180-240 minutes compared to ≤90 minutes.
The relationship between CTB time and 30-day mortality was influenced by patient risk
profile with a greater absolute impact of increasing CTB times on mortality in high-risk
patients.
Conclusions
CTB time is a useful metric to assess the overall performance of a PPCI service. Delays to
reperfusion remain important even in the era of organised national PPCI services with rapid
treatment times and efforts should continue to minimize treatment delays.
Page 2 of 27
Key Questions
What is already known about this subject?
Primary percutaneous coronary intervention (PPCI) is the treatment of choice for patients
presenting with acute ST segment elevation myocardial infarction (STEMI) provided it can be
delivered in a timely fashion. Delays to treatment are associated with outcome and most
efforts have focused on improvements in door to balloon time (DTB).
What does this study add?
We have demonstrated a strong independent association between call to balloon time (CTB)
and 30-day mortality in an organised national PPCI service with short treatment delays. This
relationship is influenced by the patient’s baseline risk profile such that those at highest risk
are likely to benefit the most from reducing treatment delays.
How might this impact on clinical practice?
CTB time may more reliably assess the overall performance of a PPCI service as it includes
the potentially modifiable components of both pre-hospital and hospital emergency care.
Page 3 of 27
Introduction
National and international guidelines recommend that reperfusion therapy (fibrinolysis or
primary percutaneous coronary intervention (PPCI)) for patients with acute ST segment
elevation myocardial infarction (STEMI) is delivered as quickly as possible to restore
coronary artery blood flow and limit myocardial necrosis. 1-3 In the United Kingdom (UK) the
National Infarct Angioplasty Project (NIAP) recommended PPCI as the treatment of choice
for patients with acute STEMI, provided it can be delivered in a timely fashion.4 Following
publication of the NIAP report in 2008 there has been a rapid roll-out of PPCI services across
the UK and in 2011 over 95% of STEMI cases treated by reperfusion therapy underwent
PPCI.5
The time interval between onset of symptoms due to STEMI and restoration of coronary
blood flow is comprised of the ‘patient delay’ from onset of symptoms to the call for help,
and the ‘system delay’ from the call for help to the delivery of reperfusion therapy. Several
studies suggest that door to balloon (DTB) time (time from arrival in hospital to therapeutic
instrumentation of the culprit coronary artery) correlates with in-hospital 6-9 and longer-term
mortality 8,10,11 but this has not been confirmed in all studies.12-17 By contrast, call to balloon
(CTB) time (time from the call for help to therapeutic instrumentation of the culprit coronary
artery) may be influenced by the modifiable elements of the ‘system delay’.18 CTB time
includes the time from the call for help to arrival of emergency services through to delivery of
PPCI in hospital. Hence, CTB time may provide a more reliable assessment of the overall
performance of a reperfusion service.
Page 4 of 27
Methods
The British Cardiovascular Intervention Society (BCIS) database records data from every PCI
procedure in the UK, including patient demographics, clinical characteristics, procedural
details and outcome data.19 Definitions for these variables are published in the BCIS PCI
dataset.20
Patient variables
We analysed the BCIS database to determine factors associated with CTB time and 30-day
mortality in patients with acute STEMI in England and Wales treated by PPCI during 2011,
three years after introduction of the national PPCI programme.
The CTB time was derived from the time of the call for help and the balloon time, which are
recorded for each patient. The time of the call for help was defined as the time of the call for
an ambulance for patients presenting in the community, or as the time of arrival at hospital for
patients presenting directly to a hospital emergency department. For patients initially admitted
to a hospital without PPCI capability, the call for help was defined by the first medical contact
so that the CTB time included the time for transfer to a PPCI capable hospital. The balloon
time was defined as the time of use of the first device in the coronary artery.
Patients were stratified according to their admission route; STEMI in the community admitted
directly to a PPCI hospital (direct), STEMI in the community admitted to a non-PPCI hospital
and then transferred to a PPCI hospital (transfer), STEMI whilst an in-patient in a non-PPCI
hospital and then transferred to a PPCI hospital (non-PPCI IP), and STEMI whilst already an
in-patient in a PPCI hospital (PPCI IP). Patients were also stratified into groups presenting
‘in-hours’ (weekday 0800h-1800h) or ‘out of hours’ (weekday 1800h-0800h and weekends).
Page 5 of 27
The National Health Service (NHS) number was used to facilitate mortality tracking via the
Office of National Statistics (ONS) in England and Wales. All-cause mortality at 30 days was
determined from deaths reported to ONS, a statutory requirement in England and Wales.
Statistical analysis
Univariable associations of baseline, procedural and timing variables with CTB time were
assessed using linear regression. Variables independently associated with CTB time were
identified using a manual forward stepwise approach with a p-value of 0.01 as the criterion
for inclusion in the final multivariable model. A manual approach was used rather than an
automated stepwise procedure to allow for clinical judgement. The linear relationship of
quantitative variables was considered and variables were grouped into appropriate categories
as necessary.
To investigate the impact of CTB times and other factors on 30-day mortality, univariable and
multivariable Cox models were fitted also using a manual forward stepwise approach, always
including gender and CTB time. CTB time was not assumed to be linearly related to 30-day
mortality across all times and hence was categorised into time intervals to reflect clinically
relevant groups while ensuring sufficient numbers of patients in each group.
To estimate the impact of admission route, calls made ‘out of hours’, centre procedural
volume, and the components of symptom to balloon time (symptom to call, call to door and
door to balloon time), the Cox model was extended to include these variables, excluding CTB
time as appropriate.
Data were missing for up to 14% of any one variable included in the models. In order to
adjust for missing data, multiple imputation techniques with chained equations were used,
assuming missingness is at random, with 10 imputations using all covariates in the model.21
Page 6 of 27
To examine the relationship between CTB time and 30-day mortality for patients at different
underlying risk, a multivariable model was created fitting CTB time as a continuous variable.
The coefficients for this model were used to predict a patient’s 30-day mortality risk
assuming a CTB time of 60 minutes and patients at the 25th, 50th and 75th centiles of risk were
identified. By applying the coefficient for CTB time in the model to these risks, the predicted
30-day mortality at each of these centiles could be determined for any CTB time up to 360
minutes. The predicted 30-day mortality was plotted against CTB time to illustrate the
association between CTB time and mortality risk at different levels of underlying risk.
All analyses were carried out with STATA version 13.1 (StataCorp, College Station, Texas).
Page 7 of 27
Results
In 2011 the BCIS database recorded 79433 PCI procedures in England and Wales including
19534 procedures for patients with acute STEMI. We excluded patients with STEMI who
were treated by fibrinolysis and subsequently underwent ‘rescue’ PCI, duplicate or repeat
PPCI, missing call or balloon times, and CTB times greater than 6 hours. Our study cohort
comprised 16907 patients with STEMI treated by PPCI (figure 1).
The baseline demographic, clinical, procedural and timing characteristics are shown in table
1. The mean CTB time was 121 minutes (median 111 minutes, IQR 90 to 139 minutes) and
80.9% of patients were treated within 150 minutes of the call for help (figure 2).
The mean DTB time for patients in the ‘direct’ cohort was 51 minutes (median 42 minutes,
IQR 29 to 62 minutes). For patients in the ‘transfer’ cohort, the mean DTB time from first
hospital admission was 133 minutes (median 123 minutes, IQR 95 to 161 minutes), but the
mean DTB time from arrival at the PPCI centre was 39 minutes (median 34 minutes, IQR 25
to 47 minutes).
At 30 days 898 (5.3%) patients had died with 331 (2.0%) and 611 (3.6%) deaths at 24 hours
and 7 days, respectively. Mortality rates at 30 days for patients with call to balloon times ≤90
minutes, >90-150 minutes, and >150 minutes were 3.5%, 4.8% and 9.4%, respectively (figure
3).
Page 8 of 27
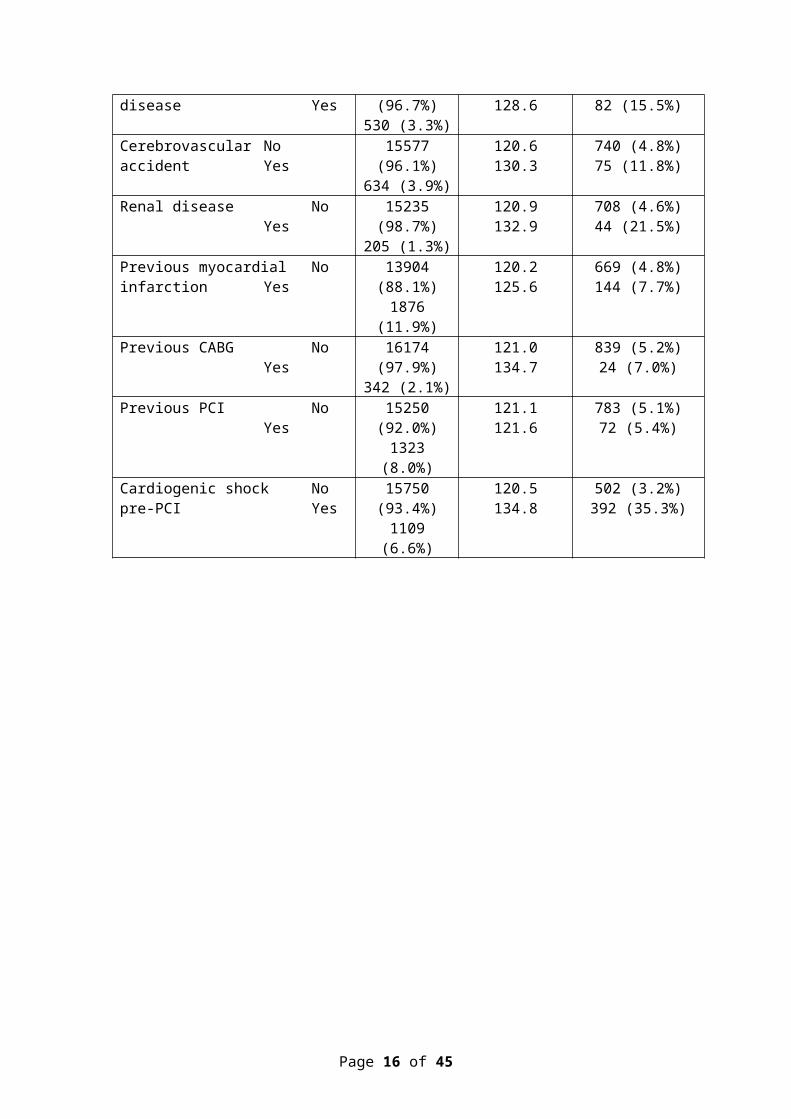
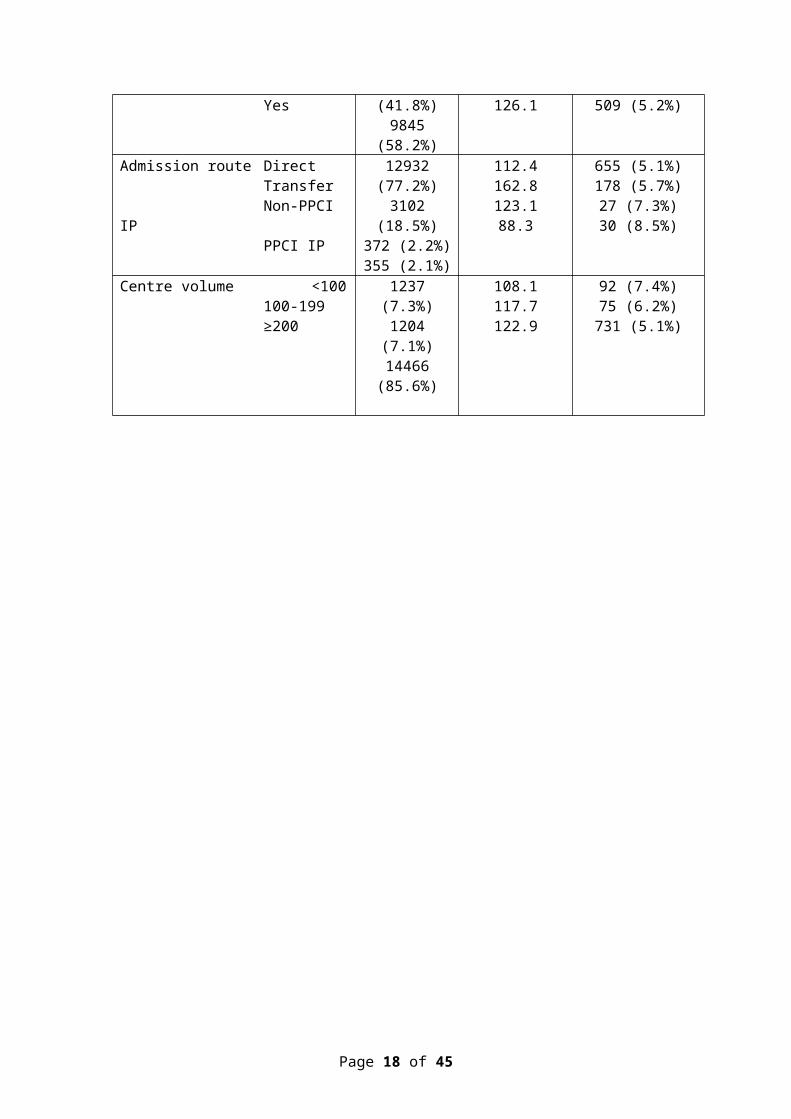
Table 1. Baseline demographic, clinical, procedural and timing factors
Variable Number of patients
Call to balloon (mean mins)
Number of deaths at 30 days (%)
All patients 16907 121.4 898 (5.3%)
Age group, years <5555-≤6060-≤6565-≤7070-≤7575-≤8080-≤85>85
4614 (27.3%)2159 (12.8%)2353 (13.9%)2104 (12.4%)1889 (11.2%)1663 (9.8%)1216 (7.2%)906 (5.4%)
117.8117.5118.6120.0124.4127.5130.2130.7
103 (2.2%)72 (3.3%)92 (3.9%)96 (4.6%)
106 (5.6%)129 (7.8%)132 (10.9%)167 (18.4%)
Gender MaleFemale
12509 (74.1%)4379 (25.9%)
119.6126.7
583 (4.7%)314 (7.2%)
Diabetes NoYes
14245 (86.8%)2166 (13.2%)
120.3127.4
652 (4.6%)179 (8.3%)
Hypertension NoYes
9630 (59.4%)6581 (40.6%)
119.5123.2
416 (4.3%)399 (6.1%)
Hypercholesterolaemia NoYes
9868 (60.9%)6343 (39.1%)
120.8121.3
495 (5.0%)320 (5.0%)
Smoking status NeverExCurrent
5162 (33.7%)3887 (25.4%)6278 (41.0%)
122.2122.1117.8
281 (5.4%)195 (5.0%)194 (3.1%)
Peripheral vascular Nodisease Yes
15681 (96.7%)530 (3.3%)
120.7128.6
733 (4.7%)82 (15.5%)
Cerebrovascular Noaccident Yes
15577 (96.1%)634 (3.9%)
120.6130.3
740 (4.8%)75 (11.8%)
Renal disease NoYes
15235 (98.7%)205 (1.3%)
120.9132.9
708 (4.6%)44 (21.5%)
Previous myocardial Noinfarction Yes
13904 (88.1%)1876 (11.9%)
120.2125.6
669 (4.8%)144 (7.7%)
Previous CABG NoYes
16174 (97.9%)342 (2.1%)
121.0134.7
839 (5.2%)24 (7.0%)
Previous PCI NoYes
15250 (92.0%)1323 (8.0%)
121.1121.6
783 (5.1%)72 (5.4%)
Cardiogenic shock Nopre-PCI Yes
15750 (93.4%)1109 (6.6%)
120.5134.8
502 (3.2%)392 (35.3%)
Page 9 of 27
Ventilated pre-PCI NoYes
14354 (96.4%)541 (3.6%)
119.2156.4
595 (4.1%)227 (42.0%)
Q wave on ECG NoYes
11774 (81.8%)2615 (18.2%)
118.6129.0
534 (4.5%)241 (9.2%)
TIMI flow pre-PCI TIMI 0TIMI 1TIMI 2TIMI 3
10403 (73.7%)977 (6.9%)1280 (9.1%)
1447 (10.3%)
119.0121.2124.6129.7
608 (5.8%)49 (5.0%)58 (4.5%)52 (3.6%)
TIMI flow post-PCI TIMI 0TIMI 1TIMI 2TIMI 3
842 (5.8%)185 (1.3%)692 (4.7%)
12850 (88.2%)
120.7130.5127.6120.8
109 (12.9%)40 (21.6%)87 (12.6%)552 (4.3%)
Multi-vessel disease 1 vessel(>75% stenosis) ≥ 2 vessels
11109 (70.5%)4655 (29.5%)
119.3124.2
410 (3.7%)433 (9.3%)
Number of Singlevessels attempted Multi
15278 (90.9%)1535 (9.1%)
120.8126.6
684 (4.5%)206 (13.4%)
Arterial access RadialFemoralJoint/other
9065 (54.4%)7173 (43.1%)416 (2.5%)
119.5123.7127.9
282 (3.1%)554 (7.7%)47 (11.3%)
Call time Weekday Weekend
12167 (72.0%)4740 (28.0%)
119.2127.1
670 (5.5%)228 (4.8%)
Call time 0800-18001800-00000000-0800
9753 (57.7%)3213 (19.0%)3941 (23.3%)
118.2124.5126.8
529 (5.4%)168 (5.2%)201 (5.1%)
Out of hours NoYes
7062 (41.8%)9845 (58.2%)
114.8126.1
389 (5.5%)509 (5.2%)
Admission route DirectTransferNon-PPCI IPPPCI IP
12932 (77.2%)3102 (18.5%)372 (2.2%)355 (2.1%)
112.4162.8123.188.3
655 (5.1%)178 (5.7%)27 (7.3%)30 (8.5%)
Centre volume <100100-199≥200
1237 (7.3%)1204 (7.1%)
14466 (85.6%)
108.1117.7122.9
92 (7.4%)75 (6.2%)
731 (5.1%)
Page 10 of 27
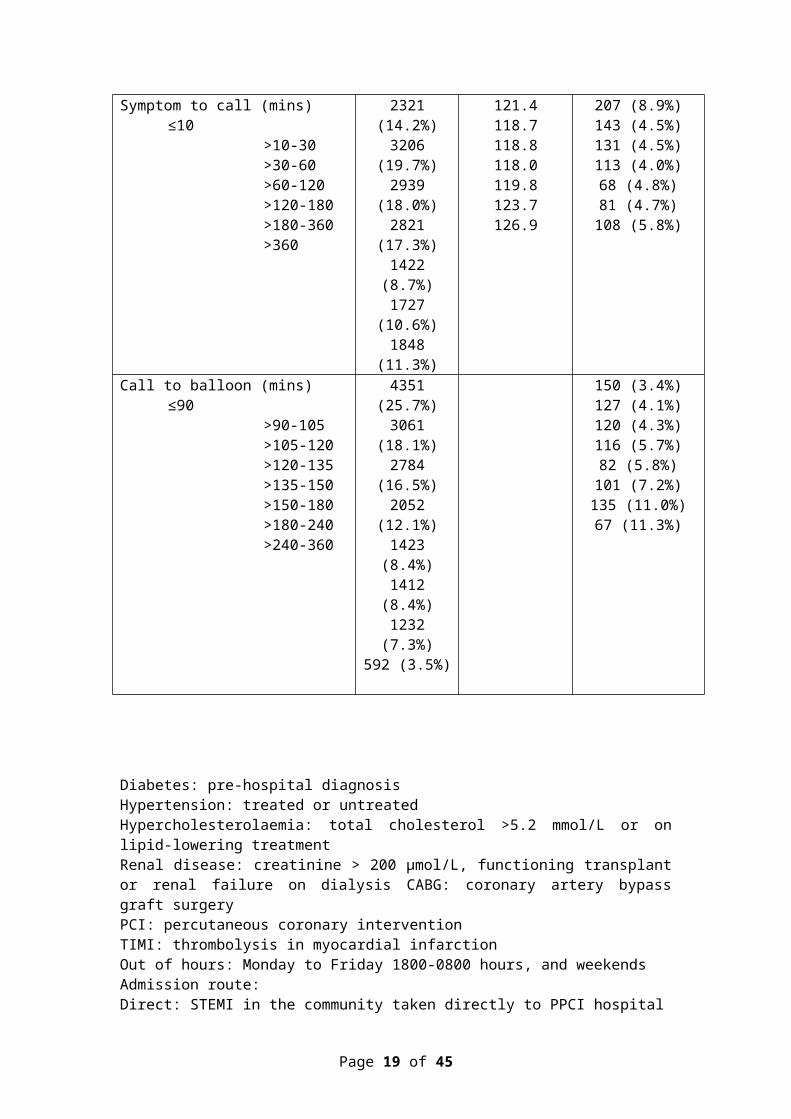
Symptom to call (mins) ≤10>10-30>30-60>60-120>120-180>180-360>360
2321 (14.2%)3206 (19.7%)2939 (18.0%)2821 (17.3%)1422 (8.7%)
1727 (10.6%)1848 (11.3%)
121.4118.7118.8118.0119.8123.7126.9
207 (8.9%)143 (4.5%)131 (4.5%)113 (4.0%)68 (4.8%)81 (4.7%)
108 (5.8%)
Call to balloon (mins) ≤90>90-105>105-120>120-135>135-150>150-180>180-240>240-360
4351 (25.7%)3061 (18.1%)2784 (16.5%)2052 (12.1%)1423 (8.4%)1412 (8.4%)1232 (7.3%)592 (3.5%)
150 (3.4%)127 (4.1%)120 (4.3%)116 (5.7%)82 (5.8%)
101 (7.2%)135 (11.0%)67 (11.3%)
Diabetes: pre-hospital diagnosisHypertension: treated or untreatedHypercholesterolaemia: total cholesterol >5.2 mmol/L or on lipid-lowering treatmentRenal disease: creatinine > 200 µmol/L, functioning transplant or renal failure on dialysis CABG: coronary artery bypass graft surgeryPCI: percutaneous coronary interventionTIMI: thrombolysis in myocardial infarctionOut of hours: Monday to Friday 1800-0800 hours, and weekendsAdmission route:Direct: STEMI in the community taken directly to PPCI hospitalTransfer: STEMI in the community taken to or self-presenting to non-PPCI hospitalNon-PPCI IP: STEMI whilst an inpatient in a non-PPCI hospital PPCI IP: STEMI whilst an inpatient in a PPCI hospitalCentre volume: Number of PPCI cases by centre
Page 11 of 27

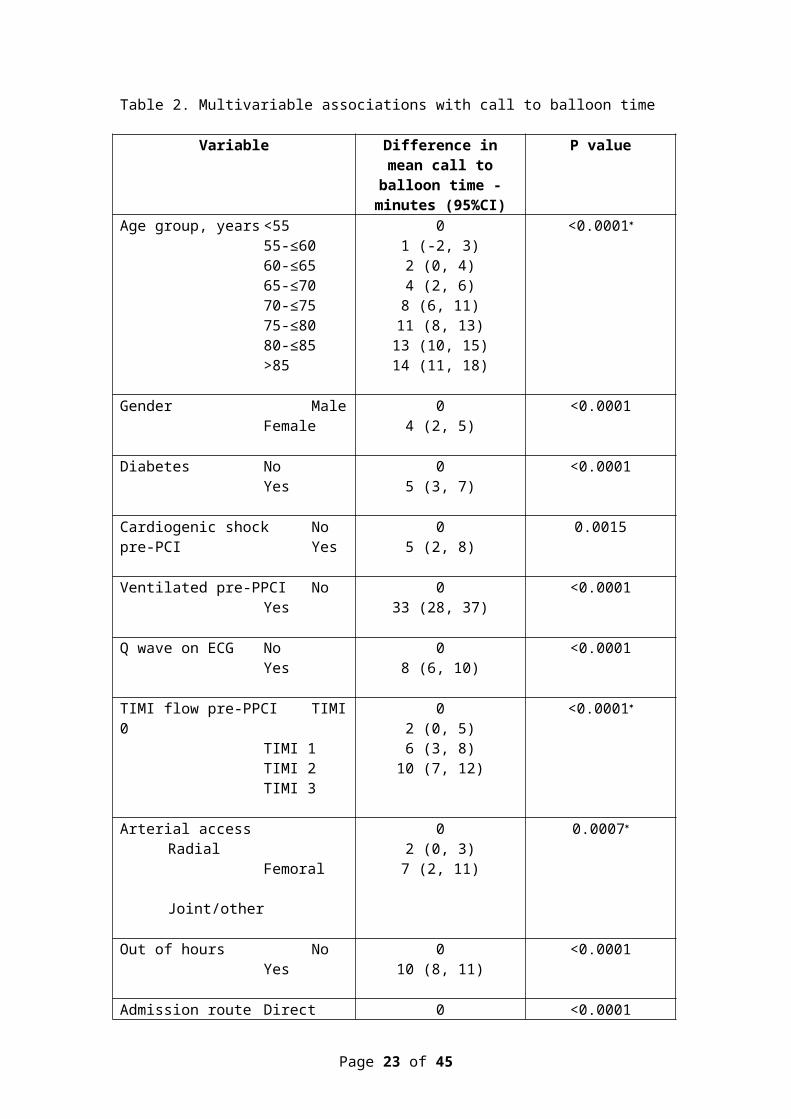
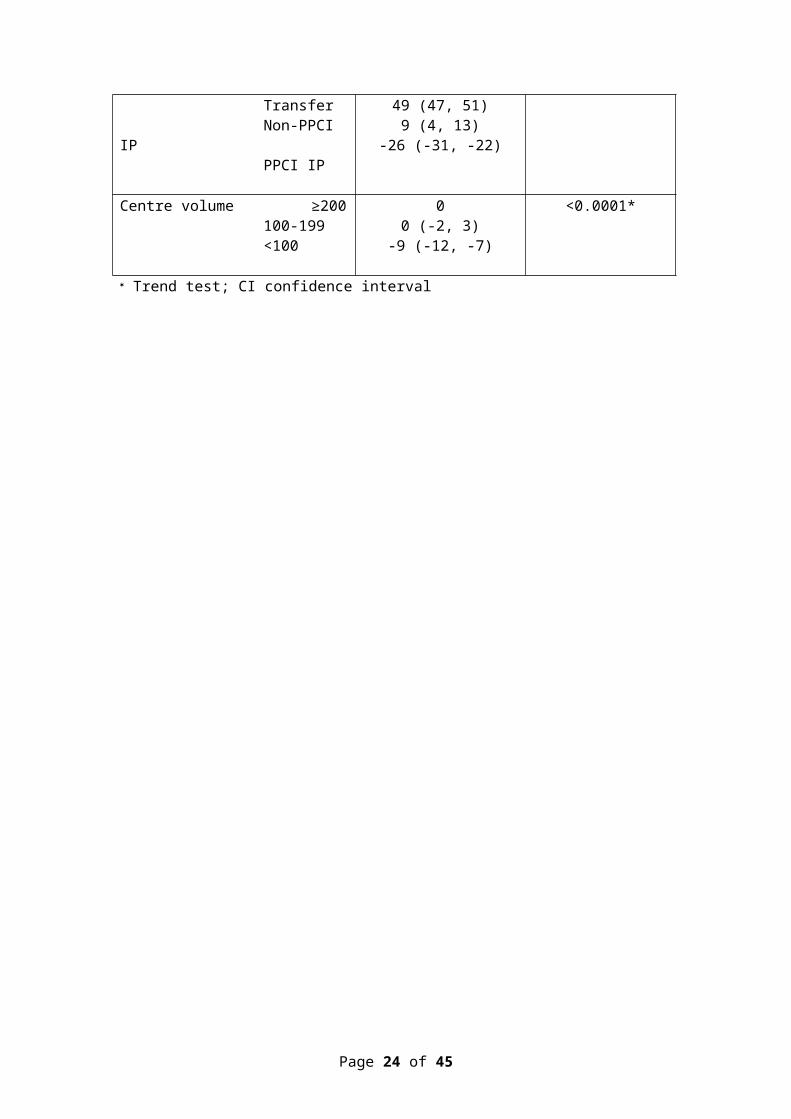
Factors associated with call to balloon time (table 2)
CTB time was independently associated with age and was 13 minutes longer for patients aged
over 80 than for those aged under 55. CTB time was 4 minutes longer in female patients and 5
minutes in those with diabetes. A requirement for mechanical ventilation before PPCI was
associated with the greatest absolute effect on CTB with an increase of 33 minutes.
CTB time was 10 minutes longer for patients presenting ‘out of hours’ than for patients
presenting during normal working hours (‘in-hours’). Patients initially admitted to a hospital
without PPCI capability and then transferred to a PPCI centre had 49 minutes longer mean
CTB times than patients admitted directly from the community to a PPCI service.
CTB time was 9 minutes shorter in centres doing fewer than 100 PPCI procedures compared
to those doing 200 or more. Symptom to call time was not significantly associated with CTB
time.
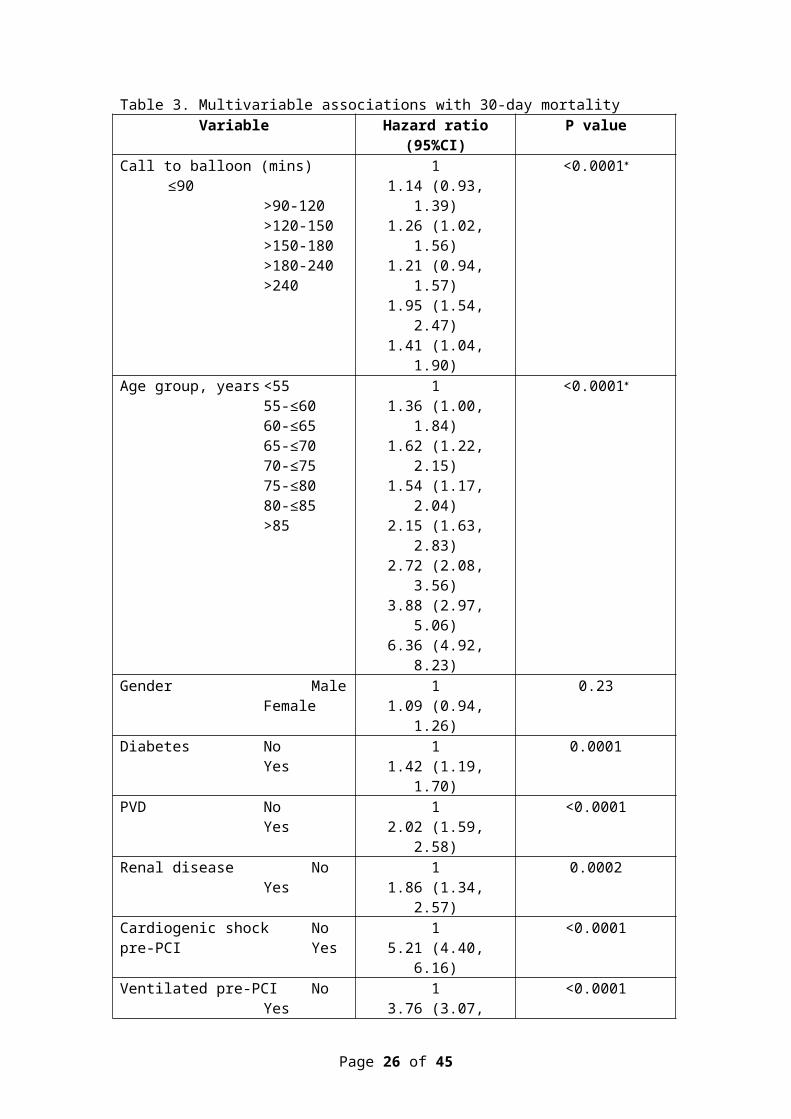
Factors associated with 30-day mortality (table 3)
In a univariable analysis each 30-minute increase in CTB time increased the hazard of 30-day
mortality by around one fifth. In multivariable analysis there was strong evidence of an
independent association between CTB time and 30-day mortality (trend test p<0.0001).
Advancing age was independently associated with a progressive increase in 30-day mortality
such that patients aged over 80 were at over three-fold higher risk of 30-day mortality than
patients under the age of 55. In a univariable analysis female gender was associated with
higher 30-day mortality but this is explained by women presenting at older ages than men
(average age at presentation 69 versus 62 years, respectively) and after multivariable analysis
gender was not associated with 30-day mortality.
Page 12 of 27
Table 2. Multivariable associations with call to balloon time
Variable Difference in mean call to balloon time - minutes
(95%CI)
P value
Age group, years <5555-≤6060-≤6565-≤7070-≤7575-≤8080-≤85>85
01 (-2, 3)2 (0, 4)4 (2, 6)
8 (6, 11)11 (8, 13)
13 (10, 15)14 (11, 18)
<0.0001
Gender MaleFemale
04 (2, 5)
<0.0001
Diabetes NoYes
05 (3, 7)
<0.0001
Cardiogenic shock Nopre-PCI Yes
05 (2, 8)
0.0015
Ventilated pre-PPCI NoYes
033 (28, 37)
<0.0001
Q wave on ECG NoYes
08 (6, 10)
<0.0001
TIMI flow pre-PPCI TIMI 0TIMI 1TIMI 2TIMI 3
02 (0, 5)6 (3, 8)
10 (7, 12)
<0.0001
Arterial access RadialFemoralJoint/other
02 (0, 3)
7 (2, 11)
0.0007
Out of hours NoYes
010 (8, 11)
<0.0001
Admission route DirectTransferNon-PPCI IPPPCI IP
049 (47, 51)9 (4, 13)
-26 (-31, -22)
<0.0001
Centre volume ≥200100-199<100
00 (-2, 3)
-9 (-12, -7)
<0.0001*
Trend test; CI confidence interval
Page 13 of 27
Diabetes, peripheral vascular disease, renal disease, Q waves on the presenting ECG, multi-
vessel PCI, and femoral artery access were all independently associated with an increased risk
of 30-day mortality. Cardiogenic shock and ventilation before PPCI had the greatest absolute
independent effect on the hazard of 30-day mortality (table 3).
The 49-minute increase in CTB time associated with inter-hospital transfer was associated
with an observed 18% increase in the hazard of 30-day mortality (95% CI 0.99 to 1.39) but
the evidence was not strong (p=0.059) (table 4). The 10-minute increase in CTB time
associated with an ‘out of hours’ call time was not associated with an increase in 30-day
mortality.
The relationship between CTB time and predicted 30-day mortality at different levels of
individual patient risk is shown in figure 4. For a patient at low risk (25th centile of risk), an
increase in CTB time from 60 minutes to 360 minutes is predicted to increase 30-day
mortality by less than 1%, whereas such a treatment delay among higher risk patients (75 th
centile of risk) is predicted to increase 30-day mortality by nearly 3% (figure 4).
Page 14 of 27

Table 3. Multivariable associations with 30-day mortalityVariable Hazard ratio (95%CI) P value
Call to balloon (mins) ≤90>90-120>120-150>150-180>180-240>240
11.14 (0.93, 1.39)1.26 (1.02, 1.56)1.21 (0.94, 1.57)1.95 (1.54, 2.47)1.41 (1.04, 1.90)
<0.0001
Age group, years <5555-≤6060-≤6565-≤7070-≤7575-≤8080-≤85>85
11.36 (1.00, 1.84)1.62 (1.22, 2.15)1.54 (1.17, 2.04)2.15 (1.63, 2.83)2.72 (2.08, 3.56)3.88 (2.97, 5.06)6.36 (4.92, 8.23)
<0.0001
Gender MaleFemale
11.09 (0.94, 1.26)
0.23
Diabetes NoYes
11.42 (1.19, 1.70)
0.0001
PVD NoYes
12.02 (1.59, 2.58)
<0.0001
Renal disease NoYes
11.86 (1.34, 2.57)
0.0002
Cardiogenic shock Nopre-PCI Yes
15.21 (4.40, 6.16)
<0.0001
Ventilated pre-PCI NoYes
13.76 (3.07, 4.60)
<0.0001
Q wave on ECG NoYes
11.34 (1.14, 1.58)
0.0003
TIMI flow pre-PCI TIMI 0TIMI 1TIMI 2TIMI 3
1.54 (1.13, 2.08)1.38 (0.94, 2.04)1.06 (0.72, 1.56)
1
0.0004
Number of Singlevessels attempted Multi
11.50 (1.26, 1.79)
<0.0001
Multi-vessel disease 1 vessel(>75% stenosis) ≥ 2 vessels
11.43 (1.23, 1.67)
<0.0001
Arterial access RadialFemoralJoint/other
11.41 (1.21, 1.64)1.61 (1.17, 2.22)
<0.0001
Trend test, CI confidence interval
Page 15 of 27
Page 16 of 27
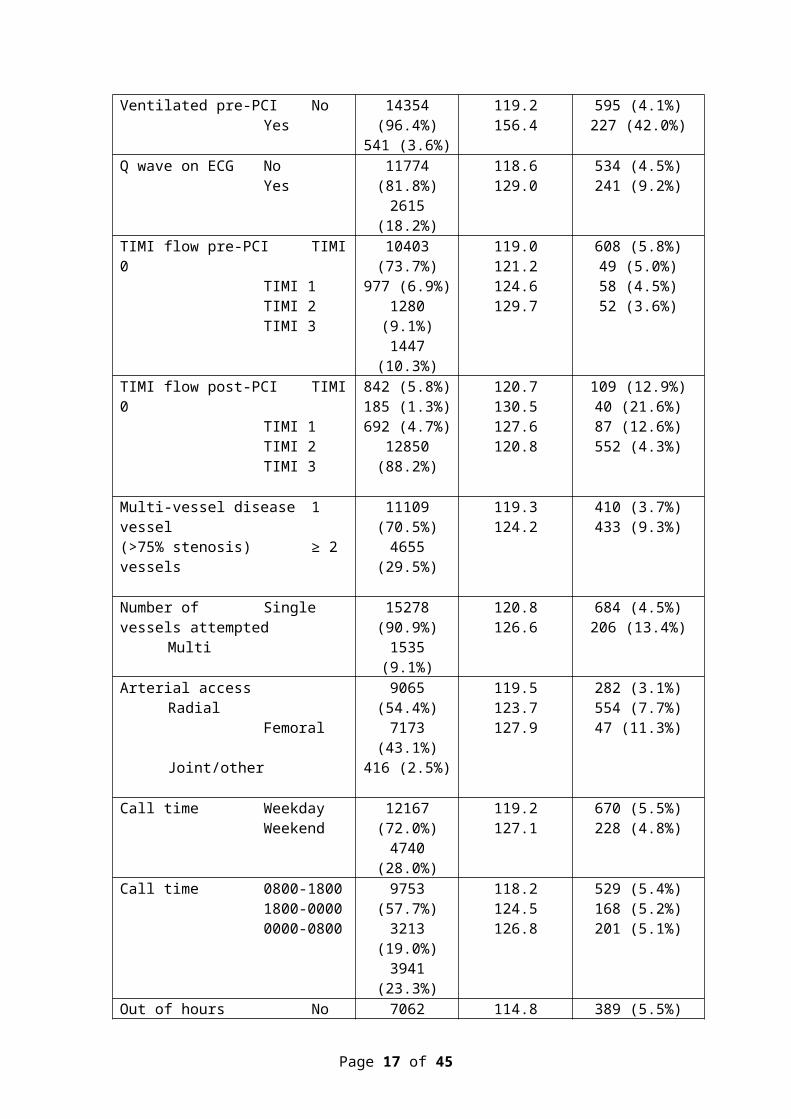
Table 4. Relationship between out of hours PPCI, admission route, centre volume and components of symptom to balloon time with 30-day mortality (multivariable analysis)
CTB included in analysis CTB excluded from analysis
Variable Hazard ratio (95%CI)
P value Hazard ratio (95%CI)
P value
Out of hours NoYes
11.00 (0.87, 1.15) 0.99
11.04 (0.91, 1.20) 0.52
Admission route DirectTransferNon-PPCI IPPPCI IP
10.98 (0.81, 1.19)1.57 (1.06, 2.32)1.39 (0.96, 2.02)
0.850.0230.085
11.18 (0.99, 1.39)1.69 (1.15, 2.49)1.26 (0.87, 1.82)
0.0590.0070.22
Centre volume ≥200100-199<100
10.93 (0.73, 1.19)0.99 (0.79, 1.24)
0.550.91
10.91 (0.71, 1.16)0.91 (0.73, 1.13)
0.460.39
Symptom to call (mins)**≤10>10-30>30-60>60-120>120-180>180-360>360
10.81 (0.65, 1.01)0.88 (0.70, 1.11)0.82 (0.65, 1.04)0.84 (0.63, 1.16)0.94 (0.71, 1.23)1.06 (0.83, 1.35)
0.58* 10.83 (0.66, 1.04)0.90 (0.72, 1.13)0.82 (0.65, 1.05)0.88 (0.66, 1.17)0.96 (0.73, 1.26)1.08 (0.84, 1.38)
0.47*
Direct admission patients only***Symptom to call (mins)*
≤10-30>30-60>60-120>120-180>180
Call to door (mins)≤60>60-90>90-120>120
Door to balloon (mins)≤60>60-90>90-120>120
10.98 (0.77, 1.25)0.89 (0.69, 1.15)1.06 (0.78, 1.43)1.14 (0.91, 1.42)
11.07 (0.89, 1.28)1.36 (1.04, 1.77)1.40 (0.96, 2.04)
11.04 (0.84, 1.29)1.54 (1.16, 2.06)1.43 (1.07, 1.93)
0.38*
0.0074*
0.0008*
CI confidence interval* Trend test** Among 16284 patients with symptom to call time available*** Among 12497 direct admission patients with symptom to call time available
Page 17 of 27
Discussion
We analysed data from a large contemporary series of patients with acute STEMI who were
treated by a coordinated national PPCI service and identified several variables that were
independently associated with CTB time and 30-day mortality. Some of these factors are
unalterable (age, gender) but some are potentially modifiable (CTB time) suggesting scope to
further improve the outcomes of PPCI.
Previous studies have generally reported a positive association between treatment delay and
mortality after PPCI for STEMI, but inconsistencies in the evidence base may reflect
differences in study design, data collection periods, and definitions of treatment delay and
outcomes. Early studies from the United States reported median DTB times of over 100
minutes 6,9 and median symptom to balloon (STB) times of 234 minutes. 6 Recent studies have
reported DTB times approaching 60 minutes but these improvements in STEMI care have not
consistently been associated with improvements in outcome, 15-17 possibly because of the use
of population rather than individual level treatment delays in some studies. 22
DTB time may be a poor indicator of the overall impact of treatment delay on outcome, as it
does not include pre-hospital care. The STB time is a measure of total ischaemic time, but
symptom onset may be difficult to define accurately because of recall bias, prodromal anginal
symptoms and silent or atypical presentations. By contrast CTB time is derived from two
easily measured time points (time of call to emergency services or self-presentation at
hospital, and time of therapeutic instrumentation of the culprit coronary artery), which are
systematically recorded for all patients treated by PPCI in the UK. CTB time includes the
potentially modifiable components of the system delay and may provide the best measure of
the overall performance of a PPCI service.
Page 18 of 27
In a previous study of 13,790 patients with STEMI, who were enrolled in the Swedish
SCAAR registry from 2003-2008, the delay from first medical contact (FMC) to PPCI was
associated with 1-year mortality and severe left ventricular systolic dysfunction at discharge
from hospital. 23 The time of FMC, however, was defined by the time of the first
electrocardiogram, which was recorded before arrival in hospital in only 51% of patients.
Moreover the time of PPCI was determined by the start of the coronary arteriogram, rather
than therapeutic instrumentation of the coronary artery. This may explain why the median
time from FMC to PPCI in this study was only 70 minutes. Another study reported on 6,209
patients treated by PPCI from 2002-2008 at three centres in Western Denmark. CTB time
was defined as the time from FMC with the emergency medical services to insertion of the
guiding catheter before PPCI. CTB times following direct admission to the PPCI centre and
following transfer from a local hospital were 97 and 139 minutes, respectively, and CTB time
was independently associated with mortality at a median of 3.4 years.11In our study symptom
to call time was not associated with 30-day mortality whereas call to door and door to balloon
time were (table 4), suggesting pre-hospital and hospital based emergency care are equally
important contributors to patient outcome.
In our study the relationship between CTB time and mortality was influenced by patient risk
profile, such that an increase in CTB time was predicted to have substantially greater impact
on 30-day mortality among patients at high risk relative to those at low risk. Several variables
associated with CTB time were also associated with 30-day mortality, suggesting that patients
most likely to experience delays to treatment may also be most likely to benefit from efforts
to minimize treatment delay.
The results of PPCI outside of normal working hours have been studied extensively. A meta-
analysis of data from 1.9 million patients from 36 studies reported that ‘out of hours’ PPCI
was associated with a 14.8-minute increase in DTB time and a 12% increase in the odds of in-
hospital and 30-day mortality. 24 Three large registries also reported that out of hours PPCI
Page 19 of 27
was associated with longer DTB times but these treatment delays had no impact on in-
hospital mortality. 25-27
In our study, an ‘out of hours’ call time was associated with an increase in CTB time of only
10 minutes, which did not translate into an increase in 30-day mortality. These data suggest
that the increase in CTB time associated with ‘out of hours’ procedures was insufficient to
impact 30-day mortality, and support current models of PPCI service delivery across England
and Wales.
The shorter CTB times in ‘low volume’ centres (<100 PPCI procedures) may reflect
opportunistic intervention in centres that do not provide a 24/7 service. Overall centre volume
had no impact on 30-day mortality but this data requires cautious interpretation because it has
limited statistical power.
In England and Wales a minority of patients with STEMI self-present to a non-PPCI hospital
or are initially taken to the nearest emergency department because of diagnostic uncertainty.
These patients experience a 49-minute increase in CTB time, which is associated with a 18%
increase in the hazard of 30-day mortality. These data support the need for preferential
transfer of patients with suspected STEMI directly to a hospital with PPCI capability to
minimize delays to treatment.
In England and Wales over 80% of patients meet the national audit standard of a CTB time of
less than 150 minutes. Recent guidance from the National Institute of Health and Care
Excellence (NICE) recommended that PPCI should be the preferred reperfusion strategy
provided that PPCI can be delivered within 120 minutes of the time at which fibrinolysis
could be given. 28 For most patients the CTB time includes the time from the call for help to
the arrival of an ambulance, the time to make a diagnosis and the time that would have been
required to set up a fibrinolytic infusion. Cumulatively these delays are likely to exceed 30
Page 20 of 27
minutes; hence the majority of patients in this study would have been compliant with the
NICE guidelines. Long CTB times may be unavoidable in patients who present in
geographically remote areas, in whom ambulance transfer is delayed or where there is
diagnostic uncertainty at the time of presentation. Future research should focus on this
subgroup and if CTB times cannot be shortened pharmaco-invasive treatment may be an
alternative strategy. 29, 30
Limitations
We assessed the impact of patient specific CTB times on 30-day mortality in a large cohort of
patients undergoing PPCI in a single year. Substantial variation in observed and unobserved
factors during this period is unlikely but residual confounding by factors not included in the
multivariable analyses cannot be excluded.
Our data suggest that CTB time is a useful metric to evaluate the performance of PPCI
services and has advantages over DTB time. Nevertheless, CTB time may not be a reliable
surrogate for total ischaemic time because of variation in the duration and severity of
symptoms before the person calls for help, and because the time of the first therapeutic
intervention on the occluded coronary artery may not completely reperfuse the affected
myocardium.
We report outcome at 30 days and most deaths after PPCI occur within this time window but
longer term follow up data may provide additional information. In addition, our study only
included patients treated by PPCI and is not applicable to patients with STEMI who are
managed with fibrinolysis or do not receive reperfusion therapy, who may have worse
outcomes. 5,31
Page 21 of 27
Conclusions
In this contemporary study of patients treated by PPCI within an established national system
of STEMI care there was a strong independent association between CTB time and 30-day
mortality. This relationship was influenced by patient risk profile and in high-risk patients an
increase in CTB time of 90 minutes would be expected to increase 30-day mortality by
around 1%.
Approximately 20% of patients have CTB times longer than 150 minutes and further research
is required to determine the causes of treatment delay in this subgroup. Efforts to improve
performance of PPCI services should ensure that all patients with STEMI are preferentially
directed to a hospital with PPCI capability so that the route of entry into the healthcare system
does not influence outcomes.
Page 22 of 27
Acknowledgements
All listed authors fulfil the 4 authorship criteria as specified in the guidelines of the
International Committee of Medical Journal Editors (ICMJE) 2013
No persons other than the listed authors have made substantial contributions to this
manuscript.
This manuscript has not been published previously and is not under consideration by another
publication or electronic medium
Richard W.Varcoe and Tim C.Clayton had full access to all the data in the study and take
responsibility for the integrity of the data and the accuracy of the data analysis
Funding sources
No funding was required for this study.
Conflicts of Interest/Financial Disclosures
Tim C. Clayton has received research funding from the Medicines Company.
Mark A. de Belder has received travel grants from Abbott Vascular.
Robert A. Henderson is an Advisory Board member for Quantum Imaging.
Richard W. Varcoe, Huon H. Gray and Peter F. Ludman have no relationships with industry
to declare.
Page 23 of 27
References
1. Harker M, Carville S, Henderson R, et al; Guideline Development Group. Key recommendations and evidence from the NICE guideline for the acute management of ST-segment-elevation myocardial infarction. Heart 2014; 100:536-43.
2. O'Gara PT, Kushner FG, Ascheim DD, et al; American College of Cardiology Foundation/American Heart Association Task Force on Practice Guidelines. 2013 ACCF/AHA Guideline for the Management of ST-Elevation Myocardial Infarction: A Report of the American College of Cardiology Foundation/American Heart Association Task Force on Practice Guidelines. Circulation 2013; 127:e362-e425.
3. Steg PG, James SK, Atar D, et al. ESC Guidelines for the management of acute myocardial infarction in patients presenting with ST-segment elevation: The Task Force on the management of ST-segment elevation acute myocardial infarction of the European Society of Cardiology (ESC). Eur Heart J 2012; 33:2569-619.
4. Department of Health. Treatment of heart attack national guidance: final report of the National Infarct Angioplasty Project (NIAP). London: Department of Health, 2008.
5. Myocardial Ischaemia National Audit Project. How the NHS cares for patients with heart attack. Annual Public Report April 2011 - March 2012. London. National Institute for Cardiovascular Outcomes Research, 2012.
6. Cannon CP, Gibson CM, Lambrew CT, et al. Relationship of Symptom-Onset-to-Balloon Time and Door-to-Balloon Time With Mortality in Patients Undergoing Angioplasty for Acute Myocardial Infarction. JAMA 2000; 283:2941-7.
7. Rathore SS, Curtis JP, Chen J, et al; National Cardiovascular Data Registry. Association of door-to-balloon time and mortality in patients admitted to hospital with ST elevation myocardial infarction: national cohort study. BMJ 2009; 338:b1807.
8. Nallamothu B, Fox KA, Kennelly BM, et al; GRACE Investigators. Relationship of treatment delays and mortality in patients undergoing fibrinolysis and primary percutaneous coronary intervention. The Global Registry of Acute Coronary Events. Heart 2007; 93:1552-5.
9. McNamara RL, Wang Y, Herrin J, et al; NRMI Investigators. Effect of Door-to-Balloon Time on Mortality in Patients With ST-Segment Elevation Myocardial Infarction. J Am Coll Cardiol 2006; 47:2180-6.
10. Hudson MP, Armstrong PW, O'Neil WW, et al. Mortality Implications of Primary Percutaneous Coronary Intervention Treatment Delays: Insights From the Assessment of Pexelizumab in Acute Myocardial Infarction Trial. Circ Cardiovasc Qual Outcomes 2011; 4:183-92.
11. Terkelsen CJ, Sørensen JT, Maeng M, et al. System delay and mortality among patients with STEMI treated with primary percutaneous coronary intervention. JAMA 2010; 304:763-71.
Page 24 of 27
12. Zahn R, Vogt A, Zeymer U, et al; Arbeitsgemeinschaft Leitender Kardiologischer Krankenhausärzte. In-hospital time to treatment of patients with acute ST elevation myocardial infarction treated with primary angioplasty: determinants and outcome. Results from the registry of percutaneous coronary interventions in acute myocardial infarction of the Arbeitsgemeinschaft Leitender Kardiologischer Krankenhausärzte. Heart 2005; 91:1041-6.
13. Brener SJ, Brodie BR, Guerchicoff A, et al. Impact of Pre-Procedural Cardiopulmonary Instability in Patients With Acute Myocardial Infarction Undergoing Primary Percutaneous Coronary Intervention (from the Harmonizing Outcomes With Revascularization and Stents in Acute Myocardial Infarction Trial). Am J Cardiol 2014; 114:962-7.
14. De Luca G, Suryapranata H, Zijlstra F, et al; ZWOLLE Myocardial Infarction Study Group. Symptom-onset-to-balloon time and mortality in patients with acute myocardial infarction treated by primary angioplasty. J Am Coll Cardiol 2003; 42:991-7.
15. Wang TY, Fonarow GC, Hernandez AF, et al. The dissociation between door-to-balloon time improvement and improvements in other acute myocardial infarction care processes and patient outcomes. Arch Intern Med 2009; 169:1411-9.
16. Flynn A, Moscucci M, Share D, et al. Trends in door-to-balloon time and mortality in patients with ST-elevation myocardial infarction undergoing primary percutaneous coronary intervention. Arch Intern Med 2010; 170:1842-9.
17. Menees DS, Peterson ED, Wang Y, et al. Door-to-Balloon Time and Mortality among Patients Undergoing Primary PCI. New Engl J Med 2013; 369:901-9.
18. Doll JA, Roe MT. Time to treatment as a quality metric for acute STEMI care. Lancet 2015; 385:1056-7.
19. Ludman PF. British Cardiovascular Intervention Society Registry for audit and quality assessment of percutaneous coronary interventions in the United Kingdom. Heart 2011; 97:1293-7.
20. British Cardiovascular Intervention Society. BCIS dataset version 5.6.2. Available from: http://www.bcis.org.uk/pages/page_box_contents.asp?pageid=693&navcatid=25 (accessed 13 September 2015)
21. White IR, Royston P, Wood AM. Multiple imputation using chained equations: Issues and guidance for practice. Stats Med 2011; 30:377-99.
22. Nallamothu BK, Normand SL, Wang Y, et al. Relation between door-to-balloon times and mortality after primary percutaneous coronary intervention over time: a retrospective study. Lancet 2015; 385:1114-22.
23. Koul S, Andell P, Martinsson A, et al. Delay From First Medical Contact to Primary PCI and All-Cause Mortality: A Nationwide Study of Patients With ST-Elevation Myocardial Infarction. J Am Heart Assoc 2014; 3:e000486.
24. Sorita A, Ahmed A, Starr SR, et al. Off-hour presentation and outcomes in patients with acute myocardial infarction: systematic review and meta-analysis. BMJ 2014; 348:f7393.
Page 25 of 27
25. Dasari TW, Roe MT, Chen AY, et al. Impact of Time of Presentation on Process Performance and Outcomes in ST-Segment-Elevation Myocardial Infarction: A Report From the American Heart Association: Mission Lifeline Program. Circ Cardiovasc Qual Outcomes 2014; 7:656-63.
26. Magid DJ, Wang Y, Herrin J, et al. Relationship between time of day, day of week, timeliness of reperfusion, and in-hospital mortality for patients with acute ST-segment elevation myocardial infarction. JAMA 2005; 294:803-12.
27. Jneid H, Fonarow GC, Cannon CP, et al; Get With the Guidelines Steering Committee and Investigators. Impact of Time of Presentation on the Care and Outcomes of Acute Myocardial Infarction. Circulation 2008; 117:2502-9.
28. National Clinical Guideline Centre. The acute management of myocardial infarction with ST-segment elevation. NICE clinical guideline 167. London: National Clinical Guideline Centre, 2013.
29. Armstrong PW, Gershlick AH, Goldstein P, et al; STREAM Investigative Team. Fibrinolysis or Primary PCI in ST-Segment Elevation Myocardial Infarction. New Engl J Med 2013; 368:1379-87.
30. Gershlick AH, Westerhout CM, Armstrong PW, et al. Impact of a pharmacoinvasive strategy when delays to primary PCI are prolonged. Heart 2015; 101:692-8.
31. Chung SC, Gedeborg R, Nicholas O, et al. Acute myocardial infarction: a comparison of short-term survival in national outcome registries in Sweden and the UK. Lancet 2014; 383:1305-12.
Page 26 of 27

Figure legends
Figure 1: Patient selection
Abbreviations: BCIS British Cardiovascular Intervention Society; PCI Percutaneous coronary
intervention; PPCI Primary percutaneous coronary intervention; STEMI ST segment
elevation myocardial infarction.
Duplicates refers to duplicate records
Repeat PPCI refers to a repeat PPCI procedure in the same year
Figure 2: Frequency of call to balloon times. Each bar represents a 15-minute interval
Figure 3: Kaplan-Meier plot of 30 day mortality by call to balloon time (with 90 and 150
minutes as cut-points)
Figure 4: Association between call to balloon time and 30-day mortality
Page 27 of 27


