
Presented by:
Lars Dzedek
Dmitry Antonov
Strategic Logistics Design and Network
Optimization –
Taking Your Supply Chain to the Next Level
© 2016 MHI® Copyright claimed for audiovisual works and sound recordings of seminar sessions. All rights reserved.
2
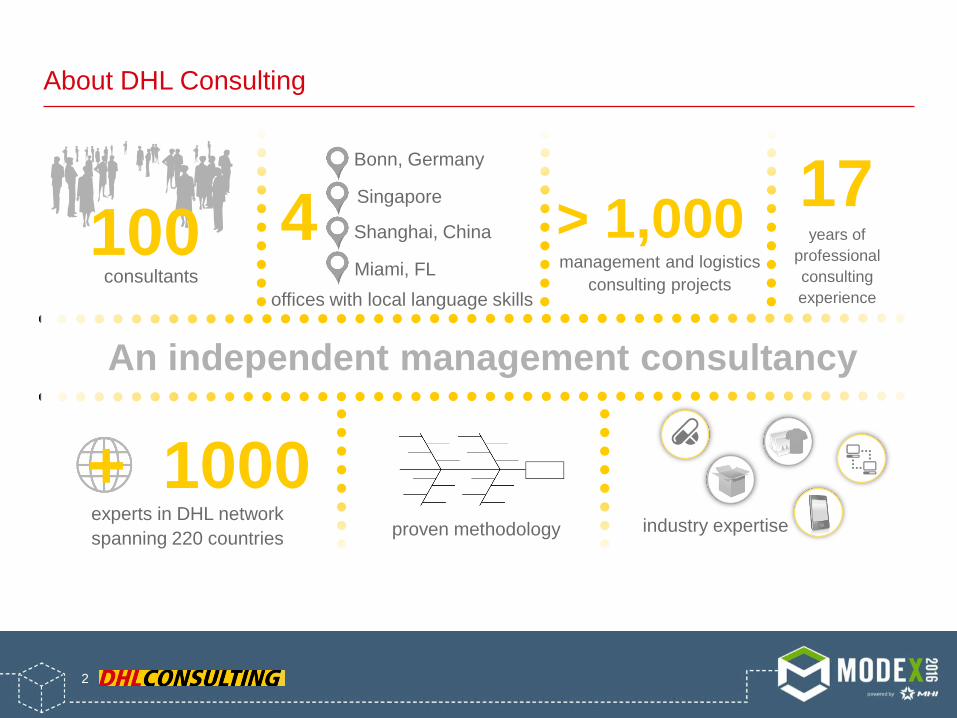
> 1,000
experts in DHL network
spanning 220 countries
17 years of
professional
consulting
experience
industry expertise
consultants
+ 1000
An independent management consultancy
management and logistics
consulting projects
Bonn, Germany
Singapore
Shanghai, China
Miami, FL
proven methodology
4 offices with local language skills
100
About DHL Consulting
3
Key Guidelines for Creating a Supply Chain Strategy
Insights from a Technology Case Study
Agenda
4
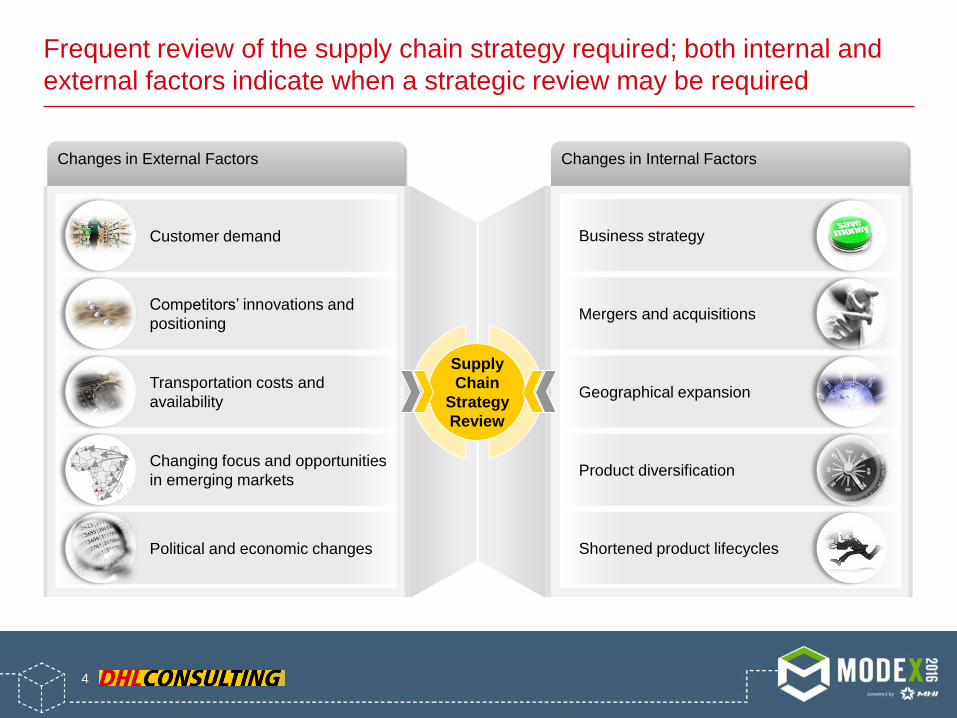
Frequent review of the supply chain strategy required; both internal and
external factors indicate when a strategic review may be required
Changes in Internal Factors
Product diversification
Shortened product lifecycles
Mergers and acquisitions
Geographical expansion
Business strategy
Changes in External Factors
Changing focus and opportunities
in emerging markets
Political and economic changes
Competitors’ innovations and
positioning
Transportation costs and
availability
Customer demand
Supply
Chain
Strategy
Review

5
Different elements of the supply chain can be optimized, from high level
supply chain strategy to network and process design
Alignment
with business
strategy
Differentiation by channel
Customer/Product segmentation
Strategic sourcing
Performance management
Outsourcing strategy
Organizational design and governance principles
Network design
Transport optimization Sales and operations planning
(S&OP)
Demand forecasting
Strategic facility design/ inventory optimization Process optimization
Benchmarking

6
Drive down operational costs and maximize efficiencies (e.g., 5-15% total SC costs)
Improve service level (e.g., 10-20% reduction in lead times)
Support growth (e.g., flexibility in SC setup)
Enhance customer satisfaction and service quality (e.g., product time to market)
Minimize risks
Optimize carbon emissions footprint (e.g., 10-30% CO2 emissions reductions)
Benefits of strategic supply chain re-design go beyond pure costs; quality
and customer satisfaction can also be positively impacted
FIGURES BASED ON DHL CONSULTING BEST PRACTICE
7
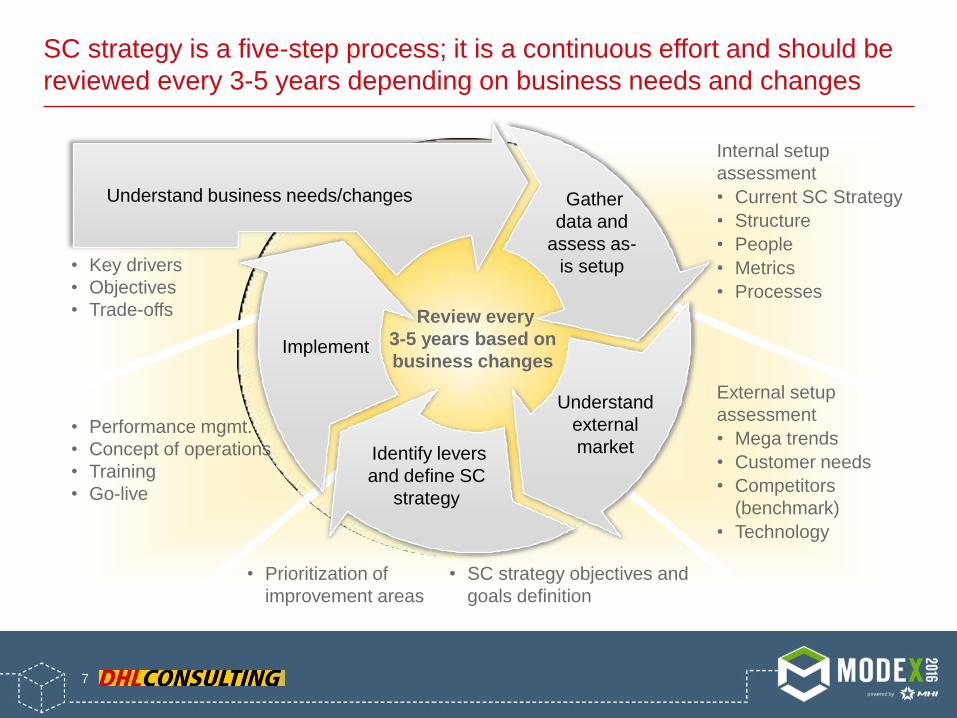
SC strategy is a five-step process; it is a continuous effort and should be
reviewed every 3-5 years depending on business needs and changes
Understand business needs/changes
Review every
3-5 years based on
business changes
Gather
data and
assess as-
is setup
Understand
external
market Identify levers
and define SC
strategy
Implement
Internal setup
assessment
• Current SC Strategy
• Structure
• People
• Metrics
• Processes
External setup
assessment
• Mega trends
• Customer needs
• Competitors
(benchmark)
• Technology
• Prioritization of
improvement areas
• Performance mgmt.
• Concept of operations
• Training
• Go-live
• Key drivers
• Objectives
• Trade-offs
• SC strategy objectives and
goals definition
8
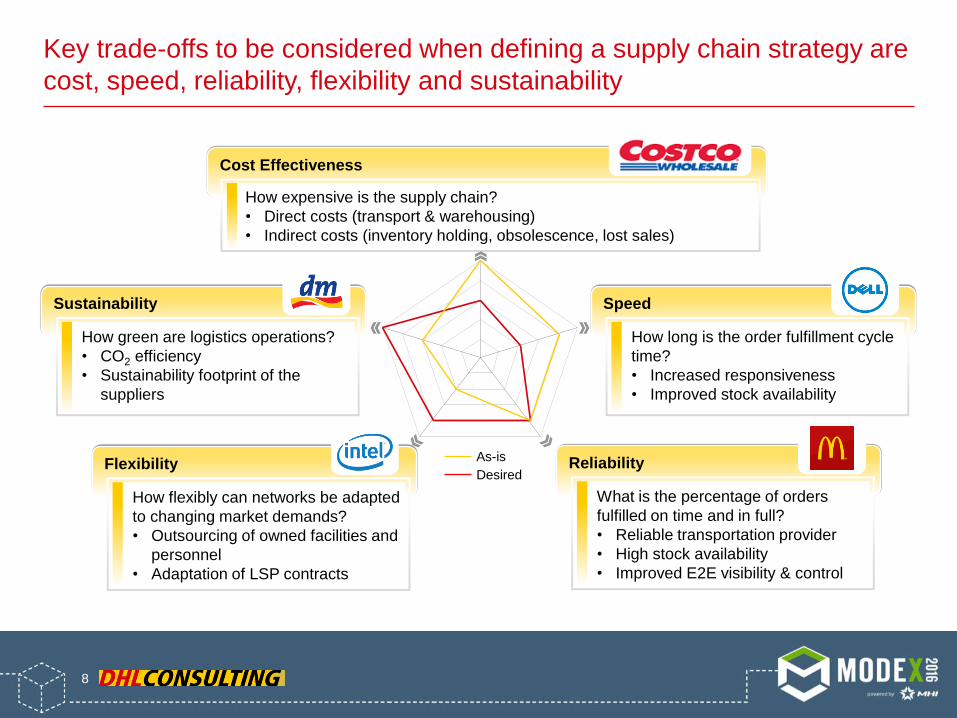
Sustainability
How green are logistics operations?
• CO2 efficiency
• Sustainability footprint of the
suppliers
Speed
How long is the order fulfillment cycle
time?
• Increased responsiveness
• Improved stock availability
Flexibility
How flexibly can networks be adapted
to changing market demands?
• Outsourcing of owned facilities and
personnel
• Adaptation of LSP contracts
Reliability
What is the percentage of orders
fulfilled on time and in full?
• Reliable transportation provider
• High stock availability
• Improved E2E visibility & control
Cost Effectiveness
How expensive is the supply chain?
• Direct costs (transport & warehousing)
• Indirect costs (inventory holding, obsolescence, lost sales)
As-is
Desired
Key trade-offs to be considered when defining a supply chain strategy are
cost, speed, reliability, flexibility and sustainability
9
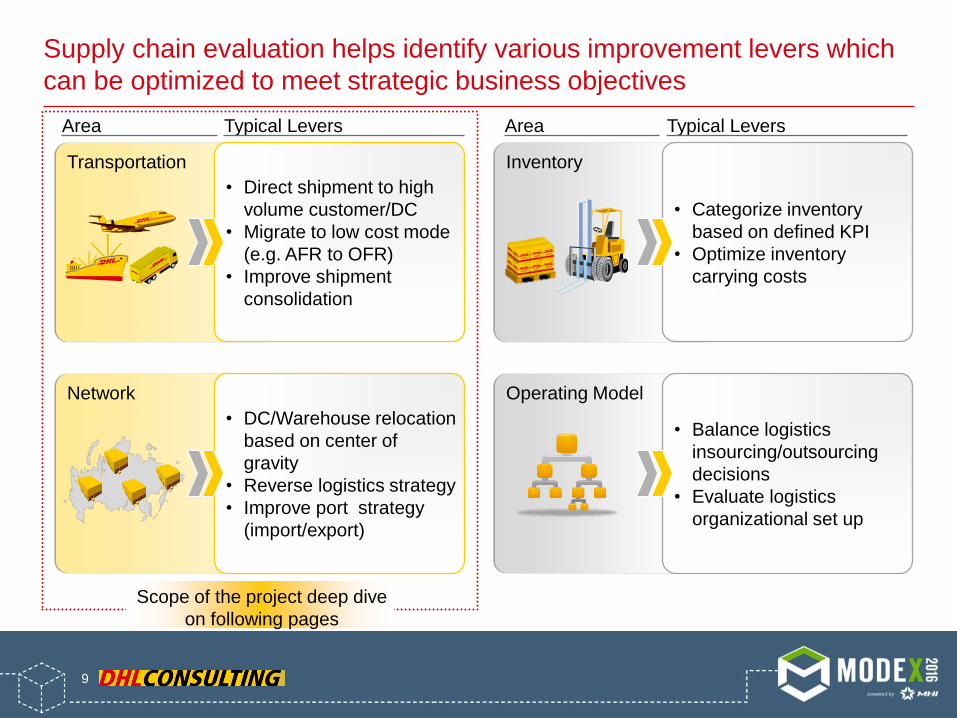
Supply chain evaluation helps identify various improvement levers which
can be optimized to meet strategic business objectives
Transportation
• Direct shipment to high
volume customer/DC
• Migrate to low cost mode
(e.g. AFR to OFR)
• Improve shipment
consolidation
Inventory
• Categorize inventory
based on defined KPI
• Optimize inventory
carrying costs
Operating Model
• Balance logistics
insourcing/outsourcing
decisions
• Evaluate logistics
organizational set up
Network
• DC/Warehouse relocation
based on center of
gravity
• Reverse logistics strategy
• Improve port strategy
(import/export)
Scope of the project deep dive
on following pages
Area Typical Levers Area Typical Levers

10
Key Guidelines for Creating a Supply Chain Strategy
Insights from a Technology Case Study
Agenda

11
Goal for a global technology company was to define a best-fit SC
model to distribute consumer electronics products in the US
Product Groups Objective
• Define best-fit SC model to distribute consumer
electronics products in the US
– Minimize order-to-delivery cycle times
– Increase availability of products in demand period
– Minimize total cost
Project SC Scope Project SC Scope
Manufacturing/
Packaging
International
Distribution Warehousing
Domestic
Distribution
End-to-end SC
Geography
USA and Canada
Notebook Tablets Desktop
Sector Operational Challenges
• High distribution costs
• Increasingly demanding lead times from
customers
• Low forecasting accuracy
• High returns volume and limited control over
return flows
Strategic Challenges
• No clear strategic direction on the SC
and missing ideas on how to improve
• Unknown total cost of
end-to-end SC
• Lack of transparency on pain points
Technology

12
Today’s case will highlight three steps of the SC strategy process: as-is
and external market assessment, levers identification & strategy definition
Understand business needs/changes
Project Steps
Gather
data and
assess as-
is setup
Understand
external
market Identify levers
and define SC
strategy
Implement
1
2
3
4
5
Project duration estimate

13
During data gathering, key things to consider are data quality, analysis
demand, level of detail, and alignment needs
Information Required
Products
and demand
Keep in
mind…
Cost
Logistic
information
• Products categories
• Customer demand
(volumes)
• Future growth forecast
• Transportation flows
• DC locations, profiles,
capacity and utilization
• Ongoing initiatives and
planned changes in Supply
Chain
• Direct
• Indirect
• Quality of data should be good:
– Data should be accurate
– Data should be complete
– Data source should be
standardized
• Clarity on the required analysis
and availability of data to support
analysis
• Knowledge of level of detail
required for analysis
• Alignment of bottom up operational
data with the top down view of P&L
data
Data quality is a key factor for project success
Key Success Factors

14
Project Example
West
DC
East
DC
Replenishment Direct
distribution
China
Production
As-is understanding covers two main areas: SC mapping and cost baseline;
outcomes are transparency on as-is setup, key costs, total costs, pain points
Areas
Provide transparency on as-is setup, key cost drivers and total costs and identify potential pain points
• Break down the business in
product groups (aggregate)
• Map the physical flow
• Capture information
• Identify constraints and
bottlenecks
Supply
Chain
Mapping
• Map end-to-end costs
– Direct costs
– Indirect
• Analyze key cost drivers and
hidden costs
• Identify potential issues
Cost
Baseline
Main costs: transportation, inventory
and loss of value
Warehousing
52%
Administration 2%
9%
Transportation
2%
100%
Loss of Value
1% Penalties
Total
Inventory Costs
34%
Dire
ct
Ind
ire
ct

15
Notebooks
Tablets
Desktops
OFR
Direct
(by AFR)
Replenishment SC Modal As-Is Finding
• Direct model has lowest cost per unit
• Savings opportunity when switching to
direct AFR
• High indirect costs for AFR
• Lowest cost per unit in direct model
• Cost improvement when switching to
direct AFR
• OFR has high direct costs
• OFR is the optimal cost scenario
• High AFR cost
• Indirect costs are high due to value loss
Products
Savings opportunities in AFR direct; desktops shipped primarily by OFR,
notebooks and tablets by AFR
84%
16%
58%
42%
31%
69%
Direct Costs Indirect Costs
81%
19% 66%
34% 72%
28%
88%
12% 76%
24%
48%
52%
Primary Mode (>90%)
Percentage of as-is Unit Cost
AFR

16
Benchmarking study provided insights into logistics strategy and
maturity/performance of major consumer electronic competitors’ SC setup
Results Key takeaways
Forecasting Accuracy
Long Haul Strategy
Production Strategy
Manufacturing Location • More than 90% of manufacturing is in China
• Many customers are evaluating near sourcing opportunities in Mexico
• Most technology companies manufacture to stock
• Limited high value customized products are made to order (e.g. for US Government)
• Forecasting accuracy generally low in industry (<50% accurate)
• Should not rely on it to plan supply chain strategy
• 80% of laptops & tablets use AFR for long haul
• Only low value older laptops & tablets shipped by OFR
Benchmarked entire product life cycle

17
7 Initiatives Identified For Optimization
Based on the as-is understanding and benchmarking study, seven
savings opportunities were identified
Tactical opportunities
Quick wins
Strategic opportunities
Deep-Dive
As-is U
nd
ers
tand
ing
In
du
str
y B
en
ch
ma
rkin
g
• Indirect cost are ~42% of logistics cost and
is mostly driven by loss of product value
• Notebook costs are ~63% of logistics cost
and shows highest optimization potential
• Desktop and tablet SC are optimized with
limited scope for improvement
• Trend is on increasing control and visibility
on returns; focus is on reselling return item
fast before product losses value
• Growing inclination towards increasing
manufacturing footprint in LATAM for
high value products
• Focus is on customizing supply chain by
product category and its requirements
Use of 45‘ OFR containers
FTZ at DHL general purpose zones
Warehousing footprint optimization
Returns pick-up on dock
Direct distribution of tablets from CN
Notebook postponement
Nearshoring notebooks
4
5
6
7
1
2
3

18
Manufacturing AFR DC Retailer DC
Manufacturing AFR Retailer DC
Stocking tablets in China/Direct Delivery
Recommendation
• Stocking tablets in China instead of US
• Shipping tablets directly to US customer DCs
through gateways
• Pursuing minimum inventory stockpile possible
Future Setup
Analysis
based on:
• Cost
• Volumes
• Service
levels
• Feasibility
In order to reduce direct costs by minimizing stockpile in the US
recommendation to increase direct distribution of tablets from China
Manufacturing AFR Customer DC Retailer
DC
Replenishment (>90% of volumes)
Current Setup
Description
• Tablets are produced in China and
shipped via AFR to US
• High costs of finish goods inventory
(FGI)
• Tablets have high value loss due to
FGI action and retailer markdowns in
fourth month of cycle

19
6 months 9 months 12 months 3 months
All initiatives implemented within 12 months, phased to allow for
resourcing and external constraints
Notebook postponement
Direct distribution of tablets from CN
Nearshoring notebooks
1
2
3
Strategic
Tactical FTZ at DHL general purpose zones
Use of 45‘ OFR containers
Warehousing footprint optimization
4
5
6
Quickly win Returns pick-
up on dock 7
All initiatives were:
• Implementable within a year
• Actionable
• Could be phased as required
20
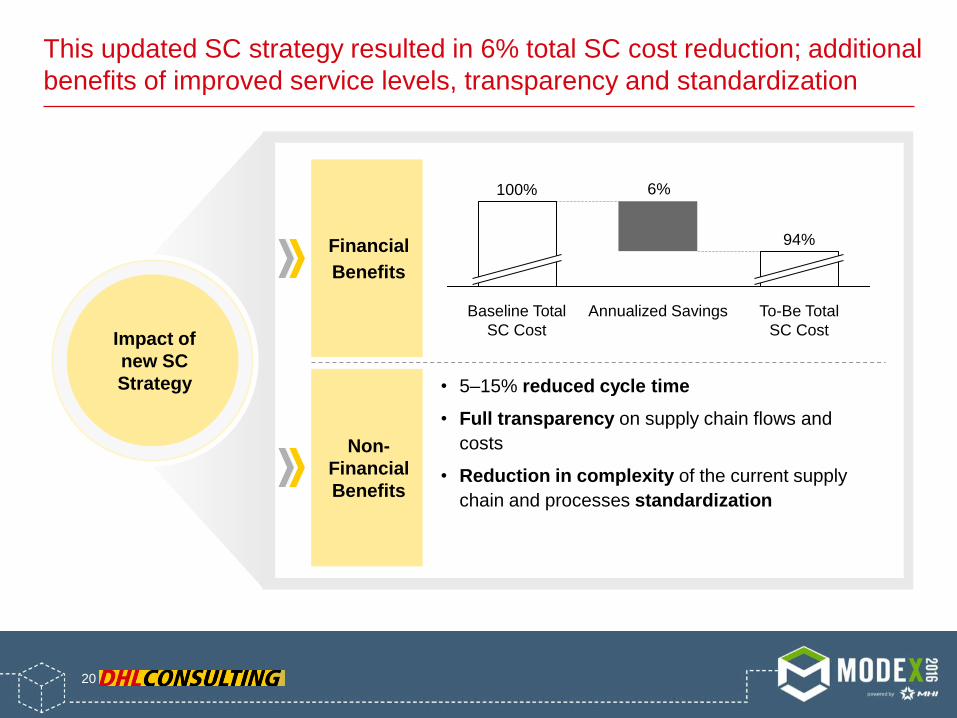
This updated SC strategy resulted in 6% total SC cost reduction; additional
benefits of improved service levels, transparency and standardization
6%
To-Be Total
SC Cost
94%
Annualized Savings Baseline Total
SC Cost
100%
Financial
Benefits
Non-
Financial
Benefits
Impact of
new SC
Strategy • 5–15% reduced cycle time
• Full transparency on supply chain flows and
costs
• Reduction in complexity of the current supply
chain and processes standardization
21
Key Takeaways
• Regularly review SC strategy and determine need to update/redesign
based on changes inside or outside your firm
• Engage “right” high level stakeholders from early on (e.g., CFO, CPO)
• Ensure that the SC strategy is linked to your firm’s overall strategy and
that it helps achieve larger corporate objectives & customer needs
• Plan in enough time to get a good view on the as-is setup incl. SC
mapping and main KPIs; be clear on “what” you want to analyze
• Hold meetings with key stakeholders to e.g. discuss results of as-is
analysis, prioritize improvement areas and start jointly “brainstorming” on
solution ideas
• When designing new SC strategy, leverage both quick wins and long
term improvement opportunities
• Design a clear and realistic implementation plan; ensure sufficient
resources to implement

22
For More Information:
Speaker email: [email protected]
Website: www.dhl-consulting.com
Speaker #2 email: [email protected]
Or visit MODEX 2016 Booth 2318


