HAL Id: hal-00731494https://hal.archives-ouvertes.fr/hal-00731494
Submitted on 1 Dec 2016
HAL is a multi-disciplinary open accessarchive for the deposit and dissemination of sci-entific research documents, whether they are pub-lished or not. The documents may come fromteaching and research institutions in France orabroad, or from public or private research centers.
L’archive ouverte pluridisciplinaire HAL, estdestinée au dépôt et à la diffusion de documentsscientifiques de niveau recherche, publiés ou non,émanant des établissements d’enseignement et derecherche français ou étrangers, des laboratoirespublics ou privés.
Stratospheric AOD after the 2011 eruption of Nabrovolcano measured by lidars over the Northern
HemispherePatricia Sawamura, Jean-Paul Vernier, J.-E. Barnes, Timothy A. Berkoff,
Ellsworth J. Welton, Lucas Alados-Arboledas, F. Navas-Guzmán, GelsominaPappalardo, Lucia Mona, Fabio Madonna, et al.
To cite this version:Patricia Sawamura, Jean-Paul Vernier, J.-E. Barnes, Timothy A. Berkoff, Ellsworth J. Welton, et al..Stratospheric AOD after the 2011 eruption of Nabro volcano measured by lidars over the NorthernHemisphere. Environmental Research Letters, IOP Publishing, 2012, 7 (3), pp.034013. �10.1088/1748-9326/7/3/034013�. �hal-00731494�
This content has been downloaded from IOPscience. Please scroll down to see the full text.
Download details:
IP Address: 212.198.139.186
This content was downloaded on 01/12/2016 at 20:51
Please note that terms and conditions apply.
Stratospheric AOD after the 2011 eruption of Nabro volcano measured by lidars over the
Northern Hemisphere
View the table of contents for this issue, or go to the journal homepage for more
2012 Environ. Res. Lett. 7 034013
(http://iopscience.iop.org/1748-9326/7/3/034013)
Home Search Collections Journals About Contact us My IOPscience
You may also be interested in:
Small volcanic eruptions and the stratospheric sulfate aerosol burden
David M Pyle
The impact of geoengineering aerosols on stratospheric temperature and ozone
P Heckendorn, D Weisenstein, S Fueglistaler et al.
New differential absorption lidar for stratospheric ozone monitoring in Patagonia, SouthArgentina
E A Wolfram, J Salvador, R D’Elia et al.
Detection of Atmospheric Composition Based on Lidar
Jinye Zhang, Yala Tong, Xiaoling Yang et al.
Intense dust and extremely fresh biomass burning outbreak in Barcelona, Spain: characterization of
their optical properties and estimation of their direct radiative forcing
M Sicard, M Mallet, D García-Vizcaíno et al.
Corrigendum: Small volcanic eruptions and the stratospheric sulfate aerosol burden
David M Pyle
Comparison of Aerosol optical depth (AOD) derived from AERONET sunphotometer and Lidar system
Wei Ying Khor, Wan Shen Hee, Fuyi Tan et al.
EARLINET coordinated lidar observations of Saharan dust events on continental scale
G Pappalardo, A Papayannis, J Bösenberg et al.
Monitoring of atmospheric trace gases, clouds, aerosols and surface properties fromUV/vis/NIR
satellite instruments
T Wagner, S Beirle, T Deutschmann et al.
IOP PUBLISHING ENVIRONMENTAL RESEARCH LETTERS
Environ. Res. Lett. 7 (2012) 034013 (9pp) doi:10.1088/1748-9326/7/3/034013
Stratospheric AOD after the 2011eruption of Nabro volcano measured bylidars over the Northern Hemisphere
P Sawamura1, J P Vernier2, J E Barnes3, T A Berkoff4, E J Welton5,L Alados-Arboledas6, F Navas-Guzman6, G Pappalardo7, L Mona7,F Madonna7, D Lange8,9, M Sicard8,9, S Godin-Beekmann10, G Payen10,Z Wang11, S Hu11, S N Tripathi12, C Cordoba-Jabonero13 andR M Hoff1,4
1 Department of Physics, University of Maryland, Baltimore County, 1000 Hilltop Circle, Baltimore,MD 21250, USA2 NASA Langley Research Center, Hampton, VA 23666, USA3 NOAA/ESRL/Mauna Loa Observatory, Hilo, HI 96720, USA4 Joint Center for Earth Systems Technology, Baltimore, MD, USA5 NASA Goddard Space Flight Center, Greenbelt, MD 20771, USA6 Centro Andaluz de Medio Ambiente, Junta de Andalucıa-Universidad de Granada, Avenida DelMediterraneo S/N 18071, Granada, Spain7 Consiglio Nazionale delle Ricerche—Istituto di Metodologie per l’Analisi Ambientale (CNR-IMAA),C.da S.Loja, I-85050 Tito Scalo, Potenza, Italy8 Remote Sensing Laboratory, Universitat Politecnica de Catalunya, E-08034 Barcelona, Spain9 Institut d’Estudis Espacials de Catalunya/UPC, Barcelona, Spain10 Laboratoire Atmospheres, Milieux, Observations Spatiales, Universite Pierre et Marie Curie, CentreNational de La Recherche Scientifique, France11 Key Laboratory of Atmospheric Composition and Optical Radiation, Anhui Institute of Optics andFine Mechanics, Chinese Academy of Sciences, Hefei, Anhui 230031, People’s Republic of China12 Department of Civil Engineering and Center for Environmental Science and Engineering, IndianInstitute of Technology Kanpur, Uttar Pradesh, 208016, India13 Instituto Nacional de Tecnica Aerospacial, 28850 Torrejon de Ardoz, Madrid, Spain
E-mail: [email protected]
Received 11 June 2012Accepted for publication 17 July 2012Published 6 August 2012Online at stacks.iop.org/ERL/7/034013
AbstractNabro volcano (13.37◦N, 41.70◦E) in Eritrea erupted on 13 June 2011 generating a layer of sulfate aerosols that persistedin the stratosphere for months. For the first time we report on ground-based lidar observations of the same event from everycontinent in the Northern Hemisphere, taking advantage of the synergy between global lidar networks such as EARLINET,MPLNET and NDACC with independent lidar groups and satellite CALIPSO to track the evolution of the stratosphericaerosol layer in various parts of the globe. The globally averaged aerosol optical depth (AOD) due to the stratospheric vol-canic aerosol layers was of the order of 0.018±0.009 at 532 nm, ranging from 0.003 to 0.04. Compared to the total columnAOD from the available collocated AERONET stations, the stratospheric contribution varied from 2% to 23% at 532 nm.
Keywords: Nabro volcano, stratospheric AOD, lidar network
Content from this work may be used under the termsof the Creative Commons Attribution-NonCommercial-
ShareAlike 3.0 licence. Any further distribution of this work must maintainattribution to the author(s) and the title of the work, journal citation and DOI.
11748-9326/12/034013+09$33.00 c© 2012 IOP Publishing Ltd Printed in the UK
Environ. Res. Lett. 7 (2012) 034013 P Sawamura et al
1. Introduction
The injection of SO2 due to volcanic eruptions is the biggestnatural source of perturbations in the stratosphere (Robock2000). SO2 converts to sulfuric acid which will quicklycondense, forming fine sulfate aerosols in the stratosphere.These aerosols have longer residence times (1–3 yr) comparedto ash and tropospheric sulfate aerosols (typically days andweeks respectively). Explosive eruptions like Pinatubo in1991 are the proof of how such events can impact our climateand the global temperature at the surface (McCormick et al1995).
Due to their extended residence time once injected intothe stratosphere, these particles can travel large distances.Global monitoring of the stratosphere is, therefore, of greatimportance. In particular, ground-based lidar techniques havealready been demonstrated to be a powerful method since1974 (McCormick and Fuller 1975, Shaw 1975, Wandingeret al 1995, Di Girolamo et al 1996).
Lidar observations can be even more meaningful whencarried out in coordinated networks as they are fundamental tothe study of aerosols on a large spatial scale. This is especiallytrue in cases of aerosol transport and modification phenomenathat are relevant for climate and risk management purposes,like in the case of air traffic safety in the event of majorvolcanic eruptions.
Regardless of the source, the optical properties ofstratospheric aerosols must be properly quantified. Ifneglected, the pertubations caused by these particles canrepresent an error source in lidar measurements of tracegases in the stratosphere and also in comparative studies ofcolumn-integrated versus ground-based measurements suchas the DISCOVER-AQ project described in section 4. In fact,it was during DISCOVER-AQ that the stratospheric layersover Maryland, USA were first noticed, which then led to amore comprehensive analysis of the event, finally culminatingin this letter.
The changes in the background stratospheric aerosolload, even in the absence of major volcanic eruptions, isthe subject of an ongoing debate. Hofmann et al (2009)reports a yearly increase of 4–7% in the aerosol backscatterbetween 20 and 30 km since 2000 as measured by lidarsin Mauna Loa, Hawaii and Boulder, Colorado. From thethree main sources of stratospheric aerosol load, i.e. volcanicemissions to the stratosphere, increased tropical upwellingand increase in anthropogenic SO2, the latter case seems tobe the most likely cause for the increase. However, there arealso indications that smaller volcanic eruptions have moreimpact in the background stratospheric aerosol load thanpreviously thought (Vernier et al 2009, 2011) and Solomonet al (2011) points out from the CALIPSO record that theso-called stratospheric background seems to be, in general,affected to some extent by volcanic emissions over the lastdecade.
In this letter we report synergistic measurements frommultiple lidar networks and satellite CALIPSO to trackthe evolution of stratospheric aerosols in the NorthernHemisphere, originating from Nabro’s eruption that occurred
in Eritrea on 13 June 2011. The particles remained in thestratosphere for months following the eruption. Accordingto satellite (CALIPSO and OMI) records from the monthspertaining to this study, the stratospheric signatures herereported were all due to Nabro’s eruption, with a couple ofexceptions that are discussed further in this letter.
1.1. Nabro volcano, Eritrea
Nabro is a stratovolcano located in the Afar Triangle at theborder between northeastern Ethiopia and southern Eritrea. Itis a 2218 m high volcano, the highest in the Afar Triangle,sitting at the triple junction between the Arabian, Somalianand Nubian tectonic plates along the East African RiftZone (Wiart and Oppenheimer 2005).
Nabro’s first ever recorded eruption occurred on 13 June2011 when it spewed copious amounts of ash disrupting theair traffic in Eastern Africa. According to reports from theSmithsonian’s Global Volcanism Program (SGVP 2011), aftera series of moderate earthquakes struck the region in theevening of 12 June, Nabro started erupting between 0300 and0500 EAT (East Africa Time = UTC + 3 h), with visibleplumes rising up to an altitude of 13 km consisting mainly ofwater vapor and sulfur dioxide gas. Preliminary analysis fromthe Ozone Monitoring Instrument (OMI) suggested an SO2release of approximately 1.3 Tg in the first few days (Carn2011, Krotkov et al 2011) and retrievals from the InfraredAtmospheric Sounding Interferometer (IASI) later indicateda 1.5 Tg load of SO2 (Clarisse et al 2012). Scattered sunlightmeasurements from the limb-scanning Optical Spectrographand Infra-Red Imaging System (OSIRIS) shows that Nabrocaused the largest stratospheric signature ever measured bythis instrument (Bourassa et al 2012).
Weaker eruptions from Nabro continued to be detectedby the Toulouse Volcanic Ash Advisory Center (VAAC)until mid-July and the latest activity prior to submission wasreported in late September.
1.2. Measurements
Laser remote sensing, i.e. lidar, is an indispensable toolto help assess the vertical distribution of aerosol in theatmosphere. Space-borne lidar, like the Cloud–Aerosol Lidarwith Orthogonal Polarization (CALIOP) onboard CALIPSO(Cloud–Aerosol Lidar and Infrared Pathfinder SatelliteObservations) (Winker et al 2003), has a narrow swathand therefore does not provide complete global coverage.To fill those gaps in terms of spatial coverage, networksof ground-based lidars such as EARLINET, MPLNET andthe Network for the Detection of Atmospheric CompositionChange (NDACC) are of extreme value.
The Micro-Pulse Lidar Network (MPLNET) (Weltonet al 2001) is a global network of low power lidars providinglong-term observations of aerosol and cloud properties.MPLNET data usually requires a correction for the overlapfunction in the 0–6 km range to account for losses in thenear-field receiver efficiency (Berkoff et al 2003). However,all data from MPLNET in this study were in the stratosphere
2
Environ. Res. Lett. 7 (2012) 034013 P Sawamura et al
Table 1. Lidar systems description.
Location (Lat, Lon) Elevation (a.s.l.) System
Sede Boker, Israel (30.85◦N, 34.78◦E) 480 m MPL @ 523 nmSanta Cruz de Tenerife (Canary Islands) (28.47◦N, 16.25◦W) 52 m MPL @ 523 nmGSFC, MD, USA (38.99◦N, 76.84◦W) 50 m MPL @ 527 nmTrinidad Head, CA, USA (41.05◦N, 124.15◦W) 107 m MPL @ 527 nmKanpur, India (26.52◦N, 80.23◦E) 150 m MPL @ 532 nmUPC, Barcelona, Spain (41.39◦N, 2.11◦E) 115 m Nd:YAG @ 3λ0
a+ Raman @ 2λN2
b
Granada, Spain (37.16◦N, 3.61◦W) 680 m Nd:YAG @ 3λ0a+ Raman @ 2λN2
b
MLO, HI, USA (19.54◦N, 155.58◦W) 3397 m Nd:YAG @ 1064 and 532 nmCNR-IMAA, Potenza, Italy (40.60◦N, 15.73◦E) 760 m ND:YAG @ 3λ0
a+ Raman @ 2λN2
b
Hefei, China (31.9◦N, 117.2◦E) 30 m Nd:YAG @ 532 nmOHP, France (43.93◦N, 5.71◦E) 650 m DIAL @ 355 nm
a Elastic channels at 1064, 532 and 355 nm.b N2 Raman channels at 387 and 607 nm.
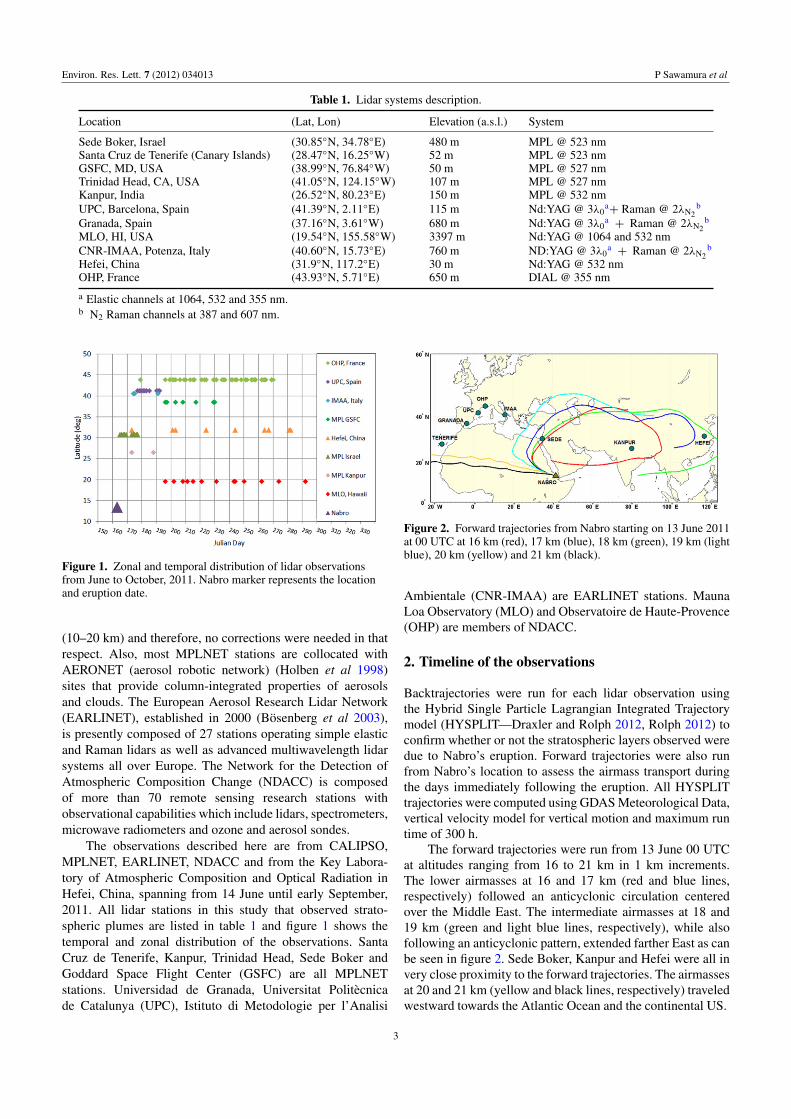
Figure 1. Zonal and temporal distribution of lidar observationsfrom June to October, 2011. Nabro marker represents the locationand eruption date.
(10–20 km) and therefore, no corrections were needed in thatrespect. Also, most MPLNET stations are collocated withAERONET (aerosol robotic network) (Holben et al 1998)sites that provide column-integrated properties of aerosolsand clouds. The European Aerosol Research Lidar Network(EARLINET), established in 2000 (Bosenberg et al 2003),is presently composed of 27 stations operating simple elasticand Raman lidars as well as advanced multiwavelength lidarsystems all over Europe. The Network for the Detection ofAtmospheric Composition Change (NDACC) is composedof more than 70 remote sensing research stations withobservational capabilities which include lidars, spectrometers,microwave radiometers and ozone and aerosol sondes.
The observations described here are from CALIPSO,MPLNET, EARLINET, NDACC and from the Key Labora-tory of Atmospheric Composition and Optical Radiation inHefei, China, spanning from 14 June until early September,2011. All lidar stations in this study that observed strato-spheric plumes are listed in table 1 and figure 1 shows thetemporal and zonal distribution of the observations. SantaCruz de Tenerife, Kanpur, Trinidad Head, Sede Boker andGoddard Space Flight Center (GSFC) are all MPLNETstations. Universidad de Granada, Universitat Politecnicade Catalunya (UPC), Istituto di Metodologie per l’Analisi
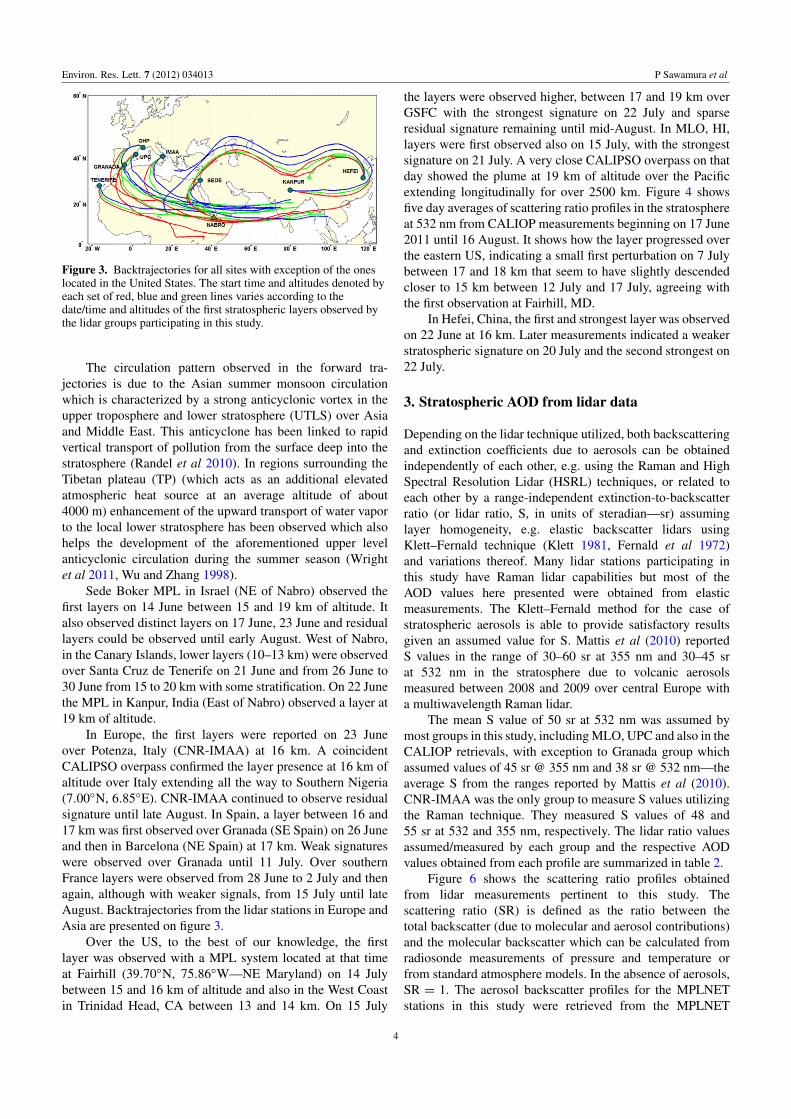
Figure 2. Forward trajectories from Nabro starting on 13 June 2011at 00 UTC at 16 km (red), 17 km (blue), 18 km (green), 19 km (lightblue), 20 km (yellow) and 21 km (black).
Ambientale (CNR-IMAA) are EARLINET stations. MaunaLoa Observatory (MLO) and Observatoire de Haute-Provence(OHP) are members of NDACC.
2. Timeline of the observations
Backtrajectories were run for each lidar observation usingthe Hybrid Single Particle Lagrangian Integrated Trajectorymodel (HYSPLIT—Draxler and Rolph 2012, Rolph 2012) toconfirm whether or not the stratospheric layers observed weredue to Nabro’s eruption. Forward trajectories were also runfrom Nabro’s location to assess the airmass transport duringthe days immediately following the eruption. All HYSPLITtrajectories were computed using GDAS Meteorological Data,vertical velocity model for vertical motion and maximum runtime of 300 h.
The forward trajectories were run from 13 June 00 UTCat altitudes ranging from 16 to 21 km in 1 km increments.The lower airmasses at 16 and 17 km (red and blue lines,respectively) followed an anticyclonic circulation centeredover the Middle East. The intermediate airmasses at 18 and19 km (green and light blue lines, respectively), while alsofollowing an anticyclonic pattern, extended farther East as canbe seen in figure 2. Sede Boker, Kanpur and Hefei were all invery close proximity to the forward trajectories. The airmassesat 20 and 21 km (yellow and black lines, respectively) traveledwestward towards the Atlantic Ocean and the continental US.
3
Environ. Res. Lett. 7 (2012) 034013 P Sawamura et al
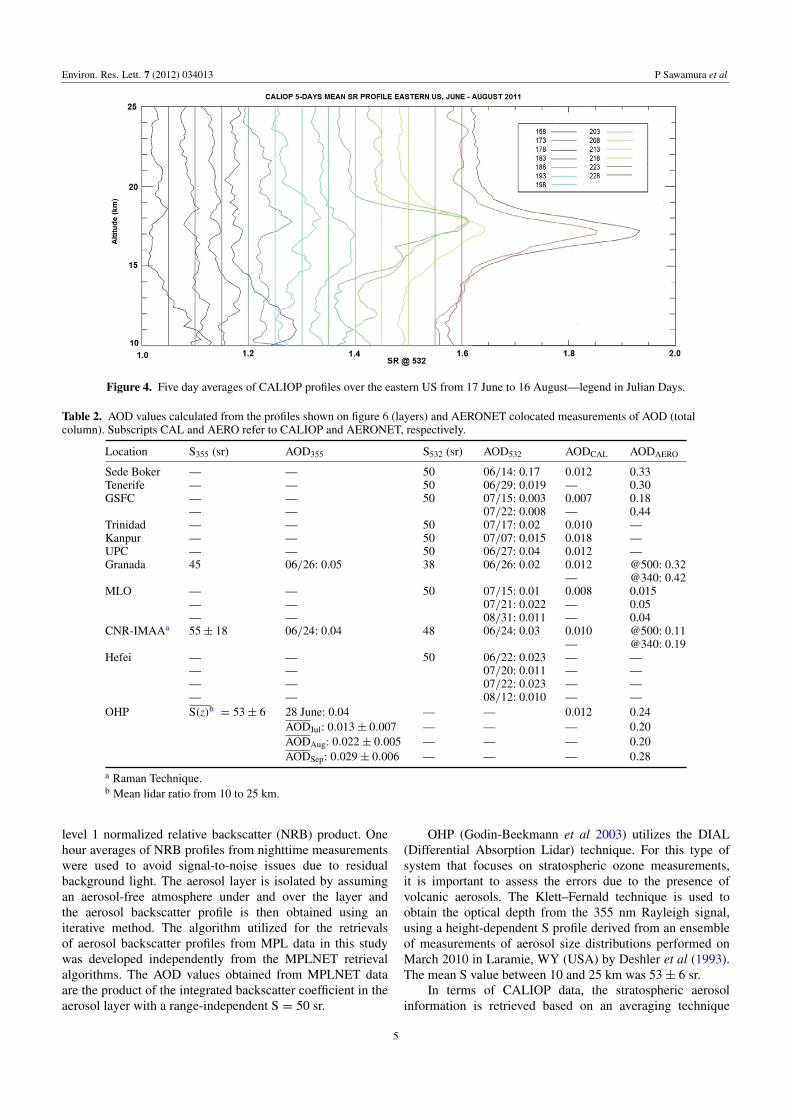
Figure 3. Backtrajectories for all sites with exception of the oneslocated in the United States. The start time and altitudes denoted byeach set of red, blue and green lines varies according to thedate/time and altitudes of the first stratospheric layers observed bythe lidar groups participating in this study.
The circulation pattern observed in the forward tra-jectories is due to the Asian summer monsoon circulationwhich is characterized by a strong anticyclonic vortex in theupper troposphere and lower stratosphere (UTLS) over Asiaand Middle East. This anticyclone has been linked to rapidvertical transport of pollution from the surface deep into thestratosphere (Randel et al 2010). In regions surrounding theTibetan plateau (TP) (which acts as an additional elevatedatmospheric heat source at an average altitude of about4000 m) enhancement of the upward transport of water vaporto the local lower stratosphere has been observed which alsohelps the development of the aforementioned upper levelanticyclonic circulation during the summer season (Wrightet al 2011, Wu and Zhang 1998).
Sede Boker MPL in Israel (NE of Nabro) observed thefirst layers on 14 June between 15 and 19 km of altitude. Italso observed distinct layers on 17 June, 23 June and residuallayers could be observed until early August. West of Nabro,in the Canary Islands, lower layers (10–13 km) were observedover Santa Cruz de Tenerife on 21 June and from 26 June to30 June from 15 to 20 km with some stratification. On 22 Junethe MPL in Kanpur, India (East of Nabro) observed a layer at19 km of altitude.
In Europe, the first layers were reported on 23 Juneover Potenza, Italy (CNR-IMAA) at 16 km. A coincidentCALIPSO overpass confirmed the layer presence at 16 km ofaltitude over Italy extending all the way to Southern Nigeria(7.00◦N, 6.85◦E). CNR-IMAA continued to observe residualsignature until late August. In Spain, a layer between 16 and17 km was first observed over Granada (SE Spain) on 26 Juneand then in Barcelona (NE Spain) at 17 km. Weak signatureswere observed over Granada until 11 July. Over southernFrance layers were observed from 28 June to 2 July and thenagain, although with weaker signals, from 15 July until lateAugust. Backtrajectories from the lidar stations in Europe andAsia are presented on figure 3.
Over the US, to the best of our knowledge, the firstlayer was observed with a MPL system located at that timeat Fairhill (39.70◦N, 75.86◦W—NE Maryland) on 14 Julybetween 15 and 16 km of altitude and also in the West Coastin Trinidad Head, CA between 13 and 14 km. On 15 July
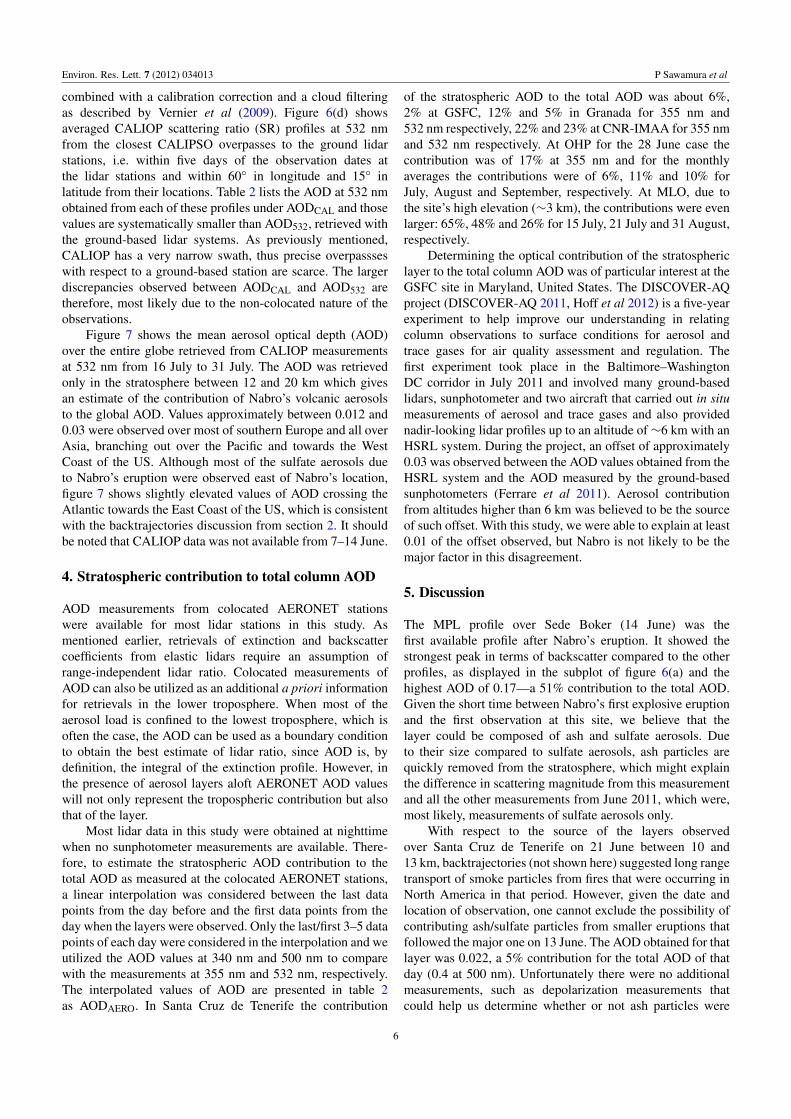
the layers were observed higher, between 17 and 19 km overGSFC with the strongest signature on 22 July and sparseresidual signature remaining until mid-August. In MLO, HI,layers were first observed also on 15 July, with the strongestsignature on 21 July. A very close CALIPSO overpass on thatday showed the plume at 19 km of altitude over the Pacificextending longitudinally for over 2500 km. Figure 4 showsfive day averages of scattering ratio profiles in the stratosphereat 532 nm from CALIOP measurements beginning on 17 June2011 until 16 August. It shows how the layer progressed overthe eastern US, indicating a small first perturbation on 7 Julybetween 17 and 18 km that seem to have slightly descendedcloser to 15 km between 12 July and 17 July, agreeing withthe first observation at Fairhill, MD.
In Hefei, China, the first and strongest layer was observedon 22 June at 16 km. Later measurements indicated a weakerstratospheric signature on 20 July and the second strongest on22 July.
3. Stratospheric AOD from lidar data
Depending on the lidar technique utilized, both backscatteringand extinction coefficients due to aerosols can be obtainedindependently of each other, e.g. using the Raman and HighSpectral Resolution Lidar (HSRL) techniques, or related toeach other by a range-independent extinction-to-backscatterratio (or lidar ratio, S, in units of steradian—sr) assuminglayer homogeneity, e.g. elastic backscatter lidars usingKlett–Fernald technique (Klett 1981, Fernald et al 1972)and variations thereof. Many lidar stations participating inthis study have Raman lidar capabilities but most of theAOD values here presented were obtained from elasticmeasurements. The Klett–Fernald method for the case ofstratospheric aerosols is able to provide satisfactory resultsgiven an assumed value for S. Mattis et al (2010) reportedS values in the range of 30–60 sr at 355 nm and 30–45 srat 532 nm in the stratosphere due to volcanic aerosolsmeasured between 2008 and 2009 over central Europe witha multiwavelength Raman lidar.
The mean S value of 50 sr at 532 nm was assumed bymost groups in this study, including MLO, UPC and also in theCALIOP retrievals, with exception to Granada group whichassumed values of 45 sr @ 355 nm and 38 sr @ 532 nm—theaverage S from the ranges reported by Mattis et al (2010).CNR-IMAA was the only group to measure S values utilizingthe Raman technique. They measured S values of 48 and55 sr at 532 and 355 nm, respectively. The lidar ratio valuesassumed/measured by each group and the respective AODvalues obtained from each profile are summarized in table 2.
Figure 6 shows the scattering ratio profiles obtainedfrom lidar measurements pertinent to this study. Thescattering ratio (SR) is defined as the ratio between thetotal backscatter (due to molecular and aerosol contributions)and the molecular backscatter which can be calculated fromradiosonde measurements of pressure and temperature orfrom standard atmosphere models. In the absence of aerosols,SR = 1. The aerosol backscatter profiles for the MPLNETstations in this study were retrieved from the MPLNET
4
Environ. Res. Lett. 7 (2012) 034013 P Sawamura et al
Figure 4. Five day averages of CALIOP profiles over the eastern US from 17 June to 16 August—legend in Julian Days.
Table 2. AOD values calculated from the profiles shown on figure 6 (layers) and AERONET colocated measurements of AOD (totalcolumn). Subscripts CAL and AERO refer to CALIOP and AERONET, respectively.
Location S355 (sr) AOD355 S532 (sr) AOD532 AODCAL AODAERO
Sede Boker — — 50 06/14: 0.17 0.012 0.33Tenerife — — 50 06/29: 0.019 — 0.30GSFC — — 50 07/15: 0.003 0.007 0.18
— — 07/22: 0.008 — 0.44Trinidad — — 50 07/17: 0.02 0.010 —Kanpur — — 50 07/07: 0.015 0.018 —UPC — — 50 06/27: 0.04 0.012 —Granada 45 06/26: 0.05 38 06/26: 0.02 0.012 @500: 0.32
— @340: 0.42MLO — — 50 07/15: 0.01 0.008 0.015
— — 07/21: 0.022 — 0.05— — 08/31: 0.011 — 0.04
CNR-IMAAa 55± 18 06/24: 0.04 48 06/24: 0.03 0.010 @500: 0.11— @340: 0.19
Hefei — — 50 06/22: 0.023 — —— — 07/20: 0.011 — —— — 07/22: 0.023 — —— — 08/12: 0.010 — —
OHP S(z)b = 53± 6 28 June: 0.04 — — 0.012 0.24AODJul: 0.013± 0.007 — — — 0.20AODAug: 0.022± 0.005 — — — 0.20AODSep: 0.029± 0.006 — — — 0.28
a Raman Technique.b Mean lidar ratio from 10 to 25 km.
level 1 normalized relative backscatter (NRB) product. Onehour averages of NRB profiles from nighttime measurementswere used to avoid signal-to-noise issues due to residualbackground light. The aerosol layer is isolated by assumingan aerosol-free atmosphere under and over the layer andthe aerosol backscatter profile is then obtained using aniterative method. The algorithm utilized for the retrievalsof aerosol backscatter profiles from MPL data in this studywas developed independently from the MPLNET retrievalalgorithms. The AOD values obtained from MPLNET dataare the product of the integrated backscatter coefficient in theaerosol layer with a range-independent S = 50 sr.
OHP (Godin-Beekmann et al 2003) utilizes the DIAL(Differential Absorption Lidar) technique. For this type ofsystem that focuses on stratospheric ozone measurements,it is important to assess the errors due to the presence ofvolcanic aerosols. The Klett–Fernald technique is used toobtain the optical depth from the 355 nm Rayleigh signal,using a height-dependent S profile derived from an ensembleof measurements of aerosol size distributions performed onMarch 2010 in Laramie, WY (USA) by Deshler et al (1993).The mean S value between 10 and 25 km was 53± 6 sr.
In terms of CALIOP data, the stratospheric aerosolinformation is retrieved based on an averaging technique
5
Environ. Res. Lett. 7 (2012) 034013 P Sawamura et al
combined with a calibration correction and a cloud filteringas described by Vernier et al (2009). Figure 6(d) showsaveraged CALIOP scattering ratio (SR) profiles at 532 nmfrom the closest CALIPSO overpasses to the ground lidarstations, i.e. within five days of the observation dates atthe lidar stations and within 60◦ in longitude and 15◦ inlatitude from their locations. Table 2 lists the AOD at 532 nmobtained from each of these profiles under AODCAL and thosevalues are systematically smaller than AOD532, retrieved withthe ground-based lidar systems. As previously mentioned,CALIOP has a very narrow swath, thus precise overpassseswith respect to a ground-based station are scarce. The largerdiscrepancies observed between AODCAL and AOD532 aretherefore, most likely due to the non-colocated nature of theobservations.
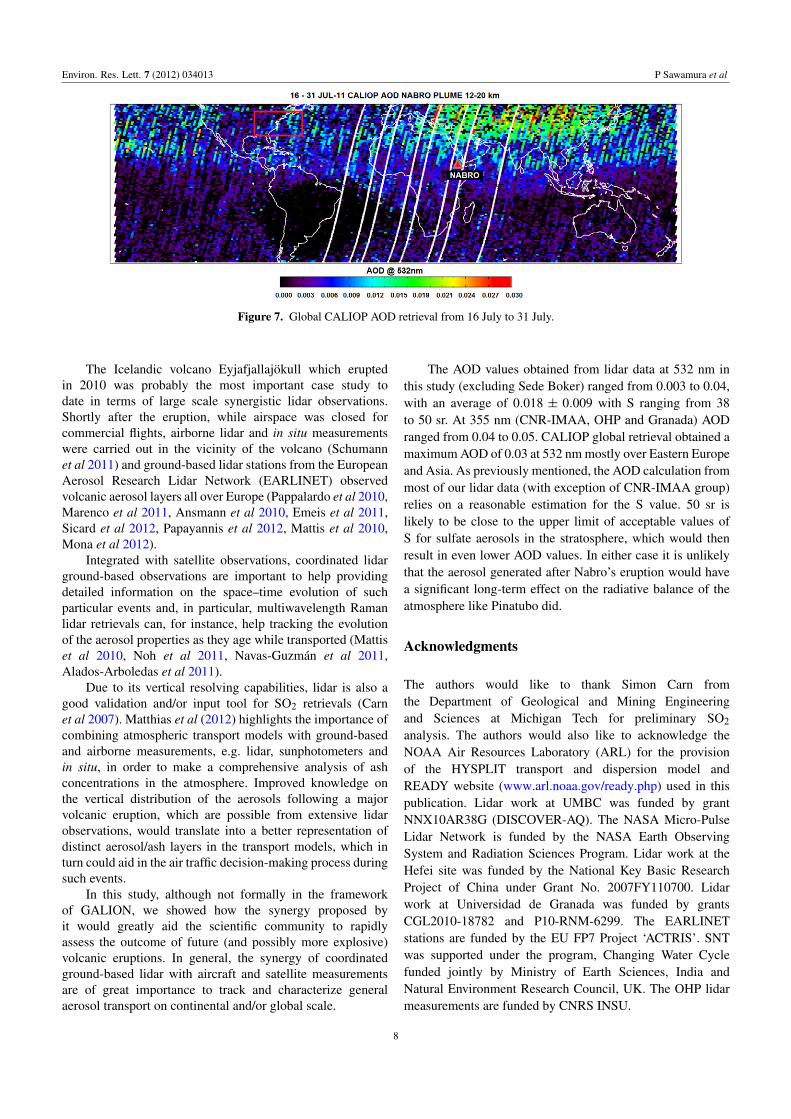
Figure 7 shows the mean aerosol optical depth (AOD)over the entire globe retrieved from CALIOP measurementsat 532 nm from 16 July to 31 July. The AOD was retrievedonly in the stratosphere between 12 and 20 km which givesan estimate of the contribution of Nabro’s volcanic aerosolsto the global AOD. Values approximately between 0.012 and0.03 were observed over most of southern Europe and all overAsia, branching out over the Pacific and towards the WestCoast of the US. Although most of the sulfate aerosols dueto Nabro’s eruption were observed east of Nabro’s location,figure 7 shows slightly elevated values of AOD crossing theAtlantic towards the East Coast of the US, which is consistentwith the backtrajectories discussion from section 2. It shouldbe noted that CALIOP data was not available from 7–14 June.
4. Stratospheric contribution to total column AOD
AOD measurements from colocated AERONET stationswere available for most lidar stations in this study. Asmentioned earlier, retrievals of extinction and backscattercoefficients from elastic lidars require an assumption ofrange-independent lidar ratio. Colocated measurements ofAOD can also be utilized as an additional a priori informationfor retrievals in the lower troposphere. When most of theaerosol load is confined to the lowest troposphere, which isoften the case, the AOD can be used as a boundary conditionto obtain the best estimate of lidar ratio, since AOD is, bydefinition, the integral of the extinction profile. However, inthe presence of aerosol layers aloft AERONET AOD valueswill not only represent the tropospheric contribution but alsothat of the layer.
Most lidar data in this study were obtained at nighttimewhen no sunphotometer measurements are available. There-fore, to estimate the stratospheric AOD contribution to thetotal AOD as measured at the colocated AERONET stations,a linear interpolation was considered between the last datapoints from the day before and the first data points from theday when the layers were observed. Only the last/first 3–5 datapoints of each day were considered in the interpolation and weutilized the AOD values at 340 nm and 500 nm to comparewith the measurements at 355 nm and 532 nm, respectively.The interpolated values of AOD are presented in table 2as AODAERO. In Santa Cruz de Tenerife the contribution
of the stratospheric AOD to the total AOD was about 6%,2% at GSFC, 12% and 5% in Granada for 355 nm and532 nm respectively, 22% and 23% at CNR-IMAA for 355 nmand 532 nm respectively. At OHP for the 28 June case thecontribution was of 17% at 355 nm and for the monthlyaverages the contributions were of 6%, 11% and 10% forJuly, August and September, respectively. At MLO, due tothe site’s high elevation (∼3 km), the contributions were evenlarger: 65%, 48% and 26% for 15 July, 21 July and 31 August,respectively.
Determining the optical contribution of the stratosphericlayer to the total column AOD was of particular interest at theGSFC site in Maryland, United States. The DISCOVER-AQproject (DISCOVER-AQ 2011, Hoff et al 2012) is a five-yearexperiment to help improve our understanding in relatingcolumn observations to surface conditions for aerosol andtrace gases for air quality assessment and regulation. Thefirst experiment took place in the Baltimore–WashingtonDC corridor in July 2011 and involved many ground-basedlidars, sunphotometer and two aircraft that carried out in situmeasurements of aerosol and trace gases and also providednadir-looking lidar profiles up to an altitude of∼6 km with anHSRL system. During the project, an offset of approximately0.03 was observed between the AOD values obtained from theHSRL system and the AOD measured by the ground-basedsunphotometers (Ferrare et al 2011). Aerosol contributionfrom altitudes higher than 6 km was believed to be the sourceof such offset. With this study, we were able to explain at least0.01 of the offset observed, but Nabro is not likely to be themajor factor in this disagreement.
5. Discussion
The MPL profile over Sede Boker (14 June) was thefirst available profile after Nabro’s eruption. It showed thestrongest peak in terms of backscatter compared to the otherprofiles, as displayed in the subplot of figure 6(a) and thehighest AOD of 0.17—a 51% contribution to the total AOD.Given the short time between Nabro’s first explosive eruptionand the first observation at this site, we believe that thelayer could be composed of ash and sulfate aerosols. Dueto their size compared to sulfate aerosols, ash particles arequickly removed from the stratosphere, which might explainthe difference in scattering magnitude from this measurementand all the other measurements from June 2011, which were,most likely, measurements of sulfate aerosols only.
With respect to the source of the layers observedover Santa Cruz de Tenerife on 21 June between 10 and13 km, backtrajectories (not shown here) suggested long rangetransport of smoke particles from fires that were occurring inNorth America in that period. However, given the date andlocation of observation, one cannot exclude the possibility ofcontributing ash/sulfate particles from smaller eruptions thatfollowed the major one on 13 June. The AOD obtained for thatlayer was 0.022, a 5% contribution for the total AOD of thatday (0.4 at 500 nm). Unfortunately there were no additionalmeasurements, such as depolarization measurements thatcould help us determine whether or not ash particles were
6
Environ. Res. Lett. 7 (2012) 034013 P Sawamura et al
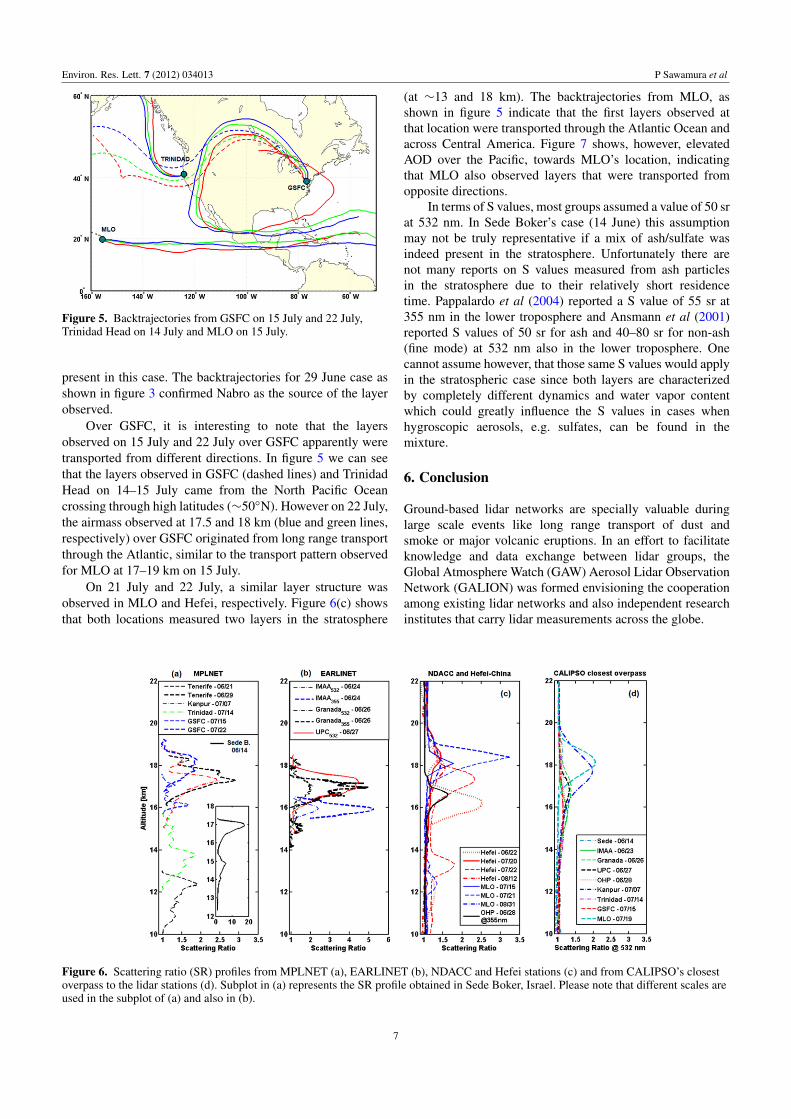
Figure 5. Backtrajectories from GSFC on 15 July and 22 July,Trinidad Head on 14 July and MLO on 15 July.
present in this case. The backtrajectories for 29 June case asshown in figure 3 confirmed Nabro as the source of the layerobserved.
Over GSFC, it is interesting to note that the layersobserved on 15 July and 22 July over GSFC apparently weretransported from different directions. In figure 5 we can seethat the layers observed in GSFC (dashed lines) and TrinidadHead on 14–15 July came from the North Pacific Oceancrossing through high latitudes (∼50◦N). However on 22 July,the airmass observed at 17.5 and 18 km (blue and green lines,respectively) over GSFC originated from long range transportthrough the Atlantic, similar to the transport pattern observedfor MLO at 17–19 km on 15 July.
On 21 July and 22 July, a similar layer structure wasobserved in MLO and Hefei, respectively. Figure 6(c) showsthat both locations measured two layers in the stratosphere
(at ∼13 and 18 km). The backtrajectories from MLO, asshown in figure 5 indicate that the first layers observed atthat location were transported through the Atlantic Ocean andacross Central America. Figure 7 shows, however, elevatedAOD over the Pacific, towards MLO’s location, indicatingthat MLO also observed layers that were transported fromopposite directions.
In terms of S values, most groups assumed a value of 50 srat 532 nm. In Sede Boker’s case (14 June) this assumptionmay not be truly representative if a mix of ash/sulfate wasindeed present in the stratosphere. Unfortunately there arenot many reports on S values measured from ash particlesin the stratosphere due to their relatively short residencetime. Pappalardo et al (2004) reported a S value of 55 sr at355 nm in the lower troposphere and Ansmann et al (2001)reported S values of 50 sr for ash and 40–80 sr for non-ash(fine mode) at 532 nm also in the lower troposphere. Onecannot assume however, that those same S values would applyin the stratospheric case since both layers are characterizedby completely different dynamics and water vapor contentwhich could greatly influence the S values in cases whenhygroscopic aerosols, e.g. sulfates, can be found in themixture.
6. Conclusion
Ground-based lidar networks are specially valuable duringlarge scale events like long range transport of dust andsmoke or major volcanic eruptions. In an effort to facilitateknowledge and data exchange between lidar groups, theGlobal Atmosphere Watch (GAW) Aerosol Lidar ObservationNetwork (GALION) was formed envisioning the cooperationamong existing lidar networks and also independent researchinstitutes that carry lidar measurements across the globe.
Figure 6. Scattering ratio (SR) profiles from MPLNET (a), EARLINET (b), NDACC and Hefei stations (c) and from CALIPSO’s closestoverpass to the lidar stations (d). Subplot in (a) represents the SR profile obtained in Sede Boker, Israel. Please note that different scales areused in the subplot of (a) and also in (b).
7
Environ. Res. Lett. 7 (2012) 034013 P Sawamura et al
Figure 7. Global CALIOP AOD retrieval from 16 July to 31 July.
The Icelandic volcano Eyjafjallajokull which eruptedin 2010 was probably the most important case study todate in terms of large scale synergistic lidar observations.Shortly after the eruption, while airspace was closed forcommercial flights, airborne lidar and in situ measurementswere carried out in the vicinity of the volcano (Schumannet al 2011) and ground-based lidar stations from the EuropeanAerosol Research Lidar Network (EARLINET) observedvolcanic aerosol layers all over Europe (Pappalardo et al 2010,Marenco et al 2011, Ansmann et al 2010, Emeis et al 2011,Sicard et al 2012, Papayannis et al 2012, Mattis et al 2010,Mona et al 2012).
Integrated with satellite observations, coordinated lidarground-based observations are important to help providingdetailed information on the space–time evolution of suchparticular events and, in particular, multiwavelength Ramanlidar retrievals can, for instance, help tracking the evolutionof the aerosol properties as they age while transported (Mattiset al 2010, Noh et al 2011, Navas-Guzman et al 2011,Alados-Arboledas et al 2011).
Due to its vertical resolving capabilities, lidar is also agood validation and/or input tool for SO2 retrievals (Carnet al 2007). Matthias et al (2012) highlights the importance ofcombining atmospheric transport models with ground-basedand airborne measurements, e.g. lidar, sunphotometers andin situ, in order to make a comprehensive analysis of ashconcentrations in the atmosphere. Improved knowledge onthe vertical distribution of the aerosols following a majorvolcanic eruption, which are possible from extensive lidarobservations, would translate into a better representation ofdistinct aerosol/ash layers in the transport models, which inturn could aid in the air traffic decision-making process duringsuch events.
In this study, although not formally in the frameworkof GALION, we showed how the synergy proposed byit would greatly aid the scientific community to rapidlyassess the outcome of future (and possibly more explosive)volcanic eruptions. In general, the synergy of coordinatedground-based lidar with aircraft and satellite measurementsare of great importance to track and characterize generalaerosol transport on continental and/or global scale.
The AOD values obtained from lidar data at 532 nm inthis study (excluding Sede Boker) ranged from 0.003 to 0.04,with an average of 0.018 ± 0.009 with S ranging from 38to 50 sr. At 355 nm (CNR-IMAA, OHP and Granada) AODranged from 0.04 to 0.05. CALIOP global retrieval obtained amaximum AOD of 0.03 at 532 nm mostly over Eastern Europeand Asia. As previously mentioned, the AOD calculation frommost of our lidar data (with exception of CNR-IMAA group)relies on a reasonable estimation for the S value. 50 sr islikely to be close to the upper limit of acceptable values ofS for sulfate aerosols in the stratosphere, which would thenresult in even lower AOD values. In either case it is unlikelythat the aerosol generated after Nabro’s eruption would havea significant long-term effect on the radiative balance of theatmosphere like Pinatubo did.
Acknowledgments
The authors would like to thank Simon Carn fromthe Department of Geological and Mining Engineeringand Sciences at Michigan Tech for preliminary SO2
analysis. The authors would also like to acknowledge theNOAA Air Resources Laboratory (ARL) for the provisionof the HYSPLIT transport and dispersion model andREADY website (www.arl.noaa.gov/ready.php) used in thispublication. Lidar work at UMBC was funded by grantNNX10AR38G (DISCOVER-AQ). The NASA Micro-PulseLidar Network is funded by the NASA Earth ObservingSystem and Radiation Sciences Program. Lidar work at theHefei site was funded by the National Key Basic ResearchProject of China under Grant No. 2007FY110700. Lidarwork at Universidad de Granada was funded by grantsCGL2010-18782 and P10-RNM-6299. The EARLINETstations are funded by the EU FP7 Project ‘ACTRIS’. SNTwas supported under the program, Changing Water Cyclefunded jointly by Ministry of Earth Sciences, India andNatural Environment Research Council, UK. The OHP lidarmeasurements are funded by CNRS INSU.
8

Environ. Res. Lett. 7 (2012) 034013 P Sawamura et al
References
Alados-Arboledas L et al 2011 Geophys. Res. Lett. 38 L01807Ansmann A et al 2001 J. Geophys. Res. 106 20725–33Ansmann A et al 2010 Geopys. Res. Lett. 37 L13810Berkoff T A et al 2003 IEEE Int. Geoscience and Remote Sensing
Symp. vol 7, pp 4395–7 (doi:10.1109/IGARSS.2003.1295527)Bosenberg J et al 2003 MPI Rep. 348 (Hamburg: Max-Planck
Institut fur Meteorologie) (www.mpimet.mpg.de/fileadmin/publikationen/Reports/max scirep 348.pdf)
Bourassa A E et al 2012 Science 337 78–81Carn S 2011 Nabro’s SO2 emissions (private communication)Carn S et al 2007 Atmos. Chem. Phys. Disc. 7 2857–71Clarisse L et al 2012 Atmos. Meas. Tech. 5 581–94Deshler T B et al 1993 Geophys. Res. Lett. 20 1435–8Di Girolamo P et al 1996 J. Geophys. Res. 101 18765–73DISCOVER-AQ 2011 NASA Venture Program (http://discover-aq.
larc.nasa.gov)Draxler R and Rolph G 2012 HYSPLIT (HYbrid Single-Particle
Lagrangian Integrated Trajectory) Model, access via NOAAARL READY (Silver Spring, MD: NOAA Air ResourcesLaboratory) (http://ready.arl.noaa.gov/HYSPLIT.php)
Emeis S et al 2011 Atmos. Chem. Phys. 11 2689–701Fernald F G et al 1972 J. Appl. Meteorol. 11 482–9Ferrare R et al 2011 American Geophysical Union, Fall Mtg 2011
abstract #A21J-06Godin-Beekmann S et al 2003 J. Environ. Monit. 5 57–67Hoff R M et al 2012 Proc. 26th Int. Laser Radar Conf. S3O–19Hofmann D et al 2009 Geophys. Res. Lett. 36 L15808Holben B N et al 1998 Remote Sens. Environ. 66 1–16Klett J 1981 Appl. Opt. 20 211–20Krotkov N et al 2011 Science Highlights (Goddard, MD: NASA
Laboratory for Atmospheres) (http://atmospheres.gsfc.nasa.gov/science/slides.php?sciid=9)
Marenco F B et al 2011 J. Geophys. Res. 116 D00U05Matthias V et al 2012 Atmos. Environ. 48 184–94
Mattis I et al 2010 J. Geophys. Res. 115 D00L04McCormick M P and Fuller W H 1975 Appl. Opt. 14 4–5McCormick M P et al 1995 Nature 373 399–404Mona L et al 2012 Atmos. Chem. Phys. 12 2229–44Navas-Guzman F et al 2012 J. Geophys. Res. submittedNoh Y M et al 2011 J. Geophys. Res. 116 D06206Papayannis A et al 2012 Atmos. Environ. 48 56–65Pappalardo G et al 2004 Geophys. Res. Lett. 31 L05120Pappalardo G et al 2010 Lidar Technologies, Techniques and
Measurements for Atmospheric Remote Sensing VI (Proc. SPIEvol 7832) (Toulouse: SPIE) 78320J (doi:10.1117/12.869016)
Randel W J et al 2010 Science 328 611–3Robock A 2000 Rev. Geophys. 38 191–219Rolph G 2012 Real-time Environmental Applications and Display
sYstem (READY) (Silver Spring, MD: NOAA Air ResourcesLaboratory) (http://ready.arl.noaa.gov)
Schumann U et al 2011 Atmos. Chem. Phys. 11 2245–79SGVP 2011 Smithsonian’s Global Volcanism Program (http://
volcano.si.edu/world/volcano.cfm?vnum=0201-101&volpage=var)
Shaw G E 1975 J. Appl. Meteorol. 14 1619–20Sicard M et al 2012 Atmos. Chem. Phys. 12 3115–30Solomon S et al 2011 Science 333 866–70Vernier J P et al 2009 J. Geophys. Res. 114 D00H10Vernier J P et al 2011 Geophys. Res. Lett. 38 L12807Wandinger U et al 1995 Appl. Opt. 34 8315–29Welton E J et al 2001 Lidar Remote Sensing for Industry and
Environmental Monitoring vol 4153 (Bellingham, WA: SPIE)pp 151–8
Wiart P and Oppenheimer C 2005 Bull. Volcanol. 67 99–115Winker D et al 2003 Lidar Remote Sensing for Industry and
Environment Monitoring III (Proc. SPIE vol 4893)(Bellingham, WA: SPIE) (doi:10.1117/12.466539)
Wright J R et al 2011 J. Geophys. Res. 116 D12302Wu G X and Zhang Y 1998 Mon. Weather Rev. 126 913–27
9


