U.S. GEOLOGICAL SURVEY
W
ater
-Resources Investigations Report
Streamfl
ow Gains and Losses along San Francisquito Creek and Characterization of Surface-Water and Ground-Water Quality, Southern San Mateo and Northern Santa Clara Counties, California, 1996–97
Prepared in cooperation with the
CITY OF MENLO P
ARK
02-4078
By
Loren F. Metzger
Sacramento, California
2002
3015
-19
U.S. DEP
ARTMENT OF THE INTERIOR
GALE A. NORTON, Secretary
U.S. GEOLOGICAL SURVEY
Charles G. Groat, Director
For additional information write to:
Copies of this report can be purchased from:
U.S. Geological Survey
Information Services
Box 25286
Federal Center
Denver, CO 80225
The use of firm, trade, and brand names in this report is for identification purposes only and
does not constitute endorsement by the U.S. Geological Survey.
District Chief
U.S. Geological SurveyPlacer Hall, Suite 20126000 J StreetSacramento, CA 95819-6129
CONTENTS
Abstract.................................................................................................................................................................................. 1Introduction ........................................................................................................................................................................... 2
Previous Studies........................................................................................................................................................... 4Acknowledgments ....................................................................................................................................................... 4
Physical Setting ..................................................................................................................................................................... 5Surface-Water Hydrology............................................................................................................................................ 5Ground-Water Hydrology............................................................................................................................................ 5
Measured Streamflow Gains and Losses ............................................................................................................................... 11Methods of Data Collection and Analysis ................................................................................................................... 12Streamflow Measurements and Estimated Gains and Losses...................................................................................... 14Estimated Ground-Water Recharge from San Francisquito Creek.............................................................................. 22
Characterization of Surface-Water and Ground-Water Quality............................................................................................. 25Methods of Water Sampling and Analysis................................................................................................................... 25Major Ions.................................................................................................................................................................... 29
Surface Water..................................................................................................................................................... 29Ground Water..................................................................................................................................................... 31
Oxygen-18 and Deuterium .......................................................................................................................................... 34Summary and Conclusions .................................................................................................................................................... 38References Cited.................................................................................................................................................................... 40Appendix A. Field measurements and laboratory analyses of samples from ground-water wells, streamflow-
measurement stations, Lake Laguinta, and public supply, southern San Mateo and northern Santa Clara Counties, California, 1996–97 ................................................................................................................................ 42
FIGURES
1. Map showing location of study area......................................................................................................................... 32. Map showing locations of streamflow-measurement stations and storm drains along San Francisquito
Creek, southern San Mateo and northern Santa Clara Counties, California ............................................................ 63. Graph showing mean annual, annual mean, and monthly mean streamflow at U.S. Geological Survey
(USGS) stream gage11164500 (site 3) on San Francisquito Creek at Stanford University, southern San Mateo and northern Santa Clara Counties, water years 1932–41 and 1951–99 ................................................................. 7
4. Map showing locations of faults and geohydrologic sections along and perpendicular to San Francisquito Creek, southern San Mateo and northern Santa Clara Counties, California ............................................................ 8
5. Generalized geohydrologic sections along and perpendicular to San Francisquito Creek, southern San Mateo and northern Santa Clara Counties, California......................................................................................................... 9
6–9. Graphs showing:6. Daily mean streamflow at U.S. Geological Survey (USGS) stream gage 11164500 (site 3) on San
Francisquito Creek at Stanford University, southern San Mateo and northern Santa Clara Counties, April 1, 1996, to May 31, 1997 ........................................................................................................................ 13
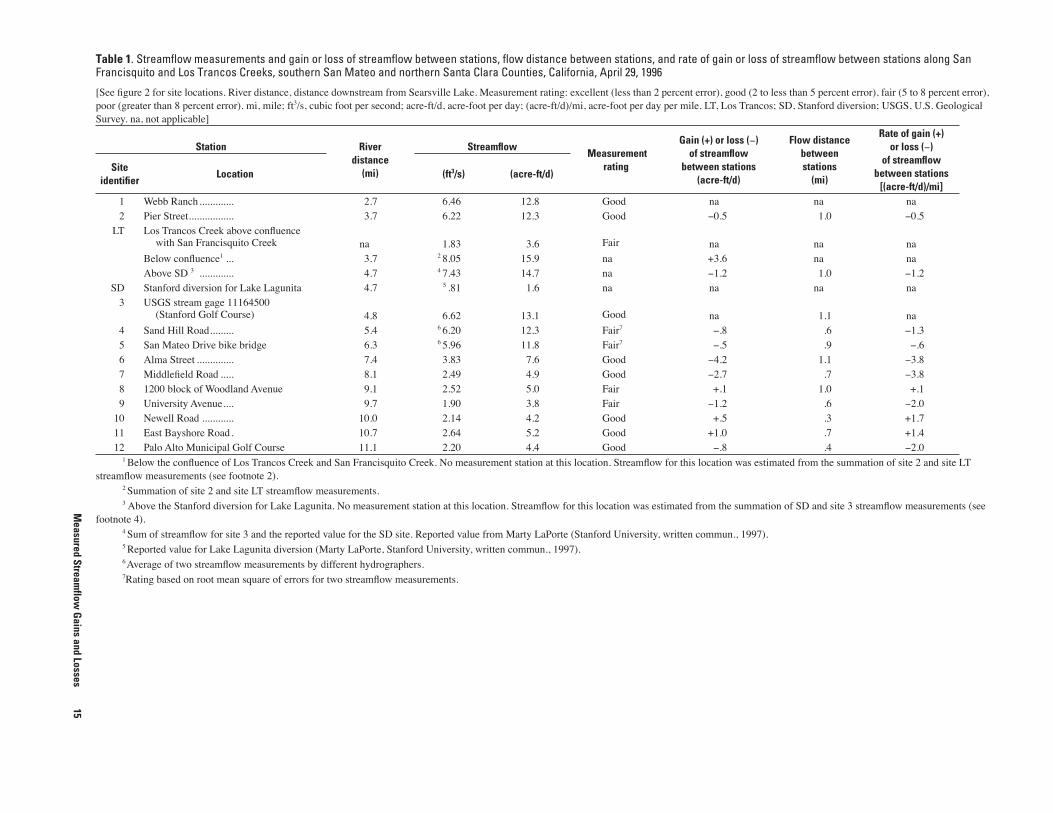
7. Streamflow measurements for the five seepage runs along San Francisquito Creek, southern San Mateo and northern Santa Clara Counties, California ................................................................................................. 20
8. Average streamflow gains or losses by reach between sites 3 and 12 along San Francisquito Creek, southern San Mateo and northern Santa Clara Counties, California ............................................................... 21
9. Streamflow frequency for U.S. Geological Survey (USGS) stream gage 11164500 (site 3) on San Francisquito Creek, southern San Mateo and northern Santa Clara Counties, California, water years 1932–41 and 1951–99 ...................................................................................................................................... 24
Contents 3
10. Map showing locations of ground-water, surface-water, and miscellaneous water-chemistry sampling sites, southern San Mateo and northern Santa Clara Counties, California ....................................................................... 27
11. Trilinear diagram showing chemical composition of water from selected ground-water wells, streamflow- measurement stations, Lake Lagunita, and public supply, southern San Mateo and northern Santa ClaraCounties, California, April 28 through May 2, 1997 ............................................................................................... 30
12. Graphs showing selected trace-element ratios as a function of chloride concentration in water from wells, southern San Mateo and northern Santa Clara Counties, California, April 28 through May 2, 1997 ..................... 33
13. Graph showing relation between delta deuterium and delta oxygen-18 for (A) all water samples, (B) San Francisquito Creek and Arroyo Ojo de Agua Creek samples, and (C) ground-water samples from wells along or near San Francisquito Creek, southern San Mateo and northern Santa Clara Counties, California, April 1996 through May 1997 ................................................................................................................................. 35
14. Map showing delta oxygen-18 and delta deuterium for ground-water samples from wells along or near San Francisquito Creek, southern San Mateo and northern Santa Clara Counties, California, April and May 1997 ................................................................................................................................................................ 37
TABLES
1–5. Tables showing streamflow measurements and gain or loss of streamflow between stations, flow distance between stations, and rate of gain or loss of streamflow between stations along San Francisquito and Los Trancos Creeks, southern San Mateo and northern Santa Clara Counties, California:
1. April 29, 1996 ................................................................................................................................................. 152. June 13, 1996 .................................................................................................................................................. 163. July 22, 1996 .................................................................................................................................................. 174. February 25–27, 1997 .................................................................................................................................... 185. April 30, 1997 ................................................................................................................................................. 19
6. Estimated average streamflow gains and losses and estimated average annual streamflow loss, evapotranspiration loss, and ground-water recharge between sites 3 and 12 along San Francisquito Creek, southern San Mateo and northern Santa Clara Counties, California ...................................................................... 23
7. Summary of oxygen-18 and deuterium ratios in samples from ground-water wells, streamflow-measurement stations, Lake Lagunita, and public supply, southern San Mateo and northern Santa ClaraCounties, California, 1996–97 ............................................................................................................................... 26
8. Construction data, depth to partly consolidated and consolidated bedrock assemblages, and aquifer zone ofground-water wells used for water-chemistry sampling in southern San Mateo and northern Santa ClaraCounties, California................................................................................................................................................ 28
4 Contents
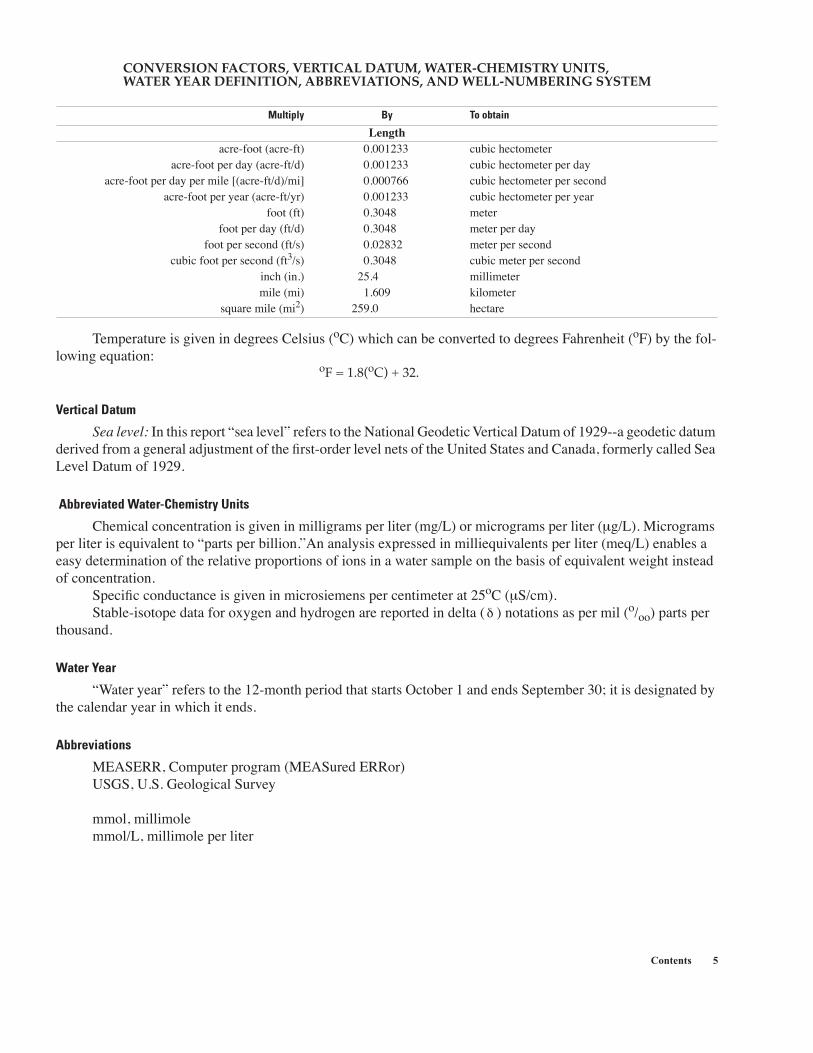
CONVERSION FACTORS, VERTICAL DATUM, WATER-CHEMISTRY UNITS, WATER YEAR DEFINITION, ABBREVIATIONS, AND WELL-NUMBERING SYSTEM
Temperature is given in degrees Celsius (oC) which can be converted to degrees Fahrenheit (oF) by the fol-lowing equation:
oF = 1.8(oC) + 32.
Vertical Datum
Sea level: In this report “sea level” refers to the National Geodetic Vertical Datum of 1929--a geodetic datum derived from a general adjustment of the first-order level nets of the United States and Canada, formerly called Sea Level Datum of 1929.
Abbreviated Water-Chemistry Units
Chemical concentration is given in milligrams per liter (mg/L) or micrograms per liter (µg/L). Micrograms per liter is equivalent to “parts per billion.”An analysis expressed in milliequivalents per liter (meq/L) enables a easy determination of the relative proportions of ions in a water sample on the basis of equivalent weight instead of concentration.
Specific conductance is given in microsiemens per centimeter at 25oC (µS/cm).Stable-isotope data for oxygen and hydrogen are reported in delta ( ) notations as per mil (o/oo) parts per
thousand.
Water Year
“Water year” refers to the 12-month period that starts October 1 and ends September 30; it is designated by the calendar year in which it ends.
Abbreviations
MEASERR, Computer program (MEASured ERRor)USGS, U.S. Geological Survey
mmol, millimolemmol/L, millimole per liter
Multiply By To obtain
Lengthacre-foot (acre-ft) 0.001233 cubic hectometer
acre-foot per day (acre-ft/d) 0.001233 cubic hectometer per dayacre-foot per day per mile [(acre-ft/d)/mi] 0.000766 cubic hectometer per second
acre-foot per year (acre-ft/yr) 0.001233 cubic hectometer per yearfoot (ft) 0.3048 meter
foot per day (ft/d) 0.3048 meter per day foot per second (ft/s) 0.02832 meter per second
cubic foot per second (ft3/s) 0.3048 cubic meter per second inch (in.) 25.4 millimetermile (mi) 1.609 kilometer
square mile (mi2) 259.0 hectare
δ
Contents 5
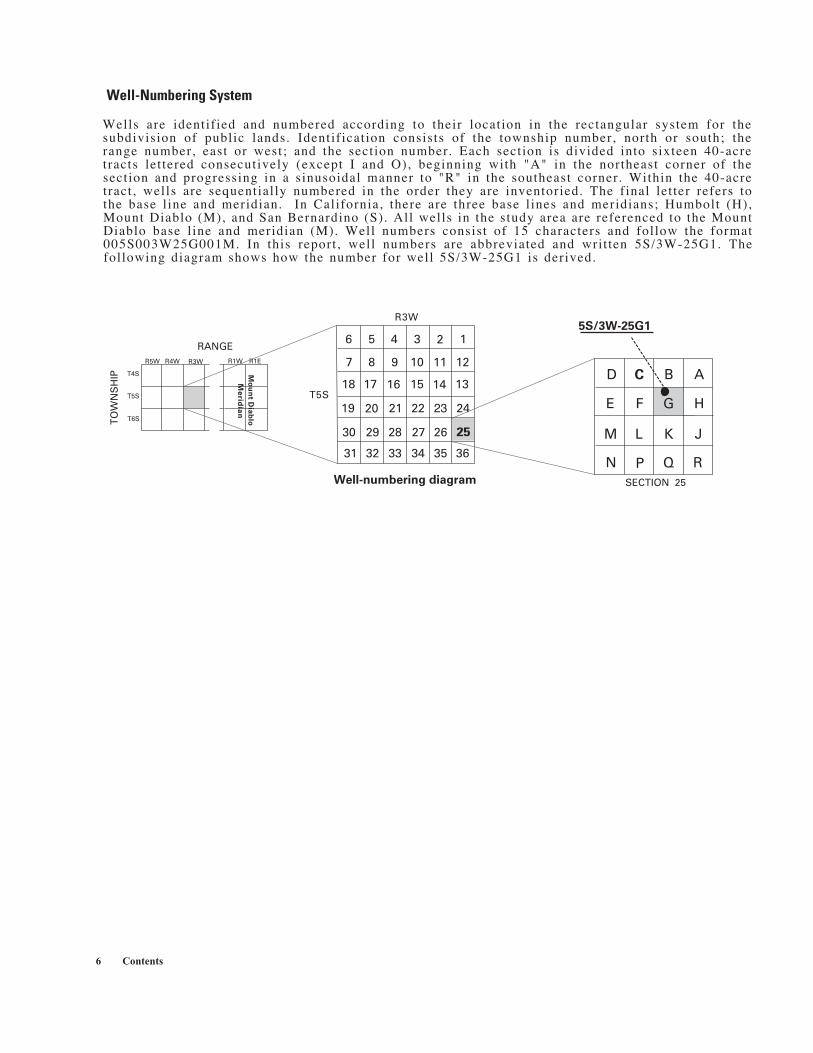
Well-Numbering System
Wells are identified and numbered according to their location in the rectangular system for the subdivision of public lands. Identification consists of the township number, north or south; the range number, east or west; and the section number. Each section is divided into sixteen 40-acre tracts lettered consecutively (except I and O), beginning with "A" in the northeast corner of the section and progressing in a sinusoidal manner to "R" in the southeast corner. Within the 40-acre tract , wells are sequentially numbered in the order they are inventoried. The final letter refers to the base l ine and meridian. In California, there are three base l ines and meridians; Humbolt (H), Mount Diablo (M), and San Bernardino (S). All wells in the study area are referenced to the Mount Diablo base l ine and meridian (M). Well numbers consist of 15 characters and follow the format 005S003W25G001M. In this report , well numbers are abbreviated and writ ten 5S/3W-25G1. The following diagram shows how the number for well 5S/3W-25G1 is derived.
R4WR5W R3W
Me
ridia
n
Mo
un
t Dia
blo
T4S
T5S
T6S
RANGE
TO
WN
SH
IP
R1W R1E
27
R3W
T5S
Well-numbering diagram
123456
7
1318
8 9 10 11 12
14151617
19 24
2530
31 36
20 21 22 23
262829
32 33 34 35
5S/3W-25G1
SECTION 25
ABCD
E F G H
JKLM
N P Q R
6 Contents
Streamflow Gains and Losses along San Francisquito Creek and Characterization of Surface-Water and Ground-Water Quality, Southern San Mateo and Northern Santa Clara Counties, California, 1996–97By Loren F. Metzger
ABSTRACTSan Francisquito Creek is an important source of recharge to the 22-square-mile San Francisquito Creek alluvial fan ground-water subbasin in the southern San Mateo and northern Santa Clara Counties of California. Ground water supplies as much as 20 percent of the water to some area communities. Local residents are concerned that infiltration and consequently ground-water recharge would be reduced if additional flood-control measures are implemented along San Francisquito Creek. To improve the understanding of the surface-water/ground-water interaction between San Francisquito Creek and the San Francisquito Creek alluvial fan, the U.S. Geological Survey (USGS) estimated streamflow gains and losses along San Francisquito Creek and determined the chemical quality and isotopic composition of surface and ground water in the study area.
Streamflow was measured at 13 temporary streamflow-measurement stations to determine streamflow gains and losses along a 8.4-mile section of San Francisquito Creek. A series of five seepage runs between April 1996 and May 1997 indicate that losses in San Francisquito Creek were negligible until it crossed the Pulgas Fault at Sand Hill Road. Streamflow losses increased between Sand Hill Road and Middlefield Road where the alluvial deposits are predominantly coarse-grained and the water table is below the bottom of the channel. The greatest streamflow losses were measured along a 1.8-mile section of the creek
between the San Mateo Drive bike bridge and Middlefield Road; average losses between San Mateo Drive and Alma Street and from there to Middlefield Road were 3.1 and 2.5 acre-feet per day, respectively.
Downstream from Middlefield Road, streamflow gains and losses owing to seepage may be masked by urban runoff, changes in bank storage, and tidal effects from San Francisco Bay. Streamflow gains measured between Middlefield Road and the 1200 block of Woodland Avenue may be attributable to urban runoff and (or) ground-water inflow. Water-level measurements from nearby wells indicate that the regional water table may coincide with the channel bottom along this reach of San Francisquito Creek, particularly during the winter and early spring when water levels usually reach their maximum. Streamflow losses resumed below the 1200 block of Woodland Avenue, extending downstream to Newell Road. Discharge from a large storm drain between Newell Road and East Bayshore Road may account for the streamflow gains measured between these sites. Streamflow gains were measured between East Bayshore Road and the Palo Alto Municipal Golf Course, but this reach is difficult to characterize because of the probable influence of high tides.
Estimated average streamflow losses totaled approximately 1,050 acre-feet per year for the reaches between USGS stream gage 11164500 at Stanford University (upstream of Junipero Serra Boulevard) and the Palo Alto Municipal Golf
Abstract 1
Course, including approximately 595 acre-feet per year for the 1.8-mile section between San Mateo Drive and Middlefield Road. Approximately 58 percent, or 550 acre-feet, of the total estimated average annual recharge from San Francisquito Creek occurs between the San Mateo Drive and Middlefield Road sites.
The chemical composition of San Francisquito Creek water varies as a function of seasonal changes in hydrologic conditions. Measurements of specific conductance indicate that during dry weather and low flow, the dissolved-solids concentrations tends to be high, and during wet weather, the concentration tends to be low owing to dilution by surface water. Compared with water samples from upstream sites at USGS stream gage 11164500 and San Mateo Drive, the samples from the downstream sites at Alma Street and Woodland Avenue had low specific conductance; low concentrations of magnesium, sodium, sulfate, chloride, boron, and total dissolved solids; high nutrient concentrations; and light isotopic compositions indicating that urban runoff constitutes most of the streamflow in some reaches during low flow.
The chemical composition of ground water in the study area varies primarily as a function of aquifer depth, changing from a calcium-bicarbonate or mixed cation-bicarbonate water in the shallow aquifer to a sodium-chloride or mixed cation-mixed anion water in the lower zone of the deep aquifer. The most pronounced difference in ground-water composition between the shallow and deep aquifers occurs in the lower part of the San Francisquito Creek alluvial fan downstream of Alma Street owing to extensive deposits of bay mud and clay separating the two aquifers. The concentration of chloride in samples from some of the wells exceeds 100 milligrams per liter. Ratios of selected trace elements to chloride indicate that modern bay water intrusion is not the source of the high chloride concentrations: water moving through the deep aquifer may reach chloride-rich marine sediments where mineral dissolution may increase the concentrations of sodium and chloride.
2 Streamflow Gains and Losses along San Francisquito Creek and Charac
Isotopic ratios of oxygen and hydrogen in water from selected surface-water sites, public supply, and selected production wells plot below, but parallel to, the global meteoric water line. The isotopically heaviest water was from Lake Lagunita and the isotopically lightest water was imported public supply water. With the exception of isotope samples collected from San Francisquito Creek at Alma Street and the 1200 block of Woodland Avenue during low-flow conditions, stream samples were isotopically heavier than ground-water samples. The isotopically heaviest ground-water samples were from wells near losing reaches of San Francisquito Creek. The isotopically lightest samples were from wells completed in the shallow aquifer and located close to residential streets. Water to these wells may be a mixture of native ground-water and imported water from leaking public water supply and sewage lines and return flow from excess irrigation of landscaping. The isotopic data also indicate that bay water intrusion is not the source of the high chloride concentrations in water from the wells sampled for this study.
INTRODUCTION
San Francisquito Creek, located in southern San Mateo and northern Santa Clara Counties (fig. 1), plays a vital role in the hydrology and ecology of these counties because it drains runoff from the Santa Cruz Mountains and downstream urban areas, provides wildlife habitat, and is an important source of ground-water recharge to the aquifers of the San Francisquito Creek alluvial fan. Streamflow in San Francisquito Creek originates as surface and shallow subsurface flow from winter and spring storms. As water flows downstream out of the Santa Cruz Mountains and across the San Francisquito Creek alluvial fan towards San Francisco Bay, some of it infiltrates through the streambed. Infiltration below the immediate subsurface soil zone that does not evaporate or that is not extracted by plant roots becomes ground-water recharge. Local residents are concerned that infiltration and consequently ground-water recharge would be reduced if additional flood-control measures are implemented along San Francisquito Creek.
terization of Surface- and Ground-Water Quality, California, 1996–97
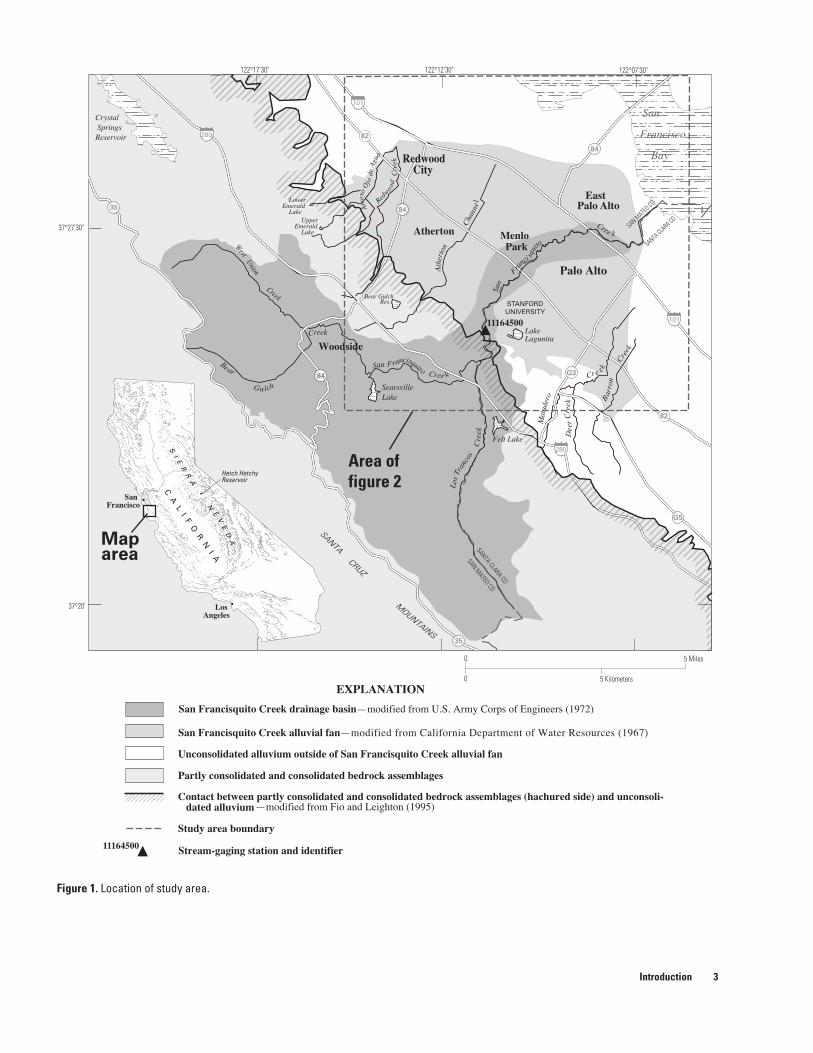
Figure 1.
Location of study area.
122°12'30"122°17'30" 122°07'30"
37°27'30"
37°20'
San
Francisco
Bay
Palo Alto
Felt Lake
LakeLagunita
SearsvilleLake
Crystal Springs Reservoir
Lower Emerald Lake
Upper Emerald Lake
San Francisquito Creek alluvial fan—modified from California Department of Water Resources (1967)
San Francisquito Creek drainage basin—modified from U.S. Army Corps of Engineers (1972)
Contact between partly consolidated and consolidated bedrock assemblages (hachured side) and unconsoli- dated alluvium
Partly consolidated and consolidated bedrock assemblages
Study area boundary
Unconsolidated alluvium outside of San Francisquito Creek alluvial fan
EXPLANATION
0
0
5 Miles
5 Kilometers
Map area
Bear
Gu lch
Creek
Los
Tran
cos
Cre
ek
San
Fra
nci sq
ui
to
Cree k
Ath
erto
n
Cha
nne
l
WestUnion
Creek
Menlo Park
Woodside
Atherton
Bear Gulch Res.
Redwood
Cre
ek
Bar
ron
Creek
Dee
rC
reek
Mat
ader
o
Cre ek
San Francisco
Los Angeles
SANTA
CRUZ
MOUNTAINS
SAN MATEO CO
SANTA CLARA CO
Arr
oyo
Oj o
deAg
ua
—modified from Fio and Leighton (1995)
Hetch HetchyReservoir
84
35
Redwood City
84
8435
82
82
C A L I F O R N
I A
SI
ER
RA
NE
VE
DA
STANFORD UNIVERSITY
SAN MATEO
CO
SANTA CLARA CO
G5
G3
East Palo Alto
�11164500
�11164500 Stream-gaging station and identifier
Area offigure 2
San F rancisquito Cree k
280
280
101
101
Introduction 3
Since the 1960s, imported surface water has been the primary source of water supply in the study area. Ground water, however, is a significant source of water supply to some area communities; nearly 20 percent of the total water supply for the town of Atherton is ground water (Metzger and Fio, 1997). Excessive ground-water pumping or a reduction in ground-water recharge, or both, can cause water levels to decline and the quality of ground water to deteriorate. For example, from the 1900s through the mid 1960s, ground-water levels in parts of Palo Alto, Menlo Park, and Atherton declined below sea level, reversing hydraulic gradients and inducing the movement of saline water 2 to 3 mi inland from San Francisco Bay (Iwamura, 1980). Between 1934 and 1967, overdrafting of the aquifer system, combined with periodic drought, caused more than 2 ft of land subsidence in parts of Palo Alto and East Palo Alto (Poland and Ireland, 1988). In 1996, the U.S. Geological Survey (USGS), in cooperation with the city of Menlo Park, began a study to improve the understanding of the surface-water/ground-water interaction between San Francisquito Creek and the San Francisquito Creek alluvial fan. The objectives of the study were to provide quantitative information on streamflow gains and losses along San Francisquito Creek and to determine the chemical and isotopic composition of surface and ground water to help characterize surface- and ground-water quality in the study area. This report presents the results of that study.
Streamflow measurements made at 13 sites in 1996 and 1997 were used to estimate gains and losses along selected reaches of San Francisquito Creek. Water samples collected from 17 wells, 9 streamflow-measurement sites, and 3 miscellaneous surface-water sites were analyzed for chemical and isotopic composition. The chemical data were used to characterize the quality of surface and ground water and to help assess the source of ground water to wells.
Previous Studies
Several prior studies have focused on various aspects of the hydrogeology of the San Francisquito Creek area. During a comprehensive study of the San Francisquito Creek Basin, Sokol (1964) investigated the hydrogeology of the drainage basin and the alluvial fan. He used a volumetric approach to compile and sum sources of recharge to the alluvial fan and estimated recharge from all sources (seepage from San Francisquito Creek, seepage from Lake Lagunita, infiltration of runoff from the foothills not drained by San Francisquito Creek, overirrigation, infiltration of ground-water inflow from the foothills, and
4 Streamflow Gains and Losses along San Francisquito Creek and Charac
precipitation) at about 3,000 acre-feet/year (acre-ft/yr). According to Sokol, nearly 22 percent of this total, or about 650 acre-ft/yr, is seepage from San Francisquito Creek. This estimate is based on the difference in streamflow at USGS stream gage 11164500 [San Francisquito Creek at Stanford, Calif. (located at the Stanford University Golf Course)] and gage 11165500 [San Francisquito Creek at Palo Alto, Calif. (located near Newell Road, not shown in figures)] from 1931 and 1941, when both stations operated concurrently.
The spatial relation of well location, depth, and water quality was assessed during previous investigations. Results of an investigation in the Santa Clara Valley by Tolman and Poland (1940), which included the city of Palo Alto and Stanford University, indicate that saline water in shallow wells near San Francisco Bay is due to the encroachment of bay water through abandoned wells in the tidelands, through coarse-grained sediments near stream mouths, and through breaks in the clay aquiclude as a result of construction of the Dumbarton Bridge and the Hetch Hetchy pipeline. According to Sokol (1964), geophysical and drillers’ logs indicate that saline water measured in some deep wells located as much as 5 mi inland from the bay may originate from underlying marine deposits. Iwamura (1980) postulated that some parts of the deep aquifer have become saline as a result of the downward migration of bay water through wells screened in both shallow and deep aquifer zones. Metzger and Fio (1997), who investigated ground-water pumpage, ground-water levels, and ground-water quality in the town of Atherton, determined that the highest dissolved solids, sodium, and chloride concentrations were associated with samples from wells located closest to the foothills (approximately 5 mi inland from the bay) and in the part of Atherton closest to the bay (less than 3 mi from the bay).
Acknowledgments
The author acknowledges the assistance of the Raychem Corporation, the city of Menlo Park, the city of East Palo Alto, the San Mateo County Department of Environmental Health Services, and the Santa Clara Valley Water District. Special thanks go to the city of Palo Alto Utilities Department, the O’Connor Tract Water Company, and the San Mateo County Department of Public Works, to private property owners for allowing access to wells, and to the Stanford University Facilities Operations staff for allowing access to wells and to Lake Lagunita.
terization of Surface- and Ground-Water Quality, California, 1996–97
PHYSICAL SETTING
Southern San Mateo and northern Santa Clara Counties include the communities of Menlo Park, Atherton, Palo Alto, East Palo Alto, Redwood City, and Woodside, and Stanford University (fig. 1) and have a combined population of more than 200,000. Located 25 to 30 mi south of San Francisco, the study area is a mixture of urban residential, commercial, industrial, and institutional development and open space. Most of the urban development is concentrated in the 5-mile-wide alluvial plain situated between San Francisco Bay on the east and the foothills of the Santa Cruz Mountains on the west. Areas to the south and west of USGS stream gage 11164500, in the foothills of the Santa Cruz Mountains, are less developed than the areas on the alluvial plain and contain most of the study area’s remaining open space.
Surface-Water Hydrology
San Francisquito Creek flows northeast 12.7 mi (U.S. Army Corps of Engineers, 1972) from Searsville Lake to San Francisco Bay (fig. 1). Searsville Lake, a water-supply reservoir, is fed by intermittent streams that drain the eastern slope of the Santa Cruz Mountains. San Francisquito Creek and its tributaries, Bear Gulch and Los Trancos Creeks, drain a basin encompassing approximately 45 square miles (mi2), including 37.4 mi2 of hilly to mountainous terrain upstream of USGS stream gage 11164500 and approximately 7.5 mi2 of the San Francisquito alluvial fan, a gently sloping, mostly urbanized, plain extending downstream from USGS stream gage 11164500 to San Francisco Bay (fig. 1). Urban runoff from the 7.5 mi2 of the alluvial fan and from an additional area of several square miles outside the natural boundaries of the drainage area, including parts of Palo Alto, East Palo Alto, Stanford University, and Menlo Park, flows through storm drains to reach San Francisquito Creek.
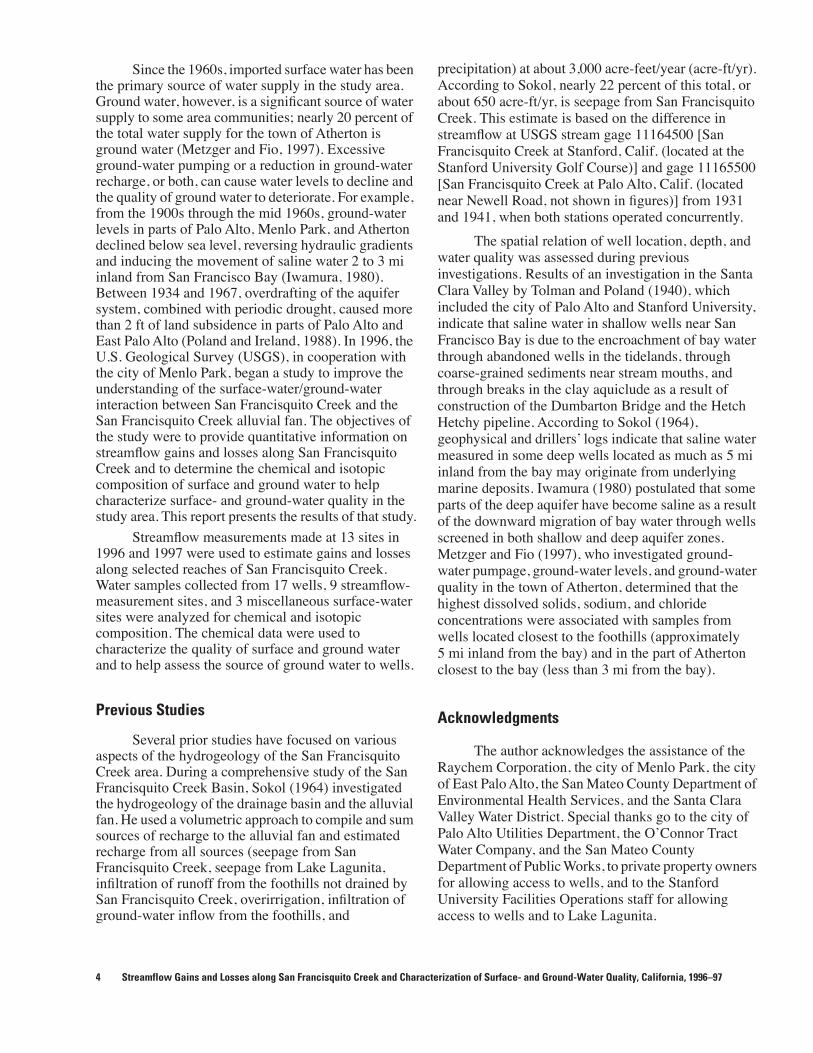
Although San Francisquito Creek flows through an urban environment for most of its lower length, overall about half of the creek remains in a near-natural state. The lower 8.4 mi of San Francisquito Creek coincides with that part of the creek where 13 temporary streamflow-measurement stations were established for this study (fig. 2). The streambed in this part of the creek consists of small boulders, cobbles, gravel, and sand upstream of El Camino Real (site 6) and grades to sandy silt and clay near the Palo Alto Municipal Golf Course (site 12) (fig. 2). In some reaches, the banks and channel of San Francisquito Creek are thickly vegetated with native alders, cottonwood, willows, oaks, and a variety of riparian
plants, especially between Stanford University’s Webb Ranch (site 1) and several hundred feet downstream from site 4 near Sand Hill Road, and in parts of the creek between Middlefield Road (site 7) and Newell Road (site 10). As a result of damaging floods in February 1940, December 1955, and April 1958, concrete walls, earth berms, and concrete sack riprap lining were constructed along some reaches of San Francisquito Creek between El Camino Real and the mouth of the creek to reduce the threat of flooding to adjacent developed areas (U.S. Army Corps of Engineers, 1972).
Streamflow in San Francisquito Creek is variable owing to its dependence on rainfall. Average annual rainfall in the study area ranges from about 15 inches at Palo Alto for 1912–97 (California Department of Water Resources, 1981, microfiche records; National Oceanic and Atmospheric Administration, 1999) to more than 40 inches at the highest elevations of the San Francisquito Creek drainage basin (Rantz, 1971). The variability of rainfall is reflected by the variability of monthly and annual streamflow records. The mean annual streamflow for the 59 years of available records, water years 1932–41 and 1951–99, for USGS stream gage 11164500 is 21.4 cubic feet per second (ft3/s) (fig. 3). The annual mean streamflow for the period of this study, water years 1996 and 1997, was 35.8 and 41.9 ft3/s, respectively. Because approximately 90 percent of annual rainfall in the study area occurs during November through April, most reaches of the creek on the San Francisquito Creek alluvial fan are dry about 6 months of the year. Upstream of the alluvial fan in the lower foothills of the Santa Cruz Mountains, ground-water seepage and treated wastewater from the Stanford Linear Accelerator (not shown in figures) located upstream of site 2 are sufficient to sustain flow at USGS stream gage 11164500 (site 3) throughout the drier months. Local residents have observed standing pools of water throughout the summer months during some years as far as several hundred yards downstream from site 4 (fig. 2).
Ground-Water Hydrology
Depositional and erosional processes during the Pleistocene and Holocene epochs gave rise to the present-day multiaquifer system in the study area (Sokol, 1964). The San Francisquito alluvial fan is an arbitrarily defined ground-water subbasin of the Santa Clara Valley, encompassing approximately 22 mi2 in southern San Mateo and northern Santa Clara Counties (Sokol, 1964). The alluvial fan is bisected by San
Physical Setting 5
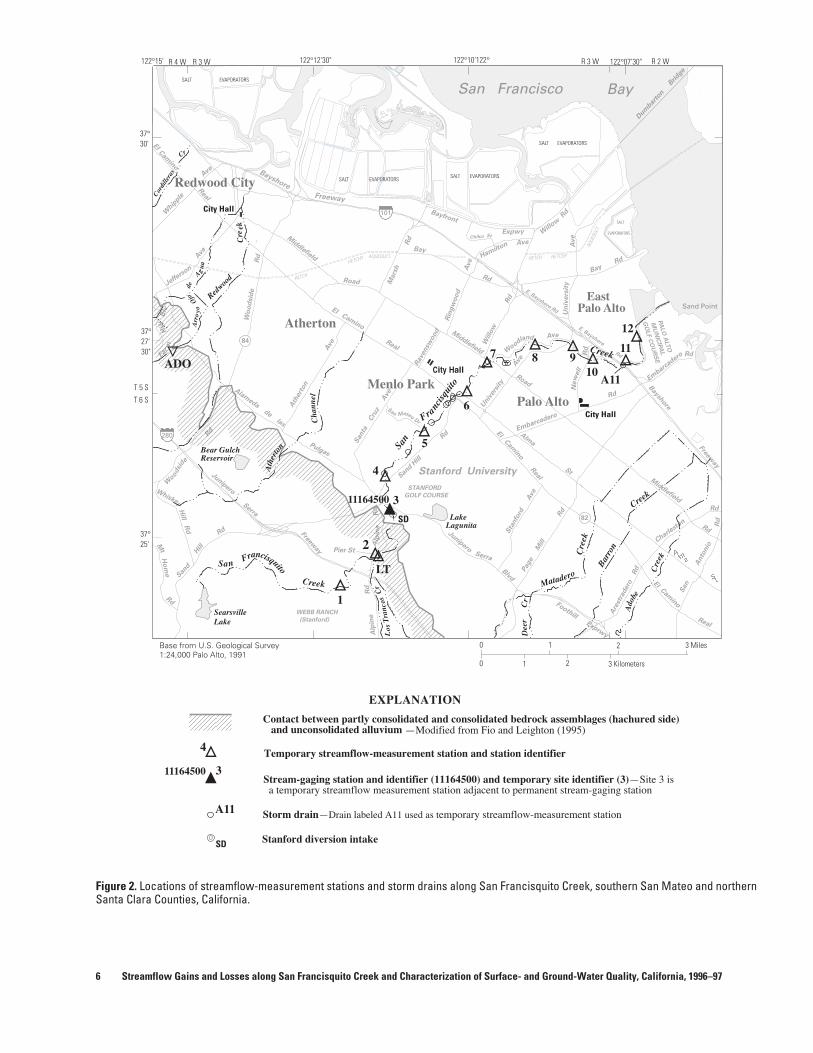
Figure 2. Locations of streamflow-measurement stations and storm drains along San Francisquito Creek, southern San Mateo and northern Santa Clara Counties, California.
Wo
od
sid
e R
d
El Camino Real
El Cam
ino Real
Middlefield
Middlefield
Lake Lagunita
Bear Gulch Reservoir
Embarcadero
Embarc
adero
Alma St
���������������������
Page M
ill R
d
STANFORD
GOLF COURSE
WEBB RANCH
(Stanford)
Sand H
ill
Rd
Pier St
El Cam
ino
Real
FoothillExprw
y
Are
stra
dero
Rd
Baysh
ore
Bayshore
Freeway
Freeway
Rd
PA
LO
ALT
O
MU
NIC
IPA
L
GO
LF C
OU
RS
E
Charlest
on
Rd
Rd
San A
nto
nio
Rd
SearsvilleLake
Junipero
SerraFreew
ay
San
d H
ill
Rd
Mt
Ho
me
Rd
Alp
ine R
d
JuniperoSerra
Blvd
Santa
C
ruz
A
ve
Alp
ine
Rd
San Francisquito
Creek
Los
Tran
cos
Cr
Mars
h R
d
Ath
ert
on A
ve
Alameda de las
Woo
dsi
de
Rd
Whiskey
Hill
Rd
Sta
nfo
rd
Ave
Jeffers
on
Ave
Bay
Bay
Rd
Rd
Whip
pleAve
El
Cam
ino
Road
Far m
Hill
Blv
Cr
Redwoo
d
Cre
ek
Arr
oyo
Ojode
Agua
Un
ivers
ity
Ave
MataderoC
reek
Dee
rC
r
Barr
on
Real
Ath
erto
n
Cha
nnel Rd
Rd
Cordi
llera
s
37°30'
T 5 S
T 6 S
37°27'30"
37°25'
0
0
1
1
2
2
3 Miles
3 Kilometers
Ravenswood Point
Creek
Pulgas
Ado
be
Cre
ek
New
ell
HETCH HETCHY
HETCH
HETC
HY
AQUEDU
CT
AQUEDUCT
�
�
�
�
�
�
�
�
�
�
� �� �
�
�
1
2
4
311164500
11164500
LT
4
5
7 8 910
6
11
A11
A11
12
ADO
Sand Point
Rd
Dum
barto
n B
ridge
Will
ow
Willo
w R
d
Rin
gw
oo
d A
ve
Middlefield Road
Univ
ersi
ty
AveRavensw
ood
City Hall
City Hall
City Hall
Stanford University
SALT EVAPORATORSSALT EVAPORATORS
SALT EVAPORATORS
SALT EVAPORATORS
SALT
EVAPORATORS
Redwood City
Atherton
Menlo ParkPalo Alto
East Palo Alto
San Francisco Bay
Bayfront
Expwy
Ave
Hamilton
Chilco St
82
122°15' 122°12'30" 122°10'122° 122°07'30"R 3 WR 3 WR 4 W R 2 W
Base from U.S. Geological Survey1:24,000 Palo Alto, 1991
Stream-gaging station and identifier (11164500) and temporary site identifier (3)—Site 3 is a temporary streamflow measurement station adjacent to permanent stream-gaging station
Temporary streamflow-measurement station and station identifier
EXPLANATION
Contact between partly consolidated and consolidated bedrock assemblages (hachured side) and unconsolidated alluvium —Modified from Fio and Leighton (1995)
3
84
San
Fra
ncisq
uito
Creek
SD
SD
Storm drain—Drain labeled A11 used as temporary streamflow-measurement station
Stanford diversion intake
San MateoDr
Woodl
and Ave
E. Bayshore Rd
E. Bayshore Rd
280
101
6 Streamflow Gains and Losses along San Francisquito Creek and Characterization of Surface- and Ground-Water Quality, California, 1996–97
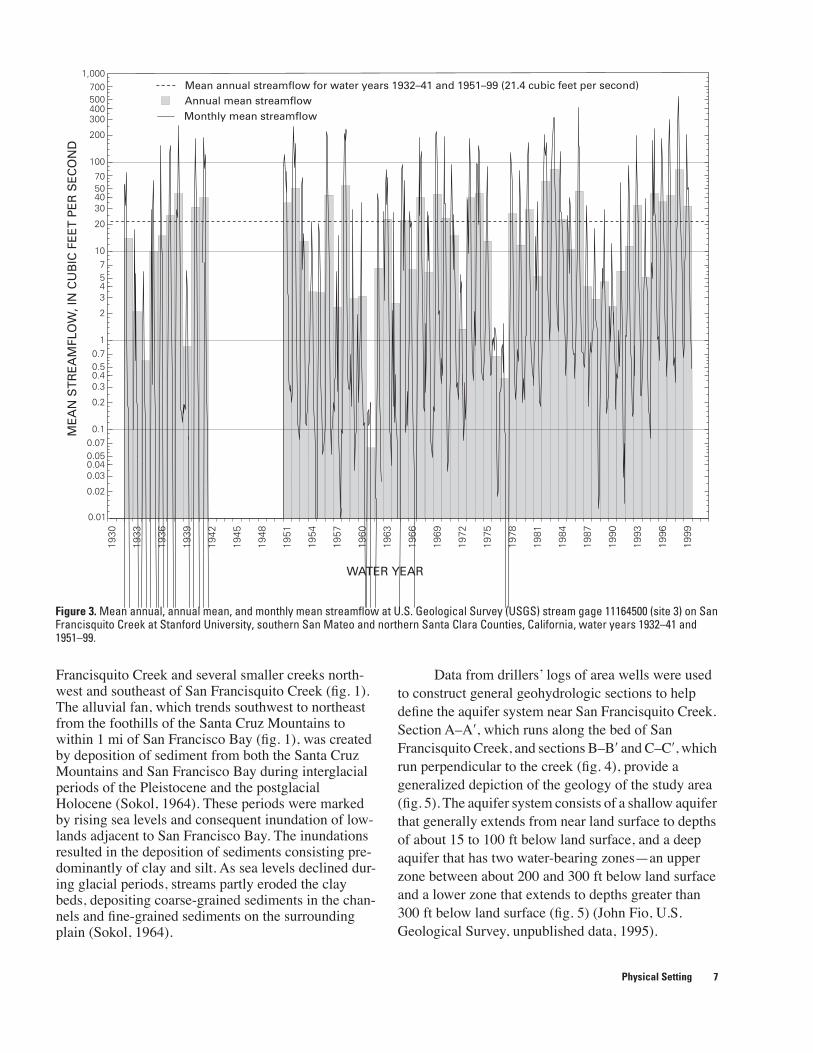
Figure 3. Mean annual, annual mean, and monthly mean streamflow at U.S. Geological Survey (USGS) stream gage 11164500 (site 3) on San Francisquito Creek at Stanford University, southern San Mateo and northern Santa Clara Counties, California, water years 1932–41 and 1951–99.
1930
1933
1936
1939
1942
1945
1948
1951
1954
1957
1960
1963
1966
1969
1972
1975
1978
1981
1984
1987
1990
1993
1996
1999
WATER YEAR
Annual mean streamflowMonthly mean streamflow
Mean annual streamflow for water years 1932–41 and 1951–99 (21.4 cubic feet per second)M
EA
N S
TR
EA
MFL
OW
, IN
CU
BIC
FE
ET
PE
R S
EC
ON
D
0.01
1,000
0.02
0.030.040.050.070.1
0.2
0.30.40.50.7
1
2
3457
10
20
30405070
100
200
300400500700
Francisquito Creek and several smaller creeks north-west and southeast of San Francisquito Creek (fig. 1). The alluvial fan, which trends southwest to northeast from the foothills of the Santa Cruz Mountains to within 1 mi of San Francisco Bay (fig. 1), was created by deposition of sediment from both the Santa Cruz Mountains and San Francisco Bay during interglacial periods of the Pleistocene and the postglacial Holocene (Sokol, 1964). These periods were marked by rising sea levels and consequent inundation of low-lands adjacent to San Francisco Bay. The inundations resulted in the deposition of sediments consisting pre-dominantly of clay and silt. As sea levels declined dur-ing glacial periods, streams partly eroded the clay beds, depositing coarse-grained sediments in the chan-nels and fine-grained sediments on the surrounding plain (Sokol, 1964).
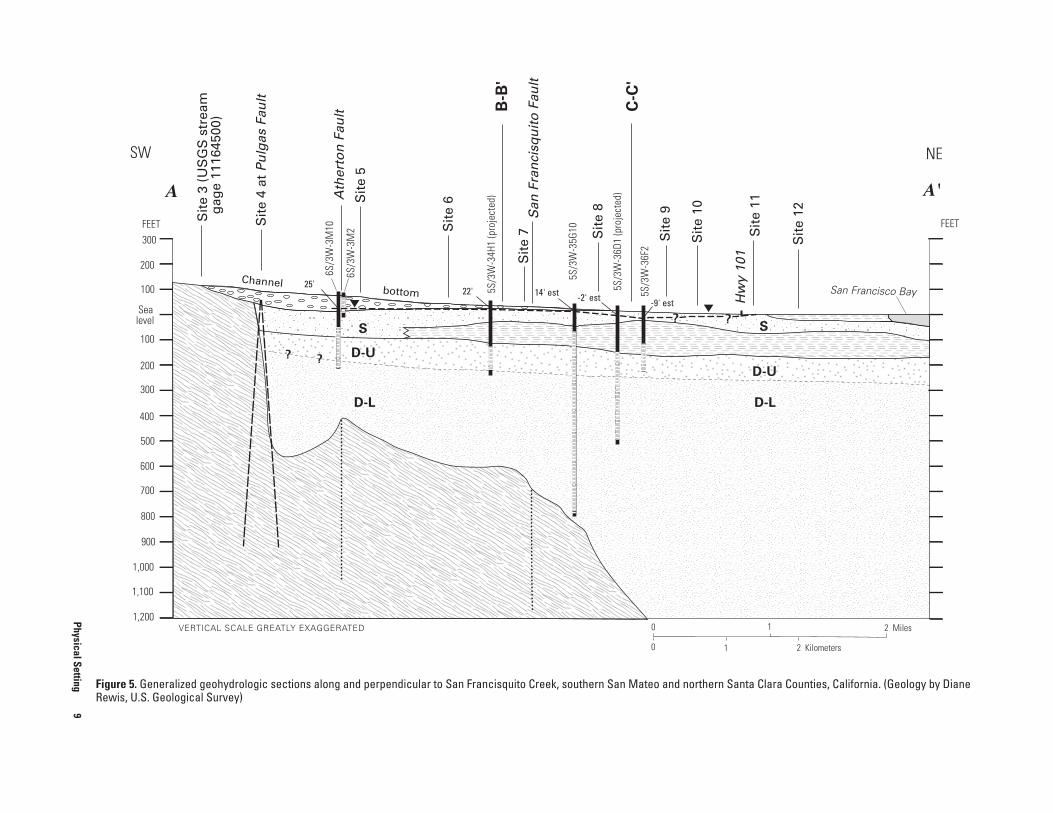
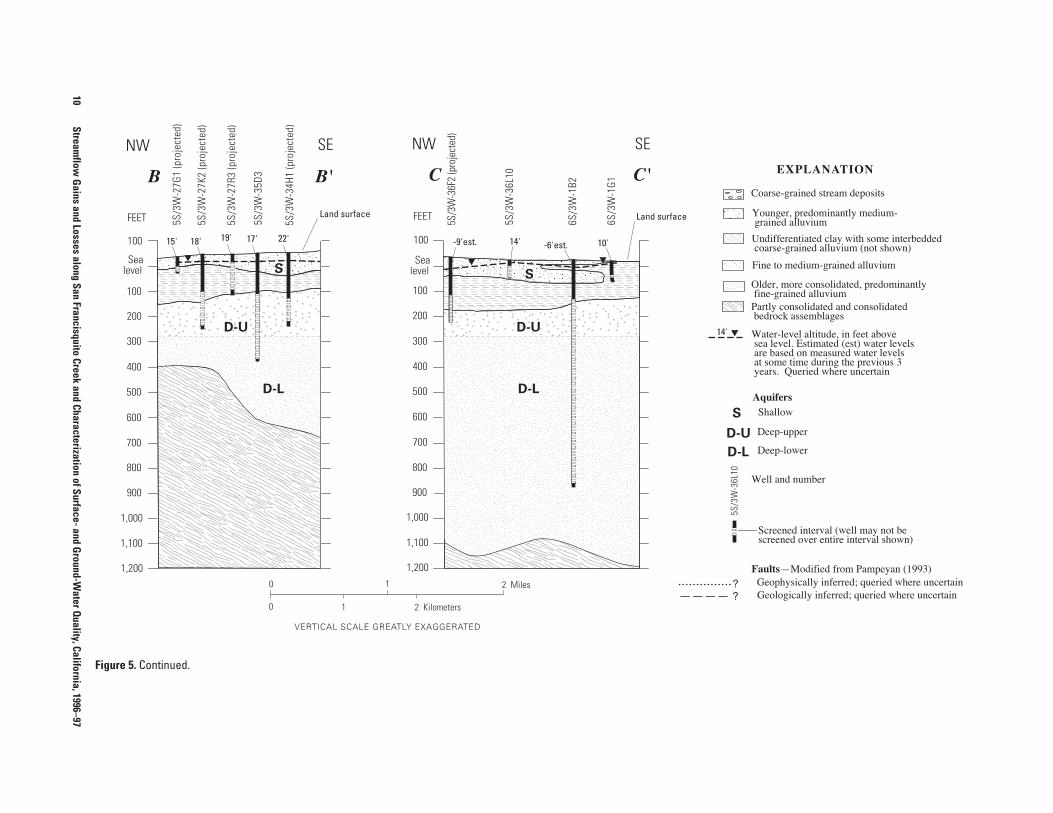
Data from drillers’ logs of area wells were used to construct general geohydrologic sections to help define the aquifer system near San Francisquito Creek. Section A–A′, which runs along the bed of San Francisquito Creek, and sections B–B′ and C–C′, which run perpendicular to the creek (fig. 4), provide a generalized depiction of the geology of the study area (fig. 5). The aquifer system consists of a shallow aquifer that generally extends from near land surface to depths of about 15 to 100 ft below land surface, and a deep aquifer that has two water-bearing zones—an upper zone between about 200 and 300 ft below land surface and a lower zone that extends to depths greater than 300 ft below land surface (fig. 5) (John Fio, U.S. Geological Survey, unpublished data, 1995).
Physical Setting 7
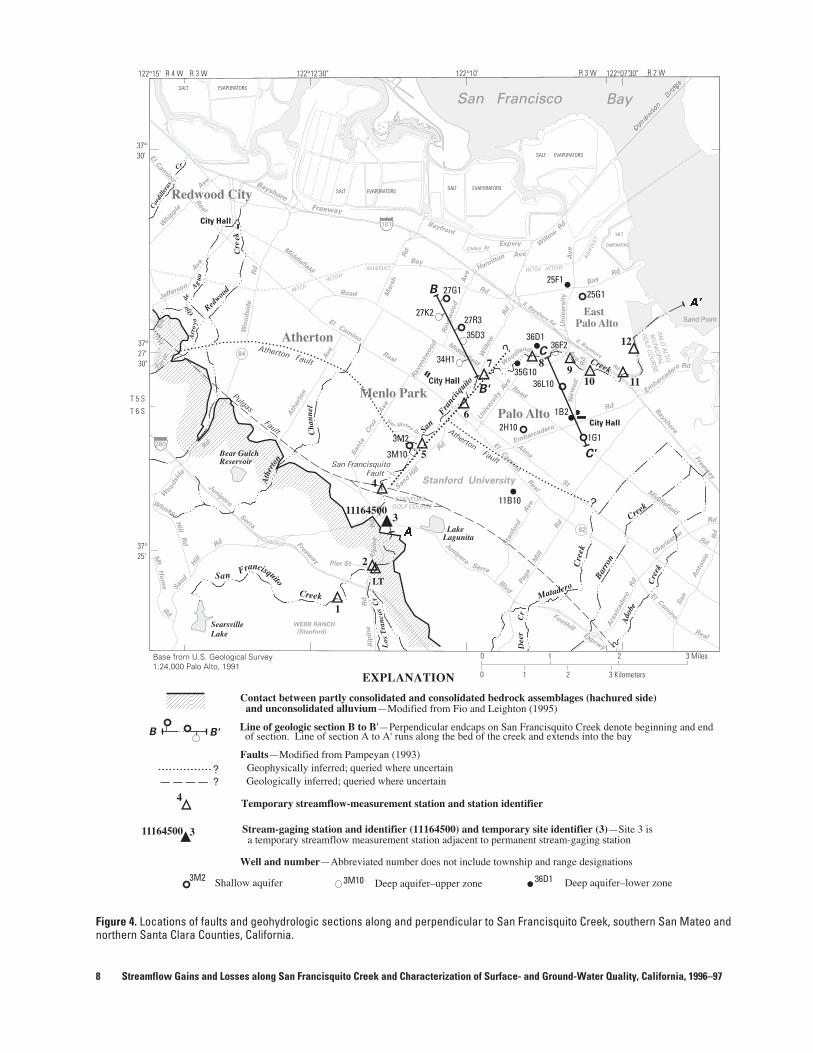
Figure 4. Locations of faults and geohydrologic sections along and perpendicular to San Francisquito Creek, southern San Mateo and northern Santa Clara Counties, California.
122°07'30"R 3 W R 2 W122°10'
??
1
2
LT
3
4
4
5
7 89
10
6
12
Wo
od
sid
e R
d
El Camino Real
El Cam
ino Real
Middlefield
Middlefield
Lake Lagunita
Bear Gulch Reservoir
Embarcadero
Embarc
adero
Alma St
Page M
ill R
d
STANFORD GOLF COURSE
WEBB RANCH
(Stanford)
Sand H
ill
Rd
El Cam
ino
Real
FoothillExprw
y
Are
stra
dero
Rd
Baysh
ore
Bayshore
Freeway
Freeway
Rd
PALO
ALTO
MU
NICIPA
L
GO
LF COU
RSE
Charlest
on
Rd
San A
nto
nio
Rd
SearsvilleLake
Junipero
Serra
Freeway
San
d H
ill
Rd
Mt
Ho
me
Rd
Alp
ine R
d
JuniperoSerra
Blvd
Santa
C
ruz
A
ve
Alp
ine
Rd
San Francisquito
Creek
Los
Tran
cos
Cr
Mars
h R
d
Ath
ert
on A
ve
Woo
dsi
de
Rd
Whiskey
Hill
Rd
Sta
nfo
rd
Ave
Jefferson
Ave
Bay
Bay
Rd
Rd
Whip
ple
Ave
El
Cam
ino
Road
Far m
Hill
Blv
Cr
Redwoo
d
Cre
ek
Arr
oyo
Ojode
Agua
Un
ivers
ity
Ave
MataderoC
reek
Dee
rC
r
Barr
on
Rd
Real
Ath
erto
n
Cha
nnel Rd
Rd
Cordi
llera
s
37°30'
T 5 S
T 6 S
37°27'30"
37°25'
0
0
1
1
2
2
3 Miles
3 Kilometers
Ravenswood Point
Creek
Ado
be
Cre
ek
New
ell
3M2 3M10 36D1Shallow aquifer Deep aquifer–upper zone Deep aquifer–lower zone
HETCH HETCHY
HETCH H
ETCHY
AQUE
DUCT
AQUEDUCT
Sand Point
11
Rd
�������
����
� �
Will
ow
Willo
w R
d
Rin
gw
oo
d A
ve
Middlefield Road
Univ
ersi
ty A
ve
Ravensw
ood
City Hall
City Hall
City Hall
Stanford University
SALT EVAPORATORSSALT EVAPORATORS
SALT EVAPORATORS
SALT EVAPORATORS
Redwood City
Atherton
Menlo Park
Palo Alto
East Palo Alto
San Francisco Bay
Bayfront
Expwy
Ave
Hamilton
Chilco St
122°12'30"
84�
�
��
Base from U.S. Geological Survey1:24,000 Palo Alto, 1991
82�
�
R 4 W R 3 W122°15'
SALT
EVAPORATORS
�
??
�
�3
Geophysically inferred; queried where uncertainGeologically inferred; queried where uncertain
B B'
Temporary streamflow-measurement station and station identifier
Well and number—Abbreviated number does not include township and range designations
Faults—Modified from Pampeyan (1993)
Line of geologic section B to B'—Perpendicular endcaps on San Francisquito Creek denote beginning and end of section. Line of section A to A' runs along the bed of the creek and extends into the bay
EXPLANATION
Contact between partly consolidated and consolidated bedrock assemblages (hachured side) and unconsolidated alluvium—Modified from Fio and Leighton (1995)
Atherton Fault
AthertonFault
B
B'
�
��
C'
C
Pulgas
Fault
San Francisquito Fault
San
Franc
isquito
Creek
27G1
27K227R3
35D3
34H135G10
36D136F2
36L10
1B2
2H101G1
11B10
3M2
3M10
25F1
25G1
�
�
�
�
��
Woodlan
d Ave
E. Bayshore Rd
E. Bayshore Rd
San MateoDr
Pier St
280
101
11164500
11164500
Stream-gaging station and identifier (11164500) and temporary site identifier (3)—Site 3 is a temporary streamflow measurement station adjacent to permanent stream-gaging station
8 Streamflow Gains and Losses along San Francisquito Creek and Characterization of Surface- and Ground-Water Quality, California, 1996–97
anta Clara Counties, California. (Geology by Diane
D-L
S
D-U
Sit
e 11
Sit
e 12
Hw
y 10
1
San Francisco Bay
NE
A'
1 2 Miles
2 Kilometers
FEET
Physical Setting
9
Figure 5. Generalized geohydrologic sections along and perpendicular to San Francisquito Creek, southern San Mateo and northern SRewis, U.S. Geological Survey)
D-L
S
-9' est-2' est14' est22' 25'
? ?D-U
FEET Sit
e 4
at P
ulg
as F
ault
Sit
e 6
Sit
e 7 Sit
e 8
Sit
e 9
Sit
e 10
Sit
e 5
Sit
e 3
(US
GS
str
eam
gag
e 11
1645
00)
Ath
erto
n F
ault
San
Fra
nci
squ
ito
Fau
lt
Sea level
1,200
300
200
200
100
100
300
900
1,000
1,100
400
500
600
700
800
5S/3
W-3
4H1
(pro
ject
ed)
5S/3
W-3
5G10
5S/3
W-3
6D1
(pro
ject
ed)
5S/3
W-3
6F2
6S/3
W-3
M10
6S/3
W-3
M2
SW
bottomChannel
B-B
'
C-C
'
A
0
0 1
VERTICAL SCALE GREATLY EXAGGERATED
? ?
10
Streamflow
Gains and Losses along San Francisquito Creek and Characterization of Surface- and G
round-Water Q
uality, California, 1996–97
AquifersShallow
Deep-upper
Deep-lower
S
D-U
D-L
Older, more consolidated, predominantly fine-grained alluviumPartly consolidated and consolidated bedrock assemblages
Well and number
5S/3
W-3
6L10
Water-level altitude, in feet above sea level. Estimated (est) water levels are based on measured water levels at some time during the previous 3 years. Queried where uncertain
Undifferentiated clay with some interbedded coarse-grained alluvium (not shown)
EXPLANATION
Younger, predominantly medium- grained alluvium
Coarse-grained stream deposits
Screened interval (well may not bescreened over entire interval shown)
Fine to medium-grained alluvium
??
Geophysically inferred; queried where uncertainGeologically inferred; queried where uncertain
Faults—Modified from Pampeyan (1993)
14'
Figure 5. Continued.
18' 19' 17' 22' 10'
B B' C C'
D-UD-U
D-LD-L
SS
5S/3
W-3
6F2
(pro
ject
ed)
5S/3
W-3
6L10
6S/3
W-1
G1
6S/3
W-1
B2
0
0
1
1
2 Miles
2 Kilometers
FEET FEET
Sea level
100
900
1,000
1,100
1,200
100
200
300
400
500
600
700
800
Sea level
1,200
100
900
1,000
1,100
100
200
300
400
500
600
700
800
5S/3
W-2
7K2
(pro
ject
ed)
5S/3
W-2
7R3
(pro
ject
ed)
5S/3
W-3
5D3
5S/3
W-3
4H1
(pro
ject
ed)
5S/3
W-2
7G1
(pro
ject
ed)
NW SE NW SE
VERTICAL SCALE GREATLY EXAGGERATED
-9'est. 14' -6'est.
Land surfaceLand surface
15'
The shallow aquifer consists of predominantly medium-grained alluvium (fine sand, silt, and clayey silt) deposited by San Francisquito Creek and smaller area creeks during the Holocene epoch. The upslope areas of the San Francisquito alluvial fan consist of coarser grained stream deposits. The thicknesses and grain sizes of these deposits are greatest near the mountain front and generally decrease towards San Francisco Bay. In areas within about 1 mi of San Francisco Bay, the alluvium is overlain by bay deposits, including silty clay, bay mud, and peat.
A thick, laterally extensive layer of bay deposits, consisting of undifferentiated clay interbedded with some lenses of coarse-grained alluvium, acts as a confining bed, separating the shallow aquifer from the deep aquifer throughout much of the northeastern part of the study area (fig. 5). Well logs indicate that this confining bed ends approximately midway between sites 5 and 6 on San Francisquito Creek, providing areas upslope of this confining bed with a direct hydraulic connection to the deep aquifer of the San Francisquito Creek alluvial fan (Sokol, 1964).
The deep aquifer consists of older alluvial deposits of gravel, sand, and silt of Pliocene and Pleistocene ages (John Fio, U.S. Geological Survey, unpublished data, 1995). The upper and lower zones of the deep aquifer are distinguished by differences in grain sizes; the upper zone generally has a greater proportion of coarse-grained alluvium than the lower zone.
Underlying the deep aquifer are partly consolidated to consolidated sedimentary and igneous rocks of the Franciscan Complex dating to the Jurassic and Cretaceous Periods, and sandstone consisting of interbedded siltstones and shales of the Tertiary Period (Pampeyan, 1993).
A series of faults in the study area may influence the hydrology of the multiaquifer system. The largest of these, the Pulgas Fault (at site 4 on figure 5), is a buried southwest-dipping reverse fault separating partly consolidated and consolidated bedrock assemblages on the southwest from younger unconsolidated alluvium on the northeast (fig. 4) (Pampeyan, 1993). Just northwest of San Francisquito Creek, the Pulgas Fault splits into two splays before merging southeast of the creek on the Stanford University campus (Pampeyan, 1993). Results of a gravity study by Carle and others (1990) indicates the presence of two additional faults; the Atherton Fault and the San Francisquito Fault (fig. 4). The Atherton Fault extends from near Arroyo Ojo de Agua in Redwood City southeast towards Matadero Creek in Palo Alto. According to Carle and others (1990), the gravity gradient that defines the Atherton Fault becomes progressively weaker as it
approaches the creek, indicating that the fault may be splintered or offset at San Francisquito Creek by a left-lateral “tear” fault called the San Francisquito Fault. Trending southwest to northeast along a northeasterly aligned depression in the partly consolidated and consolidated rock surface just south of San Francisquito Creek, the San Francisquito Fault may offset the Atherton Fault by about 1 mi so that on the northwest side the projection of the Atherton Fault intercepts the creek just above site 5 and, on the southeast side, it intercepts the creek approximately 0.3 mi upstream of El Camino Real (site 6, fig. 4). Unlike the Pulgas Fault, neither the Atherton Fault nor the San Francisquito Fault extends vertically through younger and older alluvium (Carle and others, 1990) (fig. 5). The Pulgas Fault may impede subsurface flow between the foothills and the alluvial fan.
There may be as many as 1,200 wells in the study area including residential wells (used primarily for landscape irrigation), municipal-supply wells, and observation wells (Metzger and Fio, 1997; David Leighton, U.S. Geological Survey, written commun., 2000). Approximately 650 wells, including 500 wells in Atherton, are designated as production wells (irrigation, domestic, municipal, and institutional wells).
Prior to 1962, annual pumpage from the San Francisquito Creek alluvial fan was about 7,500 acre-ft, including about 6,500 acre-ft pumped by the city of Palo Alto and Stanford University (Sokol, 1964). Since the early- to mid-1960s, imported water from the Hetch Hetchy Aqueduct has largely replaced ground water as the primary source of municipal supply in the study area. Conversely, ground-water pumping by private residential wells has increased since the 1970s. Most of this increase has occurred in Atherton, where as many as 269 (“confirmed active” plus “probably active”) residential wells pumped an estimated 510 acre-ft/yr (Metzger and Fio, 1997). Nine institutional wells in Atherton may produce an additional 200 acre-ft/yr (Metzger and Fio, 1997). Based on limited well production information and extrapolation, ground-water pumping in the study area could total as much as 2,500 acre-ft/yr.
MEASURED STREAMFLOW GAINS AND LOSSES
Streamflow gains and losses along San Francisquito Creek were determined from streamflow measurements made during five seepage runs between April 1996 and May 1997. A seepage run consists of a series of streamflow measurements made at several sites along a stream to quantify streamflow gains and
Measured Streamflow Gains and Losses 11
losses (Riggs, 1972). Intervals of a stream channel between successive measurement stations are referred to as either gaining or losing reaches. A gaining reach is defined as one in which streamflow increases in a downstream direction as a result of ground-water inflow, tributary inflow, or precipitation (Blodgett and others, 1992). In contrast, a losing reach is defined as one in which streamflow is lost by infiltration to the subsurface or by evapotranspiration to the atmosphere. If ground-water inflow is the only source of streamflow gain, it may be referred to as a seepage gain. A seepage loss refers to streamflow lost only by infiltration to the subsurface and not by direct evaporation.
Methods of Data Collection and Analysis
Streamflow was measured at 12 stations on San Francisquito Creek and at one station on Los Trancos Creek (LT) just above its confluence with San Francisquito Creek (fig. 2). Site 3 was established adjacent to a continuously recording stream gage (stream gage 11164500, San Francisquito Creek at Stanford) operated by the USGS. One temporary streamflow-measurement station, labeled A11 on figure 2, was established at the outfall of a storm drain to measure urban runoff entering the creek just upstream of site 11.
Streamflow was not measured or observed as not flowing at some of the 13 stations during three of the five seepage runs in 1996 and 1997 (June 13, 1996; July 22, 1996; and April 30, 1997). Streamflow was measured at all 13 stations during the other two seepage runs (April 29, 1996, and February 25–27, 1997). Flow conditions were arbitrarily defined for this study as low-flow, intermediate-flow, and high-flow conditions; the flow conditions were based on flow rates of 0 to 5, 5 to 20, and greater than 20 ft3/s, respectively, at USGS stream gage 11164500. The five seepage runs for this study included three low-flow seepage runs (June 13, 1996; July 22, 1996; and April 30, 1997), one intermediate-flow seepage run (April 29, 1996), and one high-flow seepage run (winter flow uninfluenced by storms) (February 25–27, 1997).
Most streamflow measurements were made using velocity-area methods (for a description of these methods see Rantz and others, 1982). A Price pygmy current meter with a top-setting wading rod was used for the velocity-area methods. During low-flow conditions at stations where velocities were less than 0.2 foot per second (ft/s) and stream depths were less than 0.3 ft, a modified 3-inch Parshall flume was used (Rantz and others, 1982).
Duplicate measurements were made by different hydrographers using different equipment at all the
12 Streamflow Gains and Losses along San Francisquito Creek and Chara
stations during the high-flow seepage run (February 1997), at two stations during the intermediate-flow seepage run (April 1996), and at four stations during one low-flow seepage run (June 1996) to verify the repeatability of the measurements. High-flow stream measurements are particularly susceptible to error because the measurement error can exceed the calculated gain or loss if seepage gain or loss is small (Borchers, 1996). The average difference between duplicate measurements was about 5 percent; the largest difference between duplicate measurements was 20 percent for site 5 for the April 1996 seepage run. Seepage runs were scheduled to avoid peak-flow conditions and periods of significant changes in stage, such as receding storm flows.
The accuracy of streamflow measurements is largely dependent on flow conditions and measurement technique (Rantz and others, 1982). For this study, the accuracy of streamflow measurements was assessed by examining streamflow conditions during each seepage run and by computing the uncertainty, or standard error, of each individual measurement.
Fluctuations in streamflow during a seepage run owing to either receding storm flows, diversions, or inflow from urban runoff can affect the accuracy of streamflow measurements and estimated seepage gains and losses. Records of instantaneous streamflow at USGS stream gage 11164500 were used to ascertain whether seepage runs had been completed during fairly stable flow conditions, at least in the upper reaches (sites 1 through 3) of San Francisquito Creek. Instantaneous records of USGS stream gage 11164500 show minimal change in streamflow at that location during four of the five seepage runs (fig. 6), which indicates that streamflow was fairly stable at least in the reaches upstream of site 3. Streamflow at site 3 ranged from no change during the February and April 1997 seepage runs to an approximately 20-percent decrease during the June 1996 seepage run. Because the June 1996 seepage run coincided with a period of diversions from San Francisquito Creek to Lake Lagunita, the significant decrease in streamflow during that seepage run may have been caused by a sudden increase in the diversion rate.
The stability of streamflow in the middle (sites 3 through 7) and lower reaches (sites 7 through 12) of San Francisquito Creek, below USGS stream gage 11164500, was more difficult to ascertain because of the existence of large-diameter storm drains, which can carry flow to San Francisquito Creek independent of storm conditions. The locations of all storm drains terminating at San Francisquito Creek were not known prior to the seepage runs; where observed, urban runoff appeared to be restricted to the storm drains with
cterization of Surface- and Ground-Water Quality, California, 1996–97
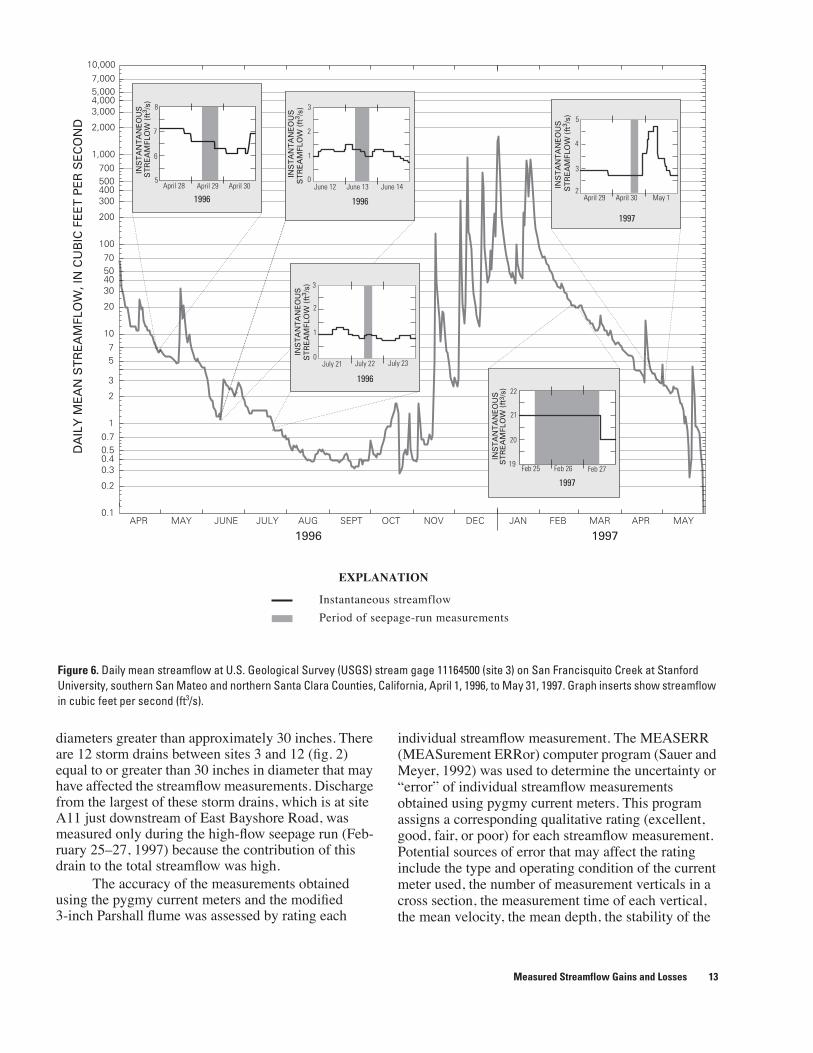
Figure 6. Daily mean streamflow at U.S. Geological Survey (USGS) stream gage 11164500 (site 3) on San Francisquito Creek at Stanford University, southern San Mateo and northern Santa Clara Counties, California, April 1, 1996, to May 31, 1997. Graph inserts show streamflow in cubic feet per second (ft3/s).
APR MAY JUNE JULY AUG SEPT OCT NOV DEC JAN FEB MAR APR MAY
1996 1997
0.1
10,000
0.2
0.30.40.50.7
1
2
3
57
10
20
30405070
100
200
300400500700
1,000
2,000
3,0004,0005,0007,000
DA
ILY
ME
AN
ST
RE
AM
FLO
W, I
N C
UB
IC F
EE
T P
ER
SE
CO
ND
INS
TA
NT
AN
EO
US
ST
RE
AM
FLO
W (
ft3 /
s)
INS
TA
NT
AN
EO
US
ST
RE
AM
FLO
W (
ft3 /
s)
INS
TA
NT
AN
EO
US
ST
RE
AM
FLO
W (
ft3 /
s)
INS
TA
NT
AN
EO
US
ST
RE
AM
FLO
W (
ft3 /
s)
INS
TA
NT
AN
EO
US
ST
RE
AM
FLO
W (
ft3 /
s)
EXPLANATION
20
19Feb 25 Feb 26 Feb 27
21
22
Instantaneous streamflow
Period of seepage-run measurements
5
6
7
8
April 28 April 29 April 30
1996 1996
1996
1997
1997
0
1
2
3
June 12 June 13 June 14
0
1
2
3
July 21 July 22 July 23
2
3
4
5
April 29 April 30 May 1
diameters greater than approximately 30 inches. There are 12 storm drains between sites 3 and 12 (fig. 2) equal to or greater than 30 inches in diameter that may have affected the streamflow measurements. Discharge from the largest of these storm drains, which is at site A11 just downstream of East Bayshore Road, was measured only during the high-flow seepage run (Feb-ruary 25–27, 1997) because the contribution of this drain to the total streamflow was high.
The accuracy of the measurements obtained using the pygmy current meters and the modified 3-inch Parshall flume was assessed by rating each
individual streamflow measurement. The MEASERR (MEASurement ERRor) computer program (Sauer and Meyer, 1992) was used to determine the uncertainty or “error” of individual streamflow measurements obtained using pygmy current meters. This program assigns a corresponding qualitative rating (excellent, good, fair, or poor) for each streamflow measurement. Potential sources of error that may affect the rating include the type and operating condition of the current meter used, the number of measurement verticals in a cross section, the measurement time of each vertical, the mean velocity, the mean depth, the stability of the
Measured Streamflow Gains and Losses 13
stream bottom, and the experience of the operator (Sauer and Meyer, 1992). Streamflow-measurement error ranged from good (2 to less than 5 percent) to poor (greater than 8 percent) for individual pygmy current meter measurements. Overall, 91 percent of the streamflow measurements made using the pygmy current meter had at least a fair measurement rating (measured discharge within 8 percent of ‘true’ discharge). In contrast, measurements made using the modified 3-inch Parshall flume generally were accurate to within 2 to 3 percent because of the fewer potential sources of error. The sources of error using the flume are limited mainly to flume installation, including leveling of the flume and minimizing leakage of water under and around it (Rantz and others, 1982).
The accuracy of the streamflow measurements was further assessed by comparing the pygmy current-meter measurements at the streamflow-measurement station at site 3 with the instantaneous stream-gage records for USGS stream gage 11164500. The differences between the pygmy current meter measurements and the instantaneous stream-gage records were 1 percent for the April 1996 seepage run, less than 1 percent for the June 1996 seepage run, 6 percent for the July 1996 seepage run, 11 percent for the February 1997 seepage run, and 37 percent for the April 1997 seepage run. The large difference for the April 1997 seepage run may be due to hydrographer error. Some differences, however, may be attributable to the broad-crested weir at USGS stream gage 11164500; this type of control structure can be insensitive to low-flow conditions, especially during periods of warm weather when algae growth can occur on the weir’s upstream side. The growth of the algae can cause water to pool slightly behind the weir resulting in a slightly higher gage height. A few hundredths of a foot change in gage height can result in a large change in discharge (Rantz and others, 1982).
Streamflow gains and losses were calculated for each reach using streamflow measurements from successive stations. Duplicate measurements made during the same seepage run for individual sites were averaged prior to calculating gains and losses. The measurement error for the averaged measurements was determined by calculating the root mean square of the individual streamflow measurement errors. Measurable inflows to San Francisquito Creek from Los Trancos Creek and from the creek’s largest storm drain (A11) were subtracted from the downstream streamflow measurements, and reported diversions to Lake Lagunita on the Stanford University campus were added to the streamflow measurements to attain the most accurate calculations of streamflow gains and losses between stations.
14 Streamflow Gains and Losses along San Francisquito Creek and Chara
Streamflow Measurements and Estimated Gains and Losses
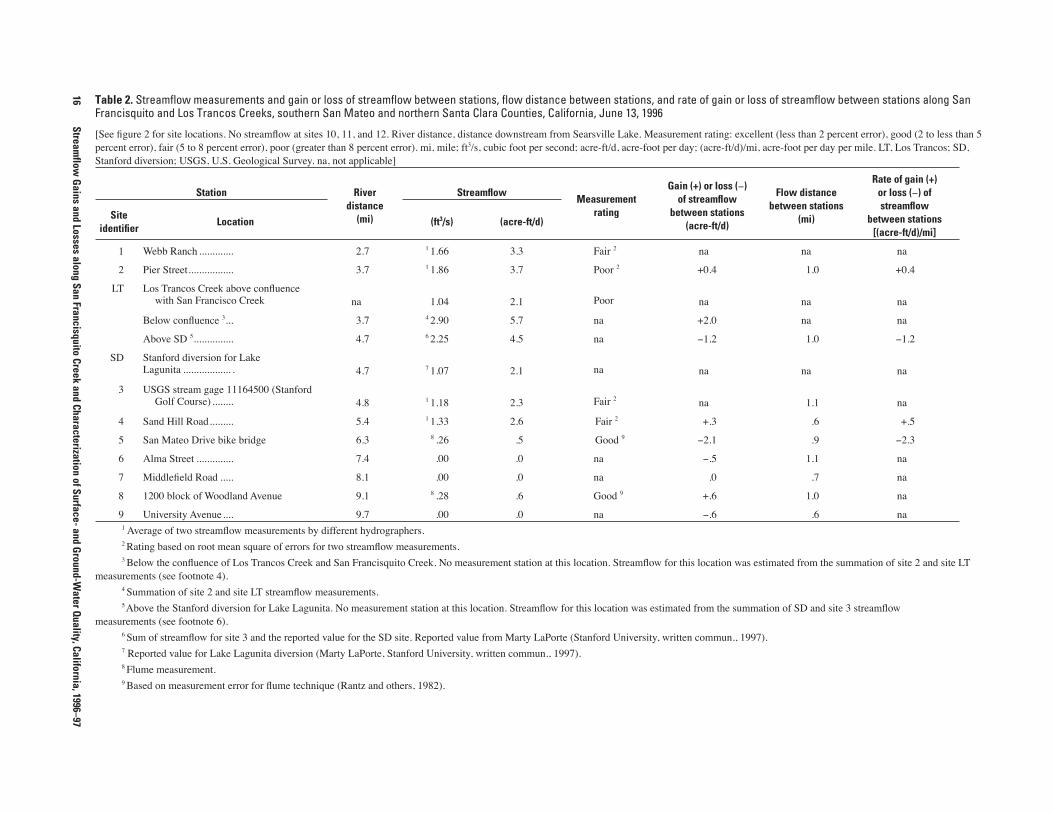
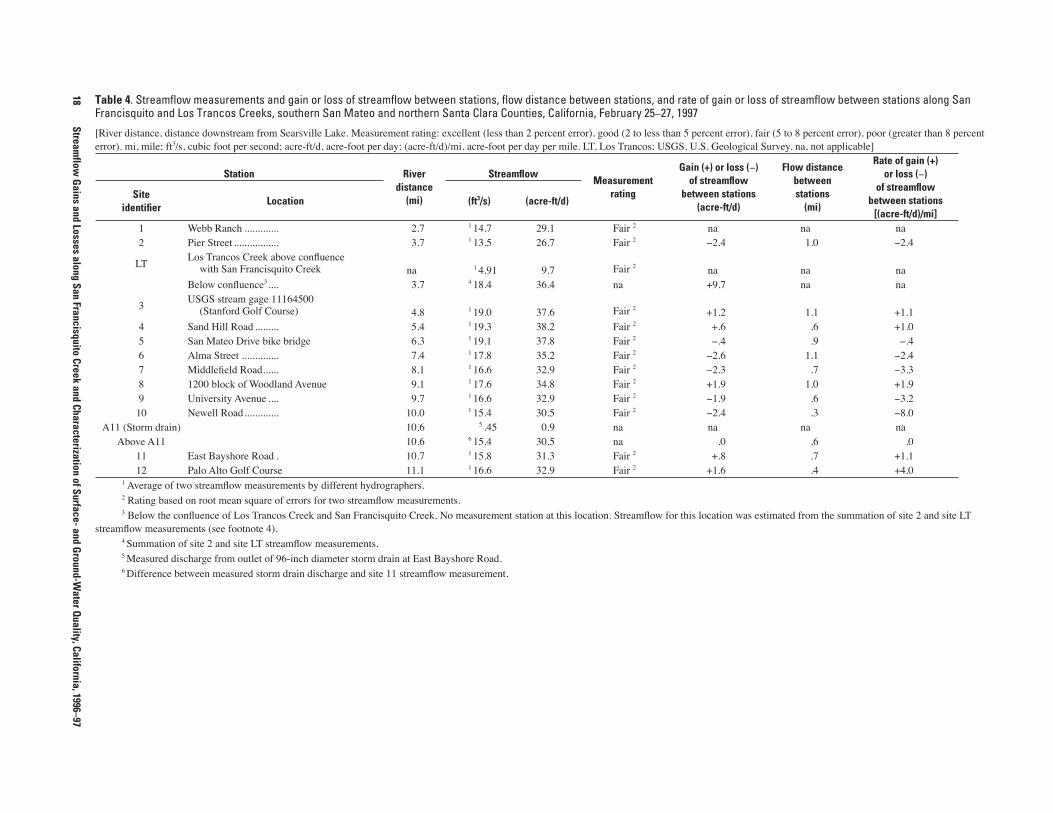
Streamflow measurements, gains or losses between stations, flow distances, and rates of gain or loss of flow are shown in tables 1–5 for the five seepage runs. Streamflow as a function of stream distance downstream from Searsville Lake is depicted graphically in figure 7.
As shown in figure 7, San Francisquito Creek generally is a losing stream downstream from site 4 for all flow regimes. Streamflow gains between some stations during several seepage runs were attributed to urban runoff, water released from bank storage, and ground-water underflow after inflows from Los Trancos Creek (LT) and the storm drain at site A11 had been subtracted.
Average streamflow losses upstream of site 3 were relatively small compared with losses downstream from site 3 when inflows from Los Trancos Creek and diversions by Stanford University are accounted for. Streamflow losses probably were small because the stream channel directly overlies low-permeability, partly consolidated and consolidated bedrock assemblages (figs. 5 and 7). Streamflow losses between sites 1 and 2 averaged 0.8 acre-foot per day (acre-ft/d) for the three seepage runs for which measurements were made at both sites (tables 1, 2, and 4). Downstream from site 2 at Pier Street, streamflow increased sharply for all seepage runs because of inflow from Los Trancos Creek, and decreased just upstream of site 3 at the Stanford University Golf Course during the April and June 1996 seepage runs because of diversions by Stanford University through creekside intake pumps (SD, Stanford diversion) a short distance upstream of site 3 (fig. 7). During the spring, several acre-feet per day are diverted to fill and maintain Lake Lagunita at or near its 360 acre-ft capacity (Sokol, 1964; Marty LaPorte, Stanford University, written commun., 1997). Following commencement ceremonies at the university in mid-June, Lake Lagunita usually is drained to San Francisquito Creek through storm drains located upstream of site 6 (Larry Andrews, Stanford University Facilities Operations, oral commun., 1997). After accounting for inflow from Los Trancos Creek (+LT) and diversions from San Francisquito Creek to Lake Lagunita (−SD), losses between sites 2 and 3 were negligible, averaging only 0.1 acre-ft/d for four of the seepage runs.
Downstream from site 3, the streambed overlies unconsolidated alluvium (figs. 5 and 7). Streamflow measurements made between sites 3 and 4 show slight gains during the June 1996 and February 1997 seepage runs and slight losses during the April and July 1996
cterization of Surface- and Ground-Water Quality, California, 1996–97
en stations, and rate of gain or loss of streamflow between stations along San April 29, 1996
nt (less than 2 percent error), good (2 to less than 5 percent error), fair (5 to 8 percent error), e-foot per day per mile. LT, Los Trancos; SD, Stanford diversion; USGS, U.S. Geological
n. Streamflow for this location was estimated from the summation of site 2 and site LT
ocation was estimated from the summation of SD and site 3 streamflow measurements (see
rd University, written commun., 1997).
asurementrating
Gain (+) or loss (−) of streamflow
between stations (acre-ft/d)
Flow distance betweenstations
(mi)
Rate of gain (+)or loss (−)
of streamflow between stations
[(acre-ft/d)/mi]Good na na naGood −0.5 1.0 −0.5
Fair na na nana +3.6 na nana −1.2 1.0 −1.2na na na na
Good na 1.1 naFair7 −.8 .6 −1.3Fair7 −.5 .9 −.6Good −4.2 1.1 −3.8Good −2.7 .7 −3.8Fair +.1 1.0 +.1Fair −1.2 .6 −2.0Good +.5 .3 +1.7Good +1.0 .7 +1.4Good −.8 .4 −2.0
Measured Stream
flow G
ains and Losses
15
Table 1. Streamflow measurements and gain or loss of streamflow between stations, flow distance betweFrancisquito and Los Trancos Creeks, southern San Mateo and northern Santa Clara Counties, California,
[See figure 2 for site locations. River distance, distance downstream from Searsville Lake. Measurement rating: excellepoor (greater than 8 percent error). mi, mile; ft3/s, cubic foot per second; acre-ft/d, acre-foot per day; (acre-ft/d)/mi, acrSurvey. na, not applicable]
1 Below the confluence of Los Trancos Creek and San Francisquito Creek. No measurement station at this locatiostreamflow measurements (see footnote 2).
2 Summation of site 2 and site LT streamflow measurements.3 Above the Stanford diversion for Lake Lagunita. No measurement station at this location. Streamflow for this l
footnote 4).4 Sum of streamflow for site 3 and the reported value for the SD site. Reported value from Marty LaPorte (Stanfo5 Reported value for Lake Lagunita diversion (Marty LaPorte, Stanford University, written commun., 1997).6 Average of two streamflow measurements by different hydrographers.7Rating based on root mean square of errors for two streamflow measurements.
Station Riverdistance
(mi)
Streamflow Me
Site identifier
Location (ft3/s) (acre-ft/d)
1 Webb Ranch............. 2.7 6.46 12.82 Pier Street................. 3.7 6.22 12.3
LT Los Trancos Creek above confluence with San Francisquito Creek na 1.83 3.6
Below confluence1 ... 3.7 2 8.05 15.9Above SD 3 ............. 4.7 4 7.43 14.7
SD Stanford diversion for Lake Lagunita 4.7 5 .81 1.63 USGS stream gage 11164500
(Stanford Golf Course) 4.8 6.62 13.14 Sand Hill Road......... 5.4 6 6.20 12.35 San Mateo Drive bike bridge 6.3 6 5.96 11.86 Alma Street .............. 7.4 3.83 7.67 Middlefield Road ..... 8.1 2.49 4.98 1200 block of Woodland Avenue 9.1 2.52 5.09 University Avenue.... 9.7 1.90 3.8
10 Newell Road ............ 10.0 2.14 4.211 East Bayshore Road. 10.7 2.64 5.212 Palo Alto Municipal Golf Course 11.1 2.20 4.4
16
Streamflow
Gains and Losses along San Francisquito Creek and Characterization of Surface- and G
round-Water Q
uality, California, 1996–97
f gain or loss of streamflow between stations along San
ating: excellent (less than 2 percent error), good (2 to less than 5 cre-ft/d)/mi, acre-foot per day per mile. LT, Los Trancos; SD,
cation was estimated from the summation of site 2 and site LT
m the summation of SD and site 3 streamflow
mmun., 1997).
r loss (−)mflow
stations-ft/d)
Flow distance between stations
(mi)
Rate of gain (+)or loss (−) ofstreamflow
between stations[(acre-ft/d)/mi]
na na
.4 1.0 +0.4
na na
.0 na na
.2 1.0 −1.2
na na
1.1 na
.3 .6 +.5
.1 .9 −2.3
.5 1.1 na
.0 .7 na
.6 1.0 na
.6 .6 na
Table 2. Streamflow measurements and gain or loss of streamflow between stations, flow distance between stations, and rate oFrancisquito and Los Trancos Creeks, southern San Mateo and northern Santa Clara Counties, California, June 13, 1996
[See figure 2 for site locations. No streamflow at sites 10, 11, and 12. River distance, distance downstream from Searsville Lake. Measurement rpercent error), fair (5 to 8 percent error), poor (greater than 8 percent error). mi, mile; ft3/s, cubic foot per second; acre-ft/d, acre-foot per day; (aStanford diversion; USGS, U.S. Geological Survey. na, not applicable]
1 Average of two streamflow measurements by different hydrographers.2 Rating based on root mean square of errors for two streamflow measurements.3 Below the confluence of Los Trancos Creek and San Francisquito Creek. No measurement station at this location. Streamflow for this lo
measurements (see footnote 4).4 Summation of site 2 and site LT streamflow measurements.5 Above the Stanford diversion for Lake Lagunita. No measurement station at this location. Streamflow for this location was estimated fro
measurements (see footnote 6).6 Sum of streamflow for site 3 and the reported value for the SD site. Reported value from Marty LaPorte (Stanford University, written co7 Reported value for Lake Lagunita diversion (Marty LaPorte, Stanford University, written commun., 1997).8 Flume measurement.9 Based on measurement error for flume technique (Rantz and others, 1982).
Station Riverdistance
(mi)
StreamflowMeasurement
rating
Gain (+) oof strea
between(acre
Site identifier
Location (ft3/s) (acre-ft/d)
1 Webb Ranch ............. 2.7 1 1.66 3.3 Fair 2 na
2 Pier Street................. 3.7 1 1.86 3.7 Poor 2 +0
LT Los Trancos Creek above confluencewith San Francisco Creek na 1.04 2.1 Poor na
Below confluence 3... 3.7 4 2.90 5.7 na +2
Above SD 5............... 4.7 6 2.25 4.5 na −1
SD Stanford diversion for LakeLagunita .................. . 4.7 7 1.07 2.1 na na
3 USGS stream gage 11164500 (StanfordGolf Course) ........ 4.8 1 1.18 2.3 Fair 2 na
4 Sand Hill Road......... 5.4 1 1.33 2.6 Fair 2 +
5 San Mateo Drive bike bridge 6.3 8 .26 .5 Good 9 −2
6 Alma Street .............. 7.4 .00 .0 na −
7 Middlefield Road ..... 8.1 .00 .0 na
8 1200 block of Woodland Avenue 9.1 8 .28 .6 Good 9 +
9 University Avenue.... 9.7 .00 .0 na −
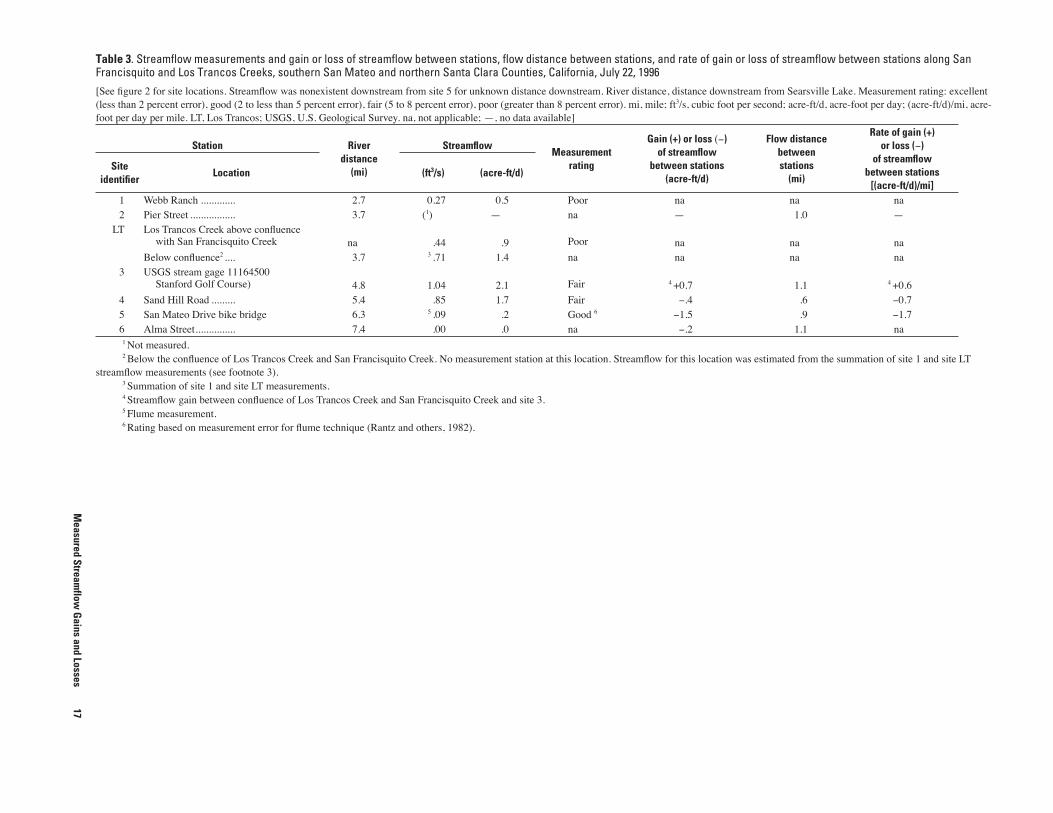
n stations, flow distance between stations, and rate of gain or loss of streamflow between stations along San anta Clara Counties, California, July 22, 1996 for unknown distance downstream. River distance, distance downstream from Searsville Lake. Measurement rating: excellent
error), poor (greater than 8 percent error). mi, mile; ft3/s, cubic foot per second; acre-ft/d, acre-foot per day; (acre-ft/d)/mi, acre-licable; —, no data available]
o measurement station at this location. Streamflow for this location was estimated from the summation of site 1 and site LT
quito Creek and site 3.
1982).
treamflowMeasurement
rating
Gain (+) or loss (−)of streamflow
between stations(acre-ft/d)
Flow distance betweenstations
(mi)
Rate of gain (+)or loss (−)
of streamflowbetween stations
[(acre-ft/d)/mi](acre-ft/d)
0.5 Poor na na na— na — 1.0 —
.9 Poor na na na1.4 na na na na
2.1 Fair 4 +0.7 1.1 4 +0.61.7 Fair −.4 .6 −0.7.2 Good 6 −1.5 .9 −1.7.0 na −.2 1.1 na
Measured Stream
flow G
ains and Losses
17
Table 3. Streamflow measurements and gain or loss of streamflow betweeFrancisquito and Los Trancos Creeks, southern San Mateo and northern S[See figure 2 for site locations. Streamflow was nonexistent downstream from site 5(less than 2 percent error), good (2 to less than 5 percent error), fair (5 to 8 percent foot per day per mile. LT, Los Trancos; USGS, U.S. Geological Survey. na, not app
1 Not measured.2 Below the confluence of Los Trancos Creek and San Francisquito Creek. N
streamflow measurements (see footnote 3).3 Summation of site 1 and site LT measurements.4 Streamflow gain between confluence of Los Trancos Creek and San Francis5 Flume measurement.6 Rating based on measurement error for flume technique (Rantz and others,
Station Riverdistance
(mi)
S
Site identifier
Location (ft3/s)
1 Webb Ranch ............. 2.7 0.272 Pier Street ................. 3.7 (1)
LT Los Trancos Creek above confluence with San Francisquito Creek na .44
Below confluence2 .... 3.7 3 .713 USGS stream gage 11164500
Stanford Golf Course) 4.8 1.044 Sand Hill Road ......... 5.4 .855 San Mateo Drive bike bridge 6.3 5 .096 Alma Street............... 7.4 .00
18
Streamflow
Gains and Losses along San Francisquito Creek and Characterization of Surface- and G
round-Water Q
uality, California, 1996–97
en stations, and rate of gain or loss of streamflow between stations along San , February 25–27, 1997
good (2 to less than 5 percent error), fair (5 to 8 percent error), poor (greater than 8 percent , Los Trancos; USGS, U.S. Geological Survey. na, not applicable]
ion. Streamflow for this location was estimated from the summation of site 2 and site LT
Measurement rating
Gain (+) or loss (−)of streamflow
between stations (acre-ft/d)
Flow distance betweenstations
(mi)
Rate of gain (+)or loss (−)
of streamflow between stations
[(acre-ft/d)/mi]Fair 2 na na naFair 2 −2.4 1.0 −2.4
Fair 2 na na nana +9.7 na na
Fair 2 +1.2 1.1 +1.1Fair 2 +.6 .6 +1.0Fair 2 −.4 .9 −.4Fair 2 −2.6 1.1 −2.4Fair 2 −2.3 .7 −3.3Fair 2 +1.9 1.0 +1.9Fair 2 −1.9 .6 −3.2Fair 2 −2.4 .3 −8.0na na na nana .0 .6 .0Fair 2 +.8 .7 +1.1Fair 2 +1.6 .4 +4.0
Table 4. Streamflow measurements and gain or loss of streamflow between stations, flow distance betweFrancisquito and Los Trancos Creeks, southern San Mateo and northern Santa Clara Counties, California
[River distance, distance downstream from Searsville Lake. Measurement rating: excellent (less than 2 percent error),error). mi, mile; ft3/s, cubic foot per second; acre-ft/d, acre-foot per day; (acre-ft/d)/mi, acre-foot per day per mile. LT
1 Average of two streamflow measurements by different hydrographers.2 Rating based on root mean square of errors for two streamflow measurements.3 Below the confluence of Los Trancos Creek and San Francisquito Creek. No measurement station at this locat
streamflow measurements (see footnote 4).4 Summation of site 2 and site LT streamflow measurements.5 Measured discharge from outlet of 96-inch diameter storm drain at East Bayshore Road.6 Difference between measured storm drain discharge and site 11 streamflow measurement.
Station Riverdistance
(mi)
Streamflow
Site identifier
Location (ft3/s) (acre-ft/d)
1 Webb Ranch ............. 2.7 1 14.7 29.12 Pier Street ................. 3.7 1 13.5 26.7
LTLos Trancos Creek above confluence
with San Francisquito Creek na 1 4.91 9.7Below confluence3.... 3.7 4 18.4 36.4
3USGS stream gage 11164500
(Stanford Golf Course) 4.8 1 19.0 37.64 Sand Hill Road ......... 5.4 1 19.3 38.25 San Mateo Drive bike bridge 6.3 1 19.1 37.86 Alma Street .............. 7.4 1 17.8 35.27 Middlefield Road...... 8.1 1 16.6 32.98 1200 block of Woodland Avenue 9.1 1 17.6 34.89 University Avenue .... 9.7 1 16.6 32.910 Newell Road............. 10.0 1 15.4 30.5
A11 (Storm drain) 10.6 5 .45 0.9Above A11 10.6 6 15.4 30.5
11 East Bayshore Road . 10.7 1 15.8 31.312 Palo Alto Golf Course 11.1 1 16.6 32.9
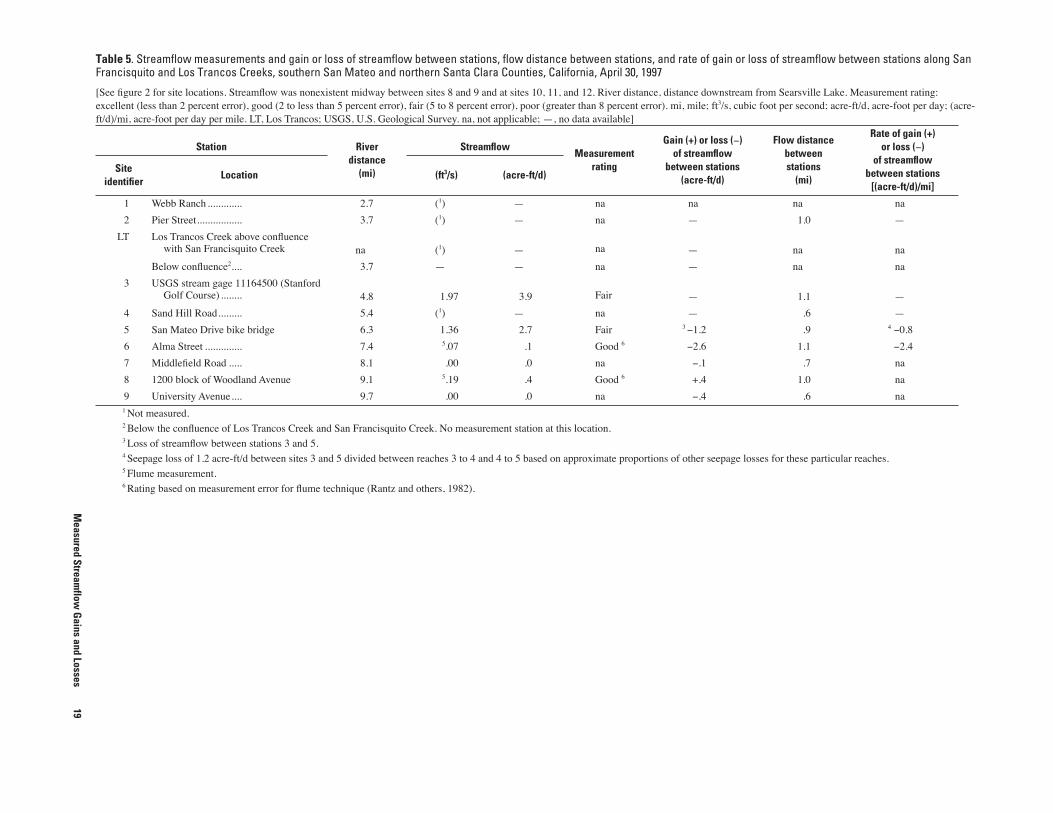
ow distance between stations, and rate of gain or loss of streamflow between stations along San unties, California, April 30, 1997
sites 10, 11, and 12. River distance, distance downstream from Searsville Lake. Measurement rating: ), poor (greater than 8 percent error). mi, mile; ft3/s, cubic foot per second; acre-ft/d, acre-foot per day; (acre-licable; —, no data available]
t station at this location.
5 based on approximate proportions of other seepage losses for these particular reaches.
Measurementrating
Gain (+) or loss (−)of streamflow
between stations(acre-ft/d)
Flow distance betweenstations
(mi)
Rate of gain (+)or loss (−)
of streamflow between stations
[(acre-ft/d)/mi]cre-ft/d)
— na na na na
— na — 1.0 —
— na — na na
— na — na na
3.9 Fair — 1.1 —
— na — .6 —
2.7 Fair 3 −1.2 .9 4 −0.8
.1 Good 6 −2.6 1.1 −2.4
.0 na −.1 .7 na
.4 Good 6 +.4 1.0 na
.0 na −.4 .6 na
Measured Stream
flow G
ains and Losses
19
Table 5. Streamflow measurements and gain or loss of streamflow between stations, flFrancisquito and Los Trancos Creeks, southern San Mateo and northern Santa Clara Co
[See figure 2 for site locations. Streamflow was nonexistent midway between sites 8 and 9 and at excellent (less than 2 percent error), good (2 to less than 5 percent error), fair (5 to 8 percent errorft/d)/mi, acre-foot per day per mile. LT, Los Trancos; USGS, U.S. Geological Survey. na, not app
1 Not measured.2 Below the confluence of Los Trancos Creek and San Francisquito Creek. No measuremen3 Loss of streamflow between stations 3 and 5.4 Seepage loss of 1.2 acre-ft/d between sites 3 and 5 divided between reaches 3 to 4 and 4 to5 Flume measurement.6 Rating based on measurement error for flume technique (Rantz and others, 1982).
Station Riverdistance
(mi)
Streamflow
Site identifier
Location (ft3/s) (a
1 Webb Ranch ............. 2.7 (1)
2 Pier Street................. 3.7 (1)
LT Los Trancos Creek above confluence with San Francisquito Creek na (1)
Below confluence2.... 3.7 —
3 USGS stream gage 11164500 (Stanford Golf Course) ........ 4.8 1.97
4 Sand Hill Road......... 5.4 (1)
5 San Mateo Drive bike bridge 6.3 1.36
6 Alma Street .............. 7.4 5.07
7 Middlefield Road ..... 8.1 .00
8 1200 block of Woodland Avenue 9.1 5.19
9 University Avenue.... 9.7 .00
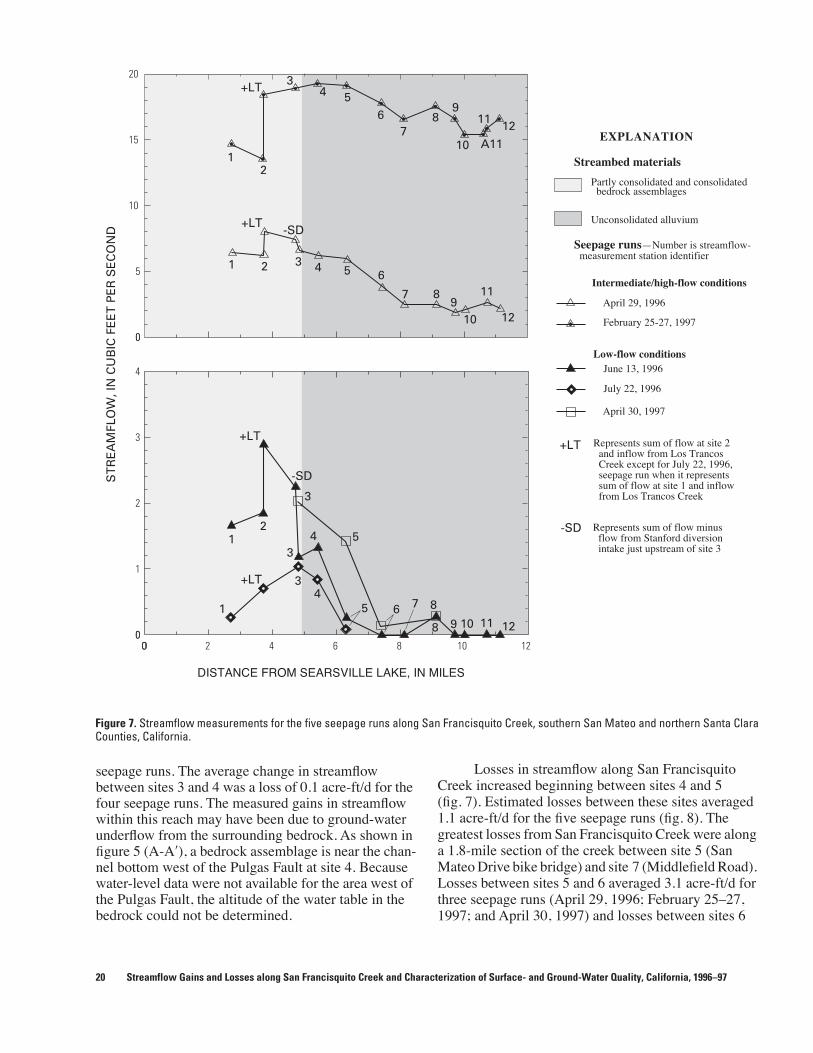
Figure 7. Streamflow measurements for the five seepage runs along San Francisquito Creek, southern San Mateo and northern Santa Clara Counties, California.
Streambed materials
Seepage runs—Number is streamflow- measurement station identifier
Low-flow conditions
Intermediate/high-flow conditions
0
20
0
5
10
15
0 120 2 4 6 8 10
DISTANCE FROM SEARSVILLE LAKE, IN MILES
0
4
0
1
2
3
ST
RE
AM
FLO
W, I
N C
UB
IC F
EE
T P
ER
SE
CO
ND
Unconsolidated alluvium
Partly consolidated and consolidated bedrock assemblages
Represents sum of flow at site 2 and inflow from Los Trancos Creek except for July 22, 1996, seepage run when it represents sum of flow at site 1 and inflow from Los Trancos Creek
Represents sum of flow minus flow from Stanford diversion intake just upstream of site 3
+LT
-SD1
1
12
2
21
+LT
+LT
+LT
+LT
-SD
-SD
3
3
3
3
3
4
4
4
4
5
5
5
5
6
6
6
7
7
7
8
8
8
8
9
9
9
10
10
10
A11
11
11
11
12
12
12
April 29, 1996
June 13, 1996
July 22, 1996
April 30, 1997
February 25-27, 1997
EXPLANATION
seepage runs. The average change in streamflow between sites 3 and 4 was a loss of 0.1 acre-ft/d for the four seepage runs. The measured gains in streamflow within this reach may have been due to ground-water underflow from the surrounding bedrock. As shown in figure 5 (A-A′), a bedrock assemblage is near the chan-nel bottom west of the Pulgas Fault at site 4. Because water-level data were not available for the area west of the Pulgas Fault, the altitude of the water table in the bedrock could not be determined.
20 Streamflow Gains and Losses along San Francisquito Creek and Chara
Losses in streamflow along San Francisquito Creek increased beginning between sites 4 and 5 (fig. 7). Estimated losses between these sites averaged 1.1 acre-ft/d for the five seepage runs (fig. 8). The greatest losses from San Francisquito Creek were along a 1.8-mile section of the creek between site 5 (San Mateo Drive bike bridge) and site 7 (Middlefield Road). Losses between sites 5 and 6 averaged 3.1 acre-ft/d for three seepage runs (April 29, 1996; February 25–27, 1997; and April 30, 1997) and losses between sites 6
cterization of Surface- and Ground-Water Quality, California, 1996–97
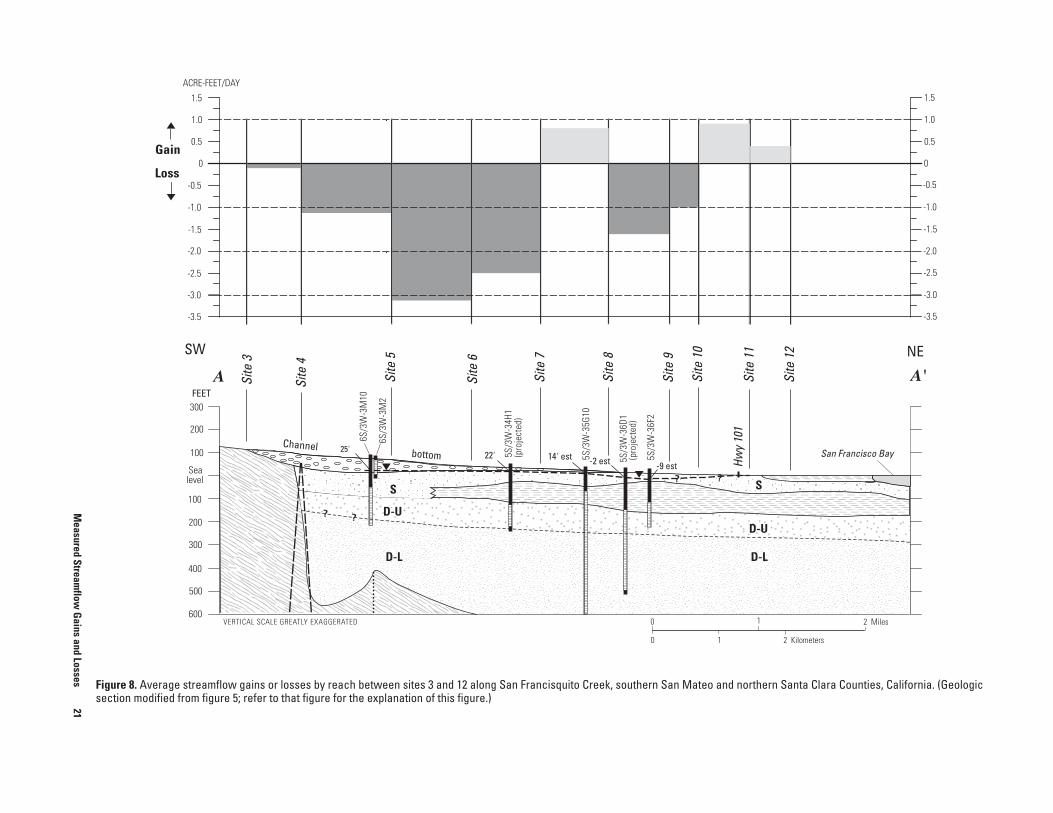
nd northern Santa Clara Counties, California. (Geologic
Site
11
Site
12 NE
1 2 Miles
2 Kilometers
D-L
S
D-U
Hwy
101
San Francisco Bay
A'
-0.5
-2.0
-1.5
0.5
-1.0
0
1.0
-2.5
-3.0
-3.5
1.5
Measured Stream
flow G
ains and Losses
21
Figure 8. Average streamflow gains or losses by reach between sites 3 and 12 along San Francisquito Creek, southern San Mateo asection modified from figure 5; refer to that figure for the explanation of this figure.)
ACRE-FEET/DAY
FEET
Site
4
Site
6
Site
7
Site
8
Site
9
Site
10
Site
5
Site
3 SW
bottomChannel
0
0 1
VERTICAL SCALE GREATLY EXAGGERATED
D-L
S
-9 est-2 est14' est22' 25'
? ?D-U
Sea level
300
200
200
100
100
300
400
500
600
5S/3
W-3
4H1
(pro
ject
ed)
5S/3
W-3
5G10
5S/3
W-3
6D1
(pro
ject
ed)
5S/3
W-3
6F2
6S/3
W-3
M10
6S/3
W-3
M2
? ?
A
-0.5
-2.0
-1.5
0.5
-1.0
0
1.0
-2.5
-3.0
-3.5
1.5
Gain
Loss
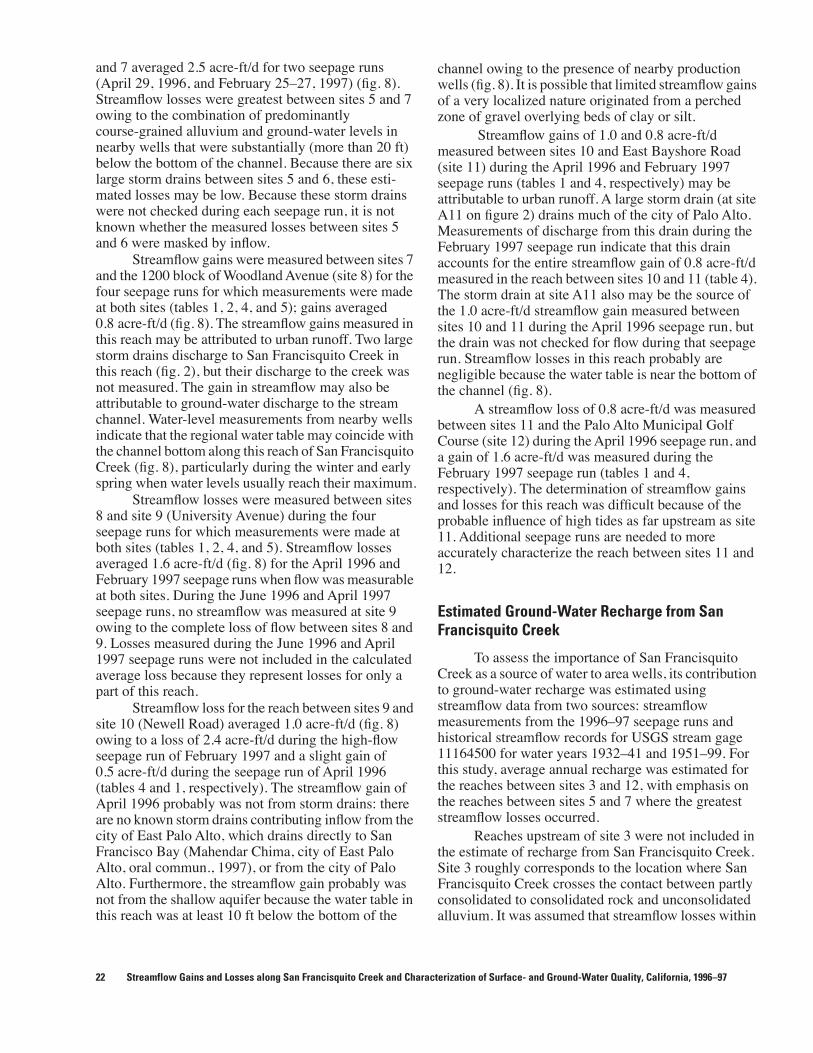
and 7 averaged 2.5 acre-ft/d for two seepage runs (April 29, 1996, and February 25–27, 1997) (fig. 8). Streamflow losses were greatest between sites 5 and 7 owing to the combination of predominantly course-grained alluvium and ground-water levels in nearby wells that were substantially (more than 20 ft) below the bottom of the channel. Because there are six large storm drains between sites 5 and 6, these esti-mated losses may be low. Because these storm drains were not checked during each seepage run, it is not known whether the measured losses between sites 5 and 6 were masked by inflow.
Streamflow gains were measured between sites 7 and the 1200 block of Woodland Avenue (site 8) for the four seepage runs for which measurements were made at both sites (tables 1, 2, 4, and 5); gains averaged 0.8 acre-ft/d (fig. 8). The streamflow gains measured in this reach may be attributed to urban runoff. Two large storm drains discharge to San Francisquito Creek in this reach (fig. 2), but their discharge to the creek was not measured. The gain in streamflow may also be attributable to ground-water discharge to the stream channel. Water-level measurements from nearby wells indicate that the regional water table may coincide with the channel bottom along this reach of San Francisquito Creek (fig. 8), particularly during the winter and early spring when water levels usually reach their maximum.
Streamflow losses were measured between sites 8 and site 9 (University Avenue) during the four seepage runs for which measurements were made at both sites (tables 1, 2, 4, and 5). Streamflow losses averaged 1.6 acre-ft/d (fig. 8) for the April 1996 and February 1997 seepage runs when flow was measurable at both sites. During the June 1996 and April 1997 seepage runs, no streamflow was measured at site 9 owing to the complete loss of flow between sites 8 and 9. Losses measured during the June 1996 and April 1997 seepage runs were not included in the calculated average loss because they represent losses for only a part of this reach.
Streamflow loss for the reach between sites 9 and site 10 (Newell Road) averaged 1.0 acre-ft/d (fig. 8) owing to a loss of 2.4 acre-ft/d during the high-flow seepage run of February 1997 and a slight gain of 0.5 acre-ft/d during the seepage run of April 1996 (tables 4 and 1, respectively). The streamflow gain of April 1996 probably was not from storm drains: there are no known storm drains contributing inflow from the city of East Palo Alto, which drains directly to San Francisco Bay (Mahendar Chima, city of East Palo Alto, oral commun., 1997), or from the city of Palo Alto. Furthermore, the streamflow gain probably was not from the shallow aquifer because the water table in this reach was at least 10 ft below the bottom of the
22 Streamflow Gains and Losses along San Francisquito Creek and Chara
channel owing to the presence of nearby production wells (fig. 8). It is possible that limited streamflow gains of a very localized nature originated from a perched zone of gravel overlying beds of clay or silt.
Streamflow gains of 1.0 and 0.8 acre-ft/d measured between sites 10 and East Bayshore Road (site 11) during the April 1996 and February 1997 seepage runs (tables 1 and 4, respectively) may be attributable to urban runoff. A large storm drain (at site A11 on figure 2) drains much of the city of Palo Alto. Measurements of discharge from this drain during the February 1997 seepage run indicate that this drain accounts for the entire streamflow gain of 0.8 acre-ft/d measured in the reach between sites 10 and 11 (table 4). The storm drain at site A11 also may be the source of the 1.0 acre-ft/d streamflow gain measured between sites 10 and 11 during the April 1996 seepage run, but the drain was not checked for flow during that seepage run. Streamflow losses in this reach probably are negligible because the water table is near the bottom of the channel (fig. 8).
A streamflow loss of 0.8 acre-ft/d was measured between sites 11 and the Palo Alto Municipal Golf Course (site 12) during the April 1996 seepage run, and a gain of 1.6 acre-ft/d was measured during the February 1997 seepage run (tables 1 and 4, respectively). The determination of streamflow gains and losses for this reach was difficult because of the probable influence of high tides as far upstream as site 11. Additional seepage runs are needed to more accurately characterize the reach between sites 11 and 12.
Estimated Ground-Water Recharge from San Francisquito Creek
To assess the importance of San Francisquito Creek as a source of water to area wells, its contribution to ground-water recharge was estimated using streamflow data from two sources: streamflow measurements from the 1996–97 seepage runs and historical streamflow records for USGS stream gage 11164500 for water years 1932–41 and 1951–99. For this study, average annual recharge was estimated for the reaches between sites 3 and 12, with emphasis on the reaches between sites 5 and 7 where the greatest streamflow losses occurred.
Reaches upstream of site 3 were not included in the estimate of recharge from San Francisquito Creek. Site 3 roughly corresponds to the location where San Francisquito Creek crosses the contact between partly consolidated to consolidated rock and unconsolidated alluvium. It was assumed that streamflow losses within
cterization of Surface- and Ground-Water Quality, California, 1996–97
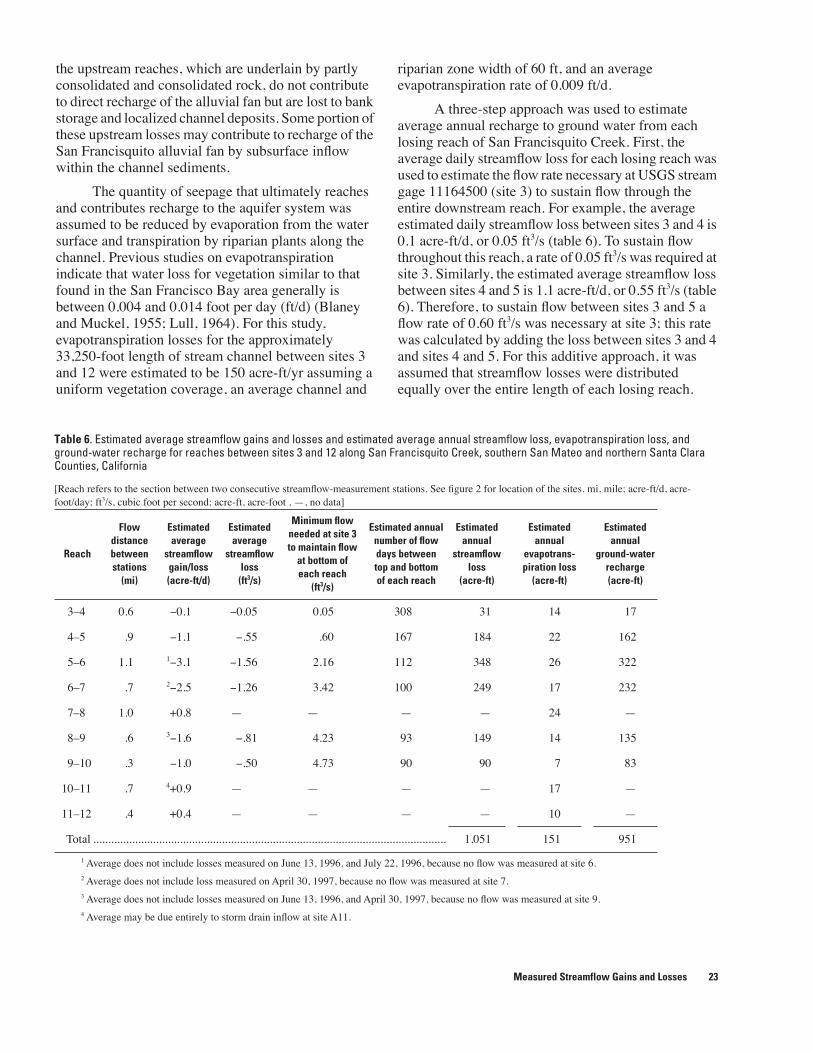
the upstream reaches, which are underlain by partly consolidated and consolidated rock, do not contribute to direct recharge of the alluvial fan but are lost to bank storage and localized channel deposits. Some portion of these upstream losses may contribute to recharge of the San Francisquito alluvial fan by subsurface inflow within the channel sediments.
The quantity of seepage that ultimately reaches and contributes recharge to the aquifer system was assumed to be reduced by evaporation from the water surface and transpiration by riparian plants along the channel. Previous studies on evapotranspiration indicate that water loss for vegetation similar to that found in the San Francisco Bay area generally is between 0.004 and 0.014 foot per day (ft/d) (Blaney and Muckel, 1955; Lull, 1964). For this study, evapotranspiration losses for the approximately 33,250-foot length of stream channel between sites 3 and 12 were estimated to be 150 acre-ft/yr assuming a uniform vegetation coverage, an average channel and
riparian zone width of 60 ft, and an average evapotranspiration rate of 0.009 ft/d.
A three-step approach was used to estimate average annual recharge to ground water from each losing reach of San Francisquito Creek. First, the average daily streamflow loss for each losing reach was used to estimate the flow rate necessary at USGS stream gage 11164500 (site 3) to sustain flow through the entire downstream reach. For example, the average estimated daily streamflow loss between sites 3 and 4 is 0.1 acre-ft/d, or 0.05 ft3/s (table 6). To sustain flow throughout this reach, a rate of 0.05 ft3/s was required at site 3. Similarly, the estimated average streamflow loss between sites 4 and 5 is 1.1 acre-ft/d, or 0.55 ft3/s (table 6). Therefore, to sustain flow between sites 3 and 5 a flow rate of 0.60 ft3/s was necessary at site 3; this rate was calculated by adding the loss between sites 3 and 4 and sites 4 and 5. For this additive approach, it was assumed that streamflow losses were distributed equally over the entire length of each losing reach.
Table 6. Estimated average streamflow gains and losses and estimated average annual streamflow loss, evapotranspiration loss, and ground-water recharge for reaches between sites 3 and 12 along San Francisquito Creek, southern San Mateo and northern Santa Clara Counties, California
[Reach refers to the section between two consecutive streamflow-measurement stations. See figure 2 for location of the sites. mi, mile; acre-ft/d, acre-foot/day; ft3/s, cubic foot per second; acre-ft, acre-foot , —, no data]
1 Average does not include losses measured on June 13, 1996, and July 22, 1996, because no flow was measured at site 6.2 Average does not include loss measured on April 30, 1997, because no flow was measured at site 7.3 Average does not include losses measured on June 13, 1996, and April 30, 1997, because no flow was measured at site 9.4 Average may be due entirely to storm drain inflow at site A11.
Reach
Flowdistance betweenstations
(mi)
Estimatedaverage
streamflowgain/loss(acre-ft/d)
Estimatedaverage
streamflow loss (ft3/s)
Minimum flowneeded at site 3to maintain flow
at bottom ofeach reach
(ft3/s)
Estimated annual number of flowdays betweentop and bottomof each reach
Estimated annual
streamflowloss
(acre-ft)
Estimated annual
evapotrans-piration loss
(acre-ft)
Estimated annual
ground-waterrecharge(acre-ft)
3–4 0.6 −0.1 −0.05 0.05 308 31 14 17
4–5 .9 −1.1 −.55 .60 167 184 22 162
5–6 1.1 1−3.1 −1.56 2.16 112 348 26 322
6–7 .7 2−2.5 −1.26 3.42 100 249 17 232
7–8 1.0 +0.8 — — — — 24 —
8–9 .6 3−1.6 −.81 4.23 93 149 14 135
9–10 .3 −1.0 −.50 4.73 90 90 7 83
10–11 .7 4+0.9 — — — — 17 —
11–12 .4 +0.4 — — — — 10 —
Total ...................................................................................................................... 1,051 151 951
Measured Streamflow Gains and Losses 23
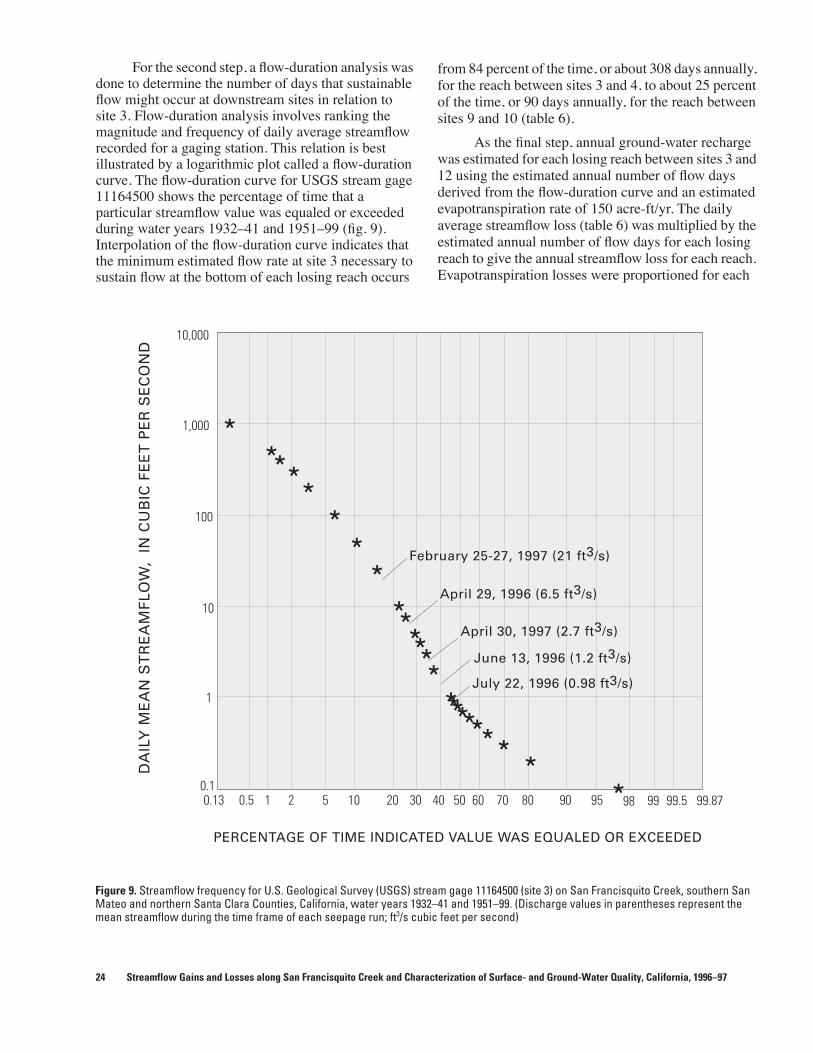
For the second step, a flow-duration analysis was done to determine the number of days that sustainable flow might occur at downstream sites in relation to site 3. Flow-duration analysis involves ranking the magnitude and frequency of daily average streamflow recorded for a gaging station. This relation is best illustrated by a logarithmic plot called a flow-duration curve. The flow-duration curve for USGS stream gage 11164500 shows the percentage of time that a particular streamflow value was equaled or exceeded during water years 1932–41 and 1951–99 (fig. 9). Interpolation of the flow-duration curve indicates that the minimum estimated flow rate at site 3 necessary to sustain flow at the bottom of each losing reach occurs
24 Streamflow Gains and Losses along San Francisquito Creek and Chara
from 84 percent of the time, or about 308 days annually, for the reach between sites 3 and 4, to about 25 percent of the time, or 90 days annually, for the reach between sites 9 and 10 (table 6).
As the final step, annual ground-water recharge was estimated for each losing reach between sites 3 and 12 using the estimated annual number of flow days derived from the flow-duration curve and an estimated evapotranspiration rate of 150 acre-ft/yr. The daily average streamflow loss (table 6) was multiplied by the estimated annual number of flow days for each losing reach to give the annual streamflow loss for each reach. Evapotranspiration losses were proportioned for each
Figure 9. Streamflow frequency for U.S. Geological Survey (USGS) stream gage 11164500 (site 3) on San Francisquito Creek, southern San Mateo and northern Santa Clara Counties, California, water years 1932–41 and 1951–99. (Discharge values in parentheses represent the mean streamflow during the time frame of each seepage run; ft3/s cubic feet per second)
D
AIL
Y M
EA
N S
TR
EA
MFL
OW
, I
N C
UB
IC F
EE
T P
ER
SE
CO
ND
10,000
1,000
100
10
1
0.10.13 0.5 1 2 5 10 20 30 40 50 60 70 80 90 95 98 99 99.5 99.87
*****
**
****
*********** *
*PERCENTAGE OF TIME INDICATED VALUE WAS EQUALED OR EXCEEDED
February 25-27, 1997 (21 ft3/s)
April 29, 1996 (6.5 ft3/s)
April 30, 1997 (2.7 ft3/s)
June 13, 1996 (1.2 ft3/s)
July 22, 1996 (0.98 ft3/s)
cterization of Surface- and Ground-Water Quality, California, 1996–97
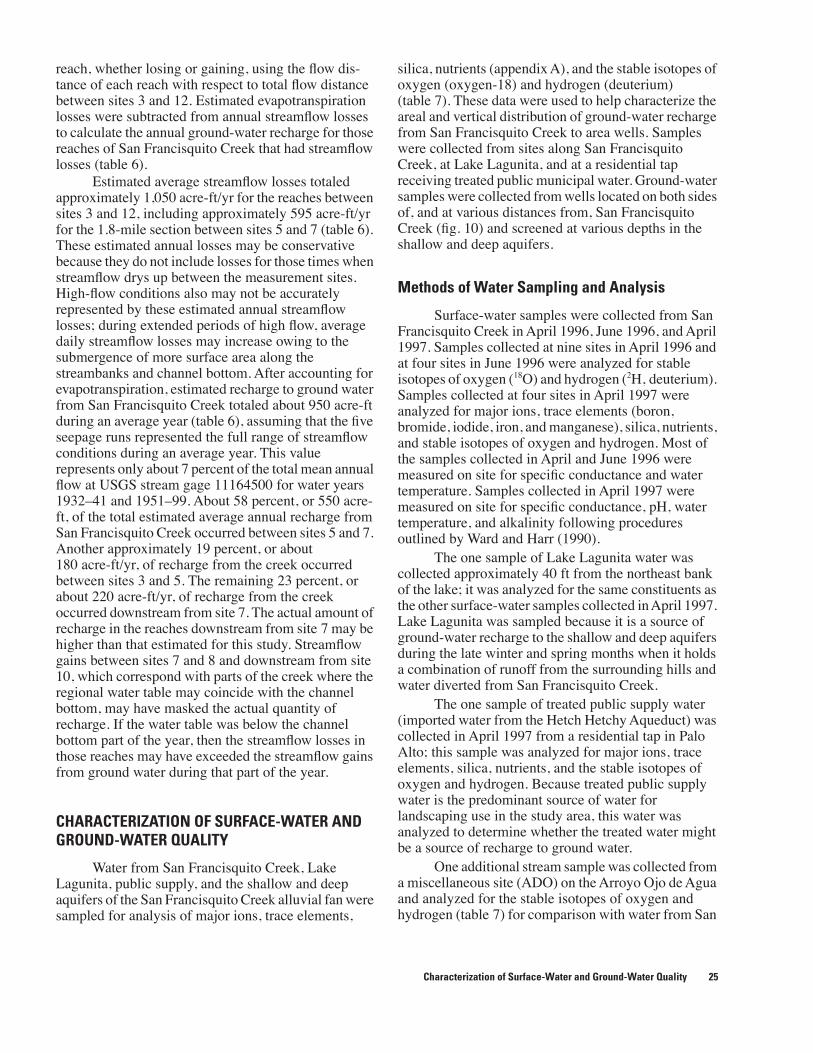
reach, whether losing or gaining, using the flow dis-tance of each reach with respect to total flow distance between sites 3 and 12. Estimated evapotranspiration losses were subtracted from annual streamflow losses to calculate the annual ground-water recharge for those reaches of San Francisquito Creek that had streamflow losses (table 6).
Estimated average streamflow losses totaled approximately 1,050 acre-ft/yr for the reaches between sites 3 and 12, including approximately 595 acre-ft/yr for the 1.8-mile section between sites 5 and 7 (table 6). These estimated annual losses may be conservative because they do not include losses for those times when streamflow drys up between the measurement sites. High-flow conditions also may not be accurately represented by these estimated annual streamflow losses; during extended periods of high flow, average daily streamflow losses may increase owing to the submergence of more surface area along the streambanks and channel bottom. After accounting for evapotranspiration, estimated recharge to ground water from San Francisquito Creek totaled about 950 acre-ft during an average year (table 6), assuming that the five seepage runs represented the full range of streamflow conditions during an average year. This value represents only about 7 percent of the total mean annual flow at USGS stream gage 11164500 for water years 1932–41 and 1951–99. About 58 percent, or 550 acre-ft, of the total estimated average annual recharge from San Francisquito Creek occurred between sites 5 and 7. Another approximately 19 percent, or about 180 acre-ft/yr, of recharge from the creek occurred between sites 3 and 5. The remaining 23 percent, or about 220 acre-ft/yr, of recharge from the creek occurred downstream from site 7. The actual amount of recharge in the reaches downstream from site 7 may be higher than that estimated for this study. Streamflow gains between sites 7 and 8 and downstream from site 10, which correspond with parts of the creek where the regional water table may coincide with the channel bottom, may have masked the actual quantity of recharge. If the water table was below the channel bottom part of the year, then the streamflow losses in those reaches may have exceeded the streamflow gains from ground water during that part of the year.
CHARACTERIZATION OF SURFACE-WATER AND GROUND-WATER QUALITY
Water from San Francisquito Creek, Lake Lagunita, public supply, and the shallow and deep aquifers of the San Francisquito Creek alluvial fan were sampled for analysis of major ions, trace elements,
silica, nutrients (appendix A), and the stable isotopes of oxygen (oxygen-18) and hydrogen (deuterium) (table 7). These data were used to help characterize the areal and vertical distribution of ground-water recharge from San Francisquito Creek to area wells. Samples were collected from sites along San Francisquito Creek, at Lake Lagunita, and at a residential tap receiving treated public municipal water. Ground-water samples were collected from wells located on both sides of, and at various distances from, San Francisquito Creek (fig. 10) and screened at various depths in the shallow and deep aquifers.
Methods of Water Sampling and Analysis
Surface-water samples were collected from San Francisquito Creek in April 1996, June 1996, and April 1997. Samples collected at nine sites in April 1996 and at four sites in June 1996 were analyzed for stable isotopes of oxygen (18O) and hydrogen (2H, deuterium). Samples collected at four sites in April 1997 were analyzed for major ions, trace elements (boron, bromide, iodide, iron, and manganese), silica, nutrients, and stable isotopes of oxygen and hydrogen. Most of the samples collected in April and June 1996 were measured on site for specific conductance and water temperature. Samples collected in April 1997 were measured on site for specific conductance, pH, water temperature, and alkalinity following procedures outlined by Ward and Harr (1990).
The one sample of Lake Lagunita water was collected approximately 40 ft from the northeast bank of the lake; it was analyzed for the same constituents as the other surface-water samples collected in April 1997. Lake Lagunita was sampled because it is a source of ground-water recharge to the shallow and deep aquifers during the late winter and spring months when it holds a combination of runoff from the surrounding hills and water diverted from San Francisquito Creek.
The one sample of treated public supply water (imported water from the Hetch Hetchy Aqueduct) was collected in April 1997 from a residential tap in Palo Alto; this sample was analyzed for major ions, trace elements, silica, nutrients, and the stable isotopes of oxygen and hydrogen. Because treated public supply water is the predominant source of water for landscaping use in the study area, this water was analyzed to determine whether the treated water might be a source of recharge to ground water.
One additional stream sample was collected from a miscellaneous site (ADO) on the Arroyo Ojo de Agua and analyzed for the stable isotopes of oxygen and hydrogen (table 7) for comparison with water from San
Characterization of Surface-Water and Ground-Water Quality 25
Table 7. Summary of oxygen-18 and deuterium ratios in samples from ground-water wells, streamflow-measurement stations, Lake Lagunita, and public supply, southern San Mateo and northern Santa Clara Counties, California, 1996–97
[See figure 10 for location of wells and figure 2 for location of streamflow-measurement stations. USGS (U.S. Geological Survey) identification No. consists of latitude, longitude, and sequence number. Flow-condition rating (based on instantaneous streamflow at USGS stream gage 11164500): I, intermediate flow; L, low flow. ft3/s, cubic foot per second; per mil, parts per thousand.]
1Water-quality sampling site (Arroyo Ojo de Agua).2Sample collected approximately 400 feet upstream of site 6 on indicated date.3Imported water from Hetch Hetchy aqueduct collected at a residential tap in Palo Alto.
State well No. or
site identifier(source of sample)
USGS identification No.
Sampledate
Instantaneous streamflow
(ft3/s)
Flow-condition rating
Deltaoxygen-18(per mil)
Deltadeuterium(per mil)
Streamflow-measurement stations
Site ADO1 372725122144201 4-30-96 — –6.55 –45.4
Site 1 372426122120301 4-29-966-12-96
6.461.66
IL
–5.32–4.92
–33.4–31.6
Site LT 372447122112701 4-29-96 1.83 I –5.53 –36.7
Site 3 372524122111801 4-29-966-12-964-30-97
6.621.181.97
ILL
–5.32–5.12–4.88
–33.4–32.9–34.5
Site 5 372622122104401 4-29-966-12-964-30-97
5.96.26
1.36
ILL
–5.35–4.99–4.93
–34.5–33–33.4
Site 6 372651122100401 2372651122100901
4-29-964-30-97
3.83.07
IL
–5.37–6.74
–32.8–50.3
Site 8 372727122090001 4-29-966-12-964-30-97
2.52.28.19
ILL
–5.76–6.59–6.39
–37.2–44–43.3
Site 9 372726122082401 4-29-96 1.90 I –5.67 –36.9
Site 11 372713122073401 4-29-96 2.64 I –5.66 –37
Site 12 372719122071501 4-29-96 2.20 I –5.53 –36.3
Lake Lagunita and public supply
Lake Lagunita 372523122102401 4-30-97 — –3.7 –29.1
Public supply3 4-28-97 — –13.02 –96
Well sites
5S/3W-25F1 372818122082801 5-02-97 –7.23 –49.6
5S/3W-25G1 372809122081501 5-01-97 –6.58 –45.3
5S/3W-27G1 372809122102101 4-29-97 –8.14 –59.6
5S/3W-27K2 372756122102501 4-29-97 –6.78 –46.7
5S/3W-27R3 372747122100701 4-29-97 –7.12 –48.4
5S/3W-34H1 372722122100501 5-01-97 –6.44 –43.5
5S/3W-35D3 372738122100401 4-29-97 –6.65 –45.8
5S/3W-35G10 372720122091501 5-01-97 –6.52 –43.8
5S/3W-36D1 372733122085701 5-02-97 –6.16 –41.8
5S/3W-36F2 372727122084001 4-28-97 –6.1 –41.6
5S/3W-36L10 372703122083201 4-28-97 –8.97 –66.4
6S/3W-1B2 372640122082401 5-01-97 –6.32 –43.2
6S/3W-1G1 372625122081301 4-28-97 –7.48 –53.6
6S/3W-2H10 372631122091001 4-28-97 –6.02 –40.8
6S/3W-3M2 372620122105601 5-01-97 –5.39 –38.2
6S/3W-3M10 372616122105301 5-02-97 –6.01 –42.9
6S/3W-11B10 372545122092001 5-02-97 –5.81 –40.8
26 Streamflow Gains and Losses along San Francisquito Creek and Characterization of Surface- and Ground-Water Quality, California, 1996–97
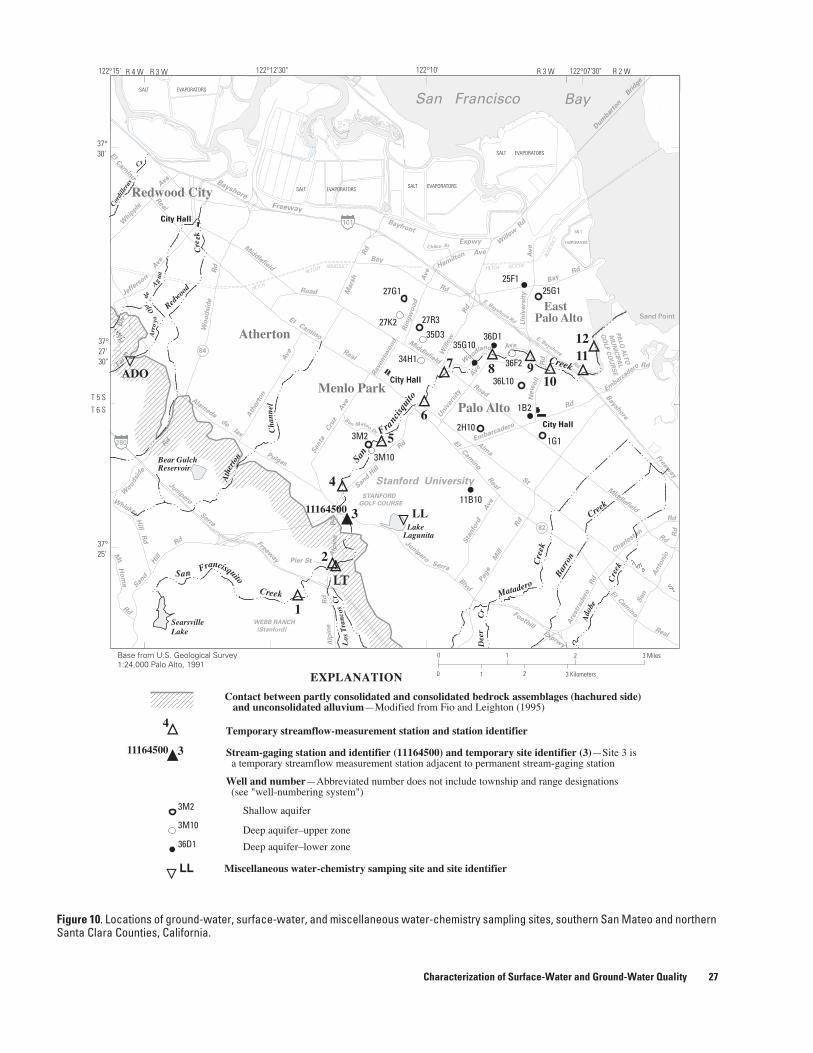
Figure 10. Locations of ground-water, surface-water, and miscellaneous water-chemistry sampling sites, southern San Mateo and northern Santa Clara Counties, California.
Wo
od
sid
e R
d
El Camino Real
El Cam
ino Real
Middlefield
Middlefield
Lake Lagunita
Bear Gulch Reservoir
Embarcadero
Embarc
adero
Alma St
���������������������
Page M
ill R
d
STANFORD
GOLF COURSE
WEBB RANCH
(Stanford)
Sand H
ill
Rd
El Cam
ino
Real
FoothillExprw
y
Are
stra
dero
Rd
Baysh
ore
Bayshore
Freeway
Freeway
Rd
PA
LO
ALT
O
MU
NIC
IPA
L
GO
LF C
OU
RS
E
Charlest
on
Rd
Rd
San A
nto
nio
Rd
SearsvilleLake
Junipero
Serra
Freeway
San
d H
ill
Rd
Mt
Ho
me
Rd
Alp
ine R
d
JuniperoSerra
Blvd
Santa
C
ruz
A
ve
Alp
ine
Rd
San Francisquito
Creek
Los
Tran
cos
Cr
Mars
h R
d
Ath
ert
on A
ve
Alameda de las
Woo
dsi
de
Rd
Whiskey
Hill
Rd
Sta
nfo
rd
Ave
Jeffers
on
Ave
Bay
Bay
Rd
Rd
Whip
ple
Ave
El
Cam
ino
Road
Far m
Hill
Blv
Cr
Redwoo
d
Cre
ek
Arr
oyo
Ojode
Agua
Un
ivers
ity
Ave
Matadero
Cre
ek
Dee
rC
r
Barr
on
Real
Ath
erto
n
Cha
nnel Rd
Rd
Cordi
llera
s
37°30'
T 5 S
T 6 S
37°27'30"
37°25'
0
0
1
1
2
2
3 Miles
3 Kilometers
Ravenswood Point
Creek
Pulgas
Ado
be
Cre
ek
New
ell
HETCH HETCHY
HETCH
HETC
HY
AQUEDU
CT
AQUEDUCT
�
�
�
�
�
�
�
�
�
�
�
�
� �� �
�
�
1
2
3
4
11164500
11164500
LT
4
5
7 8 910
6
1112
LL
LL
ADO
Sand Point
Rd
Dum
barto
n B
ridge
Will
ow
Willo
w R
d
Rin
gw
oo
d A
ve
Middlefield Road
Univ
ersi
ty
AveRavensw
ood
City Hall
City Hall
City Hall
Stanford University
SALT EVAPORATORSSALT EVAPORATORS
SALT EVAPORATORS
SALT EVAPORATORS
SALT
EVAPORATORS
Redwood City
Atherton
Menlo Park
Palo Alto
East Palo Alto
San Francisco Bay
Bayfront
Expwy
Ave
Hamilton
Chilco St
82
122°15' 122°12'30" 122°10' 122°07'30"R 3 WR 3 WR 4 W R 2 W
Base from U.S. Geological Survey1:24,000 Palo Alto, 1991
27G1
27R3
35D3
34H1
3M2
3M10
36D1
35G1036D1
36F2
36L10
1B2
2H101G1
11B10
3M2
3M10
25F125G1
Temporary streamflow-measurement station and station identifier
Well and number—Abbreviated number does not include township and range designations (see "well-numbering system")
Miscellaneous water-chemistry samping site and site identifier
EXPLANATION
Contact between partly consolidated and consolidated bedrock assemblages (hachured side) and unconsolidated alluvium—Modified from Fio and Leighton (1995)
3
Shallow aquifer
Deep aquifer–upper zone
Deep aquifer–lower zone
84San
Fra
ncisq
uito
Creek
27K2
San MateoDr
Woodl
and Ave
E. Bayshore Rd
E. Bayshore Rd
Pier St
280
101
Stream-gaging station and identifier (11164500) and temporary site identifier (3)—Site 3 is a temporary streamflow measurement station adjacent to permanent stream-gaging station
Characterization of Surface-Water and Ground-Water Quality 27
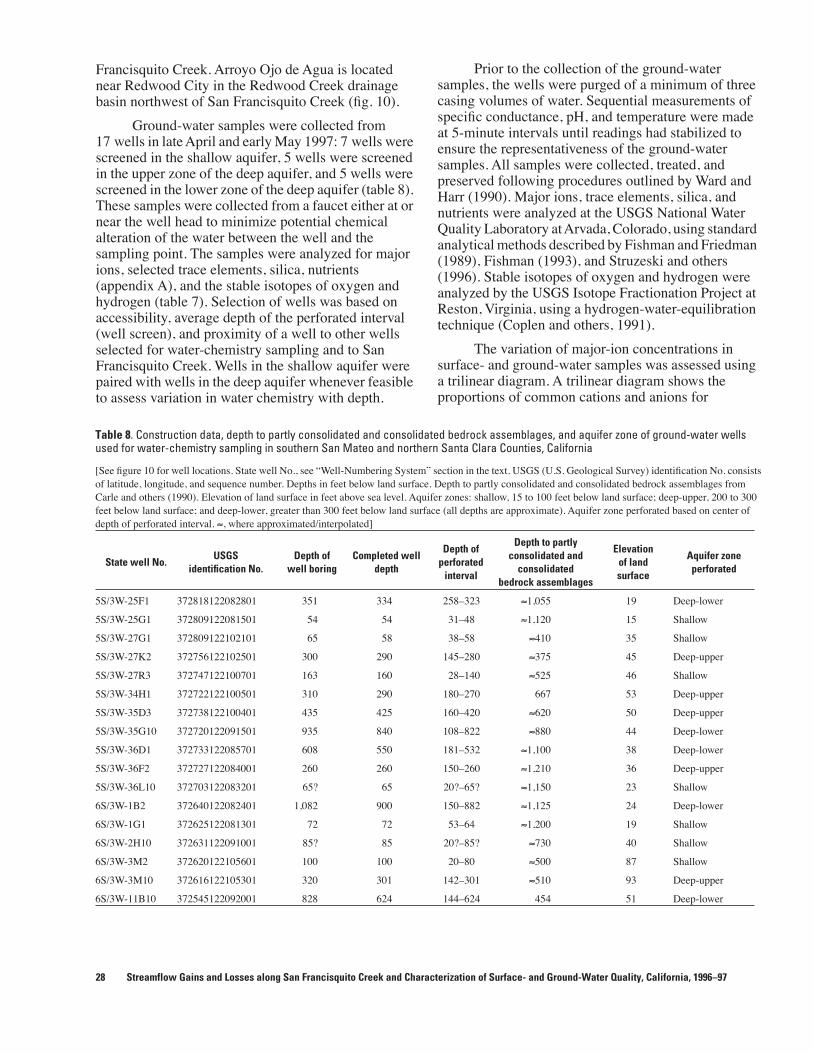
Francisquito Creek. Arroyo Ojo de Agua is located near Redwood City in the Redwood Creek drainage basin northwest of San Francisquito Creek (fig. 10).
Ground-water samples were collected from 17 wells in late April and early May 1997: 7 wells were screened in the shallow aquifer, 5 wells were screened in the upper zone of the deep aquifer, and 5 wells were screened in the lower zone of the deep aquifer (table 8). These samples were collected from a faucet either at or near the well head to minimize potential chemical alteration of the water between the well and the sampling point. The samples were analyzed for major ions, selected trace elements, silica, nutrients (appendix A), and the stable isotopes of oxygen and hydrogen (table 7). Selection of wells was based on accessibility, average depth of the perforated interval (well screen), and proximity of a well to other wells selected for water-chemistry sampling and to San Francisquito Creek. Wells in the shallow aquifer were paired with wells in the deep aquifer whenever feasible to assess variation in water chemistry with depth.
28 Streamflow Gains and Losses along San Francisquito Creek and Chara
Prior to the collection of the ground-water samples, the wells were purged of a minimum of three casing volumes of water. Sequential measurements of specific conductance, pH, and temperature were made at 5-minute intervals until readings had stabilized to ensure the representativeness of the ground-water samples. All samples were collected, treated, and preserved following procedures outlined by Ward and Harr (1990). Major ions, trace elements, silica, and nutrients were analyzed at the USGS National Water Quality Laboratory at Arvada, Colorado, using standard analytical methods described by Fishman and Friedman (1989), Fishman (1993), and Struzeski and others (1996). Stable isotopes of oxygen and hydrogen were analyzed by the USGS Isotope Fractionation Project at Reston, Virginia, using a hydrogen-water-equilibration technique (Coplen and others, 1991).
The variation of major-ion concentrations in surface- and ground-water samples was assessed using a trilinear diagram. A trilinear diagram shows the proportions of common cations and anions for
Table 8. Construction data, depth to partly consolidated and consolidated bedrock assemblages, and aquifer zone of ground-water wells used for water-chemistry sampling in southern San Mateo and northern Santa Clara Counties, California
[See figure 10 for well locations. State well No., see “Well-Numbering System” section in the text. USGS (U.S. Geological Survey) identification No. consists of latitude, longitude, and sequence number. Depths in feet below land surface. Depth to partly consolidated and consolidated bedrock assemblages from Carle and others (1990). Elevation of land surface in feet above sea level. Aquifer zones: shallow, 15 to 100 feet below land surface; deep-upper, 200 to 300 feet below land surface; and deep-lower, greater than 300 feet below land surface (all depths are approximate). Aquifer zone perforated based on center of depth of perforated interval. ≈, where approximated/interpolated]
State well No.USGS
identification No.Depth of
well boringCompleted well
depth
Depth ofperforated
interval
Depth to partlyconsolidated and
consolidatedbedrock assemblages
Elevationof landsurface
Aquifer zone perforated
5S/3W-25F1 372818122082801 351 334 258–323 ≈1,055 19 Deep-lower
5S/3W-25G1 372809122081501 54 54 31–48 ≈1,120 15 Shallow
5S/3W-27G1 372809122102101 65 58 38–58 ≈410 35 Shallow
5S/3W-27K2 372756122102501 300 290 145–280 ≈375 45 Deep-upper
5S/3W-27R3 372747122100701 163 160 28–140 ≈525 46 Shallow
5S/3W-34H1 372722122100501 310 290 180–270 667 53 Deep-upper
5S/3W-35D3 372738122100401 435 425 160–420 ≈620 50 Deep-upper
5S/3W-35G10 372720122091501 935 840 108–822 ≈880 44 Deep-lower
5S/3W-36D1 372733122085701 608 550 181–532 ≈1,100 38 Deep-lower
5S/3W-36F2 372727122084001 260 260 150–260 ≈1,210 36 Deep-upper
5S/3W-36L10 372703122083201 65? 65 20?–65? ≈1,150 23 Shallow
6S/3W-1B2 372640122082401 1,082 900 150–882 ≈1,125 24 Deep-lower
6S/3W-1G1 372625122081301 72 72 53–64 ≈1,200 19 Shallow
6S/3W-2H10 372631122091001 85? 85 20?–85? ≈730 40 Shallow
6S/3W-3M2 372620122105601 100 100 20–80 ≈500 87 Shallow
6S/3W-3M10 372616122105301 320 301 142–301 ≈510 93 Deep-upper
6S/3W-11B10 372545122092001 828 624 144–624 454 51 Deep-lower
cterization of Surface- and Ground-Water Quality, California, 1996–97
comparison and classification of water samples inde-pendent of total analyte concentrations (Hem, 1985). Water samples having the same composition, but dif-ferent total concentrations, will plot at the same loca-tion on a trilinear diagram. This diagram permits the compositions of many samples to be shown on the same graph enabling major groupings or trends to be discerned visually (Freeze and Cherry, 1979).
Selected trace-element data were evaluated to determine whether bay water is a contributing source of water to wells in the study area. Previous studies of coastal aquifer systems in California have used trace-element data to distinguish mixtures of native fresh water and seawater from mixtures of native fresh water and high chloride water from other sources such as brines from underlying or surrounding rocks, estuarine deposits, and surface contamination (Piper and others, 1953; Martin, 1984; and Izbicki, 1991). For this study, ratios of chloride to boron, bromide, and iodide, relative to the concentration of chloride, were plotted to show the relation between ground water and seawater. Ratios are presented on a millimole per millimole basis, rather than on a mass per mass basis, so that ratios calculated from different trace elements, each having different atomic masses, are comparable. Chloride and trace-element concentrations listed in appendix A were converted from mass per unit volume [milligrams per liter (mg/L)] to millimoles (mmol) per unit volume by dividing by the atomic weight of each constituent. For example, to convert the chloride concentration for seawater to millimoles, 19,000 mg/L (Hem, 1985) was divided by the atomic weight of chloride (35.4 milligrams (mg) in a millimole of Cl atoms) to get 536 millimoles per liter (mmol/L).
Major Ions
Surface Water
In general, the dissolved-solids concentration of San Francisquito Creek varies as a function of seasonal changes in hydrologic conditions. During periods of dry weather when streamflow is low, the dissolved solids tend to be high; during periods of wet weather, they tend to be low owing to dilution by surface runoff. This inverse relation between dissolved solids and streamflow can be illustrated by specific conductance. Specific conductance is the ability of water to conduct an electric current; it provides an indication of the dissolved-solids concentration of water—the higher the electric current, the greater the dissolved-solids concentration (Hem, 1985). Specific conductance measurements made at the streamflow stations along
San Francisquito Creek in 1996 and 1997 ranged between 870 and 1,270 microsiemens per centimeter (µS/cm) in the samples collected from sites upstream of site 6 during the low-flow seepage runs and between 730 and 801 µS/cm in all the samples collected during high-flow seepage runs (appendix A). Several samples collected during the low-flow seepage runs at sites 6 and 8 had lower specific conductance than the upstream samples. The lower specific conductance values of the samples collected from site 8 in June 1996 (770 µS/cm) and from sites 6 and 8 in April 1997 (580 and 754 µS/cm, respectively) indicate that during low-flow conditions water downstream from site 5 is not solely streamflow from the upper reaches of San Francisquito Creek. Urban runoff of imported water, the principal source of supply for residential irrigation and other domestic uses in the study area, is an additional source of streamflow downstream from site 5. Because imported water has a much lower dissolved-solids concentration [a specific conductance of 77 µS/cm in the sample collected from a residential tap in April 1997, and an average specific conductance of 124 µS/cm reported for treated imported water in 1997 (San Francisco Public Utilities Commission, electronic data, accessed 2001)] than water from San Francisquito Creek, mixing of these two waters lowers the dissolved-solids concentration of San Francisquito Creek downstream from site 5 during low-flow conditions.
Major-ion concentrations were analyzed in samples collected at sites 3, 5, 6, and 8 along San Francisquito Creek during April 1997 (appendix A). The concentrations in these samples, however, may not be representative of average conditions because the samples were collected during a period of dry weather and low streamflow. Samples from Lake Lagunita and from a residential tap (imported water) also were analyzed (appendix A). These samples have a mixed chemical composition and plot in the same general area on the trilinear diagram (fig. 11). In general, calcium and magnesium are the predominate cations, and carbonate and bicarbonate are the predominate anions in the surface-water samples (fig. 11). The proportions of cations and anions in these samples reflect the original composition of the source water and changes in its composition owing to contact and residence time with various geologic materials, biological processes, and mixing with water from local and imported sources.
These chemical analyses provide additional evidence that the samples collected from sites 6 and 8 during the low-flow conditions of April 1997 were diluted by urban runoff. Concentrations of magnesium, sodium, sulfate, chloride, boron, and total dissolved solids were lower in samples from sites 6 and 8 than in samples from upstream sites 3 and 5 (appendix A).
Characterization of Surface-Water and Ground-Water Quality 29
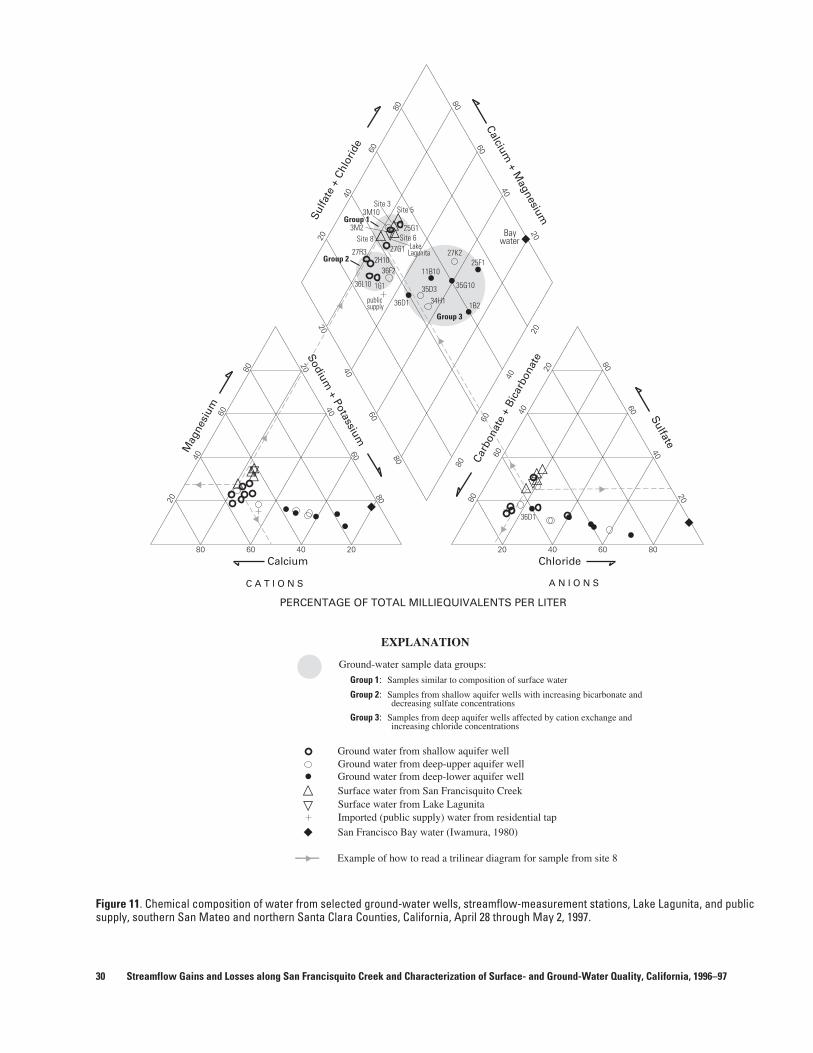
Figure 11. Chemical composition of water from selected ground-water wells, streamflow-measurement stations, Lake Lagunita, and public supply, southern San Mateo and northern Santa Clara Counties, California, April 28 through May 2, 1997.
Group 2
Group 3
Group 1
Ground water from deep-upper aquifer well Ground water from shallow aquifer well
Group 1: Samples similar to composition of surface water
Group 2: Samples from shallow aquifer wells with increasing bicarbonate and decreasing sulfate concentrations
Group 3: Samples from deep aquifer wells affected by cation exchange and increasing chloride concentrations
Ground-water sample data groups:
20
40
60
80
20
40
60
80
80
60
40
20
80
60
40
20
20
40
60
80
80
60
40
20
80
60
40
20
20
40
60
80
8060402020406080
Mag
nesi
um Sulfate
Sodium + Potassium
Carb
onat
e +
Bica
rbon
ate
Sulfa
te +
Chl
orid
e
Chloride Calcium
A N I O N SC A T I O N S
Ground water from deep-lower aquifer well Surface water from San Francisquito Creek
Imported (public supply) water from residential tap Surface water from Lake Lagunita
EXPLANATION
San Francisco Bay water (Iwamura, 1980)
Calcium + M
agnesium
36D1
36F2
1B2
25F127K2
35G10
11B10
35D3
36D1
1G136L10
2H1027R3 27G1
Site 8
Site 5
Site 6
Site 3
Example of how to read a trilinear diagram for sample from site 8
25G1
3M10
3M2
PERCENTAGE OF TOTAL MILLIEQUIVALENTS PER LITER
�
����
�
�����
�
�
�
�
��
Bay water
LakeLagunita
public supply
34H1
�
�
�
�
30 Streamflow Gains and Losses along San Francisquito Creek and Characterization of Surface- and Ground-Water Quality, California, 1996–97
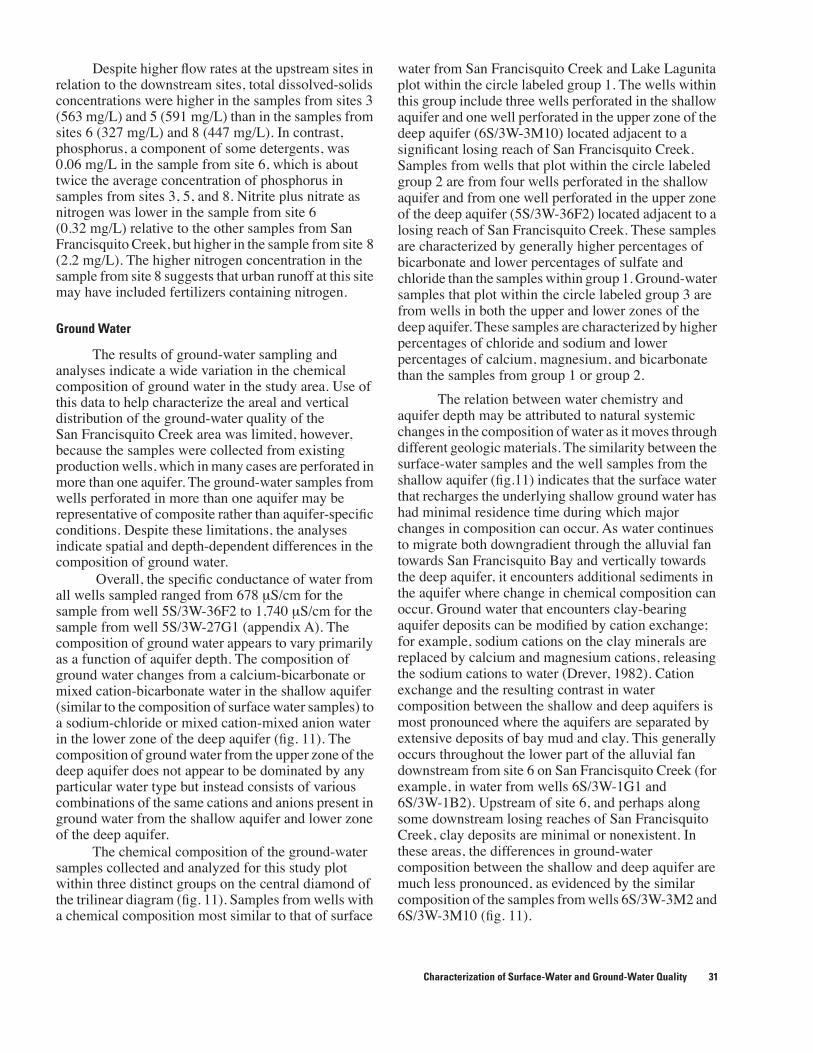
Despite higher flow rates at the upstream sites in relation to the downstream sites, total dissolved-solids concentrations were higher in the samples from sites 3 (563 mg/L) and 5 (591 mg/L) than in the samples from sites 6 (327 mg/L) and 8 (447 mg/L). In contrast, phosphorus, a component of some detergents, was 0.06 mg/L in the sample from site 6, which is about twice the average concentration of phosphorus in samples from sites 3, 5, and 8. Nitrite plus nitrate as nitrogen was lower in the sample from site 6 (0.32 mg/L) relative to the other samples from San Francisquito Creek, but higher in the sample from site 8 (2.2 mg/L). The higher nitrogen concentration in the sample from site 8 suggests that urban runoff at this site may have included fertilizers containing nitrogen.
Ground Water
The results of ground-water sampling and analyses indicate a wide variation in the chemical composition of ground water in the study area. Use of this data to help characterize the areal and vertical distribution of the ground-water quality of the San Francisquito Creek area was limited, however, because the samples were collected from existing production wells, which in many cases are perforated in more than one aquifer. The ground-water samples from wells perforated in more than one aquifer may be representative of composite rather than aquifer-specific conditions. Despite these limitations, the analyses indicate spatial and depth-dependent differences in the composition of ground water.
Overall, the specific conductance of water from all wells sampled ranged from 678 µS/cm for the sample from well 5S/3W-36F2 to 1,740 µS/cm for the sample from well 5S/3W-27G1 (appendix A). The composition of ground water appears to vary primarily as a function of aquifer depth. The composition of ground water changes from a calcium-bicarbonate or mixed cation-bicarbonate water in the shallow aquifer (similar to the composition of surface water samples) to a sodium-chloride or mixed cation-mixed anion water in the lower zone of the deep aquifer (fig. 11). The composition of ground water from the upper zone of the deep aquifer does not appear to be dominated by any particular water type but instead consists of various combinations of the same cations and anions present in ground water from the shallow aquifer and lower zone of the deep aquifer.
The chemical composition of the ground-water samples collected and analyzed for this study plot within three distinct groups on the central diamond of the trilinear diagram (fig. 11). Samples from wells with a chemical composition most similar to that of surface
water from San Francisquito Creek and Lake Lagunita plot within the circle labeled group 1. The wells within this group include three wells perforated in the shallow aquifer and one well perforated in the upper zone of the deep aquifer (6S/3W-3M10) located adjacent to a significant losing reach of San Francisquito Creek. Samples from wells that plot within the circle labeled group 2 are from four wells perforated in the shallow aquifer and from one well perforated in the upper zone of the deep aquifer (5S/3W-36F2) located adjacent to a losing reach of San Francisquito Creek. These samples are characterized by generally higher percentages of bicarbonate and lower percentages of sulfate and chloride than the samples within group 1. Ground-water samples that plot within the circle labeled group 3 are from wells in both the upper and lower zones of the deep aquifer. These samples are characterized by higher percentages of chloride and sodium and lower percentages of calcium, magnesium, and bicarbonate than the samples from group 1 or group 2.
The relation between water chemistry and aquifer depth may be attributed to natural systemic changes in the composition of water as it moves through different geologic materials. The similarity between the surface-water samples and the well samples from the shallow aquifer (fig.11) indicates that the surface water that recharges the underlying shallow ground water has had minimal residence time during which major changes in composition can occur. As water continues to migrate both downgradient through the alluvial fan towards San Francisquito Bay and vertically towards the deep aquifer, it encounters additional sediments in the aquifer where change in chemical composition can occur. Ground water that encounters clay-bearing aquifer deposits can be modified by cation exchange; for example, sodium cations on the clay minerals are replaced by calcium and magnesium cations, releasing the sodium cations to water (Drever, 1982). Cation exchange and the resulting contrast in water composition between the shallow and deep aquifers is most pronounced where the aquifers are separated by extensive deposits of bay mud and clay. This generally occurs throughout the lower part of the alluvial fan downstream from site 6 on San Francisquito Creek (for example, in water from wells 6S/3W-1G1 and 6S/3W-1B2). Upstream of site 6, and perhaps along some downstream losing reaches of San Francisquito Creek, clay deposits are minimal or nonexistent. In these areas, the differences in ground-water composition between the shallow and deep aquifer are much less pronounced, as evidenced by the similar composition of the samples from wells 6S/3W-3M2 and 6S/3W-3M10 (fig. 11).
Characterization of Surface-Water and Ground-Water Quality 31
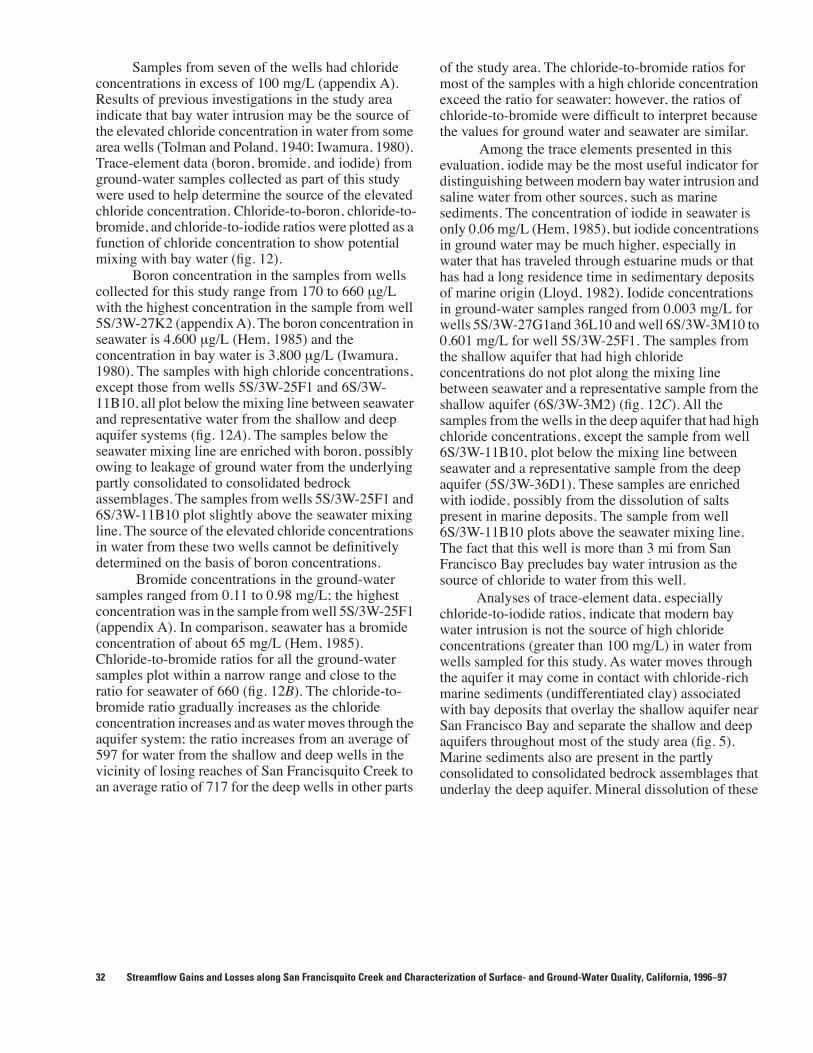
Samples from seven of the wells had chloride concentrations in excess of 100 mg/L (appendix A). Results of previous investigations in the study area indicate that bay water intrusion may be the source of the elevated chloride concentration in water from some area wells (Tolman and Poland, 1940; Iwamura, 1980). Trace-element data (boron, bromide, and iodide) from ground-water samples collected as part of this study were used to help determine the source of the elevated chloride concentration. Chloride-to-boron, chloride-to-bromide, and chloride-to-iodide ratios were plotted as a function of chloride concentration to show potential mixing with bay water (fig. 12).
Boron concentration in the samples from wells collected for this study range from 170 to 660 µg/L with the highest concentration in the sample from well 5S/3W-27K2 (appendix A). The boron concentration in seawater is 4,600 µg/L (Hem, 1985) and the concentration in bay water is 3,800 µg/L (Iwamura, 1980). The samples with high chloride concentrations, except those from wells 5S/3W-25F1 and 6S/3W-11B10, all plot below the mixing line between seawater and representative water from the shallow and deep aquifer systems (fig. 12A). The samples below the seawater mixing line are enriched with boron, possibly owing to leakage of ground water from the underlying partly consolidated to consolidated bedrock assemblages. The samples from wells 5S/3W-25F1 and 6S/3W-11B10 plot slightly above the seawater mixing line. The source of the elevated chloride concentrations in water from these two wells cannot be definitively determined on the basis of boron concentrations.
Bromide concentrations in the ground-water samples ranged from 0.11 to 0.98 mg/L; the highest concentration was in the sample from well 5S/3W-25F1 (appendix A). In comparison, seawater has a bromide concentration of about 65 mg/L (Hem, 1985). Chloride-to-bromide ratios for all the ground-water samples plot within a narrow range and close to the ratio for seawater of 660 (fig. 12B). The chloride-to-bromide ratio gradually increases as the chloride concentration increases and as water moves through the aquifer system; the ratio increases from an average of 597 for water from the shallow and deep wells in the vicinity of losing reaches of San Francisquito Creek to an average ratio of 717 for the deep wells in other parts
32 Streamflow Gains and Losses along San Francisquito Creek and Chara
of the study area. The chloride-to-bromide ratios for most of the samples with a high chloride concentration exceed the ratio for seawater; however, the ratios of chloride-to-bromide were difficult to interpret because the values for ground water and seawater are similar.
Among the trace elements presented in this evaluation, iodide may be the most useful indicator for distinguishing between modern bay water intrusion and saline water from other sources, such as marine sediments. The concentration of iodide in seawater is only 0.06 mg/L (Hem, 1985), but iodide concentrations in ground water may be much higher, especially in water that has traveled through estuarine muds or that has had a long residence time in sedimentary deposits of marine origin (Lloyd, 1982). Iodide concentrations in ground-water samples ranged from 0.003 mg/L for wells 5S/3W-27G1and 36L10 and well 6S/3W-3M10 to 0.601 mg/L for well 5S/3W-25F1. The samples from the shallow aquifer that had high chloride concentrations do not plot along the mixing line between seawater and a representative sample from the shallow aquifer (6S/3W-3M2) (fig. 12C). All the samples from the wells in the deep aquifer that had high chloride concentrations, except the sample from well 6S/3W-11B10, plot below the mixing line between seawater and a representative sample from the deep aquifer (5S/3W-36D1). These samples are enriched with iodide, possibly from the dissolution of salts present in marine deposits. The sample from well 6S/3W-11B10 plots above the seawater mixing line. The fact that this well is more than 3 mi from San Francisco Bay precludes bay water intrusion as the source of chloride to water from this well.
Analyses of trace-element data, especially chloride-to-iodide ratios, indicate that modern bay water intrusion is not the source of high chloride concentrations (greater than 100 mg/L) in water from wells sampled for this study. As water moves through the aquifer it may come in contact with chloride-rich marine sediments (undifferentiated clay) associated with bay deposits that overlay the shallow aquifer near San Francisco Bay and separate the shallow and deep aquifers throughout most of the study area (fig. 5). Marine sediments also are present in the partly consolidated to consolidated bedrock assemblages that underlay the deep aquifer. Mineral dissolution of these
cterization of Surface- and Ground-Water Quality, California, 1996–97
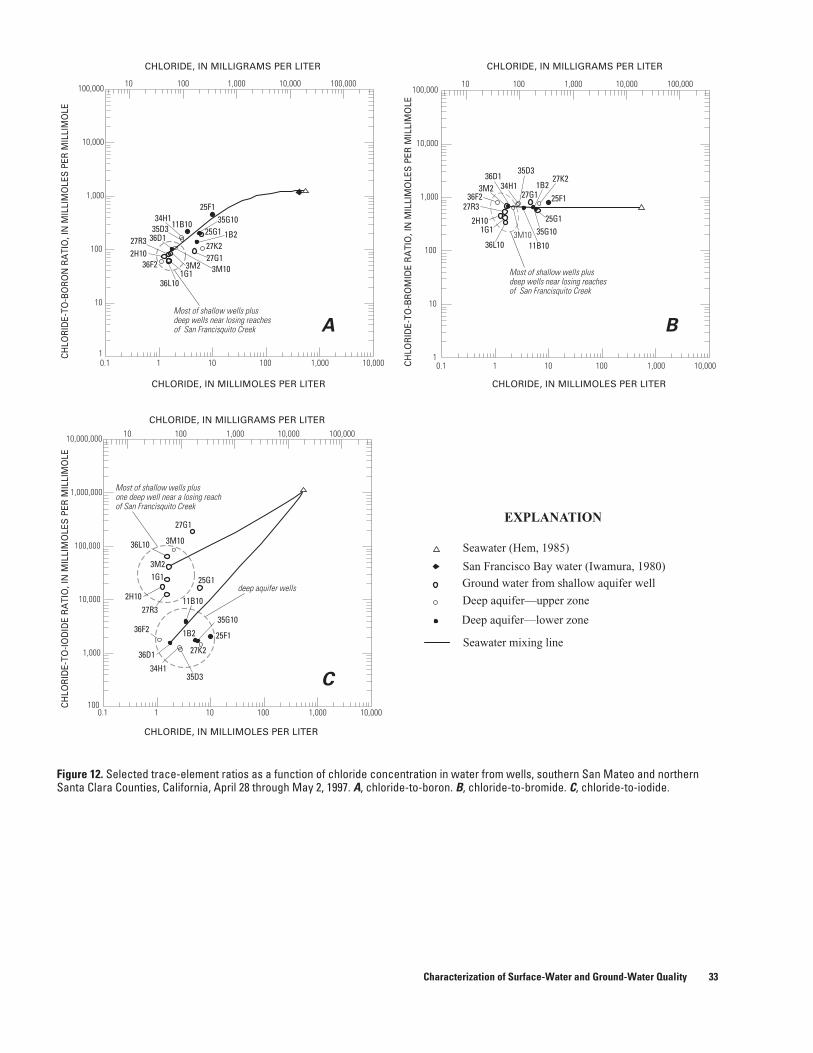
Figure 12. Selected trace-element ratios as a function of chloride concentration in water from wells, southern San Mateo and northern Santa Clara Counties, California, April 28 through May 2, 1997. A, chloride-to-boron. B, chloride-to-bromide. C, chloride-to-iodide.
0.1 1 10 100 1,000 10,0001
10
100
1,000
10,000
100,000 10 100 1,000 10,000 100,000
Seawater (Hem, 1985)
Ground water from shallow aquifer well
Deep aquifer—upper zone
Deep aquifer—lower zone
San Francisco Bay water (Iwamura, 1980)
25F1
25G1
27G127K227R3
34H135D3
35G10
36D1
36F21G1
1B2
36L10
2H103M2 3M10
11B10
0.1 1 10 100 1,000 10,000100
1,000
10,000
100,000
1,000,000
10,000,000 10 100 1,000 10,000 100,000
25F1
25G1
27G1
27K2
27R3
34H135D3
35G10
36D1
36F2
1G1
1B2
36L10
2H10
3M2
3M10
11B10
0.1 1 10 100 1,000 10,0001
10
100
1,000
10,000
100,00010 100 1,000 10,000 100,000
25F1
25G1
27G1
27K2
27R3
34H1
35D3
35G10
36D1
36F2
1G1
1B2
36L10
2H10
3M2
3M1011B10
CH
LOR
IDE-
TO-IO
DID
E R
ATI
O, I
N M
ILLI
MO
LES
PER
MIL
LIM
OLE
CH
LOR
IDE-
TO-B
RO
MID
E R
ATI
O, I
N M
ILLI
MO
LES
PER
MIL
LIM
OLE
CH
LOR
IDE-
TO-B
OR
ON
RA
TIO
, IN
MIL
LIM
OLE
S P
ER M
ILLI
MO
LE
CHLORIDE, IN MILLIMOLES PER LITER
CHLORIDE, IN MILLIMOLES PER LITER CHLORIDE, IN MILLIMOLES PER LITER
CHLORIDE, IN MILLIGRAMS PER LITER
CHLORIDE, IN MILLIGRAMS PER LITER CHLORIDE, IN MILLIGRAMS PER LITER
EXPLANATION
deep aquifer wells
Most of shallow wells plusone deep well near a losing reachof San Francisquito Creek
Most of shallow wells plusdeep wells near losing reachesof San Francisquito Creek
Most of shallow wells plusdeep wells near losing reachesof San Francisquito Creek
C
A B
Seawater mixing line
Characterization of Surface-Water and Ground-Water Quality 33
marine sediments is probably the source of the high chloride concentration in water from wells sampled for this study.
Oxygen-18 and Deuterium
Oxygen-18 (18O) and deuterium (2H) are naturally occurring stable isotopes of oxygen and hydrogen. The abundance of oxygen-18 and deuterium relative to lighter oxygen-16 (16O) and hydrogen (1H) atoms can be used to help infer the source and the evaporative history of water. Oxygen-18 and deuterium abundances are expressed in delta notation (δ) as per mil [parts per thousand (‰)] differences in the ratios of 18O/16O and 2H/1H in samples relative to a standard known as Vienna Standard Mean Ocean Water (VSMOW) (Gat and Gonfiantini, 1981):
and
Because the source of much of the world’s precipitation is derived from the evaporation of seawater, the δ18O and δD composition of precipitation throughout the world cluster along a line known as the global meteoric water line (Craig, 1961)
δD = 8δ18O + 10.
Water that has not undergone evaporation will plot near the global meteoric water line, whereas water that has undergone evaporation will plot to the right of the global meteoric water line towards less negative δ18O and δD.
The δ18O and δD values in water sampled from selected sites on San Francisquito Creek and Lake Lagunita and from public supply and selected production wells ranged from −3.7 to −13.02 per mil and −29.1 to −96 per mil, respectively (table 7). Except for one sample collected from San Francisquito Creek at site 6, these values plot below, but parallel to, the
δ O18
O18
O16⁄
sample
O18
O16⁄
VSMOW
----------------------------------------------------- 1– 1 000,×=
δDH
2H
1⁄
sample
H2
H1⁄
VSMOW
---------------------------------------------------- 1– 1 000.,×=
34 Streamflow Gains and Losses along San Francisquito Creek and Chara
global meteoric water line along a line known as the local meteoric water line (fig. 13A). Evaporated waters plot farther to the right along a line referred to as the evaporative trend line (Gat and Gonfiantini, 1981); the sample from Lake Lagunita is partly evaporated and, thus, has the isotopically heaviest (least negative) water (δ18O and δD values of −3.7 and −29.1 per mil, respectively). Public supply water, which consists of surface water imported from the Hetch Hetchy Reservoir in the Sierra Nevada, was the isotopically lightest (most negative) water sampled (δ18O and δD values of −13.02 and −96, respectively). The water imported from the Sierra Nevada is isotopically distinct from other waters in the study area because, as storms move inland from coastal areas, the concentration of heavier isotopes relative to lighter isotopes decreases as water molecules repeatedly undergo evaporation and condensation. Additionally, precipitation that condenses at higher altitudes and at cooler temperatures tends to be isotopically lighter than precipitation that forms at lower altitudes and warmer temperatures (Muir and Coplen, 1981). The latitude at which a storm originates can also affect the isotopic composition of precipitation (Gat and Gonfiantini, 1981); storms that originate over the cold waters of the Gulf of Alaska have a lighter isotopic composition than storms that originate over warm tropical waters in the vicinity of Hawaii.
The δ18O and δD composition of the stream-water samples from San Francisquito Creek and Arroyo Ojo de Agua (ADO) ranged from −4.88 to −6.74 per mil for δ18O and from −31.6 to −50.3 per mil for δD (fig. 13B, table 7). With the exception of the samples from San Francisquito Creek at sites 6 and 8, the stream samples collected during low flow are isotopically heavier (less negative) than the stream samples collected during intermediate flow. Although the samples were not collected during high-flow conditions, the relation between the low-flow and the intermediate-flow samples suggests that the isotopic composition of high-flow waters would be lighter (more negative) because of generally cooler temperatures and less evaporation during the winter and spring when streamflow is highest.
The relatively light (δ18O and δD values less than −6.4 and −43 per mil, respectively) isotopic composition of samples from sites 6 and 8 on San Francisquito Creek (collected during the low-flow seepage runs of April 30, 1997, and June 12, 1996, respectively) and from the ADO site on Arroyo Ojo de Agua (collected on April 30, 1996, a day after the intermediate-flow seepage run) may represent mixing of natural runoff and imported water. These isotopic data and the results of the chemical analysis for sites 6
cterization of Surface- and Ground-Water Quality, California, 1996–97
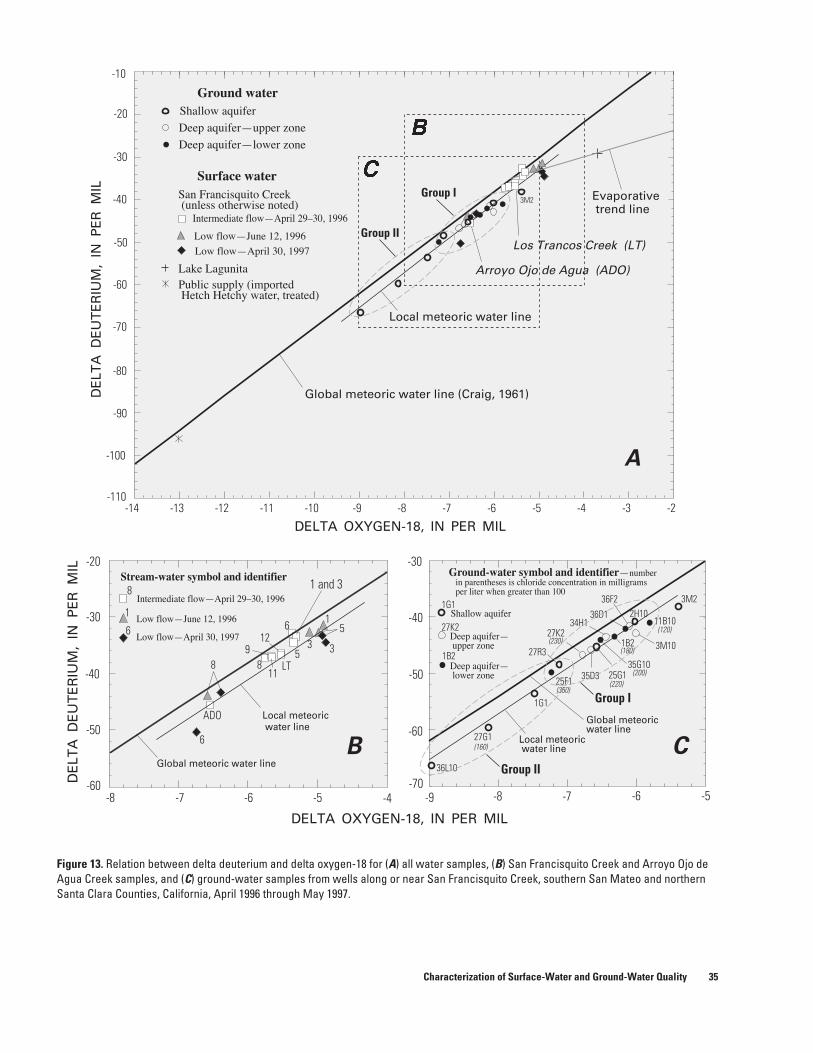
Figure 13. Relation between delta deuterium and delta oxygen-18 for (A) all water samples, (B) San Francisquito Creek and Arroyo Ojo de Agua Creek samples, and (C) ground-water samples from wells along or near San Francisquito Creek, southern San Mateo and northern Santa Clara Counties, California, April 1996 through May 1997.
-110
-100
-90
-80
-70
-60
-50
-40
-30
-20
-10
-14 -13 -12 -11 -10 -9 -8 -7 -6 -5 -4 -3 -2
Evaporative trend line
Deep aquifer—lower zone
Ground water
Surface water
Deep aquifer—upper zone
Shallow aquifer
San Francisquito Creek (unless otherwise noted)
Lake LagunitaPublic supply (imported Hetch Hetchy water, treated)
A
�
B
�
C
DE
LTA
DE
UT
ER
IUM
, IN
PE
R M
IL
DE
LTA
DE
UT
ER
IUM
, IN
PE
R M
IL
DELTA OXYGEN-18, IN PER MIL
DELTA OXYGEN-18, IN PER MIL
Arroyo Ojo de Agua (ADO)
Local meteoric water line
Global meteoric water line (Craig, 1961)
Global meteoric water line
Ground-water symbol and identifier—number in parentheses is chloride concentration in milligrams per liter when greater than 100
Local meteoric water line
Global meteoricwater line
-70
-60
-50
-40
-30
-9 -8 -7 -6 -5-60
-50
-40
-30
-20
-8 -7 -6 -5 -4
Intermediate flow—April 29–30, 1996
Intermediate flow—April 29–30, 1996
Low flow—June 12, 1996
Low flow—June 12, 1996
Low flow—April 30, 1997
Low flow—April 30, 1997
Stream-water symbol and identifier
6
6
8 8
8
ADO
912
11LT
6
1 and 3
11
35
3
36L10
27G1(160)
1G1
1G1
25F1
27K227K2
35D3 25G135G10
3M2
11B10
3M10
36F2
36D134H1
27R3
2H10
1B21B2
Los Trancos Creek (LT)
5
Local meteoric water line
Deep aquifer— lower zone
Deep aquifer— upper zone
Shallow aquifer
Group II
Group II
Group I
Group I3M2
(350)
(230)
(220)(200)
(180)
(120)
Characterization of Surface-Water and Ground-Water Quality 35
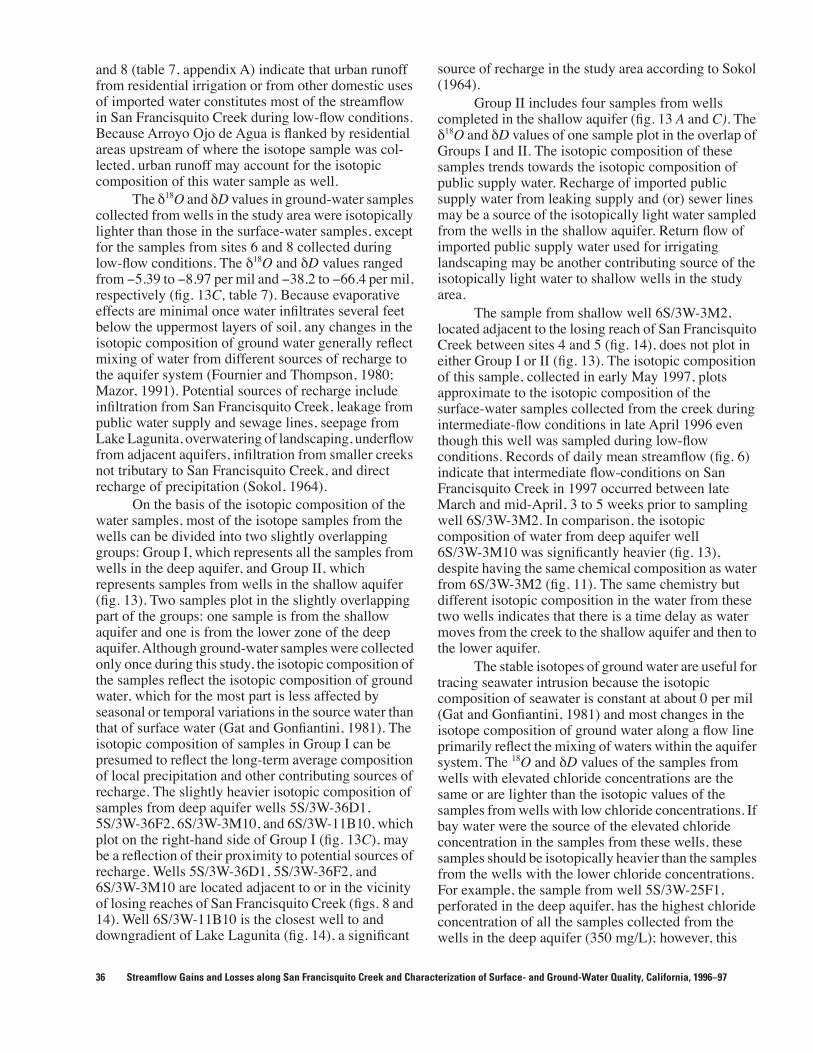
and 8 (table 7, appendix A) indicate that urban runoff from residential irrigation or from other domestic uses of imported water constitutes most of the streamflow in San Francisquito Creek during low-flow conditions. Because Arroyo Ojo de Agua is flanked by residential areas upstream of where the isotope sample was col-lected, urban runoff may account for the isotopic composition of this water sample as well.
The δ18O and δD values in ground-water samples collected from wells in the study area were isotopically lighter than those in the surface-water samples, except for the samples from sites 6 and 8 collected during low-flow conditions. The δ18O and δD values ranged from −5.39 to −8.97 per mil and −38.2 to −66.4 per mil, respectively (fig. 13C, table 7). Because evaporative effects are minimal once water infiltrates several feet below the uppermost layers of soil, any changes in the isotopic composition of ground water generally reflect mixing of water from different sources of recharge to the aquifer system (Fournier and Thompson, 1980; Mazor, 1991). Potential sources of recharge include infiltration from San Francisquito Creek, leakage from public water supply and sewage lines, seepage from Lake Lagunita, overwatering of landscaping, underflow from adjacent aquifers, infiltration from smaller creeks not tributary to San Francisquito Creek, and direct recharge of precipitation (Sokol, 1964).
On the basis of the isotopic composition of the water samples, most of the isotope samples from the wells can be divided into two slightly overlapping groups: Group I, which represents all the samples from wells in the deep aquifer, and Group II, which represents samples from wells in the shallow aquifer (fig. 13). Two samples plot in the slightly overlapping part of the groups: one sample is from the shallow aquifer and one is from the lower zone of the deep aquifer. Although ground-water samples were collected only once during this study, the isotopic composition of the samples reflect the isotopic composition of ground water, which for the most part is less affected by seasonal or temporal variations in the source water than that of surface water (Gat and Gonfiantini, 1981). The isotopic composition of samples in Group I can be presumed to reflect the long-term average composition of local precipitation and other contributing sources of recharge. The slightly heavier isotopic composition of samples from deep aquifer wells 5S/3W-36D1, 5S/3W-36F2, 6S/3W-3M10, and 6S/3W-11B10, which plot on the right-hand side of Group I (fig. 13C), may be a reflection of their proximity to potential sources of recharge. Wells 5S/3W-36D1, 5S/3W-36F2, and 6S/3W-3M10 are located adjacent to or in the vicinity of losing reaches of San Francisquito Creek (figs. 8 and 14). Well 6S/3W-11B10 is the closest well to and downgradient of Lake Lagunita (fig. 14), a significant
36 Streamflow Gains and Losses along San Francisquito Creek and Chara
source of recharge in the study area according to Sokol (1964).
Group II includes four samples from wells completed in the shallow aquifer (fig. 13 A and C). The δ18O and δD values of one sample plot in the overlap of Groups I and II. The isotopic composition of these samples trends towards the isotopic composition of public supply water. Recharge of imported public supply water from leaking supply and (or) sewer lines may be a source of the isotopically light water sampled from the wells in the shallow aquifer. Return flow of imported public supply water used for irrigating landscaping may be another contributing source of the isotopically light water to shallow wells in the study area.
The sample from shallow well 6S/3W-3M2, located adjacent to the losing reach of San Francisquito Creek between sites 4 and 5 (fig. 14), does not plot in either Group I or II (fig. 13). The isotopic composition of this sample, collected in early May 1997, plots approximate to the isotopic composition of the surface-water samples collected from the creek during intermediate-flow conditions in late April 1996 even though this well was sampled during low-flow conditions. Records of daily mean streamflow (fig. 6) indicate that intermediate flow-conditions on San Francisquito Creek in 1997 occurred between late March and mid-April, 3 to 5 weeks prior to sampling well 6S/3W-3M2. In comparison, the isotopic composition of water from deep aquifer well 6S/3W-3M10 was significantly heavier (fig. 13), despite having the same chemical composition as water from 6S/3W-3M2 (fig. 11). The same chemistry but different isotopic composition in the water from these two wells indicates that there is a time delay as water moves from the creek to the shallow aquifer and then to the lower aquifer.
The stable isotopes of ground water are useful for tracing seawater intrusion because the isotopic composition of seawater is constant at about 0 per mil (Gat and Gonfiantini, 1981) and most changes in the isotope composition of ground water along a flow line primarily reflect the mixing of waters within the aquifer system. The 18O and δD values of the samples from wells with elevated chloride concentrations are the same or are lighter than the isotopic values of the samples from wells with low chloride concentrations. If bay water were the source of the elevated chloride concentration in the samples from these wells, these samples should be isotopically heavier than the samples from the wells with the lower chloride concentrations. For example, the sample from well 5S/3W-25F1, perforated in the deep aquifer, has the highest chloride concentration of all the samples collected from the wells in the deep aquifer (350 mg/L); however, this
cterization of Surface- and Ground-Water Quality, California, 1996–97
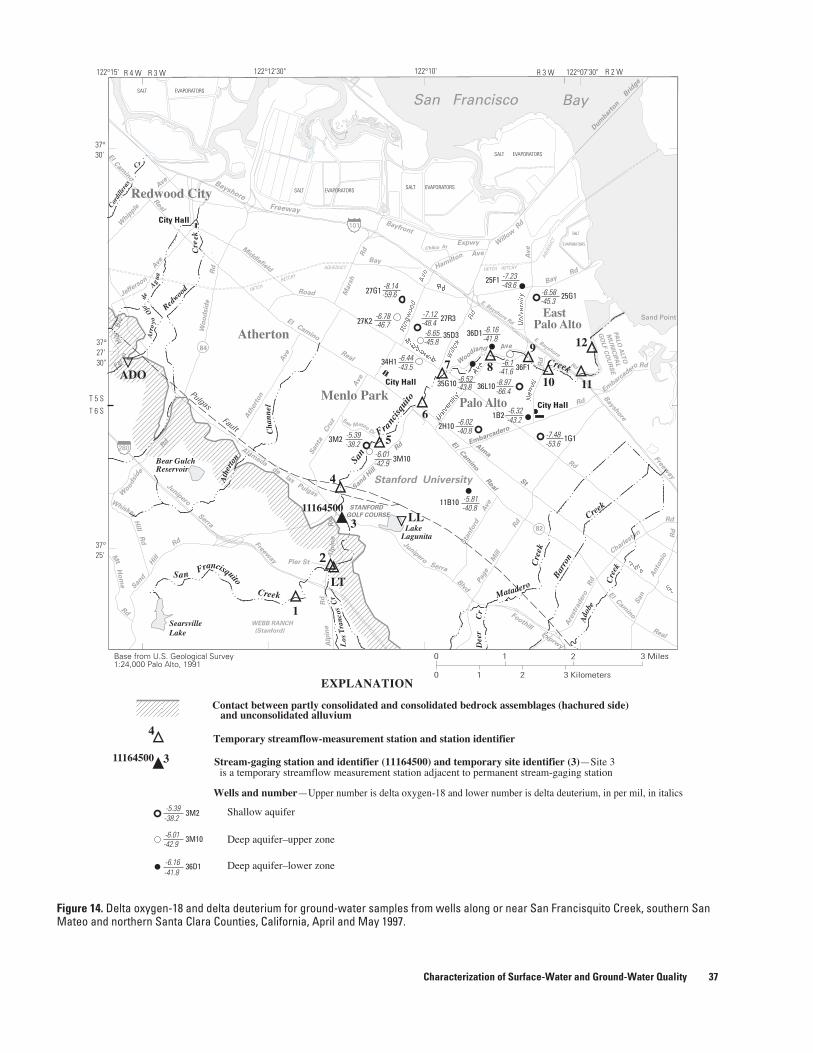
Figure 14. Delta oxygen-18 and delta deuterium for ground-water samples from wells along or near San Francisquito Creek, southern San Mateo and northern Santa Clara Counties, California, April and May 1997.
Wo
od
sid
e R
d
El Camino Real
El Cam
ino Real
Middlefield
Bear Gulch Reservoir
Embarcadero
Embarc
adero
Alma St
���������������������
Page M
ill R
d
WEBB RANCH
(Stanford)
El Cam
ino
Real
FoothillExprw
y
Are
stra
dero
Rd
Baysh
ore
Bayshore
Freeway
Freeway
Rd
PA
LO
ALT
O
MU
NIC
IPA
L
GO
LF C
OU
RS
E
Charlest
on
Rd
Rd
San A
nto
nio
Rd
SearsvilleLake
Junipero
Serra
Freeway
San
d H
ill
Rd
Mt
Ho
me
Rd
Alp
ine R
d
JuniperoSerra
Blvd
Santa
C
ruz
A
ve
Alp
ine
Rd
San Francisquito
Creek
Los
Tran
cos
Cr
Mars
h R
d
Ath
ert
on A
ve
Alameda de las W
oodsi
de
Rd
Whiskey
Hill
Rd
Sta
nfo
rd
Ave
Jeffers
on
Ave
Bay
Bay��Rd
Whip
ple
Ave
El
Cam
ino
Road
Far m
Hill
Blv
Cr
Arr
oyo
Ojode
Agua
�� �
����A
ve
Matadero
Cre
ek
Dee
rC
r
Barr
on
Real
Ath
erto
n
Cha
nnel
Rd
Rd
Cordi
llera
s
37°30'
T 5 S
T 6 S
37°27'30"
37°25'
0
0
1
1
2
2
3 Miles
3 Kilometers
Ravenswood Point
Creek
Pulgas
Ado
be
Cre
ek
� � ��
Lake Lagunita
STANFORD
GOLF COURSE
Sand H
ill
Rd
Contact between partly consolidated and consolidated bedrock assemblages (hachured side) and unconsolidated alluvium
Redwoo
d
Cre
ek
HETCH HETCHY
HETCH H
ETCHY
AQUE
DUCT
AQUEDUCT
�
�
�
�
�
�
�
�
� �� �
�
�
1
2
LT
4
5
7
10
6
11
12
LL
ADO
Sand Point
84
82
Rd
Dum
barto
n B
ridge
Will
ow
�������
������������
��
�����
���������
������
����� �� ������������������������
�� ���
�������������
�����
City Hall
City Hall
City Hall
Stanford University
SALT EVAPORATORSSALT EVAPORATORS
SALT EVAPORATORS
SALT EVAPORATORS
SALT
EVAPORATORS
Redwood City
Atherton
Menlo Park Palo Alto
East Palo Alto
San Francisco Bay
Bayfront
Expwy
Ave
Hamilton
Chilco St
-59.6
-46.7 -48.4
-45.8
-43.5
-38.2
-38.2
-42.9
-42.9
-40.8
-40.8
-53.6
-66.4
-45.3
-49.6
-43.8
-41.6
122°15' 122°12'30" 122°10' 122°07'30"R 3 WR 3 WR 4 W R 2 W
Base from U.S. Geological Survey1:24,000 Palo Alto, 1991
-8.14
-6.78 -7.12
-6.44
-5.39
-6.01
-6.16
-6.52
-6.16
-6.1
-6.32-6.02
-7.48
-5.81
-6.01
-7.23
-6.58
11B10
3M2
3M10
1G1
1B2
36L10
36F1
2H10
34H1
27K2 27R3
35D3 36D1
35G10
25F1
25G127G1
Wells and number—Upper number is delta oxygen-18 and lower number is delta deuterium, in per mil, in italics
EXPLANATION
3��
Shallow aquifer
Deep aquifer–upper zone
Deep aquifer–lower zone
9
8
11164500
San
Fra
ncisq
uito
Creek
-8.97
-6.65-41.8
-41.8
-43.2
Pulgas
Fault-5.39
280
101
3M2
3M10
36D1
Woodl
and Ave
E. Bayshore Rd
E. Bayshore Rd
San MateoDr
Pier St
�
�3
4
11164500
Temporary streamflow-measurement station and station identifier
Stream-gaging station and identifier (11164500) and temporary site identifier (3)—Site 3 is a temporary streamflow measurement station adjacent to permanent stream-gaging station
Characterization of Surface-Water and Ground-Water Quality 37
sample has the lightest isotopic composition of any well sampled in the deep aquifer (appendix A and table 7, respectively. The isotopic and trace-element data presented earlier indicate that bay water intrusion is not the source of the high chloride concentrations in samples from wells collected for this study.
SUMMARY AND CONCLUSIONS
San Francisquito Creek, located in southern San Mateo and northern Santa Clara Counties, is an important source of ground-water recharge to the aquifers of the San Francisquito Creek alluvial fan which, in turn, is a significant source of water to some communities in the study area. Local residents are concerned that infiltration, and consequently ground-water recharge, may be reduced if additional flood-control measures are implemented along San Francisquito Creek.
Streamflow measurements made in 1996 and 1997 at 13 temporary streamflow-measurement stations were used to estimate gains and losses along selected reaches of San Francisquito Creek. Streamflow measurements made during five seepage runs between April 1996 and May 1997 and historical streamflow records for USGS stream gage 11164500 for water years 1932–41 and 1951–99 were used to estimate recharge from San Francisquito Creek to the underlying aquifers of the San Francisquito Creek alluvial fan. Water samples were collected from 17 wells, 9 streamflow-measurement sites, and 3 miscellaneous surface-water sites for analysis of major ions, trace elements, silica, nutrients, and stable isotopes of oxygen (oxygen-18) and hydrogen (deuterium). Chemistry data were used to help characterize the quality of surface and ground water and to help assess the source of ground water to wells.
San Francisquito Creek and its tributaries drain a basin of approximately 45 square miles, including 37.4 square miles of hilly to mountainous terrain on the eastern slope of the Santa Cruz Mountains and approximately 7.5 square miles of gently sloping alluvial plain that includes parts of Menlo Park, Palo Alto, East Palo Alto, and Stanford University. Except where flood-control measures have been implemented along some lower reaches of San Francisquito Creek, the creek remains in a near-natural state along about half of its 12.7-mile length. Streamflow is almost entirely dependent on annual rainfall, which occurs primarily during November through April. As a consequence of this seasonal rainfall pattern and a water table that is below the channel bottom along most of San Francisquito Creek, natural flows downstream from the Pulgas Fault and streamflow-measurement
38 Streamflow Gains and Losses along San Francisquito Creek and Chara
site 4 usually are nonexistent for about 6 months of the year.
The San Francisquito Creek alluvial fan forms an arbitrarily defined ground-water subbasin of the Santa Clara Valley, which encompasses an area of approximately 22 square miles in southern San Mateo and northern Santa Clara Counties. The San Francisquito Creek alluvial fan consists of two identifiable aquifers: a shallow aquifer extending from near land surface to depths of about 15 to 100 feet below land surface, and a deep aquifer consisting of two water-bearing zones—an upper zone extending to depths between about 200 to 300 feet below land surface and a lower zone extending to depths greater than 300 feet. The shallow and deep aquifers are separated by a laterally extensive clay bed that may be continuous across much of the alluvial fan. In areas distant from the bay where this clay bed is discontinuous or absent, such as in areas upslope of the approximate midway point between San Mateo Drive and Alma Street (sites 5 and 6, respectively) on San Francisquito Creek, recharge from the shallow aquifer may have a direct hydrologic connection to the deep-aquifer zones.
Streamflow measurements made on San Francisquito and Los Trancos Creeks three times during low-flow conditions, once during intermediate-flow conditions, and once during high-flow conditions indicate that San Francisquito Creek generally is a losing stream. Streamflow measurements for the upstream reaches of San Francisquito Creek between Webb Ranch (site 1) and Sand Hill Road (site 4) showed relatively small changes compared with the streamflow measurements for the reaches downstream from site 4. Streamflow losses between site 1 and Pier Street (site 2) averaged 0.8 acre-feet per day (acre-ft/d). Streamflow losses between sites 2 and 4 were negligible for each of the two reaches, averaging only 0.1 acre-feet per day.
Streamflow measurements indicate that streamflow losses increase downstream from the Pulgas Fault at site 4. Streamflow losses between this site and San Mateo Drive (site 5) averaged 1.1 acre-ft/d. The greatest streamflow losses were measured along a 1.8-mile section of the creek between the San Mateo Drive bike bridge (site 5) and Middlefield Road (site 7). Losses between San Mateo Drive (site 5) and Alma Street (site 6) averaged 3.1 acre-ft/d for three seepage runs (April 29, 1996; February 25–27, 1997; and April 30, 1997) and losses between Alma Street and Middlefield Road (sites 6 and 7, respectively) averaged 2.5 acre-ft/d for two seepage runs (April 29, 1996, and February 25–27, 1997).
Downstream from Middlefield Road (site 7), streamflow gains and losses owing to seepage may be
cterization of Surface- and Ground-Water Quality, California, 1996–97
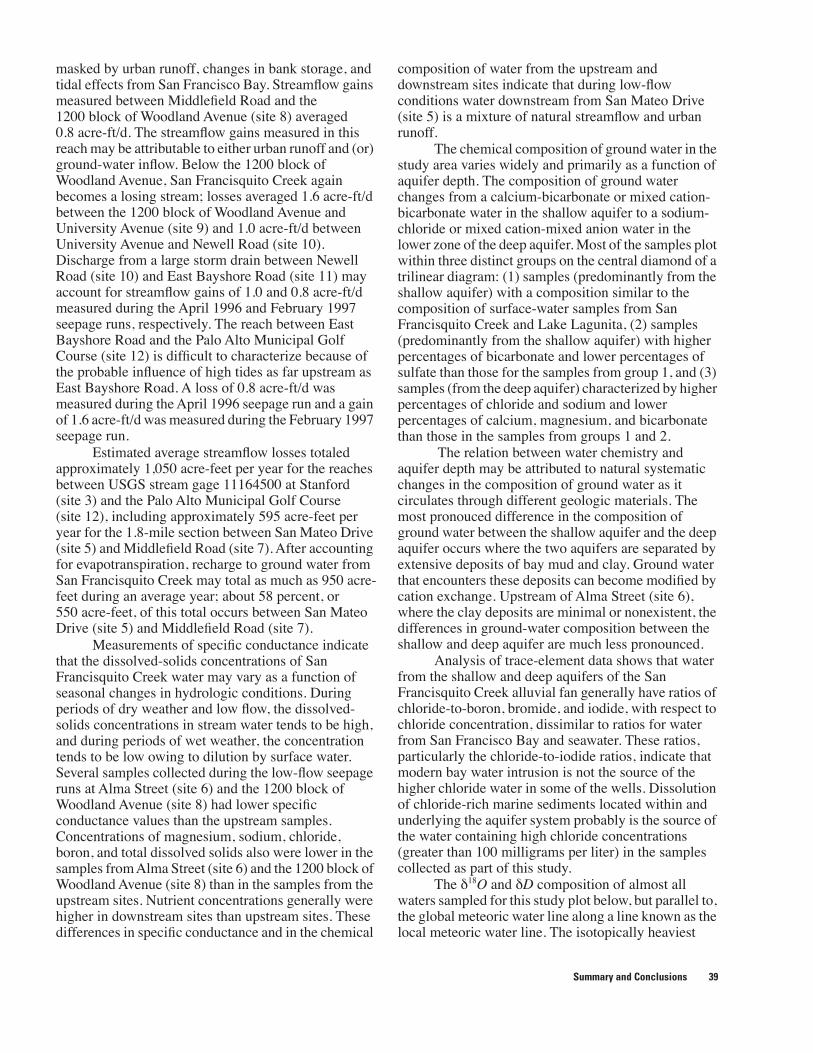
masked by urban runoff, changes in bank storage, and tidal effects from San Francisco Bay. Streamflow gains measured between Middlefield Road and the 1200 block of Woodland Avenue (site 8) averaged 0.8 acre-ft/d. The streamflow gains measured in this reach may be attributable to either urban runoff and (or) ground-water inflow. Below the 1200 block of Woodland Avenue, San Francisquito Creek again becomes a losing stream; losses averaged 1.6 acre-ft/d between the 1200 block of Woodland Avenue and University Avenue (site 9) and 1.0 acre-ft/d between University Avenue and Newell Road (site 10). Discharge from a large storm drain between Newell Road (site 10) and East Bayshore Road (site 11) may account for streamflow gains of 1.0 and 0.8 acre-ft/d measured during the April 1996 and February 1997 seepage runs, respectively. The reach between East Bayshore Road and the Palo Alto Municipal Golf Course (site 12) is difficult to characterize because of the probable influence of high tides as far upstream as East Bayshore Road. A loss of 0.8 acre-ft/d was measured during the April 1996 seepage run and a gain of 1.6 acre-ft/d was measured during the February 1997 seepage run.
Estimated average streamflow losses totaled approximately 1,050 acre-feet per year for the reaches between USGS stream gage 11164500 at Stanford (site 3) and the Palo Alto Municipal Golf Course (site 12), including approximately 595 acre-feet per year for the 1.8-mile section between San Mateo Drive (site 5) and Middlefield Road (site 7). After accounting for evapotranspiration, recharge to ground water from San Francisquito Creek may total as much as 950 acre-feet during an average year; about 58 percent, or 550 acre-feet, of this total occurs between San Mateo Drive (site 5) and Middlefield Road (site 7).
Measurements of specific conductance indicate that the dissolved-solids concentrations of San Francisquito Creek water may vary as a function of seasonal changes in hydrologic conditions. During periods of dry weather and low flow, the dissolved-solids concentrations in stream water tends to be high, and during periods of wet weather, the concentration tends to be low owing to dilution by surface water. Several samples collected during the low-flow seepage runs at Alma Street (site 6) and the 1200 block of Woodland Avenue (site 8) had lower specific conductance values than the upstream samples. Concentrations of magnesium, sodium, chloride, boron, and total dissolved solids also were lower in the samples from Alma Street (site 6) and the 1200 block of Woodland Avenue (site 8) than in the samples from the upstream sites. Nutrient concentrations generally were higher in downstream sites than upstream sites. These differences in specific conductance and in the chemical
composition of water from the upstream and downstream sites indicate that during low-flow conditions water downstream from San Mateo Drive (site 5) is a mixture of natural streamflow and urban runoff.
The chemical composition of ground water in the study area varies widely and primarily as a function of aquifer depth. The composition of ground water changes from a calcium-bicarbonate or mixed cation-bicarbonate water in the shallow aquifer to a sodium-chloride or mixed cation-mixed anion water in the lower zone of the deep aquifer. Most of the samples plot within three distinct groups on the central diamond of a trilinear diagram: (1) samples (predominantly from the shallow aquifer) with a composition similar to the composition of surface-water samples from San Francisquito Creek and Lake Lagunita, (2) samples (predominantly from the shallow aquifer) with higher percentages of bicarbonate and lower percentages of sulfate than those for the samples from group 1, and (3) samples (from the deep aquifer) characterized by higher percentages of chloride and sodium and lower percentages of calcium, magnesium, and bicarbonate than those in the samples from groups 1 and 2.
The relation between water chemistry and aquifer depth may be attributed to natural systematic changes in the composition of ground water as it circulates through different geologic materials. The most pronouced difference in the composition of ground water between the shallow aquifer and the deep aquifer occurs where the two aquifers are separated by extensive deposits of bay mud and clay. Ground water that encounters these deposits can become modified by cation exchange. Upstream of Alma Street (site 6), where the clay deposits are minimal or nonexistent, the differences in ground-water composition between the shallow and deep aquifer are much less pronounced.
Analysis of trace-element data shows that water from the shallow and deep aquifers of the San Francisquito Creek alluvial fan generally have ratios of chloride-to-boron, bromide, and iodide, with respect to chloride concentration, dissimilar to ratios for water from San Francisco Bay and seawater. These ratios, particularly the chloride-to-iodide ratios, indicate that modern bay water intrusion is not the source of the higher chloride water in some of the wells. Dissolution of chloride-rich marine sediments located within and underlying the aquifer system probably is the source of the water containing high chloride concentrations (greater than 100 milligrams per liter) in the samples collected as part of this study.
The δ18O and δD composition of almost all waters sampled for this study plot below, but parallel to, the global meteoric water line along a line known as the local meteoric water line. The isotopically heaviest
Summary and Conclusions 39
(least negative) water was from Lake Lagunita and plots to the right of the local meteoric water line because it is partly evaporated. The isotopically lightest (most negative) water was associated with public supply water imported to the study area from the Hetch Hetchy Reservoir in the Sierra Nevada. Except for the low-flow samples from Alma Street (site 6) and the 1200 block of Woodland Avenue (site 8), the stream samples were isotopically heavier than the ground-water samples. The fairly light isotopic composition of the samples from Alma Street (site 6) and the 1200 block of Woodland Avenue (site 8) on San Francisquito Creek and the water-chemistry data for these sites indicate that urban runoff from residential irrigation or from other domestic uses of imported water constitutes most of the streamflow during low-flow conditions.
The isotopic composition of most of the ground-water samples plot within two slightly overlapping groups on a plot of δ18O and δD. Group I represents all the samples from wells in the deep aquifer and several samples from wells in the shallow aquifer. The slightly heavier isotopic composition of four deep aquifer samples that plot on the right-hand side of this group may be a reflection of their proximity to potential sources of recharge. Three of these wells are located in the vicinity of losing reaches of San Francisquito Creek and the fourth is the closest well to and downgradient of Lake Lagunita, which reportedly is a significant source of recharge in the study area. Group II includes samples from wells completed in the shallow aquifer. The isotopic composition of these samples trends towards the isotopic composition of public supply water. Recharge of imported public supply water from leaking supply and (or) sewer lines may be the source of the isotopically light water sampled from these wells. Additional isotope samples need to be collected, particularly from San Francisquito Creek during high-flow streamflow conditions, to determine if the isotopic composition of the ground-water samples is within the expected range of natural recharge.
Analyses of the isotopic results of the ground-water samples collected as part of this study provide further evidence that the intrusion of bay water is not the source of water to the wells with high chloride concentrations sampled as part of this study. The isotopic composition of all the samples from the wells with high chloride concentrations was the same or lighter than the isotopic composition of the samples from the wells that have low chloride concentrations. If bay water was the source of the water with high chloride concentrations the iosotopic composition of the samples affected by bay water intrusion should be significantly heavier than samples of native ground water.
40 Streamflow Gains and Losses along San Francisquito Creek and Chara
REFERENCES CITED
Blaney, H.F., and Muckel, D.C., 1955, Evaporation and evapotranspiration investigations in the San Francisco Bay area: Eos, Transactions of the American Geophysical Union, v. 36, no. 5, p. 813–820.
Blodgett, J.C., Walters, J.R., and Borchers, J.W., 1992, Streamflow gains and losses and selected flow characteristics of Cottonwood Creek, north-central California, 1982–85: U.S. Geological Survey Water-Resources Investigations Report 92-4009, 19 p.
Borchers, J.W., 1996, Ground-water resources and water-supply alternatives in the Wawona area of Yosemite National Park, California: U.S. Geological Survey Water- Resources Investigations Report 95-4229, 77 p.
California Department of Water Resources, 1967, Evaluation of ground-water resources, south San Francisco Bay, appendix A: Geology: Bulletin 118-1, 153 p.
———1981, California rainfall summary, 1949–1980: 43 p., microfiche records.
Carle, S.F., Langenheim, V.E., Brabb, E.E., and Pampeyan, E.H., 1990, Geophysical interpretative map showing the bedrock surface underlying the flatland areas of Menlo Park, Atherton, and adjoining areas, California, in Oliver, H.W., ed., Preliminary ground-water-quality data and the extent of the ground water basin from drill-hole, seismic, and gravity data in the Palo Alto 7-1/2 minute Quadrangle, California: U.S. Geological Survey Open-File Report 90-74, pl. 3, scale 1:24,000.
Coplen, T.B., Wildman, J.D., and Chen, J., 1991, Improvements in the gaseous hydrogen-water equilibration technique for hydrogen isotope ratio analysis: Analytical Chemistry, v. 63, p. 910–912.
Craig, H., 1961, Isotopic variations in meteoric waters: Science, v. 133, p. 1702–1703.
Drever, J.I., 1982, The geochemistry of natural waters: Englewood Cliffs, New Jersey, Prentice-Hall, 388 p.
Fio, J.L., and Leighton, D.A., 1995, Geohydrologic framework, historical development of the ground-water system, and general hydrologic and water-quality conditions in 1990, south San Francisco Bay and peninsula area, California: U.S. Geological Survey Open-File Report 94-357, 46 p.
Fishman, M.J., 1993, Methods of analysis by the U.S. Geological Survey National Water Quality Laboratory—Methods for the determination of inorganic and organic constituents in water and fluvial sediments: U.S. Geological Survey Open-File Report 93-125, 217 p.
Fishman, M.J., and Friedman, L.C., eds., 1989, Methods for determination of inorganic substances in water and fluvial sediments: U.S. Geological Survey Techniques of Water-Resources Investigations, book 5, chap. A1, 545 p.
cterization of Surface- and Ground-Water Quality, California, 1996–97
Fournier, R.D., and Thompson, J.M., 1980, The recharge area for the Coso, California, Geothermal system deduced from δD and δ18O in thermal and nonthermal waters in the region: U.S. Geological Survey Open-File Report 80-454, 27 p.
Freeze, R.A., and Cherry, J.A., 1979, Groundwater: Englewood Cliffs, New Jersey, Prentice-Hall, 604 p.
Gat, J.R., and Gonfiantini, R., 1981, Stable isotope hydrology, deuterium and oxygen-18 in the water cycle: International Atomic Energy Agency, Technical Reports Series No. 210, 339 p.
Hem, J.D., 1985, Study and interpretation of the chemical characteristics of natural water: U.S. Geological Survey Water-Supply Paper 2254, 264 p., 3 plates.
Iwamura, T.I., 1980, Saltwater intrusion investigation in the Santa Clara County baylands area, California: Santa Clara Valley Water District, 115 p.
Izbicki, J.A., 1991, Chloride sources in a California coastal aquifer: American Society of Civil Engineers, Irrigation and Drainage Division Conference on Ground Water in the Pacific Rim Countries, Honolulu, Hawaii, July 23–25, Proceedings, p. 71–77.
Lloyd, J.W., Howard, K.W.F., Pacey, N.R., and Tellam, J.H., 1982, The value of iodide as a parameter in the chemical characterisation of groundwaters: Journal of Hydrology, vol. 57, p. 247–265.
Lull, H.W., 1964, Ecological and silviculture aspects, in Chow, V.T., ed., Handbook of applied hydrology: A compendium of water-resources technology: New York, McGraw–Hill, chap. 6, 30 p.
Martin, Peter, 1984, Ground-water monitoring at Santa Barbara, California: Phase 2--Effects of pumping on water levels and on water quality in the Santa Barbara ground-water basin: U.S. Geological Survey Water-Supply Paper 2197, 31 p.
Mazor, Emanuel, 1991, Applied chemical and isotopic groundwater hydrology: Buckingham, England, Open University Press, 274 p.
Metzger, L.F., and Fio, J.L., 1997, Ground-water development and the effects on ground-water levels and water quality in the town of Atherton, San Mateo County, California: U.S. Geological Survey Water-Resources Investigations 97-4033, 31 p.
Muir, K.S., and Coplen, T.B., 1981, Tracing ground-water movement by using the stable isotopes of oxygen and hydrogen, upper Penitencia Creek Alluvial Fan, Santa Clara Valley, California: U.S. Geological Survey Water-Supply Paper 2075, 18 p.
National Oceanic and Atmospheric Administration, 1999, National Climatic Data Center: Monthly precipitation data for U.S. cooperative and NWS sites, July 1999: accessed at http://www.ncdc.noaa.gov/pub/data/coop-precip/california.txt
Pampeyan, E.H., 1993, Geologic map of the Palo Alto and part of the Redwood Point 7-1/2 quadrangles, San Mateo and Santa Clara Counties: U.S. Geological Survey Miscellaneous Investigations Series Map I-2371.
Piper, A.M., Garrett, A.A., and others, 1953, Native and contaminated ground waters in the Long Beach-Santa Ana area, California: U.S. Geological Survey Water-Supply Paper 1136, 320 p.
Poland, J.F., and Ireland, R.L., 1988, Land subsidence in the Santa Clara Valley, California, as of 1982: U.S. Geological Survey Professional Paper 497-F, 61 p.
Rantz, S.E., 1971, Mean annual precipitation and precipitation depth-duration frequency data for the San Francisco Bay region, California: U.S. Geological Survey Open-File Report, 23 p.
Rantz, S.E., and others, 1982, Measurement and computation of streamflow: Volume 1. Measurement of stage and discharge: U.S. Geological Survey Water-Supply Paper 2175, 284 p.
Riggs, H.C., 1972, Low-flow investigations: U.S. Geological Survey Techniques of Water-Resources Investigations, book 4, chap. B1, 18 p.
San Francisco Public Utilities Commission, April 1998, Water Quality Report No. 5: San Francisco Public utilities Commission, electronic data, accessed 2001.
Sauer, V.B., and Meyer, R.B., 1992, Determination of error in individual discharge measurements: U.S. Geological Survey Open-File Report 92-144, 21 p.
Sokol, Daniel, 1964, The hydrogeology of the San Francisquito Creek Basin, San Mateo and Santa Clara Counties, California: Palo Alto, Calif., Stanford University, Ph. D. dissertation, 238 p.
Struzeski, T.M., DeGiacomo, W.J., and Zayhowski, E.J., 1996, Methods of analysis by the U.S. Geological Survey National Water Quality Laboratory-Determination of dissolved aluminum and boron in water by inductively coupled plasma-atomic emission spectrometry: U.S. Geological Survey Open-File Report 96-149, 17 p.
Tolman, C.F., and Poland, J.F., 1940, Ground-water, saltwater infiltration, and ground-surface recession in Santa Clara Valley, Santa Clara County, California: Eos, Transactions of 1940 of the American Geophysical Union, pt. 1, p. 23–35.
U.S. Army Corps of Engineers, 1972, Survey report on San Francisquito Creek, San Mateo and Santa Clara Counties, California, for flood control and allied purposes: San Francisco, Calif., U.S. Army Engineer District, 27 p., 7 plates.
Ward, J.R., and Harr, C.A., eds, 1990, Methods for collection and processing of surface-water and bed-material samples for physical and chemical analyses: U.S. Geological Survey Open-File Report 90-140, 71 p.
References Cited 41
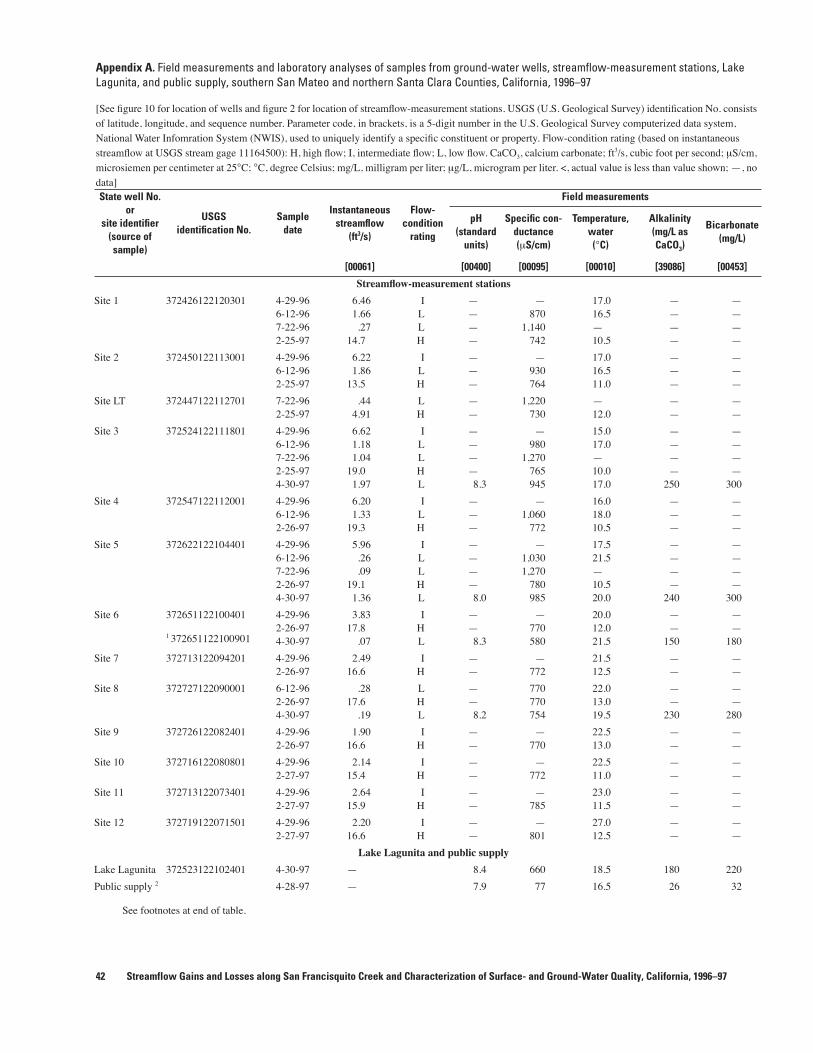
Appendix A. Field measurements and laboratory analyses of samples from ground-water wells, streamflow-measurement stations, Lake Lagunita, and public supply, southern San Mateo and northern Santa Clara Counties, California, 1996–97
[See figure 10 for location of wells and figure 2 for location of streamflow-measurement stations. USGS (U.S. Geological Survey) identification No. consists of latitude, longitude, and sequence number. Parameter code, in brackets, is a 5-digit number in the U.S. Geological Survey computerized data system, National Water Infomration System (NWIS), used to uniquely identify a specific constituent or property. Flow-condition rating (based on instantaneous streamflow at USGS stream gage 11164500): H, high flow; I, intermediate flow; L, low flow. CaCO3, calcium carbonate; ft3/s, cubic foot per second; µS/cm, microsiemen per centimeter at 25°C; °C, degree Celsius; mg/L, milligram per liter; µg/L, microgram per liter. <, actual value is less than value shown; —, no data]
See footnotes at end of table.
State well No. or
site identifier (source of sample)
USGS identification No.
Sampledate
Instantaneousstreamflow
(ft3/s)
Flow-condition
rating
Field measurements
pH(standard
units)
Specific con-ductance (µS/cm)
Temperature,water(°C)
Alkalinity(mg/L asCaCO3)
Bicarbonate(mg/L)
[00061] [00400] [00095] [00010] [39086] [00453]
Streamflow-measurement stations
Site 1 372426122120301 4-29-966-12-967-22-962-25-97
6.461.66.27
14.7
I LLH
————
—870
1,140742
17.016.5—10.5
————
————
Site 2 372450122113001 4-29-966-12-962-25-97
6.221.86
13.5
ILH
———
—930764
17.016.511.0
———
———
Site LT 372447122112701 7-22-962-25-97
.444.91
LH
——
1,220730
—12.0
——
——
Site 3 372524122111801 4-29-966-12-967-22-962-25-974-30-97
6.621.181.04
19.01.97
ILLHL
————8.3
—980
1,270765945
15.017.0—10.017.0
————
250
————
300
Site 4 372547122112001 4-29-966-12-962-26-97
6.201.33
19.3
ILH
———
—1,060
772
16.018.010.5
———
———
Site 5 372622122104401 4-29-966-12-967-22-962-26-974-30-97
5.96.26.09
19.11.36
ILLHL
————8.0
—1,0301,270
780985
17.521.5—10.520.0
————
240
————
300
Site 6 372651122100401
1 372651122100901
4-29-962-26-974-30-97
3.8317.8
.07
IHL
——8.3
—770580
20.012.021.5
——
150
——
180
Site 7 372713122094201 4-29-962-26-97
2.4916.6
IH
——
—772
21.512.5
——
——
Site 8 372727122090001 6-12-962-26-974-30-97
.2817.6
.19
LHL
——8.2
770770754
22.013.019.5
——
230
——
280
Site 9 372726122082401 4-29-962-26-97
1.9016.6
IH
——
—770
22.513.0
——
——
Site 10 372716122080801 4-29-962-27-97
2.1415.4
IH
——
—772
22.511.0
——
——
Site 11 372713122073401 4-29-962-27-97
2.6415.9
IH
——
—785
23.011.5
——
——
Site 12 372719122071501 4-29-962-27-97
2.2016.6
IH
——
—801
27.012.5
——
——
Lake Lagunita and public supply
Lake Lagunita 372523122102401 4-30-97 — 8.4 660 18.5 180 220
Public supply 2 4-28-97 — 7.9 77 16.5 26 32
42 Streamflow Gains and Losses along San Francisquito Creek and Characterization of Surface- and Ground-Water Quality, California, 1996–97
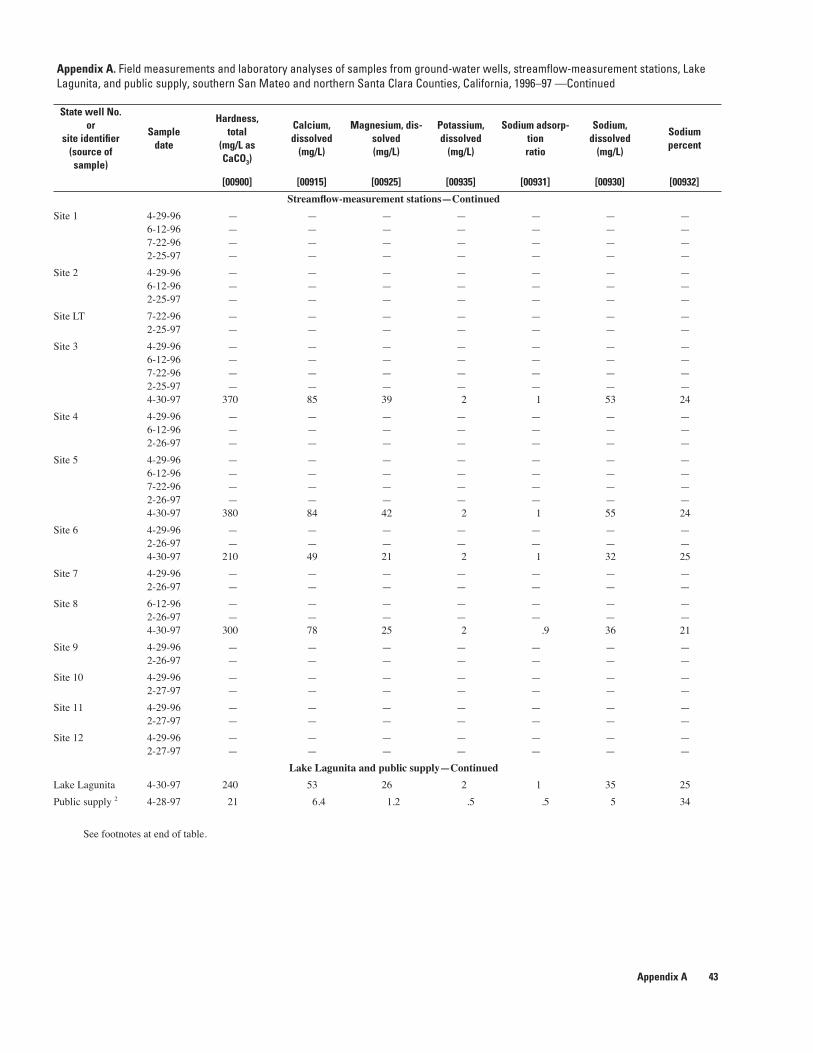
Appendix A. Field measurements and laboratory analyses of samples from ground-water wells, streamflow-measurement stations, Lake Lagunita, and public supply, southern San Mateo and northern Santa Clara Counties, California, 1996–97 —Continued
See footnotes at end of table.
State well No. or
site identifier (source ofsample)
Sampledate
Hardness, total
(mg/L asCaCO3)
Calcium, dissolved
(mg/L)
Magnesium, dis-solved(mg/L)
Potassium, dissolved
(mg/L)
Sodium adsorp-tionratio
Sodium, dissolved
(mg/L)
Sodium percent
[00900] [00915] [00925] [00935] [00931] [00930] [00932]
Streamflow-measurement stations—Continued
Site 1 4-29-966-12-967-22-962-25-97
————
————
————
————
————
————
————
Site 2 4-29-966-12-962-25-97
———
———
———
———
———
———
———
Site LT 7-22-962-25-97
——
——
——
——
——
——
——
Site 3 4-29-966-12-967-22-962-25-974-30-97
————
370
————85
————39
————2
————1
————53
————24
Site 4 4-29-966-12-962-26-97
———
———
———
———
———
———
———
Site 5 4-29-966-12-967-22-962-26-974-30-97
————
380
————84
————42
————2
————1
————55
————24
Site 6 4-29-962-26-974-30-97
——
210
——49
——21
——2
——1
——32
——25
Site 7 4-29-962-26-97
——
——
——
——
——
——
——
Site 8 6-12-962-26-974-30-97
——
300
——78
——25
——2
——
.9
——36
——21
Site 9 4-29-962-26-97
——
——
——
——
——
——
——
Site 10 4-29-962-27-97
——
——
——
——
——
——
——
Site 11 4-29-962-27-97
——
——
——
——
——
——
——
Site 12 4-29-962-27-97
——
——
——
——
——
——
——
Lake Lagunita and public supply—Continued
Lake Lagunita 4-30-97 240 53 26 2 1 35 25
Public supply 2 4-28-97 21 6.4 1.2 .5 .5 5 34
Appendix A 43
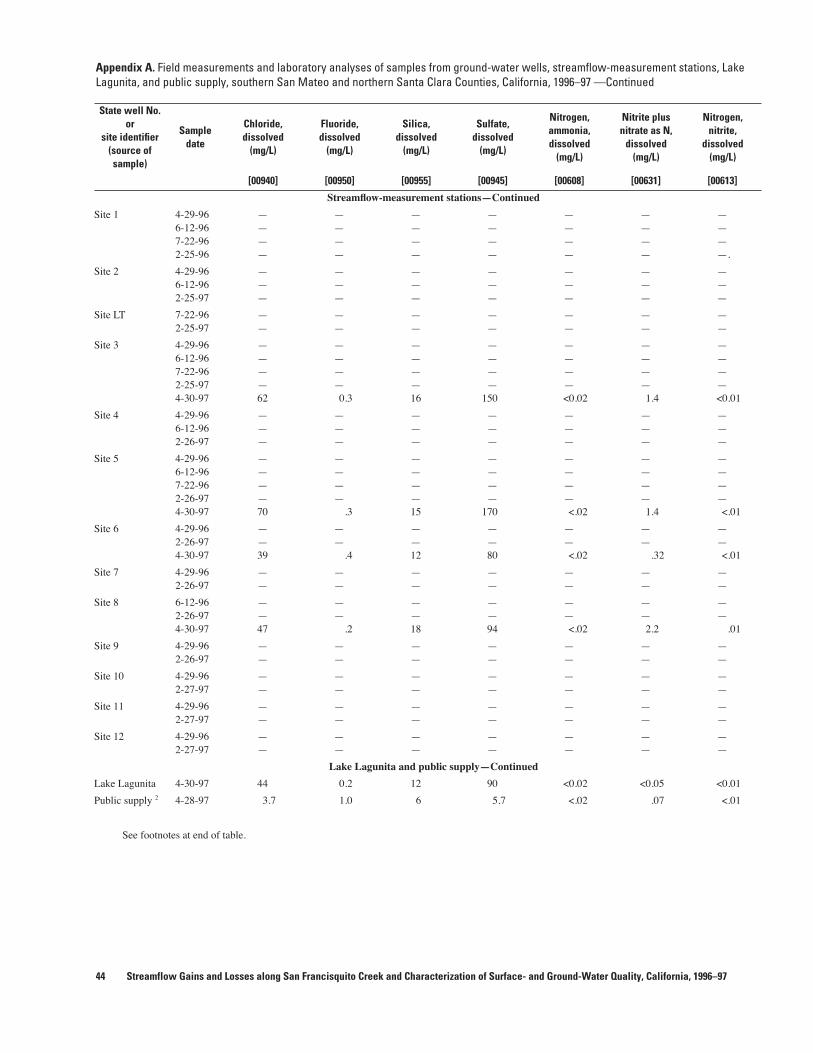
Appendix A. Field measurements and laboratory analyses of samples from ground-water wells, streamflow-measurement stations, Lake Lagunita, and public supply, southern San Mateo and northern Santa Clara Counties, California, 1996–97 —Continued
See footnotes at end of table.
State well No. or
site identifier (source of sample)
Sampledate
Chloride,dissolved
(mg/L)
Fluoride,dissolved
(mg/L)
Silica,dissolved
(mg/L)
Sulfate,dissolved
(mg/L)
Nitrogen,ammonia,dissolved
(mg/L)
Nitrite plus nitrate as N,
dissolved(mg/L)
Nitrogen,nitrite,
dissolved (mg/L)
[00940] [00950] [00955] [00945] [00608] [00631] [00613]
Streamflow-measurement stations—Continued
Site 1 4-29-966-12-967-22-962-25-96
————
————
————
————
————
————
————.
Site 2 4-29-966-12-962-25-97
———
———
———
———
———
———
———
Site LT 7-22-962-25-97
——
——
——
——
——
——
——
Site 3 4-29-966-12-967-22-962-25-974-30-97
————62
————0.3
————16
————
150
————<0.02
————1.4
————<0.01
Site 4 4-29-966-12-962-26-97
———
———
———
———
———
———
———
Site 5 4-29-966-12-967-22-962-26-974-30-97
————70
————
.3
————15
————
170
————<.02
————1.4
————<.01
Site 6 4-29-962-26-974-30-97
——39
——
.4
——12
——80
——<.02
——
.32
——<.01
Site 7 4-29-962-26-97
——
——
——
——
——
——
——
Site 8 6-12-962-26-974-30-97
——47
——
.2
——18
——94
——<.02
——2.2
——
.01
Site 9 4-29-962-26-97
——
——
——
——
——
——
——
Site 10 4-29-962-27-97
——
——
——
——
——
——
——
Site 11 4-29-962-27-97
——
——
——
——
——
——
——
Site 12 4-29-962-27-97
——
——
——
——
——
——
——
Lake Lagunita and public supply—Continued
Lake Lagunita 4-30-97 44 0.2 12 90 <0.02 <0.05 <0.01
Public supply 2 4-28-97 3.7 1.0 6 5.7 <.02 .07 <.01
44 Streamflow Gains and Losses along San Francisquito Creek and Characterization of Surface- and Ground-Water Quality, California, 1996–97
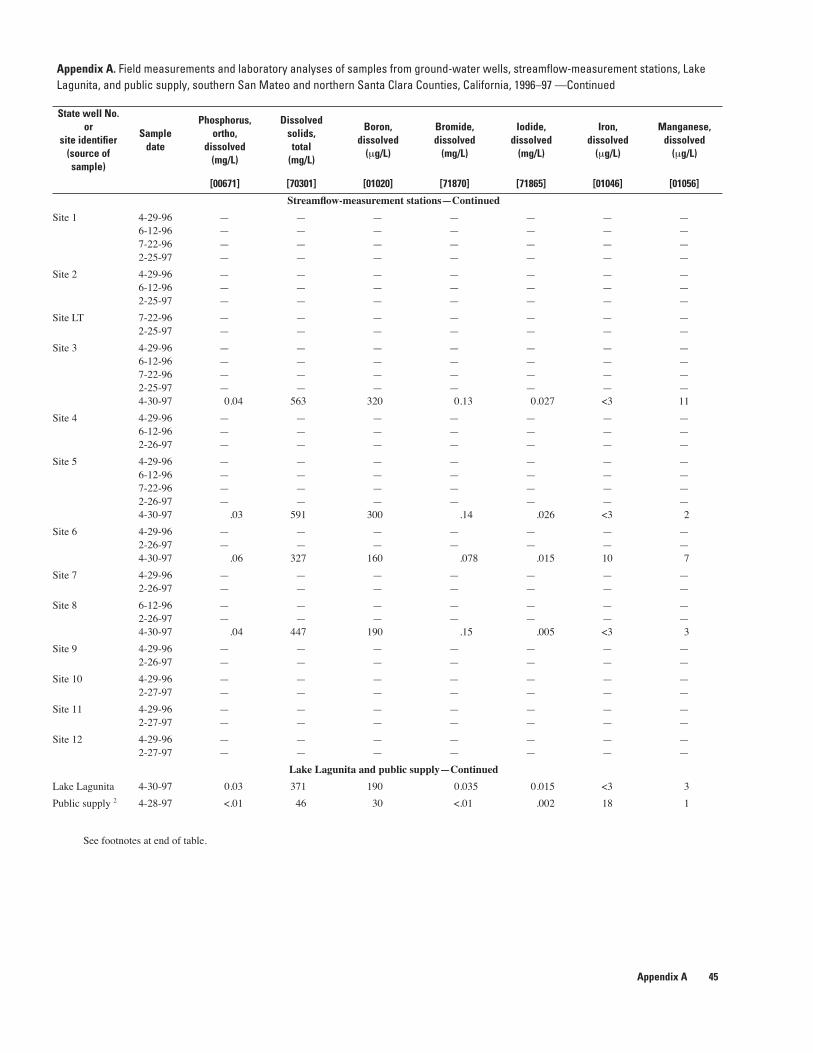
Appendix A. Field measurements and laboratory analyses of samples from ground-water wells, streamflow-measurement stations, Lake Lagunita, and public supply, southern San Mateo and northern Santa Clara Counties, California, 1996–97 —Continued
See footnotes at end of table.
State well No. or
site identifier (source of sample)
Sample date
Phosphorus,ortho,
dissolved(mg/L)
Dissolvedsolids, total
(mg/L)
Boron, dissolved
(µg/L)
Bromide, dissolved
(mg/L)
Iodide, dissolved
(mg/L)
Iron,dissolved
(µg/L)
Manganese, dissolved
(µg/L)
[00671] [70301] [01020] [71870] [71865] [01046] [01056]
Streamflow-measurement stations—Continued
Site 1 4-29-966-12-967-22-962-25-97
————
————
————
————
————
————
————
Site 2 4-29-966-12-962-25-97
———
———
———
———
———
———
———
Site LT 7-22-962-25-97
——
——
——
——
——
——
——
Site 3 4-29-966-12-967-22-962-25-974-30-97
————0.04
————
563
————
320
————0.13
————0.027
————<3
————11
Site 4 4-29-966-12-962-26-97
———
———
———
———
———
———
———
Site 5 4-29-966-12-967-22-962-26-974-30-97
————
.03
————
591
————
300
————
.14
————
.026
————<3
————2
Site 6 4-29-962-26-974-30-97
——
.06
——
327
——
160
——
.078
——
.015
——10
——7
Site 7 4-29-962-26-97
——
——
——
——
——
——
——
Site 8 6-12-962-26-974-30-97
——
.04
——
447
——
190
——
.15
——
.005
——<3
——3
Site 9 4-29-962-26-97
——
——
——
——
——
——
——
Site 10 4-29-962-27-97
——
——
——
——
——
——
——
Site 11 4-29-962-27-97
——
——
——
——
——
——
——
Site 12 4-29-962-27-97
——
——
——
——
——
——
——
Lake Lagunita and public supply—Continued
Lake Lagunita 4-30-97 0.03 371 190 0.035 0.015 <3 3
Public supply 2 4-28-97 <.01 46 30 <.01 .002 18 1
Appendix A 45
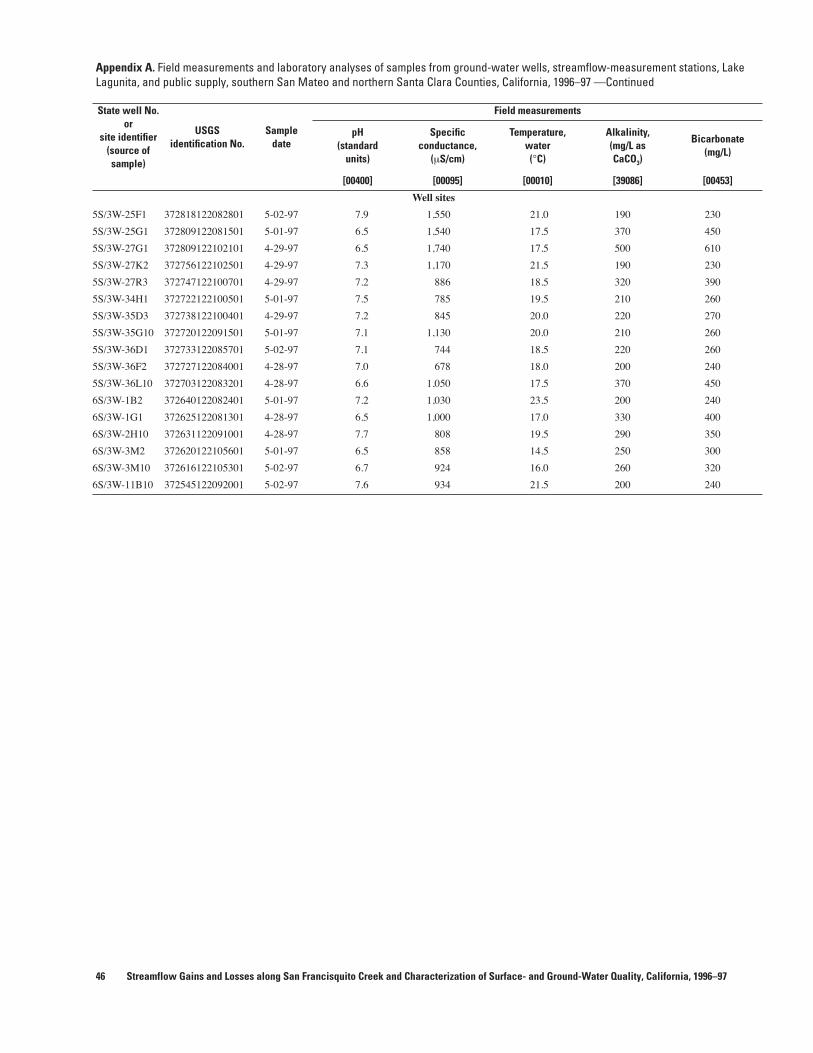
Appendix A. Field measurements and laboratory analyses of samples from ground-water wells, streamflow-measurement stations, Lake Lagunita, and public supply, southern San Mateo and northern Santa Clara Counties, California, 1996–97 —Continued
State well No. or
site identifier (source of sample)
USGSidentification No.
Sampledate
Field measurements
pH(standard
units)
Specificconductance,
(µS/cm)
Temperature,water(°C)
Alkalinity,(mg/L asCaCO3)
Bicarbonate(mg/L)
[00400] [00095] [00010] [39086] [00453]
Well sites
5S/3W-25F1 372818122082801 5-02-97 7.9 1,550 21.0 190 230
5S/3W-25G1 372809122081501 5-01-97 6.5 1,540 17.5 370 450
5S/3W-27G1 372809122102101 4-29-97 6.5 1,740 17.5 500 610
5S/3W-27K2 372756122102501 4-29-97 7.3 1,170 21.5 190 230
5S/3W-27R3 372747122100701 4-29-97 7.2 886 18.5 320 390
5S/3W-34H1 372722122100501 5-01-97 7.5 785 19.5 210 260
5S/3W-35D3 372738122100401 4-29-97 7.2 845 20.0 220 270
5S/3W-35G10 372720122091501 5-01-97 7.1 1,130 20.0 210 260
5S/3W-36D1 372733122085701 5-02-97 7.1 744 18.5 220 260
5S/3W-36F2 372727122084001 4-28-97 7.0 678 18.0 200 240
5S/3W-36L10 372703122083201 4-28-97 6.6 1,050 17.5 370 450
6S/3W-1B2 372640122082401 5-01-97 7.2 1,030 23.5 200 240
6S/3W-1G1 372625122081301 4-28-97 6.5 1,000 17.0 330 400
6S/3W-2H10 372631122091001 4-28-97 7.7 808 19.5 290 350
6S/3W-3M2 372620122105601 5-01-97 6.5 858 14.5 250 300
6S/3W-3M10 372616122105301 5-02-97 6.7 924 16.0 260 320
6S/3W-11B10 372545122092001 5-02-97 7.6 934 21.5 200 240
46 Streamflow Gains and Losses along San Francisquito Creek and Characterization of Surface- and Ground-Water Quality, California, 1996–97
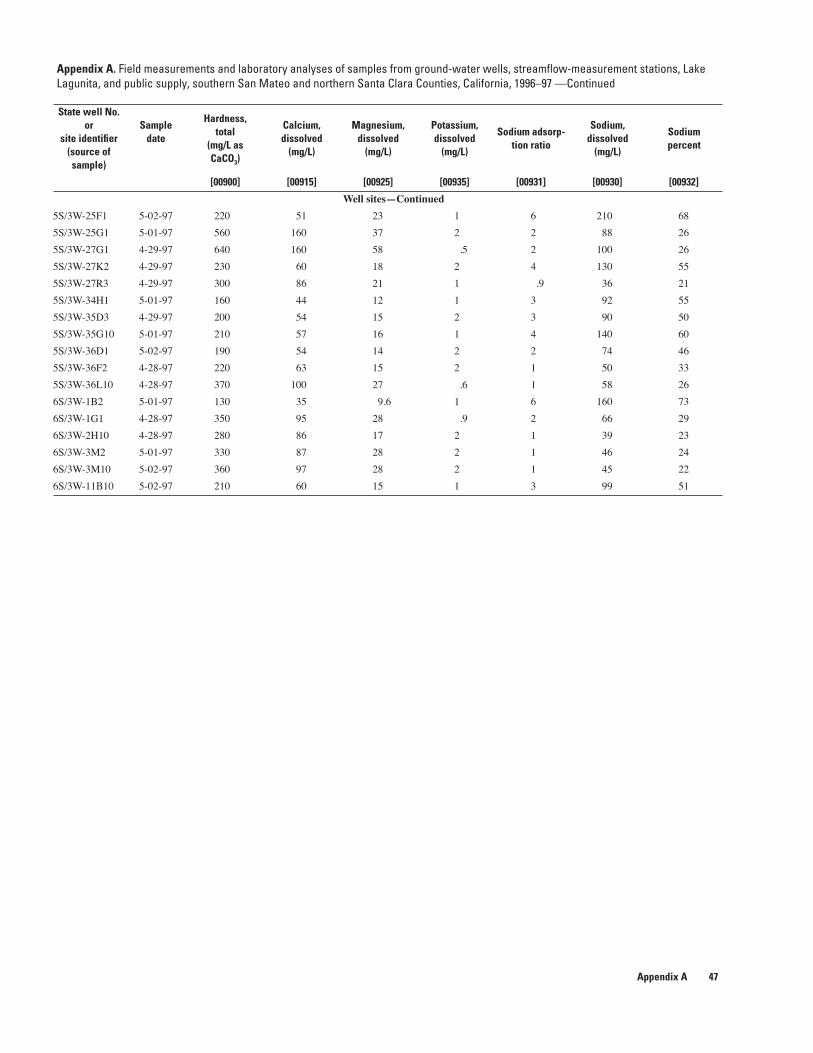
Appendix A. Field measurements and laboratory analyses of samples from ground-water wells, streamflow-measurement stations, Lake Lagunita, and public supply, southern San Mateo and northern Santa Clara Counties, California, 1996–97 —Continued
State well No. or
site identifier (source ofsample)
Sampledate
Hardness,total
(mg/L asCaCO3)
Calcium, dissolved
(mg/L)
Magnesium,dissolved
(mg/L)
Potassium, dissolved
(mg/L)
Sodium adsorp-tion ratio
Sodium, dissolved
(mg/L)
Sodium percent
[00900] [00915] [00925] [00935] [00931] [00930] [00932]
Well sites—Continued
5S/3W-25F1 5-02-97 220 51 23 1 6 210 68
5S/3W-25G1 5-01-97 560 160 37 2 2 88 26
5S/3W-27G1 4-29-97 640 160 58 .5 2 100 26
5S/3W-27K2 4-29-97 230 60 18 2 4 130 55
5S/3W-27R3 4-29-97 300 86 21 1 .9 36 21
5S/3W-34H1 5-01-97 160 44 12 1 3 92 55
5S/3W-35D3 4-29-97 200 54 15 2 3 90 50
5S/3W-35G10 5-01-97 210 57 16 1 4 140 60
5S/3W-36D1 5-02-97 190 54 14 2 2 74 46
5S/3W-36F2 4-28-97 220 63 15 2 1 50 33
5S/3W-36L10 4-28-97 370 100 27 .6 1 58 26
6S/3W-1B2 5-01-97 130 35 9.6 1 6 160 73
6S/3W-1G1 4-28-97 350 95 28 .9 2 66 29
6S/3W-2H10 4-28-97 280 86 17 2 1 39 23
6S/3W-3M2 5-01-97 330 87 28 2 1 46 24
6S/3W-3M10 5-02-97 360 97 28 2 1 45 22
6S/3W-11B10 5-02-97 210 60 15 1 3 99 51
Appendix A 47
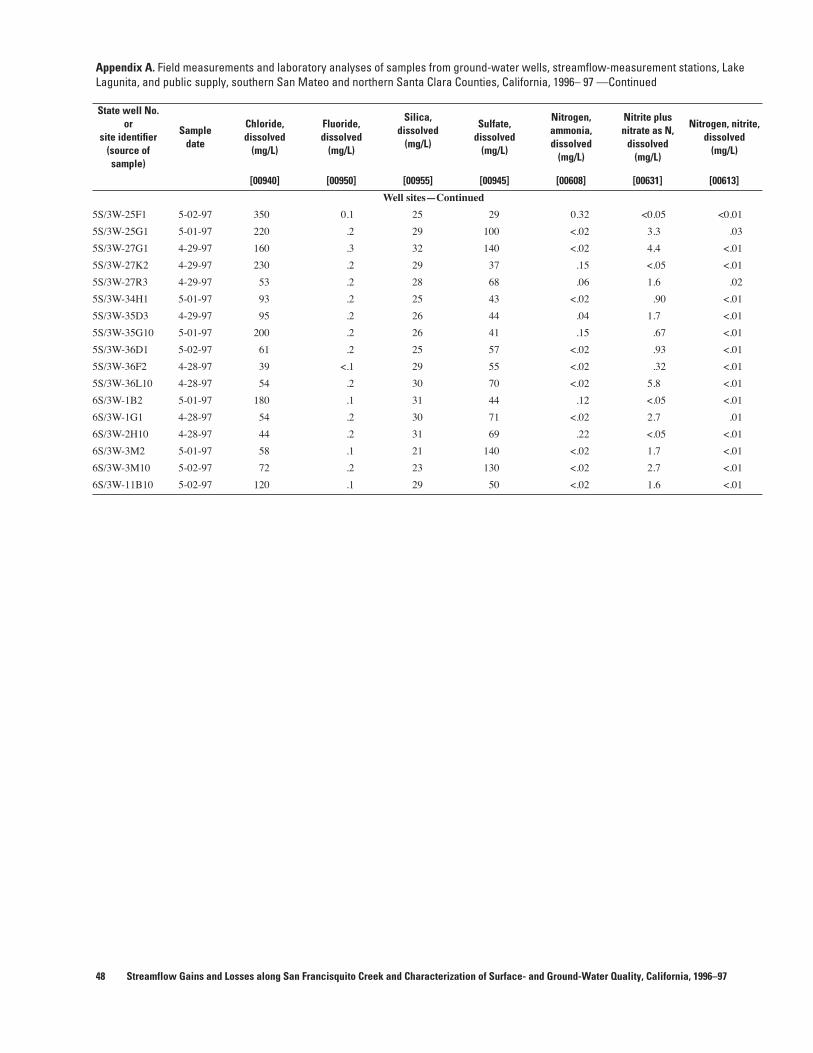
Appendix A. Field measurements and laboratory analyses of samples from ground-water wells, streamflow-measurement stations, Lake Lagunita, and public supply, southern San Mateo and northern Santa Clara Counties, California, 1996– 97 —Continued
State well No. or
site identifier (source of sample)
Sample date
Chloride, dissolved
(mg/L)
Fluoride, dissolved
(mg/L)
Silica,dissolved
(mg/L)
Sulfate,dissolved
(mg/L)
Nitrogen, ammonia, dissolved
(mg/L)
Nitrite plus nitrate as N,
dissolved(mg/L)
Nitrogen, nitrite, dissolved
(mg/L)
[00940] [00950] [00955] [00945] [00608] [00631] [00613]
Well sites—Continued
5S/3W-25F1 5-02-97 350 0.1 25 29 0.32 <0.05 <0.01
5S/3W-25G1 5-01-97 220 .2 29 100 <.02 3.3 .03
5S/3W-27G1 4-29-97 160 .3 32 140 <.02 4.4 <.01
5S/3W-27K2 4-29-97 230 .2 29 37 .15 <.05 <.01
5S/3W-27R3 4-29-97 53 .2 28 68 .06 1.6 .02
5S/3W-34H1 5-01-97 93 .2 25 43 <.02 .90 <.01
5S/3W-35D3 4-29-97 95 .2 26 44 .04 1.7 <.01
5S/3W-35G10 5-01-97 200 .2 26 41 .15 .67 <.01
5S/3W-36D1 5-02-97 61 .2 25 57 <.02 .93 <.01
5S/3W-36F2 4-28-97 39 <.1 29 55 <.02 .32 <.01
5S/3W-36L10 4-28-97 54 .2 30 70 <.02 5.8 <.01
6S/3W-1B2 5-01-97 180 .1 31 44 .12 <.05 <.01
6S/3W-1G1 4-28-97 54 .2 30 71 <.02 2.7 .01
6S/3W-2H10 4-28-97 44 .2 31 69 .22 <.05 <.01
6S/3W-3M2 5-01-97 58 .1 21 140 <.02 1.7 <.01
6S/3W-3M10 5-02-97 72 .2 23 130 <.02 2.7 <.01
6S/3W-11B10 5-02-97 120 .1 29 50 <.02 1.6 <.01
48 Streamflow Gains and Losses along San Francisquito Creek and Characterization of Surface- and Ground-Water Quality, California, 1996–97
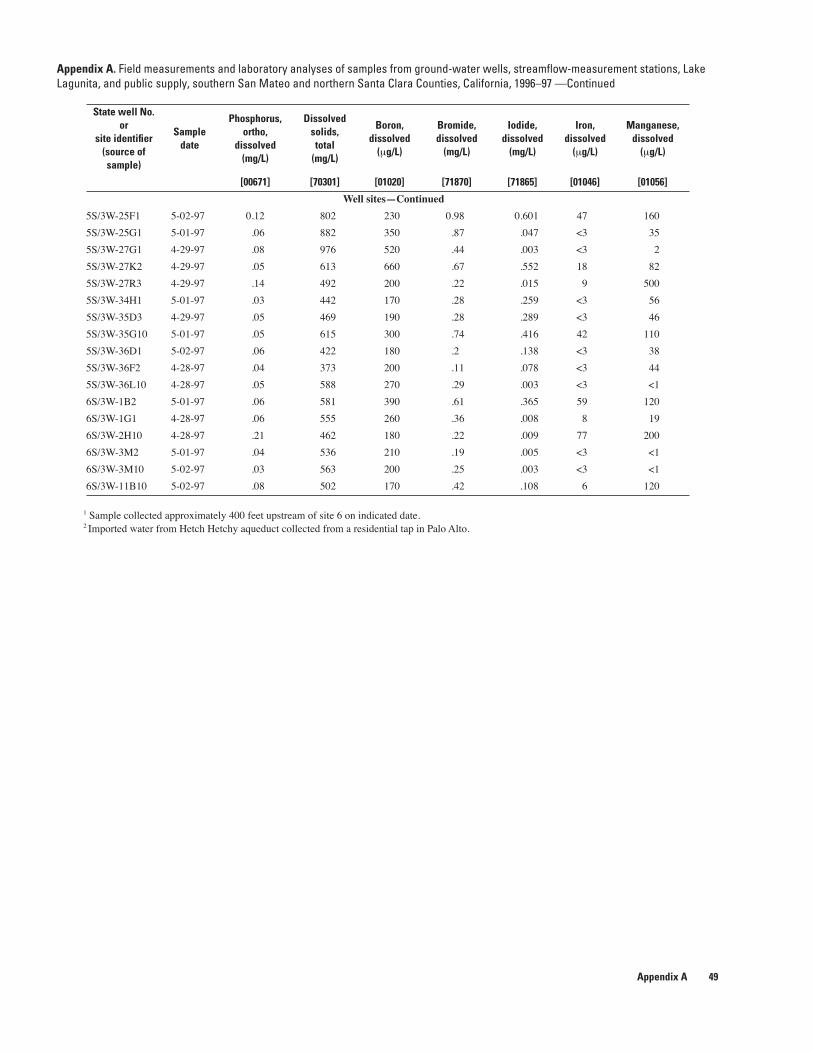
Appendix A. Field measurements and laboratory analyses of samples from ground-water wells, streamflow-measurement stations, Lake Lagunita, and public supply, southern San Mateo and northern Santa Clara Counties, California, 1996–97 —Continued
1 Sample collected approximately 400 feet upstream of site 6 on indicated date.2 Imported water from Hetch Hetchy aqueduct collected from a residential tap in Palo Alto.
State well No.or
site identifier (source of sample)
Sample date
Phosphorus,ortho,
dissolved (mg/L)
Dissolved solids, total
(mg/L)
Boron,dissolved
(µg/L)
Bromide, dissolved
(mg/L)
Iodide,dissolved
(mg/L)
Iron,dissolved
(µg/L)
Manganese, dissolved
(µg/L)
[00671] [70301] [01020] [71870] [71865] [01046] [01056]
Well sites—Continued
5S/3W-25F1 5-02-97 0.12 802 230 0.98 0.601 47 160
5S/3W-25G1 5-01-97 .06 882 350 .87 .047 <3 35
5S/3W-27G1 4-29-97 .08 976 520 .44 .003 <3 2
5S/3W-27K2 4-29-97 .05 613 660 .67 .552 18 82
5S/3W-27R3 4-29-97 .14 492 200 .22 .015 9 500
5S/3W-34H1 5-01-97 .03 442 170 .28 .259 <3 56
5S/3W-35D3 4-29-97 .05 469 190 .28 .289 <3 46
5S/3W-35G10 5-01-97 .05 615 300 .74 .416 42 110
5S/3W-36D1 5-02-97 .06 422 180 .2 .138 <3 38
5S/3W-36F2 4-28-97 .04 373 200 .11 .078 <3 44
5S/3W-36L10 4-28-97 .05 588 270 .29 .003 <3 <1
6S/3W-1B2 5-01-97 .06 581 390 .61 .365 59 120
6S/3W-1G1 4-28-97 .06 555 260 .36 .008 8 19
6S/3W-2H10 4-28-97 .21 462 180 .22 .009 77 200
6S/3W-3M2 5-01-97 .04 536 210 .19 .005 <3 <1
6S/3W-3M10 5-02-97 .03 563 200 .25 .003 <3 <1
6S/3W-11B10 5-02-97 .08 502 170 .42 .108 6 120
Appendix A 49


