
Information Circular 39A DFF-OG-OU-011
Structural and Stratigraphic Analysis of the Shell Rex Timber No. 1-9
Well, Southern Ouachita Fold and Thrust Belt, Clark County, Arkansas
Ted Godo1, Peng Li2, and M. Ed Ratchford2
1 Shell Exploration & Production Company, Houston, Texas
2 Arkansas Geological Survey, Little Rock, Arkansas
Bekki White, Director and State Geologist
Arkansas Geological Survey
December 2008
STATE OF ARKANSAS Mike Beebe, Governor
ARKANSAS GEOLOGICAL SURVEY Bekki White, Director and State Geologist
COMMISSIONERS
Dr. Richard Cohoon, Chairman………………………………………………..Russellville
William Willis, Vice Chairman………………………………………………..Hot Springs
David J. Baumgardner.........................................................................................Little Rock
Brad DeVazier…………………………………………………………………Forrest City
Keith DuPriest……………………………………………………………………Magnolia
Becky Keogh……………………………………………………………………Little Rock
David Lumbert………………………………………………………………….Little Rock
i
ii
Table of Contents
Table of Contents………………………………………………………………………….ii
List of Figures and Table……………………………………………………....................iii
List of Plates and Appendices……………………………………………………………..v
Acknowledgments ............................................................................................................. vi
Introduction......................................................................................................................... 1
Regional Geologic Setting .................................................................................................. 3
Well Evaluation .................................................................................................................. 6
Geochemistry .................................................................................................................... 11
Depositional Environment ................................................................................................ 16
Deepwater Elements and Terminology......................................................................... 16
Outcrop Analogs and Well Log Interpretation ............................................................. 17
Structural Evaluation ........................................................................................................ 19
Borehole Televiewer Analysis...................................................................................... 23
Sandstone Petrology ......................................................................................................... 33
General Discussion ....................................................................................................... 33
Petrographic Analysis of Well Samples ....................................................................... 34
Diagenesis......................................................................................................................... 38
Discussion......................................................................................................................... 54
References Cited ............................................................................................................... 55

List of Figures and Table
Figure 1. Surface and subcrop geology of the Rex Timber 1-9 Well, Clark County, Arkansas.............................................................................................................................. 2
Figure 2. Partial stratigraphic section from the Ouachita Mountains region, Arkansas and Oklahoma............................................................................................................................ 4 Figure 3. Structural contour map of the top of the Stanley Formation near the Rex Timber No. 1-9 well……………………………………………………………………….8 Figure 4. Stratigraphic and thermal maturity evaluation of Rex Timber No. 1-9 well ... 10 Figure 5. The conversion relationship between level of maturity (LOM) and vitrinite reflectance (Ro)................................................................................................................. 12
Figure 6. Total Organic Carbon (TOC) values of samples in the Rex Timber No. 1-9 well……………………………………………………………………………………….14 Figure 7A. Interpreted electrical log shapes from the Rex Timber No. 1-9 well (1,700 – 2,000 ft)………………………………………………………………………...19 Figure 7B. Interpreted electrical log shapes from the Rex Timber No. 1-9 well (2,640 – 3,200 ft)……………………………………………………………………… 20
Figure 7C. Interpreted electrical log shapes from the Rex Timber No. 1-9 well (5,250 – 5,950 ft)……………………………………………………………………… 21 Figure 8. Seismic Line 83-506-2334 (migrated stack) displaying a dip section of the Moccasin prospect……………………………………………………………………….24 Figure 9A. Low-angle fractures (LAF) and bedding (B)………………………………..26 Figure 9B. Low-angle fractures (LAF) and high-angle fractures (HAF) ........................ 27 Figure 9C. Fracture cluster (FC) with undeformed sandstone above and below ............ 28
Figure 9D. Lines drawn parallel to the direction of maximum compressive stress σ1 during folding.................................................................................................................... 29 Figure 9E. Interval of 2,299-2,397 ft (701-731 m) showing folds above a thrust fault (F)........................................................................................................................................... 53 Figure 9F. Lenses (L) of Jackfork sandstone in shale ..................................................... 55
iii

Figure 10. Classification of sandstone examined by point counting methods using twenty-two (22) thin sections from the Rex Timber No. 1-9 well. Classification scheme is from Folk (1968)………………………………………………………………………36
Figure 11. Constituents of sandstones examined in the Rex Timber No. 1-9 well. Results based on point counts of thin sections from ditch cuttings (300 points per thin section). 37 Figure 12. EDAX elemental analysis spectrums of selected carbonates in the Rex Timber No. 1-9. Spectrums displayed from thin sections shown on Plate 4B and Plate 7D…….53 Table 1. Thermal maturity level and visual kerogen type analysis for Rex Timber No. 1-9 well……...……………………………………………….…………………………..15
iv

List of Plates and Appendices Plate 1. Location map and surface geology of the southern Ouachita Mountain region, Arkansas……………………………….At the end of manuscript and separate file on disk Plate 2. Photomicrographs and petrographic descriptions. A) 5,040 – 5,050 ft; B) 5,040 – 5,050 ft; C) 2,370 – 2,380 ft; D) 2,370 – 2,380 ft……………………………………...39 Plate 3. Photomicrographs and petrographic descriptions. A) 1,530 – 1,540 ft; B) 2,370 – 2,380 ft; B) 5,210 – 5,220 ft; C) 4,670 – 4,680 ft; D) 2,620 – 2,630 ft………………..41 Plate 4. Photomicrographs and petrographic descriptions. A) 3,790 – 3,800 ft; B) 3,508 ft; C) 1,480 – 1,490 ft; D) 1,480 – 1,490 ft………………………………………………42 Plate 5. Photomicrographs and petrographic descriptions. A) 1,480 – 1490 ft; B) 5,210 – 5,220 ft; C) 3,860 – 3,870 ft; D) 5,300 – 5,310 ft………………………………………..44 Plate 6. Photomicrographs and petrographic descriptions. A) 4,570 – 4,580 ft; B) 4,570 – 4,580 ft; C) 4,670 – 4,680 ft; D) 4,670 – 4,680 ft……………………………………...45 Plate 7. Photomicrographs and petrographic descriptions. A) 1,530 – 1,540 ft; B) 3,100 – 3,110 ft; C) 1,460 – 1,470 ft; D) 1,460 – 1,470 ft……………………………………...47 Plate 8. Photomicrographs and petrographic descriptions. A) 3,860 – 3,870 ft; B) 3,860 – 3,870 ft; C) 5,520 – 5,530 ft; D) 5,510 – 5,520 ft……………………………………...48 Plate 9. Photomicrographs and petrographic descriptions. A) 3,370 – 3,385 ft; B) 1,210 – 1,220 ft; C) 1,160 – 1,170 ft; D) 3,370 – 3,385 ft……………………………………...49 Plate 10. Photomicrographs and petrographic descriptions. A) 5,110 – 5,120 ft; B) 5,110 – 5,120 ft; C) 3,790 – 3,800 ft; D) 3,790 – 3,800 ft……………………………………...50 Plate 11. Photomicrographs and petrographic descriptions. A) 5,520 – 5,530 ft; B) 5,520 – 5,530 ft; C) 1,460 – 1,470 ft; D) 5,110 – 5,120 ft……………………………………...51 Plate 12. Photomicrographs and petrographic descriptions. A) 3,515.3 ft; B) 6,150 – 6,160 ft; C) 5,110 – 5,120 ft; D) 5,110 – 5,120 ft………………………………………..53 Appendix 1. Total organic carbon (TOC) analysis for Rex Timber No. 1-9 well………60 Appendix 2. Thin section point counts from Rex Timber No. 1-9 well………………...65
v

vi
Acknowledgments
The authors express their gratitude to Shell Exploration & Production Company
(SEPCO) for sharing their data, technical advice, and subsurface knowledge of the
Ouachita Mountains region in Arkansas for this publication. We are also thankful to the
geology staff of the Arkansas Geological Survey (AGS) for reviewing the technical
aspects of the manuscript and providing supplemental geologic information that is
germane to this report. Finally, we would like thank Nathan Taylor and Jerry Clark, GIS
specialists at the AGS for preparing the graphics and plates in this report.

Structural and Stratigraphic Analysis of the Shell Rex Timber No. 1-9 Well, Southern Ouachita Fold and Thrust Belt, Clark County, Arkansas
Ted Godo1, Peng Li2, and M. Ed Ratchford2
1 Shell Exploration & Production Company, Houston, Texas
2 Arkansas Geological Survey, Little Rock, Arkansas
Introduction
A joint research project between the Arkansas Geological Survey (AGS) and
Shell Exploration & Production Company (SEPCO) was undertaken to report the
findings of three exploration wells drilled by Shell in the 1980’s in the Arkansas portion
of the Ouachita Mountains. Shell had recognized three exploration targets in the
Ouachita fold and thrust belt of Arkansas and drilled three wildcat wells to test their
hydrocarbon potential. These three wells were designed to test the reservoir potential of
the Ordovician Crystal Mountain Sandstone (International Paper well, Hot Spring
County), the Carboniferous sandstones in the Jackfork and Stanley Formations (Rex
Timber well, Clark County) and the Devonian Arkansas Novaculite/Bigfork Chert
(Arivett well, Pike County) (Plate 1). The results and conclusions of the integrated
analysis from these three wells will be published in a three part series of Information
Circulars by the AGS. As one of the three publications, this report is focused on the Rex
Timber No. 1-9 well located in Section 9-T7S-R20W (Figure 1). The well was spudded
in February of 1985 and subsequently was plugged and abandoned as a dry hole in May
of 1985 after reaching a total depth of 6765 ft (2062 m). The principal objectives of this
1

Figure 1. Surface and subcrop geology of the Rex Tim
ber No. 1-9 w
ell, Clark C
ounty, Arkansas.
(A larger digital PD
F version of this map is on the disk)
2

report are to (1) evaluate and report the pre- and post-drilling well information, including
structural evaluation, depositional environment, sandstone petrology, diagenesis,
geochemistry, well log analysis and seismic interpretation, (2) assess the reasons for a
lack of movable hydrocarbons in this well, (3) assess the reservoir play potential along
the southern flank of the Ouachita fold and thrust belt in Arkansas based on integration of
the results from the Rex Timber well with the other two wells studied in the 3-part series
of Information Circulars.
Regional Geologic Setting
The Ouachita Mountain geographic province lies between the Arkoma Basin to
the north and the Gulf Coastal Plain to the south and extends from Little Rock, Arkansas
westward to Atoka, Oklahoma. The total area of the exposed mountain range is
approximately 12,000 mi2 (31,080 km2), of which slightly more than half lies within
Arkansas. Late Cambrian to Carboniferous deepwater sedimentary rocks comprise the
surface exposures, which define the Ouachita Mountains (Figure 2). Volumetrically,
siliciclastics of the Carboniferous Stanley, Jackfork, Johns Valley and Atoka Formations
make up more than 80% of this interval (Roberts, 1982). The Carboniferous stratigraphic
succession of the Ouachita Mountains is an approximate 32,808 ft (10,000 m) interval of
deepwater siliciclastic and cherty sedimentary rocks deposited during foreland basin
subsidence immediately prior to Late Carboniferous (Late Pennsylvanian) folding and
thrusting during the Ouachita Orogeny. This thick sequence is highly representative of
foreland basin deepwater detrital fill (Coleman, 2000). Coleman suggested the Jackfork
3

JACKFORKMw
M
L
STANLEY
ARK. NOV.U
M
L
U
M
L
MISSOURI MTN.
BLAYLOCK
POLK CREEK
BIG FORK
WOMBLE
BLAKELY
MAZARNCRYTAL MTN
COLLIER
U
M
L
UML
C
CP METAMORPHICS?
OR
DO
VIC
IAN
SIL
.D
EV.
MIS
S.
PE
NN
.. . . . . . . . . . . .. . . . . . . . . . . .
. . . . . . . . . . . .. . . . . . . . . . . . .. . . . . . . . . . . . .. . . . . . . . . . . . .. . . . . . . . . . . . .. . . . . . . . . . . . .. . . . . . . . . . . . . . .. . . . . . . . . . . . .. . . . . . . . . . . .. . . . . . . . . . . .. . . . . . . . . . . . . . . . . . . . . . .
. . . . . . .. . . . . . .. . . . . . .. . . . . . .. . . . . . .. . . . . . .
. .
VOL.
. . . . . . . . . . . .
. . . . . . . . . .. . . . . . . .
. . . . . . . .. . . . . . . .
. . . . . . . .. . . .. . .
. .
. . . . .. .?
?
?
primary
OUTCROPPOROSITY
AVG. (RANGE) TOC * (wt. %)
11.9 ( 0-34 )%
13.7 ( 0.5-26 )%
23 ( 3-52 )%
9 ( 1-29 )%
5 ( 1-11 )%
20 ( 15-24 )%
19 ( 6-36 )%
16 ( 1-31 )%
0.83 ± 0.26
0.77 ± 0.12
1.05 ± 0.30
0.79 ± 0.48
0.77 ± 0.16
1.06 ± 0.87
oil productionsolid hydrocarbons
gas productiongas shows
.. . ..
* Average TOC values with standard deviation for subsurface samples from Duriale (1983).
secondary
1 2
1: exploration objectives
2: hydrocarbon indication from wells in Oklahoma portion of Ouachita Mountains
Limestone. . . . .. . . . .. . . . . Sandstone ShaleChertVOL Vocanics
Figure 2. Partial stratigraphic section from the Ouachita Mountains region, Arkansas and Oklahoma (modified from Shell’s internal report).
4
was deposited in water depths of 4,921 to 6,562 ft (1,500 to 2,000 m) and the Stanley and
Atoka were also deposited in similar water depths.
The Ouachita Mountains can be subdivided into the following tectonic provinces
from north to south primarily on the basis of different structural styles: frontal zone,
defined by imbricate faults that bring Carboniferous rocks to outcrop, a core zone uplift
which exposes Cambrian through Mississippian pre-flysch sediments (also known as the
Benton–Broken Bow uplifts), and a southern zone characterized by a return to
Carboniferous rocks, but exposed in broader fold structures. The Rex Timber No. 1-9
well is located in the southern tectonic province of Clark County, and was drilled in the
core of a Carboniferous anticline.
The southern Ouachita province forms a narrow strip about 12 mi (20 km) wide
and 93 mi (150 km) long consisting of Carboniferous outcrop exposures that reside
mostly in Arkansas. Part of this province is known geomorphically as the Athens Plateau.
Relatively simple structures characterize the outcrops of Jackfork through Atoka
sequences in this province, but an exceedingly complex fault and fold pattern prevails as
a disharmonic detachment zone within the underlying Mississippian Stanley Formation
(Arbenz, 1989). The stratigraphic column also shows vertical variations in sedimentary
facies. The pre-Stanley section is relatively thin and is characterized by cherts and dark
graptolitic shales, indicating a period of very slow sedimentation in a starved trough. The
Stanley-Jackfork-Johns Valley-Atoka sequence is much thicker and is characterized as a
flysch facies that contains abundant sandstone intervals representing periods of rapid
sedimentation in a deepwater environment (Cline and Shelburne, 1959).
5

The Stanley Formation of the southern Ouachitas consists of a thick shale interval
(maximum of 10,991 ft or 3,350 m) with upper and lower sandstone sections that were
deposited during a sea level highstand (Coleman, 2000). The overlying Jackfork
Formation is predominantly a sandstone sequence (maximum of 6,890 ft or 2,100 m),
which was deposited during a sea level lowstand with no shelf equivalent (Ross and Ross,
1988). Paleocurrent indicators from the Jackfork suggest that the majority of sediments
were derived from the southeast and northeast and additional sediments were contributed
from the southern and northern shelves (Coleman, 2000). The Johns Valley Formation
overlies the Jackfork Formation and consists predominantly of shale (maximum of 886 ft
or 270 m), with intercalated turbidite sandstone and unusually abundant exotic boulders
of diverse composition (Morris, 1989). Stratigraphically overlying the Johns Valley is
the Atoka Formation, which consists of a thick succession of lower and middle
Pennsylvanian sandstone and shale that originally exceeded 29,987 ft (9,140 m) in
depositional thickness (Coleman, 2000).
Well Evaluation
The Rex Timber No. 1-9 was drilled as a rank wildcat test of the Shell’s Moccasin
prospect. The Stanley-Jackfork Formations were the primary exploration objectives and
were penetrated to a total depth of 6,765 ft (2,062 m). The original proposed total depth
was 10,000 feet (3,048 m), but the well was stopped short as the drilling results came in
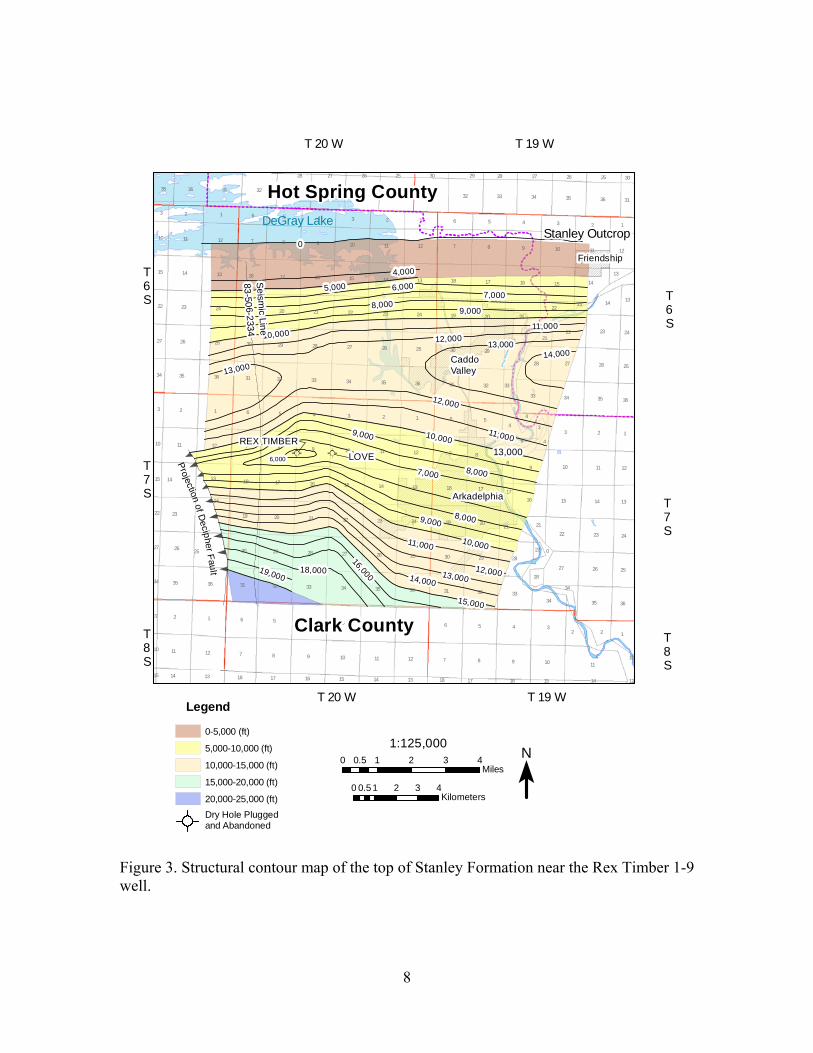
and the costs rose due to slow penetration rates. The closest well control is the 1938
Witherspoon Love 10-1 located approximately one mile east of the Rex Timber (Figure
3), which penetrated a depth of only 2,655 ft (809 m). The prospect area lies beneath a
6

very thin cover of Upper Cretaceous sediments, but is on trend with a surface anticline
which has the Jackfork Formation in its core. In addition to mapping the surface geology
and projecting the anticlinal trend beneath the Cretaceous cover, seismic reflection data
and refraction velocities were measured along the Cretaceous/Paleozoic unconformity,
and were used to help define the structural trap of the Moccasin prospect. The resulting
interpretation of the Moccasin prospect is that of a relatively simple anticline cored by the
Jackfork and flanked both on the north and south sides by the Johns Valley Shale. A
structural culmination along this anticline was inferred, but not positively identified at the
prospect location (Figure 3). Only the suggestion of an east plunge is postulated for the
anticline that is projected from “trendology” on the surface geologic map (Figure 1).
The Rex Timber well was spudded in the Upper Cretaceous Ozan Formation,
which is composed of gumbo clays and calcareous sandstones with a thin, basal chert
conglomerate that overlies the Jackfork Formation at 217 ft (66 m) down the well bore.
The Jackfork Formation consists primarily of a thick sequence of interbedded sandstones,
siltstones and shales, and comprises approximately 5,500 ft (1,676 m) of the Rex Timber
well (Figure 4). The Jackfork-Stanley boundary is difficult to determine due to a paucity
of reliable paleontologic data and a transitional lithologic change between the two units.
Based on the increased percentage of shales (>50%), the stratigraphic top of the Stanley
is placed at approximately 5,700 ft (1,737 m) down the well bore. The interval between
5,700 ft (1,737 m) to a total depth of 6,765 ft (2,062 m) consists of shale with a lesser
amount of sandstone and is assigned to the upper Stanley.
Four cores were taken in the well, three in the Jackfork and one in the Stanley.
The sandstone lithology in the cores is quartz arenite, with little or no porosity. Log
7
Projectionof D
ecipher Fault
Ouachita
River
0
5 2
3
9
33
7
1
8
3
8
24
4
5
1
9
8
62
4
79
7
6
5
8
5
8
2
9
9
1
1
2
9
6
7
6
7
11
7
8
1
11
11
14
11
1111
11
11
15
24
17
27
12
13
34
16
25
23
17
16
12
13
36
10
22
34
17
36333431
18
35
10
11
1414
32
25
19
10
33
32
19
10
24
35
34
35 32
5
18
29
26
35
35
26 30
27
14
20
16
1
26
21
20
28
36
23
33
32
22
23
26
30 29
20
23
10
28
13
36
33
20
10
25
36
29
14
1515
25
29
26
3632
31
12
35
34
2421
23
31
23
27
12
35
26
31
6
32
12
42
24
3
35
4
22
2
23
12
17
15
13
28
27
1
36
5
21
14
33
31
16
33
18
19
30
14
2
8
22
18
30
28
31
6
19
2
12
1
36
25
24
13
21
3
14
12
35
34
36
25
14
28
10
24
15
3
31
13
22 2213
27
49
18
34
17 16
25
21
15
10
21
15
14
26
33
3
22
13
27
28
13
18
3
28
27
29
17
4
17
27
30
14
3434
16
30
15
25
10
26
23
27
15
28
12
12
0
9,0008,0007,000
6,000
11,00010,000
12,000
13,00014,000
15,000
4,000
5,000
16,000
18,00019,000
11,000
12,000
9,000
14,000
11,000
10,000
8,0007,000
10,000
9,0008,000
12,000
13,000
Clark County
T6S
T7S
T8S
T7S
T8S
Stanley Outcrop
T6S
T 19 WT 20 W
T 19 WT 20 W
Seis mi c
Line
REX TIMBERLOVE
Friendship
CaddoValley
Arkadelphia
13,000
0 1 2 3 40.5Miles
0 1 2 3 40.5Kilometers
1:125,000
13,000
Hot Spring CountyDeGray Lake
83-50 6-2334
Legend
0-5,000 (ft)
5,000-10,000 (ft)
10,000-15,000 (ft)
15,000-20,000 (ft)
20,000-25,000 (ft)Dry Hole Pluggedand Abandoned
6,000
N
Figure 3. Structural contour map of the top of Stanley Formation near the Rex Timber 1-9 well.
8

porosities rarely exceed more than 2%. Although background gas was encountered from
700 ft (213 m) to total depth, no significant gas shows occurred. Trace amounts of solid
hydrocarbons were evident throughout the well (Figure 4). The solid hydrocarbons may
represent a limited paleoporosity within the reservoir present at the time of oil migration.
The shales penetrated in the well had some sealing capabilities as indicated by the
saline formation water encountered at depths greater than 3,000 ft (914 m). However,
there is some question as to whether the shales that were encountered in the Rex Timber
well could have provided an adequate seal for an extensive amount of time after
hydrocarbons were emplaced. The tight nature of the fold and the fracture network
observed in the Rex Timber well would require a thick overlying shale sequence to
preclude leakage through any fractures in the sandy sequence. The thickest shale
sequence penetrated in the well is less than 150 ft (46 m) and is stratigraphically in the
upper Stanley Formation. As the drilling depth approached 6,800 feet (2,073 m), there
was little encouragement for porosity development, adequate seal thickness, or sufficient
reservoir quality. Consequently, Shell concluded that they had drilled deep enough to
obtain the necessary information and the well stopped short of the original target depth.
Based on outcrop analogs, there is a reasonable possibility that thicker shales are present
in the middle and lower Stanley but were not penetrated in the well. It is not known if
these deeper shales could have provided adequate sealing capability during hydrocarbon
development and migration. Furthermore, it is not known if the Arkansas Novaculite
(another regional objective) would be in the core of this anticline at depth.
9

1000
2000
3000
4000
5000
6000
TD6765
DEPTH(FEET)
AGE STRATUNIT LITHOLOGY SHOWS
LOGPOROS.
>2%FM.
WATERRICH-NESS
THERMAL MATURITY2.0 3.0VR
CRET CRET
MO
RR
OW
AN
MIS
S.
STAN
LEY
JAC
KFO
RK
(P)
(P)
(P)
PP
(P)
LOM 14
LOM 15
LOM 16
LOM 17
LOM 17.6 @ TD
+
+xx
x
x
4.0
5.0
4.5
4.0
10.5?9.5
TG
TG
TG
TG
TGTGTG
SHOWSDEAD OIL
TG TRIP GAS > 200 UNITS
FORMATION WATER
+xFRESHSALINE
RICHNESS
P GAS SOURCE ROCK(P) MARGINAL GAS
SOURCE ROCK Shale
Sandstone
LITHOLOGY
Figure 4. Stratigraphic and thermal maturity evaluation of Rex Timber No. 1-9 well (modified from Shell’s internal report).
10

Geochemistry
Vitrinite and graptolite reflectance studies on Paleozoic outcrops and well
samples in the Ouachita region outline an area of low-grade metamorphosed sediments
that lie in and adjacent to the older exposed Ordovician to Mississippian rocks. The
rocks exposed at the surface are characterized by high level of maturity (LOM) >18
(consistent with the onset of greenschist metamorphism). LOM is a unique thermal
maturity level parameter that was developed by Shell geologists while working in the
Ouachita Mountain region during the 1980s. LOM values can be converted and
correlated to measured vitrinite reflectance values (Ro) as shown in Figure 5. These
relations combined with features such as hydrothermal quartz veining throughout the
uplifted core region indicate a heating event occurred after or concurrent with the uplift.
High thermal maturity trends disregard stratigraphic boundaries and are measured by the
distribution of high LOM values in shale outcrops that culminate with highest values
closest to the center of the uplift. An example of this later heating event and associated
trend can be measured in shale sequences of the Jackfork. Jackfork exposures that are
proximal to the core uplift contain high LOM values that are nearing greenschist facies
metamorphism. However, the LOM values of Jackfork shale on the north and south
flanks of this uplift can be observed as low as 9 to10, which is in the oil window.
Analysis of twelve (12) Ouachita and Arkoma Basin wells that were drilled outside the
core uplift (high heat flow area) in Arkansas and Oklahoma indicates a reflectance
gradient that corresponds to a geothermal gradient of 1.2 oF/100 ft.
Fair to excellent organic richness values are documented in thick Ordovician
through Pennsylvanian shales (Curiale, 1983). Average total organic carbon (TOC)
11

0.0
5.0
10.0
15.0
20.0
25.0
0 1 2 3 4 5
Vitrinite Reflectance (Ro)
Leve
lofM
atur
ity(L
OM
)
6
OIL COND GAS METAMORPHISM
Figure 5. The conversion relationship between level of maturity (LOM) and vitrinite reflectance (Ro).
values in subsurface Lower Paleozoic sequences range from 0.77% to 1.06% (Figure 2).
In Arkansas, natural gas is the most likely hydrocarbon that is present in the Paleozoic
sequence due to (1) the higher LOM values that are documented in the shales throughout
much of the project area and (2) because of the abundance of humic rich kerogen in the
Carboniferous section. Paleozoic oil is likely in the western most portions of the
Ouachitas which have experienced less heating. Crude oil has been produced from
Stanley and Arkansas Novaculite at the Potato Hills region and at Isom Springs field in
Atoka County, Oklahoma.
12

Shell also examined the source rock quality of the shales in the Rex Timber well.
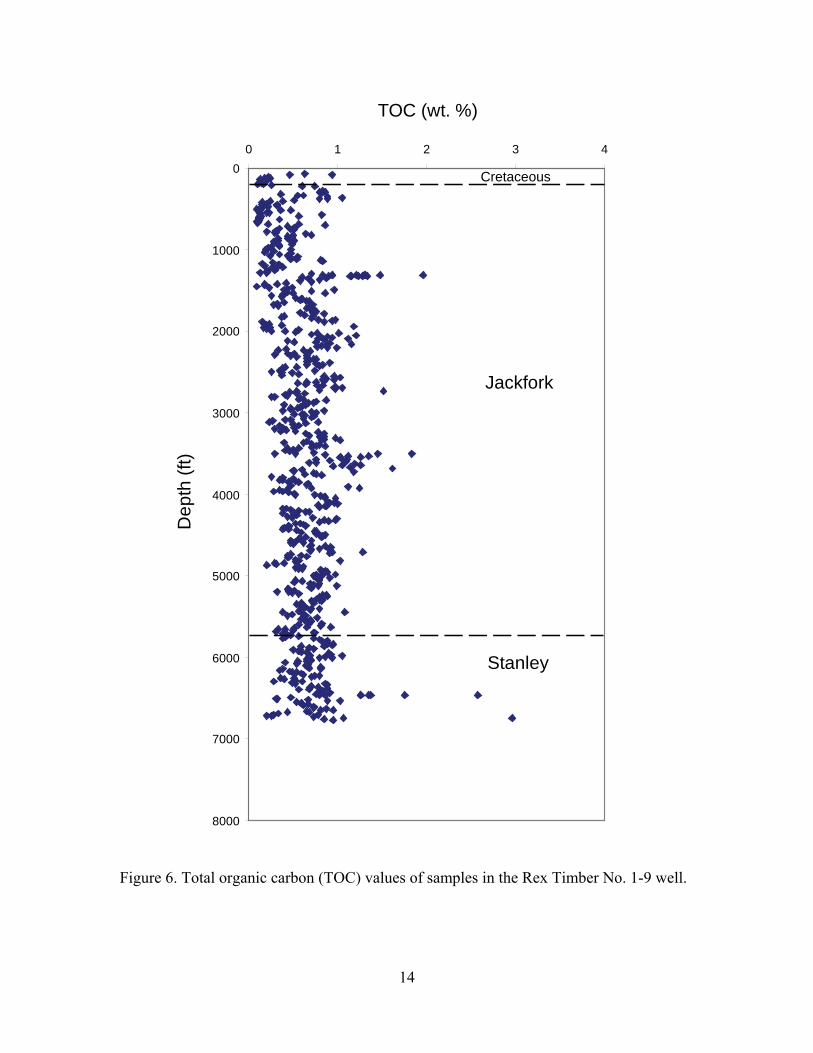
TOC analyses were conducted on ten-foot intervals of ditch cuttings (Figure 6 and
Appendix 1). The definition of a source rock is herein characterized by a total organic
richness of equal to or greater than one percent. As defined, both the Jackfork and
Stanley have qualified source rock intervals. The Jackfork had eleven source rock
intervals over one percent. The richest value of 1.96% was measured in a core at 1,311 ft
(400 m). The Stanley had three source rock intervals with the highest TOC value of
2.96% at 6,730-40 ft (2,051-54 m). A determination could not be made regarding the
type of organic material, whether lipid or humic rich, due to the high thermal maturity
(LOM) of the kerogen (Table 1). However, Shell had observed that Stanley and Jackfork
shales in Oklahoma with corresponding to lower maturity values contained mostly humic
organic matter. Because of a similar depositional environment for these Carboniferous
sediments, it was assumed that the shales in the Rex Timber are likely to contain humic
organic matter as well. Since humic source rocks generate only gas, a question arose
pertaining to the source of the solid hydrocarbons (thermally altered oil) that were
identified in the Carboniferous section drilled in the Rex Timber well. It is assumed that
the source of the solid hydrocarbons must be from lipid source rocks in the lowermost
Stanley and in the Arkansas Novaculite.
The thermal maturity of the shales in the Rex Timber well was also determined by
analysis of vitrinite reflectance values. Pre-drill predictions of thermal maturity closely
matched the measured results. The top of the Jackfork sequence in the Rex Timber well
has an LOM value of 14 that is approximately equivalent to a vitrinite reflectance value
of Ro = 2.0%; whereas, at a total depth of 6,765 ft (2,062 m) the corresponding LOM
13
0
1000
2000
3000
4000
5000
6000
7000
8000
0 1 2 3 4
Jackfork
Stanley
Cretaceous
TOC (wt. %)
Dep
th (f
t)
Figure 6. Total organic carbon (TOC) values of samples in the Rex Timber No. 1-9 well.
14

Table 1. Thermal maturity level and visual kerogen type analyses for Rex Timber No. 1-9 well.
Depth Ro LOM(ft) (%) B KI V I
280-300 2.03±0.04 13.9-14.3 40 35 25600-610 1.94±0.01 13.7 10 45 45700-720 2.03±0.03 13.2-14.2 15 70 15710-730 2.02±0.03 13.9-14.2 <1 30 40 30
1000-1010 2.01±0.03 13.9-14.3 25 50 251120-1140 2.17±0.04 14.6-14.9 30 40 301311-1312 2.08±0.03 14.2-14.5 5 65 20 101600-1630 2.08±0.04 14.2-14.5 <1 35 50 151840-1870 2.27±0.03 15.1-15.4 2 35 53 102030-2070 2.31±0.04 15.3-15.7 2 43 40 152360-2400 2.21±0.04 14.8-15.2 1 34 45 202570-2600 2.32±0.05 15.3-15.7 <1 35 50 152840-2880 2.29±0.02 15.2-15.5 55 25 203280-3330 2.40±0.08 15.5-16.2 <1 60 15 253510-3600 2.23±0.01 15.0-15.1 10 35 30 253670-3680 2.36±0.02 15.6-15.8 <1 45 43 123900-3920 2.38±0.02 15.7-15.8 <1 44 44 124290-4330 2.45±0.02 15.0-15.2 43 42 154480-4520 2.34±0.02 15.5-15.7 1 20 69 104570-4580 2.56±0.47 14.0-16.5 1 98 14650-4700 2.36±0.03 15.6-15.8 <1 10 65 255000-5040 2.64±0.05 16.6-16.9 <1 10 82 85510-5530 2.57±0.04 16.4-16.7 1 3 86 10
6100-6150 2.85±0.02 17.3-17.4 <1 30 50 206459-6460 2.98±0.17 17.1-17.8 <1 30 40 30
B=Solid HydrocarbonKI=Micrinized KerogenV=VitriniteI=Inertinite
Visual Kerogen
Jackfork
Stanley
value for the upper Stanley is 17.6, equivalent to Ro = 3.0% (Figure 4 and Table 1). This
reflectance gradient is equivalent to about 1.2 oF/100 ft which is the same for wells
regionally (Western Ouachitas and Arkoma Basin) that experienced heating by normal
15

burial processes. If the well had been drilled to the proposed depth of 10,000 ft (3,048 m),
then the predicted Ro value would have been 4.65% with a corresponding LOM value of
19.7. The level of heating that these rocks would experience is very high and there was
concern that compaction and cementation would have reduced the porosity to essentially
zero. However, it is noteworthy to consider that there are reservoir analogues in the
adjacent Arkoma Basin that possess high LOMs. Shell had identified producing fields in
the Arkoma Basin where the production interval has an LOM of just over 18 from
Morrowan sandstone (e.g. Gulf-Hombre S13-T8N-R26W). Although these relations
were well understood, it was determined before the well was spudded that Shell would
stop the well short of the 10,000 ft (3,048 m) proposed total depth if unacceptable
porosity was encountered while drilling.
Depositional Environment
Deepwater Elements and Terminology
Deepwater refers to sediments deposited in water depths greater than 1,500 ft
(457 m), i.e., those under gravity flow processes that occur below storm wave base
(Weimer and Slatt, 2004). In a deepwater turbidite system, clastic sediments are
transported beyond the shelf edge into deep water by sediment gravity flow processes and
are deposited on the continental slope and in the basin. Bouma (2000) has developed a
depositional model for fine-grained turbidites based partially upon his work on the
Jackfork Formation. This model is composed of confined channels on the slope, levee
channels near the toe of slope, and unconfined sheet sands on the basin floor.
16

Channels and their associated channel fills develop on the slope, at the toe of
slope, and on the basin floor. On the slope, they develop in confined settings such as
intraslope basins or submarine canyons. Channel morphology and position within a
turbidite system are controlled by depositional processes and are primarily erosional or
depositional in origin (Mutti and Normark, 1991). Levee-overbank sediments consist
predominantly of mud, but are also composed of thin-bedded sands. Thin-bedded sands
are ideal stratigraphic traps owing to their lateral wedging and thin interbedding of sand
and mud and sometimes have excellent porosity and permeability (Weimer and Slatt,
2004). Sheet sands are deposited at the termini of channels in an unconfined setting.
They tend to have simple reservoir geometries: good lateral continuity, potentially good
vertical connectivity, high net:gross (sand/shale) ratios, narrow range in grain size (and
thus greater porosity and permeability), and few erosional features (Weimer and Slatt,
2004).
Outcrop Analogs and Well Log Interpretation
Outcrop exposures were used as an analog for pre-drill forecasting of the
depositional environments of the targeted sandstone sequence in the Rex Timber well.
Shell’s interpretations were similar to others published on the Stanley and Jackfork where
the overall depositional environment is characteristic of an ancient deepwater submarine
fan (turbidite) deposit (Morris, 1977a; Coleman, 2000; Slatt et al., 2000). Core samples
from the well provided important downhole information, but were of little help in
reconstructing the depositional environment due to a lack of intercepted sandstone or a
lack of logs available through the cored interval.
17
Dual induction logs can be used as a tool to suggest the types of depositional
environments. Analysis of resistivity logs in the Rex Timber well demonstrates several
common log shapes that have been suggestive of distinct depositional environments.
There are five main characteristic log shapes identified in the Jackfork and Stanley
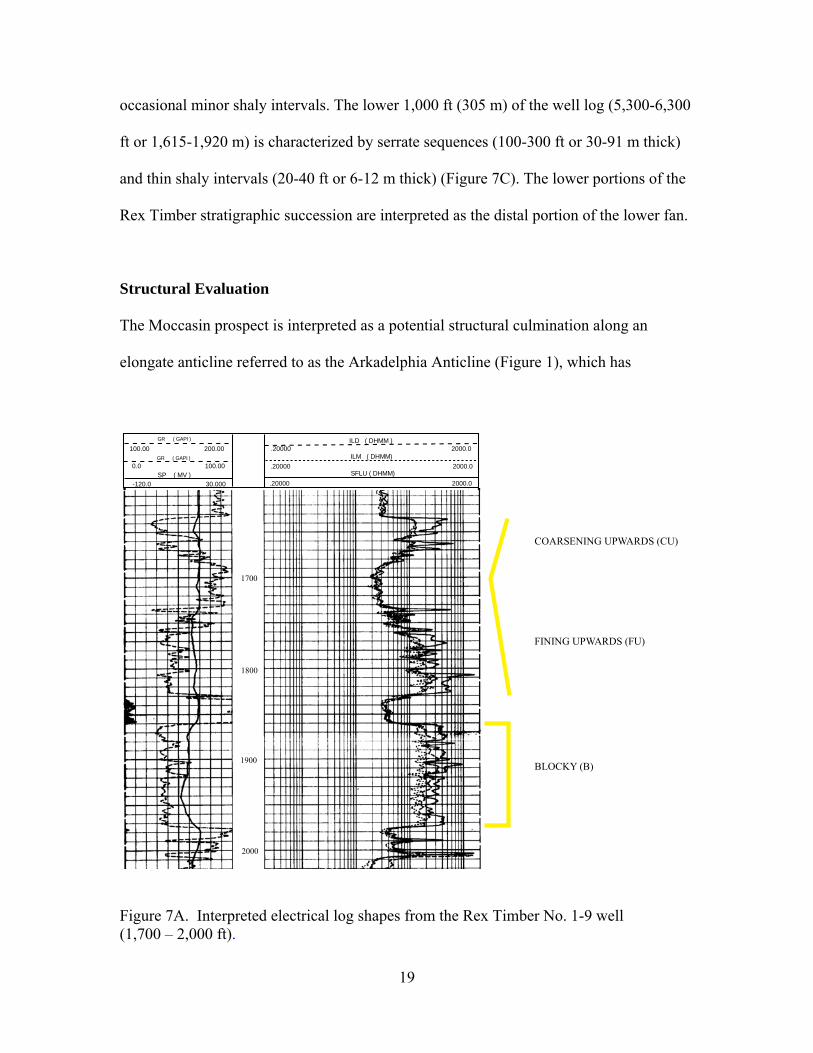
Formations which are illustrated in Figures 7A-C. The shaly log signature seems to
correlate to either the pelagic or distal (4B) facies of Morris (1977a). The serrate package
of thin interbedded sands and shales are similar to Morris’ (1971) distal facies or
Walker’s (1978) lower fan facies. Selly (1978) regarded coarsening upwards successions
as distal turbidite fan sequences and placed fining upwards sequences into a proximal
turbidite setting. Walker (1978) places coarsening upwards sequences either in the lower
fan or on the smooth portion of suprafan lobes (mid-fan). Walker’s fining upwards
sequence is indicative of the channeled portion of suprafan lobes. The blocky sequences
are characteristic of thick channel fill deposits (Selly, 1978). Walker (1978) also shows a
model of a submarine fan and some, but not all, of the environments of the observed log
shapes could be correlated with the Rex Timber well.
The upper 1,000 ft (305 m) of the Rex Timber well consists predominantly of
blocky sandstones defining substantial channel fill characteristic of upper fan or
uppermost mid-fan (Figure 7A). From 1,000 to 4,000 ft (305 to 1,219 m), the blocky log
shapes (30-150 ft or 9-46 m thick) are interbedded with both fining and coarsening
upwards sequences (40-150 ft or 12-46 m and 30-150 ft or 9-46 m thick, respectively).
These relations are interpreted as a series of prograding, overlapping suprafans. Lower
fan deposits are present on the log from 4,000 to 5,300 ft (1,219 to 1,615 m), and consist
of coarsening upwards sequences (50-250 ft or 15-76 m thick) that are interbedded with
18
occasional minor shaly intervals. The lower 1,000 ft (305 m) of the well log (5,300-6,300
ft or 1,615-1,920 m) is characterized by serrate sequences (100-300 ft or 30-91 m thick)
and thin shaly intervals (20-40 ft or 6-12 m thick) (Figure 7C). The lower portions of the
Rex Timber stratigraphic succession are interpreted as the distal portion of the lower fan.
Structural Evaluation
The Moccasin prospect is interpreted as a potential structural culmination along an
elongate anticline referred to as the Arkadelphia Anticline (Figure 1), which has
1700
1800
1900
2000
COARSENING UPWARDS (CU)
FINING UPWARDS (FU)
BLOCKY (B)
GR ( GAPI )
100.00 200.00GR ( GAPI )
SP ( MV )0.0 100.00
-120.0 30.000
ILD ( DHMM )
ILM ( DHMM)
SFLU ( DHMM)
.20000 2000.0
.20000 2000.0
.20000 2000.0
Figure 7A. Interpreted electrical log shapes from the Rex Timber No. 1-9 well (1,700 – 2,000 ft).
19

steeply dipping flanks of 60-65o. This projected anticline is exposed west of the
Moccasin prospect and is thrusted northward over the Chalybeate Syncline. An eastern
2700
2800
2900
3000
3100
3200
BLOCKY (B)
FINING UPWARDS (FU)
COARSENING UPWARDS (CU)
GR ( GAPI )
100.00 200.00GR ( GAPI )
SP ( MV )0.0 100.00
-120.0 30.000
ILD ( DHMM )
ILM ( DHMM)
SFLU ( DHMM)
.20000 2000.0
.20000 2000.0
.20000 2000.0
Figure 7B. Interpreted electrical log shapes from the Rex Timber No. 1-9 well (2,640 – 3,200 ft).
20

Figure 7C. Interpreted electrical log shapes from the Rex Timber No. 1-9 well (5,250 – 5,950 ft).
21

plunge may exist for the Arkadelphia anticline in the Moccasin prospect area based on
projection of bedding attitudes into the subsurface (Figure 1). This anticline is truncated
on its eastern edge by the Decipher fault that turns southward before being covered by a
Cretaceous unconformity. The Decipher fault is thought to provide a potential sealing
element on the western edge of the Arkadelphia anticline. There is no information from
seismic surveys to confirm this directly or to document a plunge in either an east or west
direction for the Arkadelphia anticline penetrated by the Rex Timber well. If there were
more evidence to suggest a plunge direction, then more support would exist for a
structural culmination on the anticline. It is Shell’s opinion that there are many more
structural complications at depth along the anticline at the Rex Timber well site based on
surface geological relations; however, the seismic surveys show only a relatively simple
upright fold that is associated with a single thrust fault (Figure 8).
The subsurface evidence generated from the Rex Timber well supports
confirmation of the structural interpretation of the Moccasin prospect. Based on dip
meter and borehole televiewer data (BHTV), the dominant dip in the borehole is to the
north, which at least confirms the critical north dip, an essential component of the trap. A
significant amount of information about fracture patterns within the structure was also
obtained from the BHTV survey, which is compiled in an internal Shell report. The
detailed results of the fracture survey are not presented herein and contain some elements
of existing confidentiality.
22

Borehole Televiewer Analysis
The Borehole Televiewer (BHTV) was a common geophysical tool used during
the 1980s when the Rex Timber well was drilled and provided detailed image data such
as bed dips, fracture patterns and rock density. The BHTV is an acoustic logging tool
conveyed by a logging cable and images the rock in the borehole. Originally developed in
the research lab at Mobil in the 1960’s, it was used only sparingly before losing company
support. In the 1970’s Amoco, then later Shell began to redevelop, upgrade, and use this
tool more readily. By 1981 the upgraded version of the BHTV viewer was more readily
used by Shell for down hole logging applications. As the BHTV detects relative
differences in impedance along the borehole, an image is produced on paper in which the
sonic variance of the rock is produced in sixteen (16) shades of gray.
The Ouachita Mountains are structurally complex and bedding orientations in
well bores cannot be distinguished from fracture orientations with a typical resistivity
contrast dipmeter. The dipmeter measures fractures as well as bedding and may show
60-100 ft (18-30 m) gaps between readings. In contrast, the BHTV presents a continuous
image of the borehole and allows bedding to be distinguished from fractures. For these
reasons, the BHTV log was used to determine fracture orientations, fracture densities and
bedding orientations in the Rex Timber well. In addition, small-scale folding
(wavelengths <100 ft or 30 m) and small displacement thrust faulting were also
documented in the well bore. Eighteen drilling breaks were correlated to major sandstone
to shale lithologic boundaries and thin sandstone lenses were observed in shales of the
Jackfork Formation. Dense, high velocity sandstones, limestones and dolostones tend to
reflect high amplitude signals and appear light-colored on the BHTV log presentation.
23

24
CR
ETA
CE
OU
SA
TO
KA
JO
HN
SV
ALLE
YJA
CK
FO
RK
STA
NL
EY
AR
KA
NS
AS
NO
VA
CU
LIT
EP
RE
-A
RK
AN
SA
S N
OV
AC
ULIT
E
KP
aP
jvP
j
Ms
MD
a
1 M
ILE
KP
aP
aP
jv
Pjv
Pjv
Pj
Ms
Ms
Ms
Ms
Pj
MD
a
1.0
2.0
3.0
4.0
0.0
0’
SW
EP
I Rex
Tim
ber N
o. 1
-9
T.D
. 6765’
DE
PT
H (F
T)
900
600
700
800
10
00
11
00
TIM
E (S
EC
)
DIP
LIN
E 8
3-5
06-2
334
MIG
RA
TE
D
5000’
15
,00
0’
10,0
00’
Pj
S N
Fig
ure 8
. Seism
ic line 8
3-5
06-2
334 (m
igrated
stack) d
isplay
ing a d
ip sectio
n o
f the M
occasin
pro
spect.

Less dense, lower velocity shales tend to reflect low amplitude signals and appear dark-
colored. Areas of borehole caving and open fractures also reflect low amplitude signals
and appear dark-colored.
Fractures on the borehole televiewer display have more irregular orientations and
spacing than bedding and the fractures cross-cut bedding at high to low-angles (Figure
9A). High-angle fractures are better resolved than low-angle fractures using the BHTV
because of the greater trough to crest distance (Figure 9B). Open fractures are most often
observed on the BHTV display because calcite or quartz filled fractures reflect high
amplitude signals.
Open fractures are observed in the brittle sandstone lithologies throughout the
well. Both the upper Stanley and the lower Jackfork contain numerous sandstone beds,
with the Jackfork dominated by sandstone successions. Abundant and randomly oriented
high-angle (>50o) extension fractures are observed in the upper Jackfork. Low-angle (20-
50o) shear fractures are localized into clusters in the lower interval of the well. These
clusters are separated by zones of undeformed sandstone (Figure 9C).
The change in fracture orientation with depth reflects the changing stress field
from extension to compression as the well penetrates deeper into the Arkadelphia
anticline. Dieterich and Carter (1969) studied the orientation of the stress field for two
dimensional folding of a viscous layer in a less viscous matrix. They determined that the
direction of most compressive stress (σ1) is parallel to bedding prior to folding. As
folding is initiated and continues the σ1 direction rotates to a higher angle relative to the
limbs and the outer hinge of the folded layer. The σ1 direction remains parallel to bedding
in the core of the folded layer throughout folding (Figure 9D). This orientation of the
25

B
LAF
B
3140
3150
Figure 9A. Low-angle fractures (LAF) and bedding (B).
26

LAF
HAF
B
4820
4830
Figure 9B. Low-angle fractures (LAF) and high-angle fractures (HAF).
27

FC3370
3380
Figure 9C. Fracture cluster (FC) with undeformed sandstone above and below.
28

Figure 9D. Lines drawn parallel to the direction of maximum compressive stress (σ1)
during folding (modified from Dieterich and Carter, 1969).
29

stress field produces extension on the outer hinge and limbs and compression in the core
of the fold. Hobbs et al. (1976) experimentally deformed a block of Solenhofen
Limestone and determined the orientation of fractures relative to the σ1 direction. Their
results showed that conjugate shear fractures and extension fractures form when σ1 is
parallel to bedding and normal to bedding, respectively. These results also confirm the
field observations of Stearns (1968) on the orientation of fractures that form by folding.
Using the structural models from the authors cited above, the fracture orientations
observed in the Rex Timber well are explained by the orientation of the stress field
during folding. High-angle extension fractures are dominantly observed above 2,684 ft
(818 m) in the well and low-angle shear fractures are prevalent below 2,684 ft (818 m).
These changes in fracture orientation reflect the rotation in the σ1 orientation from
dominantly normal to bedding above 2,684 ft (818 m) to dominantly parallel to bedding
below 2,684 ft (818 m) in the well.
Bedding throughout the interval of 1,271-2,229 ft (387-679 m) shows dips of 30
to 50o northwest to northeast. A zone of small-scale folding above a thrust fault was
observed within the interval of 2,299-2,397 ft (701-731 m). The beds in this interval
showed north, vertical and south dips (Figure 9E). The changes in bedding orientation
were gradual throughout the rest of the interval of 2,397-6,324 ft (731-1928 m) and dips
ranged from 40-50o northeast to northwest. Lenticular bedding was also observed in the
Jackfork Formation (Figure 9F). These thin sandstone lenses suggest small suprafan
lobes, which may have been deposited on a mid submarine fan by turbidity currents.
30

Figure 9E. Interval of 2,299-2,397 ft (701-731 m) showing fold above a thrust fault (F).
31

3110
3120L
L
L
Figure 9F. Lenses (L) of Jackfork sandstone in shale.
32
Sandstone Petrology
General Discussion
Shear (2006) studied Jackfork outcrops in an inactive gravel quarry located north
of Highway 7 near the De Gray Lake spillway in Clark County, Arkansas. The Rex
Timber well is approximately 7 mi (11 km) south of Shear’s study area.
The Jackfork Formation is subdivided into upper, middle, and lower parts in this
area of Arkansas. Based on the work of Slatt et al. (2000), the lower Jackfork is a
mixture of amalgamated and layered sheet sandstones and interbedded, lenticular,
channel sandstones. The middle Jackfork is interpreted as channel-fill sandstones with
associated levee/overbank deposits at its base. The upper Jackfork has two different
depositional sequences of lowstand deposits, with two associated sequence boundaries.
The sandstones in the upper Jackfork outcrops contain a high concentration of
quartz cement. The middle Jackfork sandstones contain a high concentration of clay in
the matrix with few quartz overgrowths. The matrix consists primarily of kaolinite,
which is more easily dissolved and eroded than quartz cements and thus is the cause of
friability in the middle Jackfork sandstones. On average, the sandstones in the middle
Jackfork are 17% more friable than the upper Jackfork, and contain 12% more
unconsolidated zones than the upper Jackfork.
Shear (2006) also correlated outcrops from his study area to the Rex Timber well
for comparison of petrologic characteristics of the Jackfork. Friability was identified at
depths between 2,700 and 5,000 ft (823 and 1,524 m). Within the middle Jackfork, 58%
of the total sandstones range from slightly friable to unconsolidated, while 41% of the
upper Jackfork sandstones range from slightly friable to unconsolidated according to
33

Shear (2006). Subsurface friability can also be inferred by noting intervals of increased
drilling rates, and increase in grain size and by the evaluation of mud logging notes that
describe friability and hardness of cuttings.
Natural gas is generally thought to be held in fractures associated with the
cemented sandstones (Garich, 2004). However, the friable middle Jackfork sandstones in
Arkansas may be an untapped gas reservoir (Shear, 2006). Garich (2004) and Romero
(2004) found that friable sandstones are interpreted to have been deposited in a
channelized environment, as opposed to cemented sandstones deposited as sheets. These
relations suggest that the identification of channelized environments in well logs can help
locate similar friable sands.
Petrographic Analysis of Well Samples
Well samples that contain special characteristics (presence of hydrocarbons,
porosity, etc.) were selected for thin section analysis by Shell. Sixty-two (62) thin
sections made from ditch cuttings and representative of the well from surface to total
depth were compiled. Luminescence petrography was employed primarily to
differentiate between the effects of authigenic quartz overgrowths and quartz pressure
solution. Shell also used scanning electron microscopy (SEM) to study the types of
cements in the sandstones. A number of thin sections were also examined by Energy
Dispersive Analysis of X-rays (EDAX).
Twenty-two (22) thin sections were selected for point counting in order to
statistically determine the composition of the Jackfork and Stanley sandstones. The
down-hole depth of the samples range from 520 to 6,390 ft (158 to 1,948 m). For each
34

thin section, Shell petrographers counted 300 points to tabulate Appendix 2 in the fashion
described by Van der Plas and Tobi (1965).
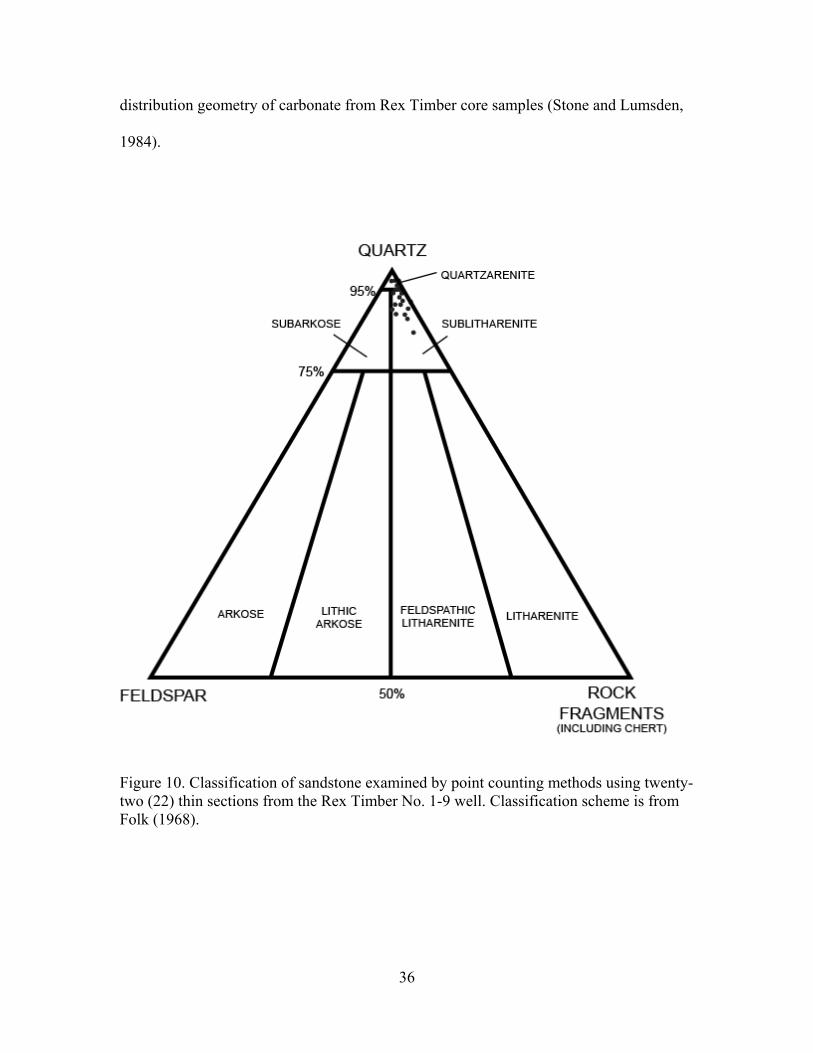
The upper (520-1,440 ft or 158-439 m) Jackfork sandstones are quartz arenites
and the remaining sandstones are sublitharenites (Figure 10). The lithic components
consist primarily of sedimentary and metamorphic fragments. The sedimentary
fragments consist primarily of chert and shale, whereas the metamorphic fragments are
mica schist. The feldspars include both K-feldspar and plagioclases. The percentage of
rock fragments and feldspars illustrate an overall increase with depth (Figure 11).
Clay concentrations also increase with depth (Figure 11); however, there is no
attempt in this project to differentiate between detrital and authigenic clays. Carbonate
content shows no linear relationship with depth (Figure 11). The most interesting aspect
about the carbonate content is the high concentrations identified in the well in
comparison with information in published literature. Carbonate content of only 0 to 3%
was reported for Jackfork sandstone from outcrops in southern Arkansas, whereas
average carbonate content of 6.29% was documented in the Rex Timber well (Morris,
1977b; Morris et al., 1979; Stone and Lumsden, 1984). These relations suggest that
surface leaching of the carbonates has likely occurred. This may be the primary reason
that porosities from outcrop samples appear to contain good reservoir potential for the
Jackfork and Stanley, which has yet to be encountered in the subsurface. In fact, the
average carbonate content of 6.29% observed in the Rex Timber well is very close to the
average amount of porosity (8.45%) in Jackfork outcrops surrounding the Moccasin
prospect. Additionally, the pore geometries in Jackfork outcrops are very similar to the
35
distribution geometry of carbonate from Rex Timber core samples (Stone and Lumsden,
1984).
Figure 10. Classification of sandstone examined by point counting methods using twenty-two (22) thin sections from the Rex Timber No. 1-9 well. Classification scheme is from Folk (1968).
36

0
1000’
2000’
3000’
4000’
5000’
6000’
TD 6765’
DEPTHSAMPLE
INTERVAL
ROCKFRAGMENTS
ANDFELDSPAR
0 % 15 % 0 % 15 %CLAY CARBONATE
0 % 15 %
2X
Figure 11. Constituents of sandstones examined in Rex Timber No. 1-9. Results based on point counts of thin sections from ditch cuttings (300 points per thin section).
37

Diagenesis
The present character of the Jackfork and Stanley sandstones is a consequence of
significant diagenetic change. Diagenesis in addition to compaction within the Jackfork
and Stanley sandstones of the Rex Timber has resulted in porosity destruction. The
initial process of physical compaction of the sands resulted in diminishing the primary
porosity as evidenced by long grain and concavo-convex grain contacts with some
interpenetrative fabric. The most significant and detrimental diagenetic effect in the
sandstones is pervasive silicification. This ubiquitous induration effect destroyed much
of the primary porosity and may have inhibited the migration of fluids, which are
necessary for the later creation of secondary porosity. The predominance of sutured
detrital quartz grains, planar and concavo-convex detrital grain contacts, and a paucity of
syntaxial quartz overgrowths suggest that most of the silica induration is due to pressure
solution processes. Detrital quartz is differentiated from authigenic quartz (syntaxial
overgrowths) by luminescence petrography (Plate 2). The lack of authigenic quartz
development may have been due to silica under saturated pore fluids. In addition, most
overgrowths are associated with poorly packed, elongate quartz grains. The pressure
solution process may have resulted in the destruction of the intergranular porosity
between equant shaped grains quicker than porosity that is associated with the elongate
grains. Pore fluids would then have been enriched with silica allowing precipitation of
authigenic quartz in the remaining pore spaces now restricted to areas with elongate
grains and poor primary packing.
The process of pressure solution is the result of overburden pressure created by
continued sedimentary loading or the compressional effects of tectonism. Extensive
38

Plate 2. Photomicrographs and petrographic descriptions. A) 5,040 – 5,050 ft (1,536 –1,539 m): Planar and concave-convex grain contacts (80X, crossed nicols). B) 5,040 – 5,050 ft (1,536 –1,539 m): Arrows point out very dull luminescence of quartz overgrowths. Rounded to sub-rounded detrital grains display brighter red and blue luminescence (80X, luminescence). C) 2,370 – 2,380 ft (722 – 725 m): Quartz displaying sutured, planar and concave-convex grain contacts (80X, crossed nicols). D) 2,370 – 2,380 ft (722 – 725 m): Contacts are between detrital grains, not the interfacing of syntaxial quartz overgrowths. Note absence of dark, nonluminescent authigenic quartz at arrows. (80X, luminescence). Bar scales are 0.5 mm.
39

fracturing is associated with the formation of the anticlinal structure drilled by the Rex
Timber well. These fractures cut through detrital grains, grain contacts, and cements
(Plate 3A). This cross-cutting relationship dates these pressure solution effects as pre-
fracture, therefore, pre-structure formation.
Pressure solution of grains was inhibited in numerous samples. Detrital clays
initially inhibited grains from undergoing pressure solution. Other inhibiting agents
include early authigenic quartz, clay cements, and carbonate cements. Although these
pressure solution inhibitors do exist, most of these minerals resulted in the filling of
primary pores (Plate 3B, C, and D).
Alteration and dissolution of feldspars and rock fragments also occurred as the
grains converted to clays, usually kaolinite (Plate 8A, B). As a result of high levels of
compaction and pressure solution, these more labile grains had smeared the rock
fragment around more rigid grains, effectively destroying still more intergranular
porosity (Plate 4A).
Fracture cementation also occurred in the sandstones further reducing the
reservoir potential. Potential for fracture porosity was greatly reduced by authigenic
quartz cementation and later carbonate cementation. The only intragranular porosity is
secondary in nature and is observed to be filled with late authigenic clay and quartz (Plate
4C, D).
In addition to the destructive diagenetic events in the Rex Timber well, there are
several processes that made some, but small amounts of secondary porosity. They
include the alteration and replacement of the original constituents of the rocks. The most
important of these is the introduction of carbonates as a replacement material.
40

Plate 3. Photomicrographs and petrographic descriptions. A) 1,530 – 1,540 ft (466 – 469 m): Quartz filled fracture cutting through grains, sutured contacts and cement (25X, plain light). B) 5,210 – 5,220 ft (1,588 – 1,591 m): Detrital clay inhibiting pressure solution and filling pores (100X, plain light). C) 4,670 – 4,680 ft (1,423 – 1,426 m): Clay cement (chlorite) inhibiting pressure solution and filling pores (100X, plain light). D) 2,620 – 2,630 ft (799 – 802 m): Alizarin red stained calcite cement (C), with quartz grains (Q) being replaced by siderite (S) (100X, plain light). Bar scales are 0.5 mm.
41

Plate 4. Photomicrographs and petrographic descriptions. A) 3,790 – 3,800 ft (1,155 – 1,158 m): Deformed metamorphic rock fragment. Bar scale is 0.1 mm (250X, crossed nicols). B) 3,508 ft (1,069 m): Carbonate filled fracture cross-cutting quartz-filled fracture (25X, plain light). C) 1,480 – 1,490 ft (451 – 454 m): Rhombohedral intragranular porosity filled with clay (100X, crossed nicols). D) 1,480 – 1,490 ft (451 – 454 m): Apparent rhombohedral intragranular porosity filled with quartz (100X, crossed nicols). Bar scales for B, C and D are 0.5 mm.
42

The carbonate content of the sandstones in the Rex Timber well varied
considerably. The average amount of carbonate determined by petrographic examination
is 6%, and ranged from 1 to 15%. The presence of carbonate would potentially enhance
the creation of secondary porosity creation as carbonate cement is more easily dissolved
than silica (note: outcrop porosities are greater due to surface leaching). The most
dominant carbonate observed in the Stanley and Jackfork sandstones is siderite (FeCO3).
Calcite cement and dolomite are present in minor amounts (Plate 3D and Plate 8C). An
EDAX elemental spectrum displayed siderite as prominent in iron peaks and is absent in
calcium peaks (Figure 12). Siderite is a widespread replacive agent, occurring with
quartz, feldspar and chert (Plate 5) and is also observed as very fine-grained crystalline
cement (Plates 6C, D). This cement may be a secondary pore-filling material or a
replacement of an earlier clay cement (Plate 6A, B). In some samples, siderite has clearly
replaced the earlier carbonate. Blade-shaped crystals of siderite are observed filling
dolomitic fractures (Plate 8D). The EDAX elemental spectrum analysis showed a
definite increase in iron and decrease in calcium adjacent to the siderite crystals
suggesting that the dolomite was converted to siderite (Figure 12).
The source of the carbonate is not easily determined. Within the Ouachita
stratigraphic section there are no significant limestones in proximity to the Jackfork and
Stanley Formations to allow the redistribution of carbonates. The shales penetrated by
the Rex Timber well are not calcareous. Therefore, the water expelled during
compaction of the shales was probably undersaturated with carbonate. The most
plausible source for carbonate is the dissolution of carbonate skeletal grains. Fragments
of bryozoans and other unrecognizable fossil fragments are observed in minor amounts in
43

Plate 5. Photomicrographs and petrographic descriptions. A) 1,480 – 1490 ft (451 – 454 m): Quartz replaced by siderite (100X, crossed nicols). B) 5,210 – 5,220 ft (1,588 – 1,591 m): Quartz replaced by siderite (250X crossed nicols). C) 3,860 – 3,870 ft (1,177 – 1,180 m): Feldspar being replaced by siderite (250X crossed nicols). D) 5,300 – 5,310 ft (1,615 – 1,618 m): Rock fragment being replaced by siderite (250X crossed nicols). Bar scale is 0.5 mm in A and 0.1 mm in B, C and D.
44

Plate 6. Photomicrographs and petrographic descriptions. A) 4,570 – 4,580 ft (1,393 – 1,396 m): Siderite replacing cement (clay?) (100X, plain light). B) 4,570 – 4,580 ft (1,393 – 1,396 m): Same as A (100X, crossed nicols). C) 4,670 – 4,680 ft (1,423 – 1,426 m): Siderite present as a very fine, crystalline cement (100X, plain light). D) 4,670 – 4,680 ft (1,423 – 1,426 m): Close up of siderite cement (250X, crossed nicols). Bar scale is 0.5 mm in A, B and C, and 0.1 mm in D.
45

thin section (0-1%) (Plate 7). Some pores filled with anthraxolite (thermally dead oil) are
fossil moldic, indicating the definite dissolution of skeletal carbonates (0-1%) (Plate 7C,
D). All the fossil fragments have been converted to siderite. Siderite formed because the
pore fluids were probably undersaturated with Ca2+ but enriched with Fe2+. Furthermore,
pyrite is commonly observed in thin sections which also indicate availability of Fe2+.
The final type of diagenesis to be addressed is that which created the only
porosity measured today, which is secondary porosity. Pressure solution and other
destructive processes destroyed most of the primary porosity in Jackfork and Stanley
sandstones. Secondary porosity is observed in the following two forms: (1) open pores,
and (2) pores filled with solid hydrocarbons (anthraxolite) representing paleoporosity.
The majority of pores appear to be the result of grain dissolution. Pore geometries
provide clues to the type of grains removed. Rhombohedral pores are indicative of
carbonate dissolution (Plate 9C, D). Other pores filled with anthraxolite have partially
rhombohedral pores (Plate 10A, B). Simple, rounded pores resembled any number of
grain types (Plate 9 A, B). However, they could also be due to the dissolution of
carbonate as indicated by the shape of altered fossil fragments (Plate 10 C, D). Based on
the shape of pores filled with solid hydrocarbons, the majority of the paleoporosity is
most likely due to the dissolution of fossil fragments and carbonate filled pores (Plate 11).
The amount of porosity due to the dissolution of rock fragments, feldspar, and
quartz appears to be minimal. All observed porosity could be explained by carbonate
dissolution. Partially corroded or removed rock fragments and feldspars were not
observed. They were altered to clay or replaced by carbonates. Quartz does not show
46

Plate 7. Photomicrographs and petrographic descriptions. A) 1,530 – 1,540 ft (466 – 469 m): Abraded bryozoan fragment, altered to siderite (100X, crossed nicols). B) 3,100 – 3,110 ft (945 – 948 m): unrecognizable relic fossil fragments, altered to siderite (100X, plain light). C) 1,460 – 1,470 ft (445 – 448 m): Moldic porosity filled with anthraxolite (100X, plain light). D) 1,460 – 1,470 ft (445 – 448 m): Same as C (100X, reflected light). Bar scales are 0.5 mm.
47

Plate 8. Photomicrographs and petrographic descriptions. A) 3,860 – 3,870 ft (1,177 – 1,180 m): Feldspar being replaced by siderite at margins of the grain (250X, plain light). B) 3,860 – 3,870 ft (1,177 – 1,180 m): Same as A, (100X, cross nicols). C) 5,520 – 5,530 ft (1,682 – 1,686 m): Fracture-filled calcite (alizarin red stain) almost completely replaced by dolomite (100X, crossed nicols). D) 5,510 – 5,520 ft (1,679 – 1,682 m): Carbonate fracture fill. The brighter portions are due to iron concentrations. Dolomite is altered to siderite. (20X, SEM back scatter image). Bar scale for A and B is 0.1 mm, and for C and B is 0.5 mm.
48

Plate 9. Photomicrographs and petrographic descriptions. A) 3,370 – 3,385 ft (1,027 – 1,032 m): Secondary porosity formed by grain dissolution (100X, plain light). B) 1,210 – 1,220 ft (369 – 372 m): Porosity formed by grain dissolution (100X, plain light). C) 1,160 – 1,170 ft (354 – 357 m): Rhombohedral moldic porosity partially filled with clay (100X, plain light). D) 3,370 – 3,385 ft (1,027 – 1,032 m): Rhombohedral moldic porosity (100X, plain light). Epoxy is stained blue. Bar scale is 0.5 mm.
49
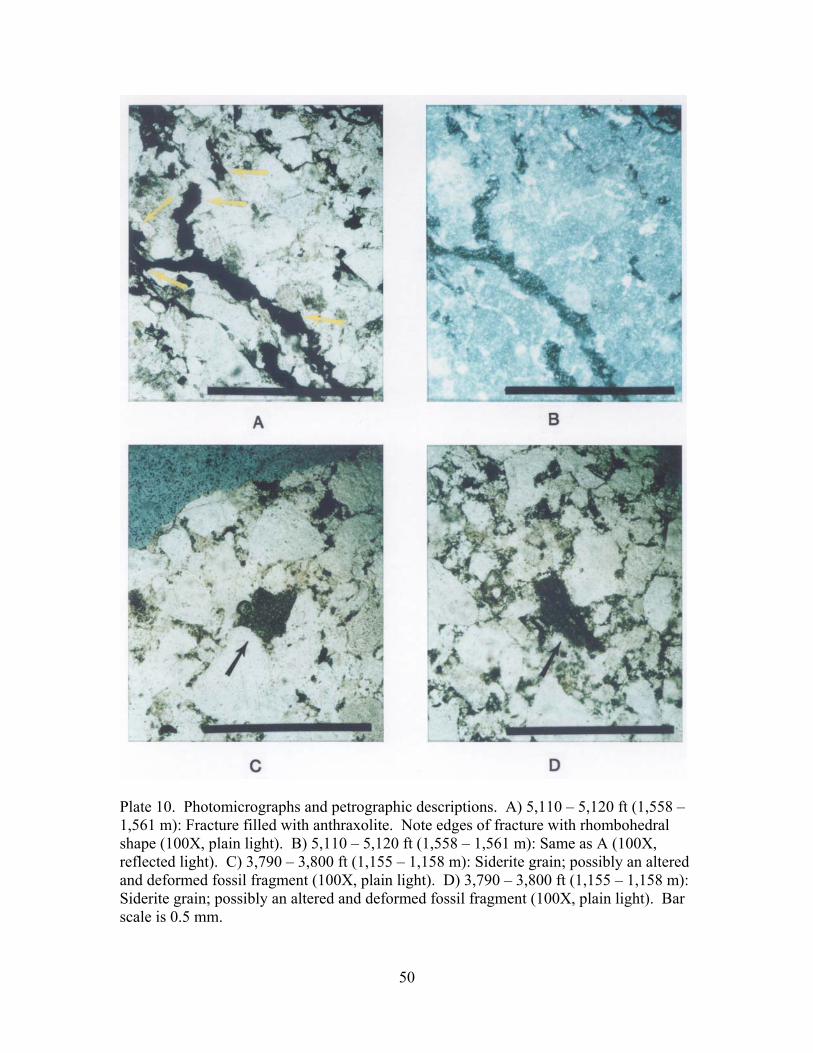
Plate 10. Photomicrographs and petrographic descriptions. A) 5,110 – 5,120 ft (1,558 – 1,561 m): Fracture filled with anthraxolite. Note edges of fracture with rhombohedral shape (100X, plain light). B) 5,110 – 5,120 ft (1,558 – 1,561 m): Same as A (100X, reflected light). C) 3,790 – 3,800 ft (1,155 – 1,158 m): Siderite grain; possibly an altered and deformed fossil fragment (100X, plain light). D) 3,790 – 3,800 ft (1,155 – 1,158 m): Siderite grain; possibly an altered and deformed fossil fragment (100X, plain light). Bar scale is 0.5 mm.
50

Plate 11. Photomicrographs and petrographic descriptions. A) 5,520 – 5,530 ft (1,682 –1,686 m): Moldic porosity filled with anthraxolite. Possibly dissolution of abraded fossil hash (100X, plain light). B) 5,520 – 5,530 ft (1,682 –1,686 m): Same as A (100X, reflected light). C) 1,460 – 1,470 ft (445 – 448 m): Moldic porosity, filled with anthraxolite (100X, reflected light). D) 5,110 – 5,120 ft (1,558 – 1,561 m): Siderite; either fracture fill or altered and heavily deformed fossil fragments (100X, plain light). Bar scale is 0.5 mm.
51

any signs of corrosion other than through replacement by carbonate. The late
geochemistry of the pore fluids seems to favor carbonate dissolution.
Scientific literature have provided numerous discussions regarding the generation
of carbon dioxide and organic acids associated with organic matter maturation and
subsequent dissolution of carbonates (Schmidt and McDonald, 1979; Al-Shaieb and
Shelton, 1981; Surdam et al., 1984). The Ouachita stratigraphy displays an abundance of
organically rich shales (Figure 2). As these shales became thermally mature, they may
have expelled carbon dioxide, which upon mixing with water formed carbonic acid. The
carbonic acid could then easily become the dissolution agent for the carbonate. The
expulsion and migration of oil could easily fill the recently formed pores and would
likely be concurrent with or immediately following the expulsion of carbon dioxide.
Continued burial and heating of the stratigraphic sequence would initiate the cracking of
oils into gas and solid hydrocarbons. In the Stanley and Jackfork sandstones, the
majority of pores are filled with anthraxolite (thermally dead oil) (Plate 12). The close
relationship between the dissolution of carbonate and emplacement of oil can be seen in
Plate 12C and D.
An overall diagenetic history can be summarized as follows. Deposition and
initial compaction of the sand preceded the chemical diagenetic succession and porosity
modification. Minor authigenic quartz and clay cements were formed early. With
additional burial and increased overburden pressure, a pervasive induration of the sand
occurred by pressure solution processes. During this time period, rock fragments were
deformed and feldspars were altered to clay. In the later diagenetic sequence, siderite
began to replace quartz, feldspar, chert, clay and early carbonates. With the maturation
52

Figure 12. EDAX elemental analysis spectrums of selected carbonates in the Rex Timber No. 1-9. Spectrums displayed from thin sections shown on Plate 4B and Plate 7D.
of surrounding and underlying source rocks, carbonic acid was formed and created
secondary porosity by the dissolution of carbonate grains and cements. This was
followed by oil charge. The oil was then cracked to gas. The lack of an adequate seal
resulted in the loss of gas and the presence of pore plugging anthraxolite.
53
Discussion
Assuming adequate charge, timing, and migration scenario, the lack of significant
hydrocarbons in the Rex Timber well appears to be attributed to two main reasons: seal
and reservoir quality. Although brittle fractures can potentially help permeability, it was
determined that the thin shales were not thick enough to block vertical transmissibility of
hydrocarbons from sand to sand out of the trap. Thicker shales were expected to be
encountered in the lower portion of the Stanley, but the well did not penetrate to those
depths. The decision to stop drilling the well short of the 10,000 ft (3,048 m) proposed
total depth was primarily because of poor reservoir development and severe mechanical
problems with the drill rig.
Poor reservoir development is also a more likely reason for not finding
commercial hydrocarbons. Some oil did locally migrate into the Jackfork sands inferring
that some paleoporosity existed for a time. However, significant cementation occurred
due to more burial and heating which “cracked” the oil leaving behind only the solid
hydrocarbon (anthraxolite). Examination of the sandstones in the well showed that low
porosity is characteristic of the Jackfork and Stanley sandstones. Hydrocarbon-filled
pores were formed dominantly by carbonate dissolution that did not develop enough
effective porosity. Based on outcrop analogs, there is adequate potential for the
development of reservoir quality sandstones by the creation of secondary porosity.
Leaching or dissolving of carbonate is well developed at the outcrops by downward
movement of surface waters. In part, the Rex Timber well was a test to determine if
subsurface leaching had occurred and enhanced reservoir potential leaving space
54

available for hydrocarbon entrapment. Finally, the timing of the charge and structural
formation could be another consideration for exploration failure.
References Cited
Al-Shaieb, Z and Shelton, J.W., 1981, Migration of hydrocarbons and secondary porosity
in sandstones: AAPG Bulletin, v. 65, p. 2433-2436.
Arbentz, J.K., 1989, Ouachita thrust belt and Arkoma basin, in Hatcher, R.D., Jr.,
Thomas, W., and Viehle, G.W., eds., The Appalachian-Ouachita Orogen in the United
States: The Geology of North America, v. F-2, Geological Society of America, p. 621-
634.
Bouma, A.H., 2000, Fine-grained, mud-rich turbidite systems: model and comparison
with coarse-grained, sand-rich systems, in Bouma, A.H. and Stone, C.H., eds., Fine-
grained turbidite systems: AAPG Memoir 72 / SEPM Special Publication 68, p. 9-20.
Cline, L.M. and Shelburne, O.B., 1959, Late Mississippian-Early Pennsylvanian
stratigraphy of the Ouachita Mountains, Oklahoma, in Cline, L.M., Hilseweck, W.J., and
Feray, D.E., eds., The geology of the Ouachita Mountains a symposium: Dallas
Geological Society and Ardmore Geological Society, p. 175-208.
55

Coleman, J.L., Jr., 2000, Carboniferous submarine basin development of the Ouachita
Mountains of Arkansas and Oklahoma, in Bouma, A.H., and Stone, C.G., eds., Fine-
grained turbidite systems: AAPG Memoir 72 / SEPM Special Publication 68, p.21-32.
Curiale, J.A., 1983, Petroleum occurrences and source-rock potential of Ouachita
Mountains southeastern Oklahoma: Oklahoma Geological Survey Bulletin No. 135, 65 p.
Dieterich, J.H. and Carter, N.L., 1969, Stress history of folding: American Journal of
Science, v. 267, p. 129-154.
Garich, A.M., 2004, Porosity types and relation to deepwater sedimentary facies of
subsurface Jackfork Group sandstones, Latimer and Le Flore Counties, Oklahoma:
Master’s thesis, University of Oklahoma, Norman, Oklahoma, 94 p.
Hobbs, B. E., Means, W.P., and Williams, P.F., 1976, An outline of structural geology:
John Willey and Sons, New York, p. 326.
Morris, R.C., 1971, Stratigraphy and sedimentology of Jackfork Group, Arkansas: AAPG
Bulletin, v. 55, p. 387-402.
Morris, R.C., 1977a, Flysch facies of the Ouachita trough-with examples from spillway at
De Gray Dam, Arkansas, in Stone, C.G., ed., Symposium on the geology of the Ouachita
Mountains: Arkansas Geological Commission, p. 158-168.
56

Morris, R.C., 1977b, Petrology of Stanley-Jackfork sandstones, Ouachita Mountains,
Arkansas, in Dinkinson, W.R., ed., Tectonics and sedimentation: SEPM Special
Publication 22, p. 120-142.
Morris, R.C., Proctor, K.E., and Koch, M.R., 1979, Petrology and diagenesis of deep-
water sandstones, Ouachita Mountains, Arkansas and Oklahoma, in Scholle, P.A. and
Schulger, P.R., eds., Aspects of diagenesis: SEPM Special Publication 26, p. 263-279.
Morris, R.C., 1989, Stratigraphy and sedimentary history of post-Arkansas Novaculite
Carboniferous rocks of the Ouachita Mountains, in Hatcher, R.D., Jr., Thomas, W., and
Viehle, G.W., eds., The Appalachian-Ouachita Orogen in the United States: The Geology
of North America, v. F-2, Geological Society of America, p. 591-602.
Mutti, E. and Normark, W.R., 1991, An integrated approach to the study of turbidite
systems, in Weimer, P. and Link M.H., eds., Seismic facies and sedimentary processes of
submarine fans and turbidite systems: New York, Springer-Verlag, p. 75-106.
Roberts, M.T., 1982, Chart showing sedimentation rates of the Paleozoic rocks in the
Ouachita Mountains, Arkansas, in Stone C.G., and McFarland, J.D. III, eds., Field guide
to the Paleozoic rocks of the Ouachita Mountains and Arkansas Valley Provinces,
Arkansas: Arkansas Geological Commission Guidebook 81-1, p. 4.
57

Romero, 2004, Identification of architectural elements of turbidite deposits, Jackfork
Group, Potato Hills, Eastern Oklahoma: Unpublished Master’s thesis, University of
Oklahoma, Norman, Oklahoma, 238 p.
Ross, C.A. and Ross, J.R.P., 1988, Late Paleozoic transgressive-regressive deposition, in
Wilgus, C.K., Hastings, B.S., Posamentier, H., Van Wagoner, J.C., Ross, C.A., and
Kendall, C.G. St. C., Sea-level Change: an Integrated Approach: SEPM Special
Publication No. 42, p. 227-247.
Schmidt, V. and McDonald, D.A., 1979, The role of secondary porosity in the course of
sandstone diagenesis, in Scholle, P.A. and Schulger, P.R., eds., Aspects of diagenesis:
SEPM Special Publication 26, p. 175-207.
Selly, R.C., 1978, Ancient sedimentary environment, Ithaca, New York: Cornell
University Press, 287 p.
Shear, 2006, Stratigraphy and petrology of the Cretaceous-Pennsylvanian unconformity
at De Gary Lake: Arkansas: Master’s thesis, University of Oklahoma, Norman,
Oklahoma, 117 p.
Slatt, R.M., Stone, C.G., and Weimer, P., 2000, Characterization of slope and basin facies
tracts, Jackfork Group, Arkansas, with application to deepwater (turbidite) reservoir
58

management: GCSSEPM Foundation 20th Annual Research Conference Deep-Water
Reservoir of the World.
Stearns, D.W., 1968, Certain aspects of fractures in naturally deformed rocks, in Riecker,
R.E. ed., Rock Mechanics Seminar: Bedford, Massachusetts, Air Force Cambridge
Research Laboratories.
Stone, D.M., and Lumsden, D.N., 1984, Secondary porosity in the upper Jackfork
sandstone (Pennsylvanian), Little Rock-Arkadelphia, Arkansas: Journal of Sedimentary
Petrology, v. 54, p. 899-907.
Surdam, R.C., Boese, S.W., and Crossey, L.J., 1984, The chemistry of secondary porosity,
in McDonald, D.A. and Surdam, A.B., eds., Clastic diagenesis: AAPG Memoir 37, p.
127-149.
Van der Plas, L., and Tobi, A.C., 1965, A chart for judging the reliability of point
counting results: American Journal of Science, v. 263, p. 87-90.
Walker, R.G., 1978, Deep-water sandstones facies and ancient submarine fans: model for
exploration for stratigraphic traps: AAPG Bulletin, v. 62, p. 932-966.
Weimer, P. and Slatt, R.M., 2004, Petroleum systems of deepwater settings: AAPG
Distinguished Instructor Series, no. 7, 410 p.
59

Appendix 1. Total Organic Carbon (TOC) Analysis for Rex Timber No. 1-9 well.
Top Bottom TOC Top Bottom TOC Top Bottom TOC
(ft) (ft) (wt. %) (ft) (ft) (wt. %) (ft) (ft) (wt. %)
63 70 0.63 120 130 0.18 170 180 0.14
70 80 0.46 130 140 0.13 180 190 0.17
80 90 0.94 140 150 0.16 190 200 0.10
100 110 0.22 150 160 0.19 200 210 0.26
110 120 0.24 160 170 0.19 210 220 0.60
220 230 0.74 630 640 0.12 1010 1020 0.28
270 280 0.83 640 650 0.10 1020 1030 0.18
280 290 0.86 650 660 0.09 1040 1050 0.47
290 300 0.8 660 670 0.10 1050 1060 0.34
300 310 0.82 670 680 0.22 1060 1070 0.24
310 320 0.36 680 690 0.57 1070 1080 0.44
320 330 0.62 690 700 0.86 1080 1090 0.55
330 340 0.55 700 710 0.44 1090 1100 0.47
340 350 0.88 710 720 0.51 1100 1110 0.54
350 360 1.05 720 730 0.52 1110 1120 0.47
360 370 0.88 730 740 0.34 1120 1130 0.81
370 380 0.79 740 750 0.47 1130 1140 0.83
380 390 0.51 750 760 0.51 1150 1160 0.27
390 400 0.39 760 770 0.31 1160 1170 0.16
400 410 0.24 770 780 0.21 1170 1180 0.35
410 420 0.16 780 790 0.31 1180 1190 0.33
420 430 0.21 790 800 0.29 1190 1200 0.18
430 440 0.16 800 810 0.64 1200 1210 0.27
440 450 0.32 810 820 0.70 1210 1220 0.39
450 460 0.32 820 830 0.50 1230 1240 0.29
460 470 0.16 830 840 0.43 1240 1250 0.29
470 480 0.22 840 850 0.49 1250 1260 0.22
480 490 0.16 850 860 0.44 1260 1270 0.21
490 500 0.09 860 870 0.33 1270 1280 0.13
500 510 0.47 870 880 0.46 1280 1290 0.2
510 520 0.36 880 890 0.51 1290 1300 0.71
520 530 0.11 890 900 0.33 1300 1310 0.83
530 540 0.2 900 910 0.28 1308 1309 0.93
540 550 0.23 910 920 0.31 1308 0.96
550 560 0.13 920 930 0.49 1309 1310 0.93
560 570 0.82 930 950 0.34 1310 1311 1.29
570 580 0.57 950 960 0.34 1310 1320 1.15
580 590 0.14 960 970 0.26 1311 1312 1.96
590 600 0.11 970 980 0.22 1314 1315 1.47
600 610 0.13 980 990 0.25 1315 1316 1.31
610 620 0.12 990 1000 0.19 1316 1318 1.21
620 630 0.34 1000 1010 0.48 1318 1320 1.14
CRETACEOUS
JACKFORK
60

Top Bottom TOC Top Bottom TOC Top Bottom TOC
(ft) (ft) (wt. %) (ft) (ft) (wt. %) (ft) (ft) (wt. %)1320 1321 1.23 1790 1800 0.63 2280 2290 0.30
1320 1330 0.90 1800 1810 0.72 2290 2300 0.48
1321 1323 1.33 1810 1820 0.40 2300 2310 0.66
1323 1324 1.28 1820 1830 0.37 2310 2320 0.54
1330 1340 0.60 1830 1840 0.71 2320 2330 0.65
1340 1350 0.67 1840 1850 0.78 2330 2340 0.73
1350 1360 0.87 1850 1860 0.97 2340 2350 0.76
1360 1370 0.79 1860 1870 0.93 2350 2360 0.68
1370 1380 0.58 1870 1880 0.84 2360 2370 0.67
1380 1390 0.70 1880 1890 0.16 2370 2380 0.65
1390 1400 0.70 1890 1900 0.17 2380 2390 0.91
1400 1410 0.42 1900 1910 0.23 2390 2400 0.76
1410 1420 0.32 1910 1920 0.37 2400 2410 0.83
1420 1430 0.18 1920 1930 0.20 2410 2420 0.65
1430 1440 0.18 1930 1940 1.18 2420 2430 0.79
1440 1450 0.09 1940 1950 0.17 2430 2440 0.54
1450 1460 0.23 1950 1960 0.24 2440 2450 0.41
1460 1470 0.49 1960 1970 0.21 2450 2460 0.39
1470 1480 0.44 1970 1980 0.56 2460 2470 0.37
1480 1490 0.40 1980 1990 0.25 2470 2480 0.74
1490 1500 0.96 1990 2000 0.41 2480 2490 0.34
1500 1510 0.71 2000 2010 0.53 2490 2500 0.26
1510 1520 0.43 2010 2020 0.77 2500 2510 0.49
1520 1530 0.86 2020 2030 1.01 2510 2520 0.37
1530 1540 0.50 2030 2040 0.70 2520 2530 0.56
1540 1550 0.38 2040 2050 1.21 2530 2540 0.37
1550 1560 0.25 2050 2060 0.81 2540 2550 0.96
1560 1570 0.38 2060 2070 0.89 2550 2560 0.84
1570 1580 0.37 2070 2080 0.93 2560 2570 1.02
1580 1590 0.52 2080 2090 1.11 2570 2580 0.87
1590 1600 0.59 2090 2100 0.78 2580 2590 0.96
1600 1610 0.60 2100 2110 0.84 2590 2600 0.83
1610 1620 0.58 2110 2120 0.44 2600 2610 0.85
1620 1630 0.68 2120 2130 0.51 2610 2620 0.65
1630 1640 0.66 2130 2140 0.76 2620 2630 0.76
1640 1650 0.40 2140 2150 0.91 2630 2640 0.55
1650 1660 0.32 2150 2160 1.16 2640 2650 0.64
1660 1670 0.72 2160 2170 0.88 2650 2660 0.83
1670 1680 0.28 2170 2180 0.82 2660 2670 0.77
1680 1690 0.33 2180 2190 0.77 2670 2680 0.98
1690 1700 0.69 2190 2200 0.99 2680 2690 1.05
1700 1710 0.68 2200 2210 0.88 2690 2700 0.96
1710 1720 0.66 2210 2220 0.42 2700 2710 0.98
1720 1730 0.73 2220 2230 0.33 2710 2720 0.80
1730 1740 0.70 2230 2240 0.61 2720 2730 1.51
1750 1760 0.76 2240 2250 0.69 2730 2740 0.54
1760 1770 0.58 2250 2260 0.66 2740 2750 0.46
1770 1780 0.72 2260 2270 0.51 2750 2760 0.54
1780 1790 0.84 2270 2280 0.44 2760 2770 0.63
61

Top Bottom TOC Top Bottom TOC Top Bottom TOC
(ft) (ft) (wt. %) (ft) (ft) (wt. %) (ft) (ft) (wt. %)2770 2780 0.41 3270 3280 0.68 3700 3710 0.50
2780 2790 0.44 3280 3290 0.80 3710 3720 0.51
2790 2800 0.25 3290 3300 0.85 3720 3730 1.18
2800 2810 0.29 3300 3310 0.98 3730 3740 0.73
2810 2820 0.58 3310 3320 0.84 3740 3750 0.63
2820 2830 0.62 3320 3330 1.03 3750 3760 0.76
2830 2840 0.56 3330 3340 0.82 3760 3770 0.82
2840 2850 0.87 3340 3350 0.65 3770 3780 0.25
2850 2860 0.76 3350 3360 0.40 3790 3800 0.38
2860 2870 0.67 3360 3370 0.61 3800 3810 0.50
2870 2880 0.73 3370 3380 0.71 3810 3820 0.39
2880 2890 0.66 3380 3390 0.80 3820 3830 0.34
2890 2900 0.40 3390 3400 0.75 3830 3840 0.53
2900 2910 0.64 3400 3410 0.86 3840 3850 0.45
2910 2920 0.60 3410 3420 0.70 3850 3860 0.56
2920 2930 0.58 3420 3430 0.56 3860 3870 0.67
2930 2940 0.55 3430 3440 0.44 3870 3880 0.66
2940 2950 0.48 3440 3450 0.50 3880 3890 0.47
2950 2960 0.47 3450 3460 0.41 3900 3910 1.11
2960 2970 0.38 3460 3470 0.46 3910 3920 1.24
2970 2980 0.85 3470 3480 0.53 3920 3930 0.70
2980 2990 0.70 3480 3490 0.73 3930 3940 0.43
2990 3000 0.75 3490 3500 0.29 3940 3950 0.34
3000 3010 0.51 3500 3504 1.83 3950 3960 0.28
3010 3020 0.60 3500 3510 0.53 3960 3970 0.39
3020 3030 0.63 3504 3504.5 1.45 3970 3980 0.45
3030 3040 0.73 3508.3 1.88 3980 3990 0.51
3040 3050 0.61 3510 3526 1.12 3990 4000 0.52
3050 3060 0.71 3511 3520 0.86 4000 4010 0.74
3060 3070 0.62 3512 3.66 4010 4020 0.81
3070 3080 0.41 3514.5 1.38 4020 4030 0.86
3080 3090 0.47 3516 1.48 4030 4040 0.85
3090 3100 0.27 3520 3530 1.34 4040 4050 0.97
3100 3110 0.23 3530 3540 1.03 4080 4090 0.88
3110 3120 0.78 3540 3550 1.26 4090 4100 0.91
3120 3130 0.64 3550 3560 1.04 4100 4110 0.96
3130 3140 0.50 3560 3570 0.76 4110 4120 1.00
3140 3150 0.56 3570 3580 1.10 4120 4130 0.78
3150 3160 0.34 3580 3590 0.91 4130 4140 0.87
3160 3170 0.53 3590 3600 1.09 4140 4150 0.86
3170 3180 0.51 3600 3610 0.68 4150 4160 0.79
3180 3190 0.38 3610 3620 0.76 4160 4170 0.39
3190 3200 0.29 3620 3630 1.19 4170 4180 0.42
3200 3210 0.42 3630 3640 1.25 4180 4190 0.47
3210 3220 0.53 3640 3650 1.05 4190 4200 0.57
3220 3230 0.36 3650 3660 0.95 4200 4210 0.64
3230 3240 0.78 3660 3670 1.14 4210 4220 0.68
3240 3250 0.84 3670 3680 1.61 4220 4230 0.38
3250 3260 0.64 3690 3700 0.60 4230 4240 0.53
62

Top Bottom TOC Top Bottom TOC Top Bottom TOC
(ft) (ft) (wt. %) (ft) (ft) (wt. %) (ft) (ft) (wt. %)4240 4250 0.51 4730 4740 0.44 5230 5240 0.87
4250 4260 0.54 4740 4750 0.59 5240 5250 0.89
4260 4270 0.44 4750 4760 0.65 5250 5260 0.85
4270 4280 0.49 4760 4770 0.43 5260 5270 0.79
4280 4290 0.72 4770 4780 0.45 5270 5280 0.77
4290 4300 0.99 4790 4800 0.53 5280 5290 0.79
4300 4310 0.85 4800 4810 1.02 5290 5300 0.71
4310 4320 0.97 4810 4820 0.57 5300 5310 0.82
4320 4330 0.90 4820 4830 0.52 5310 5320 0.72
4330 4340 0.79 4830 4840 0.40 5320 5330 0.73
4340 4350 0.58 4840 4850 0.30 5330 5340 0.59
4350 4360 0.53 4850 4860 0.31 5340 5350 0.54
4360 4370 0.62 4860 4870 0.21 5350 5360 0.62
4370 4380 0.45 4870 4880 0.57 5360 5370 0.59
4380 4390 0.64 4880 4890 0.61 5370 5380 0.63
4390 4400 0.45 4890 4900 0.52 5380 5390 0.63
4400 4410 0.40 4900 4910 0.56 5390 5400 0.79
4410 4420 0.45 4910 4920 0.60 5400 5410 0.71
4420 4430 0.39 4920 4930 0.81 5410 5420 0.69
4430 4440 0.54 4930 4940 0.86 5420 5430 0.56
4440 4450 0.75 4940 4950 0.88 5430 5440 1.08
4450 4460 0.74 4950 4960 0.83 5440 5450 0.39
4460 4470 0.59 4960 4970 0.84 5450 5460 0.60
4470 4480 0.75 4970 4980 0.98 5460 5470 0.49
4480 4490 0.79 4980 4990 0.76 5470 5480 0.64
4490 4500 0.86 4990 5000 0.73 5480 5490 0.43
4500 4510 0.83 5000 5010 0.81 5490 5500 0.62
4510 4520 0.82 5010 5020 0.76 5500 5510 0.62
4520 4530 0.64 5020 5030 0.91 5510 5520 0.77
4530 4540 0.58 5030 5040 0.80 5520 5530 0.59
4540 4550 0.57 5040 5050 0.79 5530 5540 0.69
4550 4560 0.71 5050 5060 0.52 5540 5550 0.70
4560 4570 0.47 5060 5070 0.60 5550 5560 0.65
4570 4580 0.52 5070 5080 0.51 5560 5570 0.65
4580 4590 0.48 5080 5090 0.69 5570 5580 0.68
4590 4600 0.62 5090 5100 0.80 5580 5590 0.82
4600 4610 0.50 5100 5110 0.73 5590 5600 0.56
4610 4620 0.70 5110 5120 0.99 5600 5610 0.81
4620 4630 0.86 5120 5130 0.78 5610 5620 0.92
4630 4640 0.69 5130 5140 0.69 5620 5630 0.66
4640 4650 0.92 5140 5150 0.70 5630 5640 0.51
4650 4660 0.90 5150 5160 0.45 5640 5650 0.41
4660 4670 0.80 5160 5170 0.44 5650 5660 0.33
4670 4680 0.70 5170 5180 0.51 5660 5670 0.50
4680 4690 0.69 5180 5190 0.45 5670 5680 0.31
4690 4700 1.28 5190 5200 0.32 5680 5690 0.74
4700 4710 0.93 5200 5210 0.49 5690 5700 0.73
4710 4720 0.91 5210 5220 0.57
4720 4730 0.48 5220 5230 0.83
63

Top Bottom TOC Top Bottom TOC Top Bottom TOC
(ft) (ft) (wt. %) (ft) (ft) (wt. %) (ft) (ft) (wt. %)
5700 5710 0.39 6180 6190 0.54 6600 6610 0.73
5710 5720 0.44 6190 6200 0.59 6610 6620 0.73
5720 5730 0.47 6200 6210 0.62 6620 6630 0.87
5730 5740 0.57 6210 6220 0.74 6630 6640 0.95
5740 5750 0.41 6220 6230 0.79 6640 6650 0.81
5750 5760 0.39 6230 6240 0.71 6650 6660 0.65
5760 5770 0.73 6240 6250 0.51 6660 6670 0.68
5770 5780 0.79 6250 6260 0.36 6670 6680 0.43
5780 5790 0.82 6260 6270 0.40 6680 6690 0.33
5790 5800 0.89 6270 6280 0.52 6690 6700 0.28
5800 5810 0.87 6280 6290 0.28 6700 6710 0.20
5810 5820 0.88 6290 6300 0.60 6710 6720 0.26
5820 5830 0.95 6300 6310 0.49 6720 6730 0.73
5830 5840 0.89 6310 6320 0.52 6730 6740 2.96
5840 5850 0.94 6320 6330 0.86 6740 6750 1.07
5850 5860 0.84 6330 6340 0.89 6750 6760 0.84
5860 5870 0.59 6340 6350 0.70 6760 6765 0.95
5870 5880 0.68 6350 6360 0.69
5880 5890 0.73 6360 6370 0.78
5890 5900 0.50 6370 6380 0.89
5900 5910 0.58 6380 6390 0.56
5910 5920 0.56 6390 6400 0.68
5920 5930 0.59 6400 6410 0.83
5930 5940 0.66 6410 6420 0.80
5940 5950 0.90 6420 6430 0.91
5950 5960 0.92 6430 6440 0.91
5960 5970 1.05 6440 6450 0.75
5970 5980 0.69 6457 6460 0.80
5980 5990 0.86 6457.9 1.34
5990 6000 0.93 6458.8 2.58
6000 6010 0.80 6459 6460 1.26
6010 6020 0.66 6460 6463 1.37
6020 6030 0.70 6460 6470 0.86
6030 6040 0.65 6468.2 1.75
6040 6050 0.55 6469 1.25
6050 6060 0.41 6480 6490 0.48
6070 6080 0.54 6490 6500 0.31
6080 6090 0.67 6500 6510 0.32
6090 6100 0.64 6510 6520 0.67
6100 6110 0.81 6520 6530 0.89
6110 6120 0.67 6530 6540 1.03
6120 6130 0.68 6540 6550 0.54
6130 6140 0.81 6550 6560 0.59
6140 6150 0.39 6560 6570 0.60
6150 6160 0.34 6570 6580 0.67
6160 6170 0.46 6580 6590 0.62
6170 6180 0.49 6590 6700 0.78
STANLEY
64

Appendix 2. Thin section point counts from Rex Timber No. 1-9 well.
Depth(ft)
520-530 253 5 1 1 2 14 0 0 2 11 3 6 2(%) 84 1 1 1 1 5 0 0 1 4 1 2 1
1230-1240 252 1 5 1 3 12 1 1 2 16 1 1 4(%) 84 1 3 1 1 4 1 1 1 5 1 1 1
1430-1440 261 3 1 5 0 1 3 2 1 20 1 0 2(%) 87 1 1 3 0 1 1 1 1 7 1 0 1
1530-1540 232 6 3 4 1 40 3 1 1 8 0 1 0(%) 77 2 1 1 1 13 1 1 1 3 0 1 0
(257 PTS.) 217 5 3 2 1 9 8 1 1 9 0 1 0(%) 84 2 1 1 1 3 3 1 1 3 0 1 0
1950-1960 235 9 1 10 0 19 4 0 5 14 1 0 2(%) 78 3 1 3 0 6 1 0 2 5 1 0 1
2000-2020 234 6 5 6 1 17 6 3 4 17 0 1 0(%) 78 2 2 2 1 6 2 1 1 6 0 1 0
2370-2380 270 1 4 6 0 3 11 1 2 1 0 1 0(%) 90 1 1 2 0 1 4 1 1 1 0 1 0
2750-2760 238 8 8 15 1 11 4 1 2 7 2 0 3(%) 79 3 3 5 1 4 1 1 1 2 1 0 1
3090-3100 252 6 7 10 0 4 6 2 4 6 0 0 3(%) 84 2 2 3 0 1 2 1 1 2 0 0 1
3370-3385 (287 pts.)
235 4 7 4 0 21 6 0 0 5 2 1 2
(%) 82 1 2 1 0 7 2 0 0 2 1 1 13690-3700 230 3 13 9 1 12 12 2 3 13 1 0 1
(%) 77 1 4 3 1 4 4 1 1 4 1 0 13860-3870 212 9 8 20 3 9 6 2 6 15 5 0 5
(%) 71 3 3 7 1 3 2 1 2 5 2 0 24170-4180 219 7 4 6 0 3 10 4 6 30 9 0 2
(%) 73 2 1 2 0 1 3 1 2 10 3 0 14500-4510 172 3 6 8 2 6 7 4 4 81 6 0 1
(%) 57 1 2 3 1 2 2 1 1 27 2 0 14670-4680 212 7 8 11 0 27 5 0 4 20 5 0 1
(%) 71 2 3 4 0 9 2 0 1 7 2 0 15040-5050 237 3 10 10 0 6 3 1 2 25 0 0 3
(%) 79 1 3 3 0 2 1 1 1 8 0 0 15300-5310 221 6 8 8 1 7 12 6 3 20 6 0 2
(%) 74 2 3 3 1 2 4 2 1 7 2 0 15730-5740 240 4 4 10 0 7 8 1 0 22 1 1 2
(%) 80 1 1 3 0 2 3 1 0 7 1 1 16070-6080 245 4 4 5 0 25 2 2 2 3 7 0 1
(%) 82 1 1 2 0 8 1 1 1 1 2 0 16380-6390 222 4 4 15 0 10 12 3 1 17 5 2 5
(%) 74 1 1 5 0 3 4 1 1 6 2 1 2Total 5133 169 113 175 16 264 132 49 56 382 56 15 24(%) 78 2 2 3 <1 4 2 1 1 6 1 <1 <1
CG = Carbonate Grain / FragmentCC = Carbonate Cement (Intergranular)AC = Authigenic Carbonate (Intragranular)
M = MicaCL = ClayCEM = Cement (other than carbonate)POR = PorosityPY = Pyrite
HC = Solid Hydrocarbon
Q = QuartzCH = ChertF = FeldsparRF = Rock Fragment
CL CEM POR PYQ CH F RF CG CC AC HC M
65

OKLA
HOM
AAR
KANS
AS
COSSATOT MOUNTAINS
BENTO N UPL IFT
SWEPI Rex Timber #1-9
SWEPI Arivett #1-26
Shell International Paper #1-21
TRAP MOUNTAINS
Ms
Ms
Ow
Opb
Om
Om
Kt
Kt
Kb
Kto
Ko
Pal
Pj
Pj
PjvPj
Pal
Pj
Smb
Opb
Opb
Ow
Ow
Oc
PjPj
Pj
Ki
Ki
Lake Ouachita
Lake Hamilton
Lake Catherine
DeGray Lake
Lake GreesonDierks
Reservior
GillhamLake
DeQueenReservoir
Ob
Ocm
Ocm
Ow
MDa
MDa
SmbOpb
Om
Ms
MsSmb
Opb
Ms
Pj
MDa
Ms
MsPj
Ms
Smb
MDa
Ob
OwOcm
Opb
OpbOb
Pj
MDa
Ob
Ow
Tw
Tm
Qal
Qt
Pj Pjv
Smb
Qal Tw
Qt
Ko
Kn
Qal
Kw
KtQal
Qt
Kde
Kdi
Kdi
Qal
KtPj
Pj
PalPjv
Pjv
KtoKb
W e s t G u l f C o a s t a l P l a i n
O u a c h i t a F o l d & T h r u s t B e l t
Qt
Zigzag Mountains
Ouachita
River
Caddo River
OuachitaRiver
Mazarn Synclinorium
Ouachita Anticlinorium
KadKn
Ks
Km
Kw
Tw
Tw
Qt
Qt
Pjv
KdeQal QalQtKoKb
Tw
TwQal
Pjv
Opb
Mena
Glenwood
Hot Springs
Hot Springs Village
Murfreesboro
Arkadelphia
De Queen
Malvern
92°45'0"W
92°45'0"W
93°0'0"W
93°0'0"W
93°15'0"W
93°15'0"W
93°30'0"W
93°30'0"W
93°45'0"W
93°45'0"W
94°0'0"W
94°0'0"W
94°15'0"W
94°15'0"W
94°30'0"W
94°30'0"W
34°30'0"N34°30'0"N
34°15'0"N34°15'0"N
Location Map and Surface Geology of the South Central Ouachita Mountain Region, ArkansasStratigraphic Column
Symbols
Late PleistoceneQt Terrace Deposits
Early EoceneWilcox GroupTw
PaleoceneTm Midway Group
Late CretaceousKad Arkadelphia Marl
Kn Nacatoch Sand
Ks Saratoga Chalk
Km Marlbrook Marl
Ko Ozan Formation
Early Cretaceous
Kb Brownstown Marl
Middle Pennsylvanian - AtokanLower Atoka FormationPal
Early MississippianStanley ShaleMs
CretaceousKi Acid to Intermediate Igneous Rock
Disclaimer: This map was prepared using ESRI software on computersat the Arkansas Geological Survey. The Arkansas GeologicalSurvey does not guarantee the accuracy of this map, especiallywhen used in another system or with other software. Surface geologymapped and compiled by Haley, B. R. et al, 1993 and is subject to personal interpretation.Sources: Geologic base map is enlarged and modified from the original1:500,000 scale Geologic Map of Arkansas, Haley, B. R. et al, 1993,U.S. Geological Survey and the Arkansas Geological Commission.Fold traces shown on the map are from Croneis, C., 1930, Geology ofthe Arkansas Paleozoic Area, Arkansas Geological Survey, Bull. 3,Plate 1-B.Boundary outline for the Benton Uplift is derived from Arbenz,J.K., 1989, The Ouachita system, in Bally, A.W. and Palmer, A.R.,eds., The Geology of North America - An Overview, Vol. A, p.387.
Plate 1
Ted Godo1, Peng Li2, and M. Ed Ratchford2
1: Shell Exploration and Production Company, Houston, Texas2: Arkansas Geological Survey, Little Rock, Arkansas
Fold trace of Anticlinorium
Arkansas Geological SurveyBekki White, Director and State Geologist
Information Circular 39AFF-OG-OU-011
Well LocationsCities
0 5 10 15 202.5Miles
MO
TN
MS
TX
OK
LA
Polk Montgomery Garland
Hot Spring
DallasClarkPike
HowardSevier
Scott Saline
Study Area
A R K A N S A S
Tokio FormationKto
Woodbine FormationKw
Trinity Group
De Queen Limestone Member
Dierks Limestone Member
Kt
Kde
Kdi
Pjv Johns Valley ShaleMorrowan - Early Pennsylvanian
Pj Jackfork Sandstone
Late Devonian to Early MississippianArkansas NovaculiteMDa
Cartography By: Nathan H. Taylor
Water Body
HoloceneQal Alluvium
0 5 10 15 202.5Kilometers
1:250,000
Benton Uplift
County Boundary
Middle Ordovician to Late OrdovicianOpb Polk Creek Shale and Bigfork Chert
Middle OrdovicianOw Womble Shale
Early Ordovician to Middle OrdovicianOb Blakely Sandstone
Om Mazarn ShaleEarly Ordovician
Ocm Crystal Mountain Sandstone
Late SilurianSmb Missouri Mountain Shale and Blaylock Sandstone
Fold trace of Synclinorium
Thrust fault - Also tear faults in some areas,dashed under lakes to show continuity
Oc Collier ShaleCambrian to Early Ordovician


