Download - Student Living Survey 2004/5 Wave 5 Presented by: Professor Robert Worcester 26th January 2005

Student Living Survey 2004/5 Wave 5
Student Living Survey 2004/5 Wave 5
Presented by:Professor Robert Worcester
26th January 2005

Contents Methodology Getting to University Student Life Accommodation Citizenship Academic Life Paid Employment Student Finances and Debt What Next? Key Findings
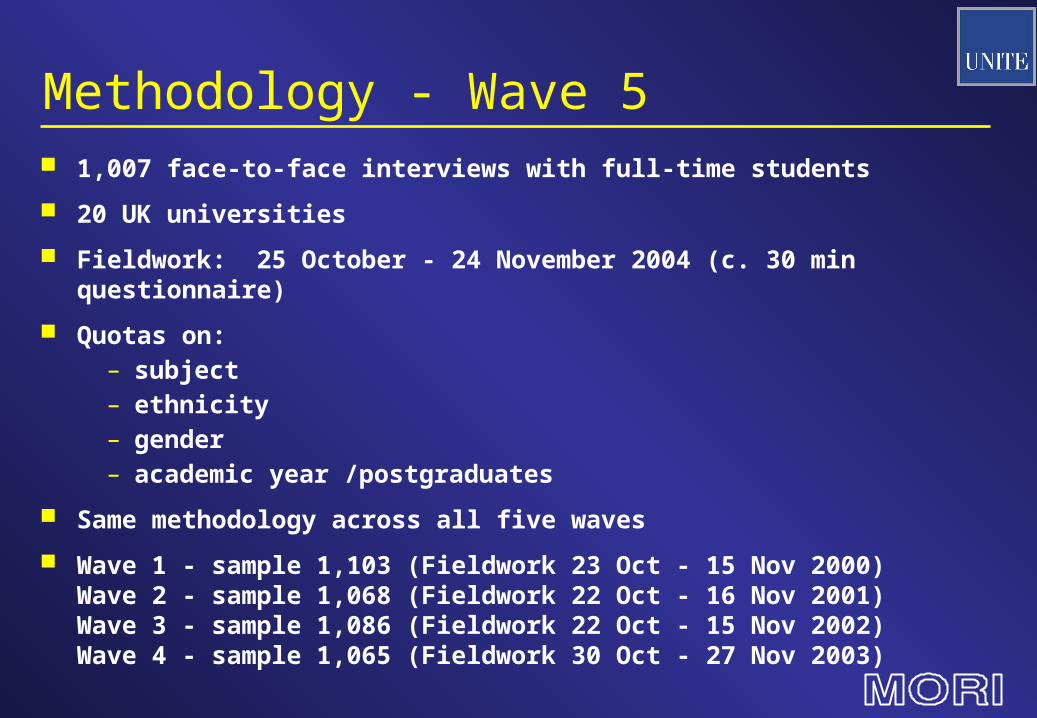
Methodology - Wave 5 1,007 face-to-face interviews with full-time students
20 UK universities
Fieldwork: 25 October - 24 November 2004 (c. 30 min questionnaire)
Quotas on:– subject– ethnicity– gender – academic year /postgraduates
Same methodology across all five waves
Wave 1 - sample 1,103 (Fieldwork 23 Oct - 15 Nov 2000) Wave 2 - sample 1,068 (Fieldwork 22 Oct - 16 Nov 2001)Wave 3 - sample 1,086 (Fieldwork 22 Oct - 15 Nov 2002)Wave 4 - sample 1,065 (Fieldwork 30 Oct - 27 Nov 2003)

Getting To University

45%40%42%40%
38% 37% 34%41%
42%39%
12%11% 9% 9% 11%8%9%9% 9% 8%
0%
10%
20%
30%
40%
50%
60%
Wave 1 Wave 2 Wave 3 Wave 4 Wave 5
AB C1 C2 DE
Social Class Profile of University Students
Base: All students; Wave 1 (1,103), Wave 2 (1,068), Wave 3 (1,086), Wave 4 (1,065), Wave 5 (1,007)

19 5 4 666
73
59
62
17
20
24
4
5
3
5
2
9
6
6
3
C2DE
AB
All students
C1
% A great deal
% A fair amount
% None at all
% Not applicable
% Not very much
Family EncouragementQ9 How much encouragement did your family give you in your
decision to go to University?
Base: All students; Wave 5 (1,007), AB (456), C1 (342), C2DE (202)

39%37%
59%
27%26%
21%20%19%
16%16%
What are StudentsBasing their Choice of University on?
Q8 Which factors were important to you in your selection of universities?
The course offered
Visited it & liked it
Located in city
Base: All students; Wave 5 (1,007)
Academic reputation
The atmosphere
University league tables
Top Mentions
Ability to live at home
Close to my familyRecommendations from friends/family
Overall reputation of the university

Student Life
39
42
46
46 8
10
2
4
1
1
% Neither agreenor disagree
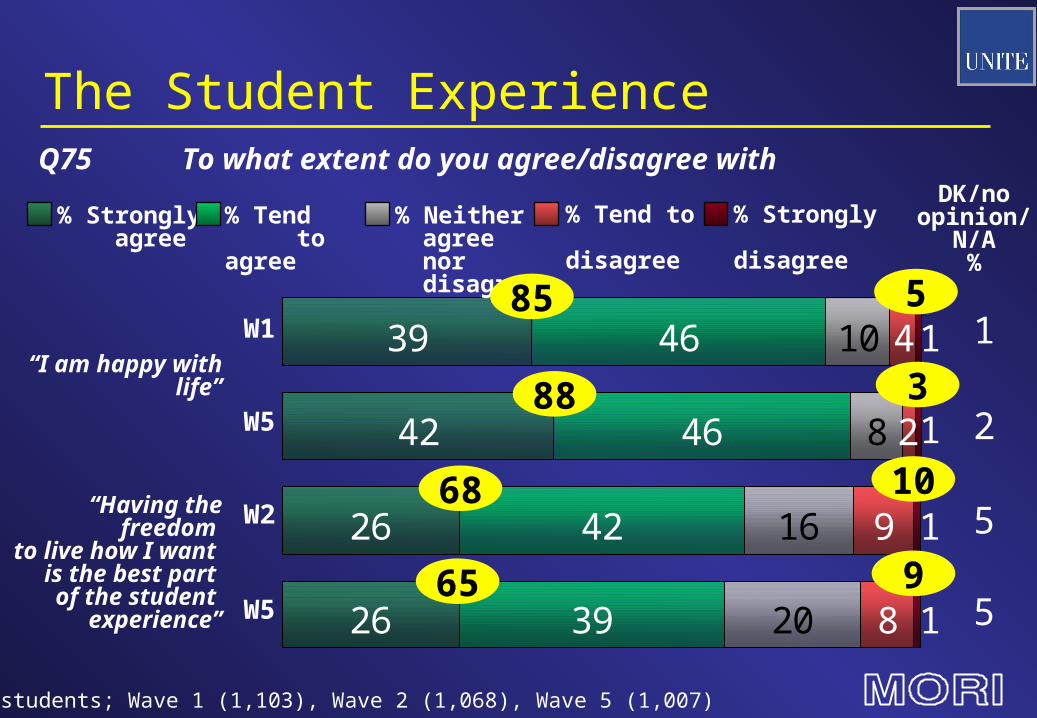
The Student Experience
“I am happy with life”
% Strongly agree
% Tend to agree
% Tend to disagree
“Having the freedom
to live how I want is the best part of the student
experience”
% Strongly disagree
26
26
42
39
16
20
9
8
1
1
Base: All students; Wave 1 (1,103), Wave 2 (1,068), Wave 5 (1,007)
Q75 To what extent do you agree/disagree with
W1
W5
W2
W5
DK/no opinion/
N/A%
1
2
5
5
85
88
68
65
5
3
10
9

Health & Fitness [1]
“I care very muchabout health and
fitness, in bodyand in mind”
26
25
44
46 17
2
2
21
8
6
2
*
Base: All students; Wave 1 (1,103), Wave 5 (1,007)
Q75 To what extent do you agree/disagree with
W1
W5
% Strongly agree
% Tend to agree
% Tend to disagree
% Strongly disagree
% Neither agreenor disagree
% DK/no opinion/ N/A
70
71
8
10

Health & Fitness [2]
“I care very much
about health andfitness, in body
and in mind”
25
29
23
46
44
48
17
17 8
2
1
2
17
8
8
*
*
*
Base: All students; Wave 1 (1,103), Wave 5 (1,007)
Q75 To what extent do you agree/disagree with
W5
% Strongly agree
% Tend to agree
% Tend to disagree
% Strongly disagree
% Neither agreenor disagree
% DK/no opinion/ N/A
71 10
Men
Women
73 9
71 10

18 11 24 1331
Aged 26+
35
22
21
19
15
15
12
13
7
25
26
16
7
22
38
Aged up to 22
All students
Aged 23-25
% Single, not looking
% Single, looking
% Serious relationship
% Live with / married
% Relationship, not serious
Footloose and Fancy Free?Q76 Which of the following best describes your current
situation?
Base: All students; Wave 5 (1,007), Aged up to 22 (738), Aged 23-25 (117), Aged 26+ (151)

25 13 159 2
55
62
25
26
24
13
15
11
1
1
59
2
2
2
2
Men
All students
Women
% Very risky % Not very risky if careful
% Not risky at all
% Don’t know% Not risky in moderation
AlcoholQ77 How risky do you consider… Binge Drinking
Base: All students; Wave 5 (1,007), Men (461), Women (546)
32% spend over £20 a week
35% spend over £15 a week

% Not risky in moderation
87
91
98
16
7
4
16
3
2
63
*
2
* 2
3
3
2
Taking dance drugs
Smoking cannabis
Taking heroin
% Very risky
% Not very risky if careful
% Not risky at all
% Don’t know
DrugsQ77 How risky do you consider…?
Base: All students; Wave 3 (1,086), Wave 5 (1,007)
Taking cocaine
% Ever done
(Wave 3)
39
10
8
N/A

48%
47%
36%
19%
16%
49%
53%
41%
32%
23%
47%
43%
32%
9%
11%
GadgetsQ73 Which of these do you personally own?
Advanced mobile phone
DVD Player
Non-portable games console
Digital camera
MP3 player
Base: All students; Wave 5 (1,007), Men (461), Women (546)
WomenAll students Men

37%
10%
1%
48%
4%
Base: All students; Wave 3 (1,086), Wave 5 (1,007)
Not risky in moderation
Very risky
Not very risky, if careful
Not risky at all
Don’t know
Q77 How risky do you consider…?
Crime
Walking alone at night in a strange area
% very risky
All 48%
Men 22%Women 69%
Non-white 42%White 50%
Scotland 43%North/NI 58%

50%
43%
27%
27%
23%
The Worst Aspects of University LifeQ11 What, if anything, do you consider to be the worst
aspects of university life?
Top Mentions
Having little money
Being in debt
Juggling university work with other commitments
No regular income
Needing to work and study at the same time
40
30
-
55
31
Base: All student; Wave 1 (1,103), Wave 3 (1,086), Wave 5 (1,007)
W1%
W3%
43
30
24
51
31
Wave 5

Current Accommodation

Value for Money
60%
14%19%
4% 3%
Base: All students in rented accommodation; Wave 5 (649)
Very good value
Fairly good value
Very poor value
Fairly poor value
Do not pay / don’t know
Q45 To what extent do you consider your current accommodation to be value for money?
79
18

6%17%
48%
6%
22%
Complete tip
Fairly ordered
TidinessQ54 Which description best fits your bedroom if you were to go
into it right now?
Base: All students; Wave 5 (1,007), Students living in shared house / flat (409)
Very messy
Fairly messy
Very ordered
Citizenship

60%
25%
21%
7%
Ethical ConsumersQ25 Which of the following sound very much like you?
None of these
I am sympathetic to environmental and social concerns but not active
I frequently discuss companies’ ethical behaviour with my family and
friends
Base: All students; Wave 5 (1,007)
I would describe myself as an ethical consumer

32%
32%
62%
56%
29%
27%
CitizenshipQ24 Which of the following things have you done in the last
12 months?
Donated money to charity, including a
badge
Read or heard about a company’s social actions
Taken action to be more energy efficient
Base: All students; Wave 5 (1,007), GB adults 16+ July – September 2004 (2,037)
Sent items to be recycled
Voluntarily helped a charitable organisation
Top Mentions
Attended a local community event
Adult figs%
71
-
-
-
39
38
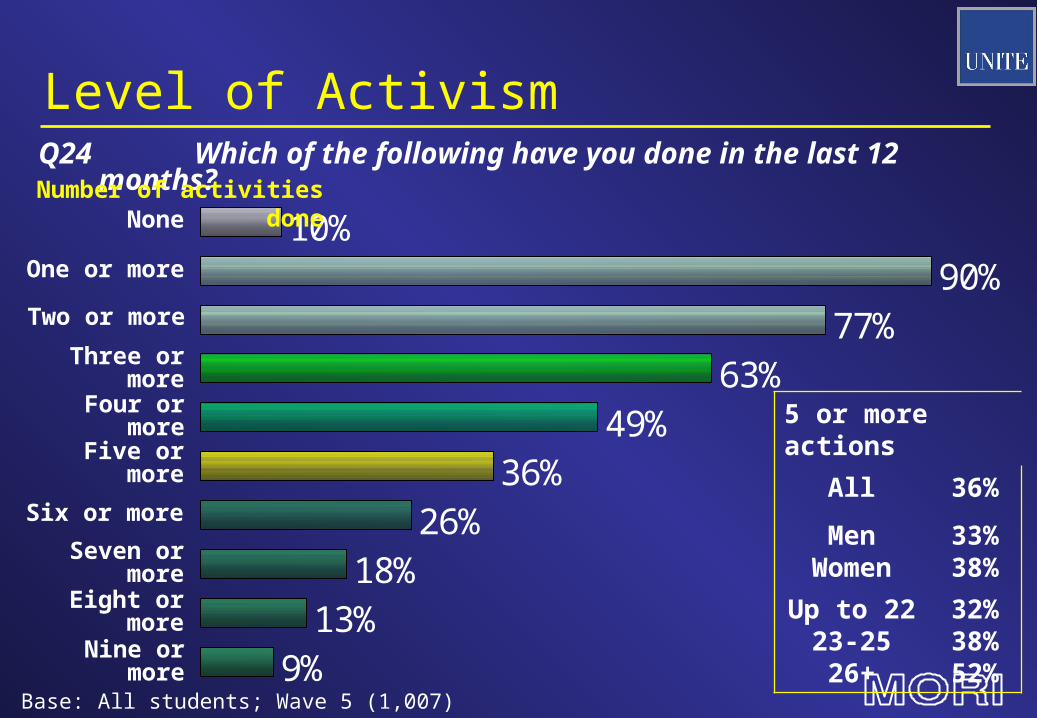
10%90%
77%63%
49%36%
26%18%
13%9%
Level of ActivismQ24 Which of the following have you done in the last 12
months?None
Base: All students; Wave 5 (1,007)
Three or more
Number of activities done
One or more
Five or more
Seven or more
Two or more
Nine or more
Four or more
Six or more
Eight or more
5 or more actions
All 36%
MenWomen
33%38%
Up to 2223-2526+
32%38%52%

Wave 1
Wave 2
Wave 4
Wave 3
Wave 5
36
42
34
28
28
23
29
33
37
34
15
20
20
19
17
13
15
19
24
14
% Labour % Liberal Democrat % Conservative % Other
35 23 31 11
Changes in Students’ Voting IntentionsQ80 How would you vote if there were a General Election
tomorrow?
Base: All who would vote; Wave 1 (733), Wave 2 (730), Wave 3 (712), Wave 4 (687), Wave 5 (630), All British adults certain to vote November 2004
General public

Changes in Students’ Voting IntentionsQ80 How would you vote if there were a General Election
tomorrow?
Base: All who would vote; Wave 1 (733), Wave 2 (730), Wave 3 (712), Wave 4 (687), Wave 5 (630)
12%
3%
1%
3%
Green Party
Scottish/Welsh Nationalists
Other
UKIP
Others
19%

24%
26%
8%7%
35%
Neither agree nor disagree
Strongly agree
Tend to disagree
Tend to agree
Strongly disagree
(1%)
Don’t know/no opinion
Government out of Touch
Base: All students; Wave 5 (1,007)
The Government is out of touch with the views of students like myself
By party support% Strongly Agree
All (1,007) 26
Other (115) 43
Conservative (123) 31
Lib Dems (217) 30
Labour (175) 18
Academic Life

Overall Attitude to UniversityOverall Favourablility
8%3%
39%
49%
Neither/nor Very favourable
Fairly unfavourable
Fairly favourable
Very unfavourable (1%)
Base: All students; Wave 5 (1,007)
Satisfaction with quality of teaching
35%
52%
3%10%
Neither/nor Very
satisfied
Fairly unsatisfied
Fairly satisfied
Very unsatisfied (1%)
88
4
87
4

Wave 4
% Very good
% Fairly good
% Fairly poor
% Very poor
% Neither goodnor poor
13
20
45
44 19 2
24 7
6
4
9
7
Base: All students; Wave 4 (1,065), Wave 5 (1,007)
The customer service you receive from your university
Wave 5
% DK/not stated/ N/A
Rating of the University Package [1]
58
64
11
8

Wave 1
% Very good
% Fairly good
% Fairly poor
% Very poor
% Neither goodnor poor
20
17
26
39
41
38
23
21 6
3
3
13
9
6
18
7
7 4
Base: All students; Wave 1 (1,103), Wave 3 (1,086), Wave 5 (1,007)
The value for money you receive from your course
Wave 5
% DK/not stated/ N/A
Rating of the University Package [2]
Wave 3
59
58
64
11
10
9

34%
34%
33%
50%
27%
24%
22%
25%
Q20 To what extent do you consider each of the following to be good or poor at your university?
Availability of IT
Standard of teaching / lecturing
Base: All students; Wave 1 (1,103), Wave 3 (1,086), Wave 5 (1,007)
Availability of periodicals journals
35
19
24
% Very goodW3%
W1%
Academic tutor system
Availability of course books in the library
Support received for academic studies
34
22
19
43
26
26
29
23
20
Rating of the University Package [3]
Availability of course materials online
Contact time with tutor / lecturer
--
--
23%18%18%
17%
31%30%
8%
12%9%
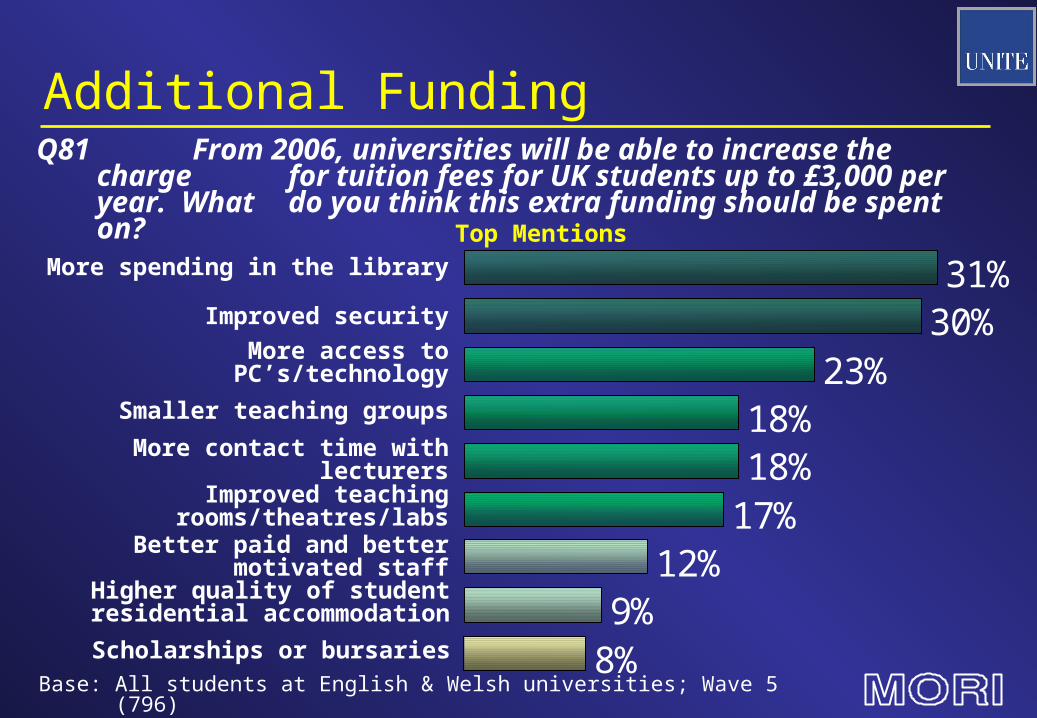
Additional FundingQ81 From 2006, universities will be able to increase the
charge for tuition fees for UK students up to £3,000 per year. What do you think this extra funding should be spent on?
More contact time with lecturers
Smaller teaching groups
More spending in the library
Better paid and better motivated staff
More access to PC’s/technology
Base: All students at English & Welsh universities; Wave 5 (796)
Improved security
Improved teaching rooms/theatres/labs
Top Mentions
Higher quality of student residential accommodation
Scholarships or bursaries

Paid Employment

42%
36%
41%
57%
Student Employment & Wages
All students
Q29 Do you currently have a job which you are paid to do?
AB
C1
C2DE
Base: All students; Wave 5 (1,007), AB (456), C1 (342), C2DE (202)
Average hours per
week
14.5 hrs
13.6 hrs
15.2 hrs
15.2 hrs
Average earnings per
week
£86
£80
£93
£88
% who have a job
68%43%
33%31%
27%23%22%
17%12%
6%
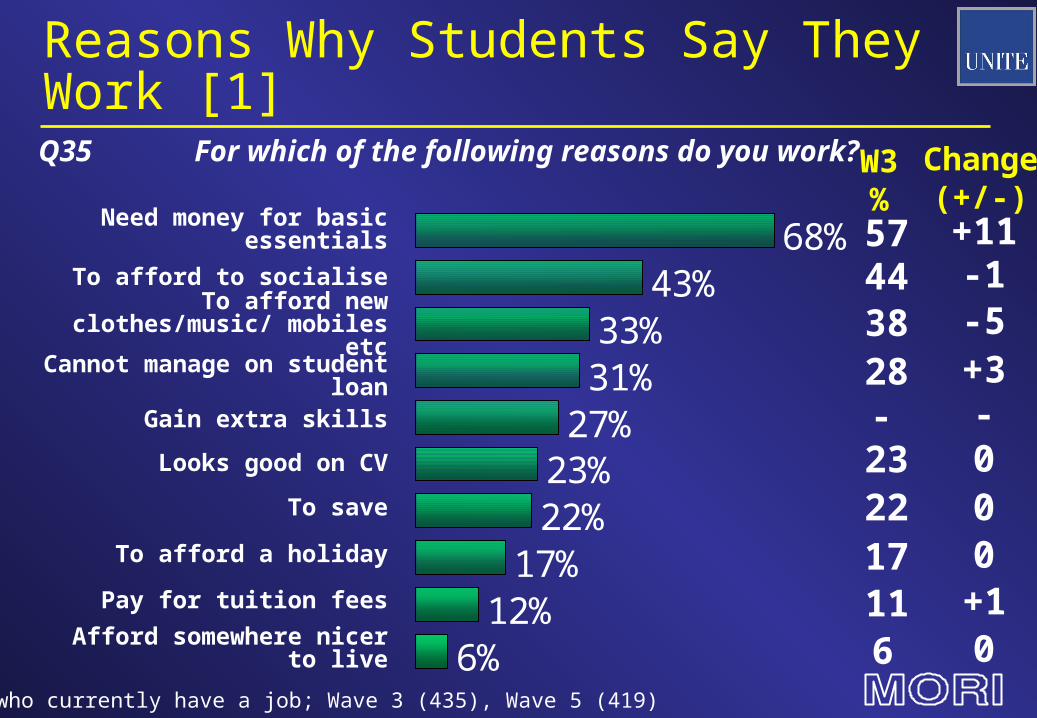
Reasons Why Students Say They Work [1]Q35 For which of the following reasons do you work?
Need money for basic essentials
Base: All who currently have a job; Wave 3 (435), Wave 5 (419)
To afford to socialise
To afford new clothes/music/ mobiles etc
Cannot manage on student loan
Looks good on CV
To save
To afford a holiday
Pay for tuition fees
Afford somewhere nicer to live
Gain extra skills
W3%
Change(+/-)
57443828-
+11-1-5+3-
220230
11 +117 0
6 0

45%40%
39%
60%
28%26%
20%2%
5%3%
Q36 If you didn’t work, in which of the following areas, if any, would you need to make savings?
Going out
Base: All who currently have a job; Wave 5 (419)
Clothes
Alcohol
Mobile phone
Food
Accommodation
Other
None of these
Don’t know
Music
Reasons Why Students Say They Work [2]

17%12%
8%7%
5%5%5%
3%2%
33%
Types of Student WorkQ30 Which, if any, of the following types of job do you
currently do during term time?
Retail
Clerical/office
Catering
Base: All who currently have a job; Wave 5 (419)
Bar work
Nursing/health care
Work for Students Union
Top Mentions
Teaching
Work for the university
Sport / leisure
Call centre

Attitude of University to Employment
Base: All who currently have a job; Wave 5 (419)
Q37 To what extent do you agree/disagree with ….
“Received help from university in choosing paid work that would minimise the effect on my studies”
“Received help & advice from university to help balance work and course commitments”
Tutors/lecturers understand my need to work during term time
% Disagree % Agree
Neither/N/A/Don’t know
%
37
40
36
% Strongly agree
% Tend to agree
% Tend to disagree
% Strongly disagree
20 21 16 3
32 21 9 2
6 11 30 1617
41
53
46
19
11

Attitudes Towards Work
Base: All who currently have a job; Wave 5 (419)
The percentage of working students who agree with each statement …
“My employer appreciates my course commitment & tries to be flexible” (81%)
“My employer values my contribution” (79%)
“I enjoy going to work” (69%)
“Only paid work available is
manual, unskilled work” (23%)
“The conditions at my workplace are terrible” (5%)
“The work experience I have gained while at university
will help me to get a full time job after graduation” (55%)
“Tutors/lecturers understand my need to work during term
time” (46%)
“Received help & advice from university to help balance work
and course commitments” (19%)
“Received help from university in
choosing paid work that would minimise
the effect on my studies” (11%)

Finances

Managing Finances
4%21%
55%
20%
Very organised
Fairly organised
Not very organised Very
organised%
All students 21
Age:
Up to 22 yrs 18 23 - 25 yrs 26 26 + yrs 35
Q58 To what extent would you describe yourself as financially organised?
Base: All students; Wave 5 (1,007), up to 22 years (738), 23-25 (117), 26+ (151)
Not at all organised
Don’t know (*%)

Managing Finances
% Keeping up without difficulties
% Keeping up but struggles from time to time
% Falling seriously
behind with
some bills
Wave 2
% Having real financial problems & have fallen behind with many bills
% Keeping up but a constant struggle
39
40
37
43
36
37
41
36
18
18
17
15
3
32
3
4
1
2
2
Base: All students; Wave 2 (1,068), Wave 3 (1,086), Wave 4 (1,065), Wave 5 (1,007)
Q60 Which of the following statements best describes how you are managing financially at the moment?
Wave 4
Wave 3
Wave 5
Don’t know
%
1
-
1
2
75
77
78
79
6
5
4
5

ExpenditureQ61 In a typical month during term time, how much do you & Q62 personally spend on…..
£126Food
£76Going out
£42Clothes
£31Mobilephones
£64Cigarettes
£22Music
£99Alcohol
Base: All students who spend on each item
£19Films
Men: £137Women: £116
Men: £114Women: £87
Men: £81Women: £72
Men: £21Women: £15
Men: £62Women: £66
Men: £41Women: £42
Men: £31Women: £31
Men: £24Women: £20

£70
£16
£15
£10
£8
£8
Course books
Course related trips
Course related equipment
Base: All students; Wave 5 (1,007)
Stationery
Photocopying
Printing from computers
Course ExpensesQ63 This term, approximately how much, if anything, do you
personally expect to spend on …

£4,203
£3,326
£4,603 £4,760
£3,181£3,621
£4,406
£4,619
£4,808£4,841
£4,579
£3,575
£4,515
£4,640
£3,157
£4,912
£3,000
£3,250
£3,500
£3,750
£4,000
£4,250
£4,500
£4,750
£5,000
£5,250
£5,500
£5,750
£6,000
Wave 1 Wave 2 Wave 3 Wave 4 Wave 5
All Students AB C1 C2DE£
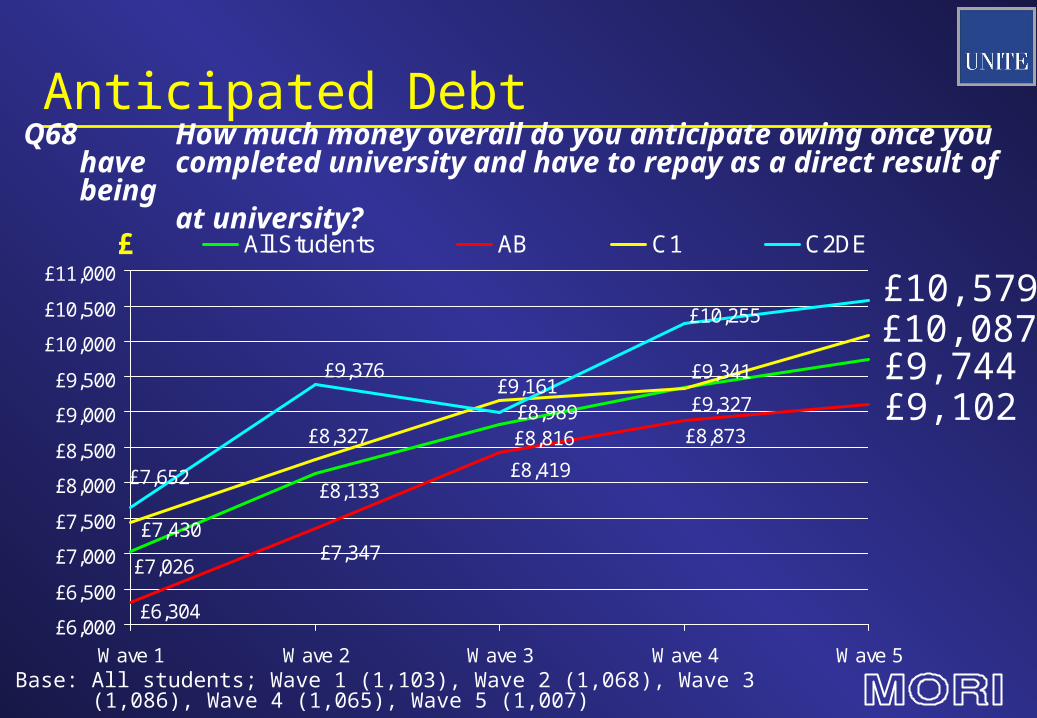
Base: All students; Wave 1 (1,103), Wave 2 (1,068), Wave 3 (1,086), Wave 4 (1,065), Wave 5 (1,007)
Current DebtQ67 How much money overall, if any, do you currently
owe, and must repay as a direct result of being at university?
£5,889£5,778£5,285
£4,622
£8,133
£7,026
£8,816
£9,341
£6,304
£7,347
£8,419
£8,873
£9,327£9,161
£8,327
£7,430
£8,989
£9,376
£7,652
£10,255
£6,000
£6,500
£7,000
£7,500
£8,000
£8,500
£9,000
£9,500
£10,000
£10,500
£11,000
Wave 1 Wave 2 Wave 3 Wave 4 Wave 5
All Students AB C1 C2DE£
Base: All students; Wave 1 (1,103), Wave 2 (1,068), Wave 3 (1,086), Wave 4 (1,065), Wave 5 (1,007)
Anticipated DebtQ68 How much money overall do you anticipate owing once you
have completed university and have to repay as a direct result of being
at university?
£10,579£10,087£9,744£9,102

UNITE/MORI Student Debt Index
All students Retail-Price Index
Current Debt
Anticipated Debt
Wave 1 100 100 100
Wave 2 103 123 116
Wave 3 104 138 125
Wave 4 107 143 133
Wave 5 110 159 139

36%17%
11%5%
3%3%2%2%2%2%1%2%
77%
Type of Student DebtQ69 To which of the following are you in debt to and must
repay?Government student loan
Overdraft from bank
Credit card
Base: All students who are currently in debt; Wave 5 (687)
Average£6,514
Parents
Store card
Car finance
Hire purchase
Mail order catalogue
Other
Friends
Other family
Unpaid utility bills
Personal loan
£1,127£1,167£1,552£4,455£ 366£ 159£ 149£1,299
£4,497£1,858£5,473
£ 223

% Neither agreenor disagree
Concerns About Student Debt [1]
Wave 4
12
11
13
10
22
24
27
27
20
16
14
17
19
25
24
23
25
13
11
15
16
15
12
9
8
7
13
14
18
21
Base: All students; Wave 1 (1,103), Wave 2 (1,068), Wave 3 (1,086), Wave 4 (1,065), Wave 5 (1,007)
I am seriously worried about the debts I am going to incur as a result of going to university
Wave 2
Wave 1
Wave 3
% Strongly agree
% Tend to agree
% Tend to disagree
% Strongly disagree
% DK/no opinion/ N/A
Wave 5
36
36
38
40
30
32
36
39
39
40

10 20 17 25 15 13
% Neither agree nor disagree
Concerns About Student Debt [2]
“I am seriously worried about the debts I am going to incur
as a result of going to university”
16 33 11 16 10 14
Base: All students; Wave 5 (1,007)
“I don’t worry about my debts at the moment, I can
pay them off when I start working”
% Don’t know/no opinion/ N/A
% Strongly agree
% Tend to agree
% Tend to disagree
% Strongly disagree
30
49
40
26

% Neither agreenor disagree
Stress [1]
17
20
36
38 15
10
7
13 23
17
*
2
Base: All students; Wave 2 (1,068), Wave 5 (1,007)
Q75 To what extent do you agree/disagree with
“Since being a university
student I feel under a lot more stress than
before”
W2
W5
% Strongly agree
% Tend to agree
% Tend to disagree
% Strongly disagree
% DK/no opinion/ N/A
53
58
33
24

56%
57%
66%
54%
61%
58%
Stress [2]
Base: All students; Wave 5 (1,007)
“Since being a university student I feel under a lot more stress than before”
All students (1,007)
AB (456)
Women (546)
Men (461)
C1 (342)
% agree
C2DE (202)

Investing for the Future“The money I am spending on my education is a good investment in
my future”
39%50%
6%2%
Don’t know/no opinion (2%)
Neither agree nor disagree
Strongly agree
Tend to disagree
Tend to agree
Strongly disagree (*%) Strongly
agree%
Wave 1 44Wave 2 48Wave 3 48Wave 4 44Wave 5 50
Base: All students; Wave 1 (1,103), Wave 3 (1,086), Wave 5 (1,007)
% Neither agreenor disagree
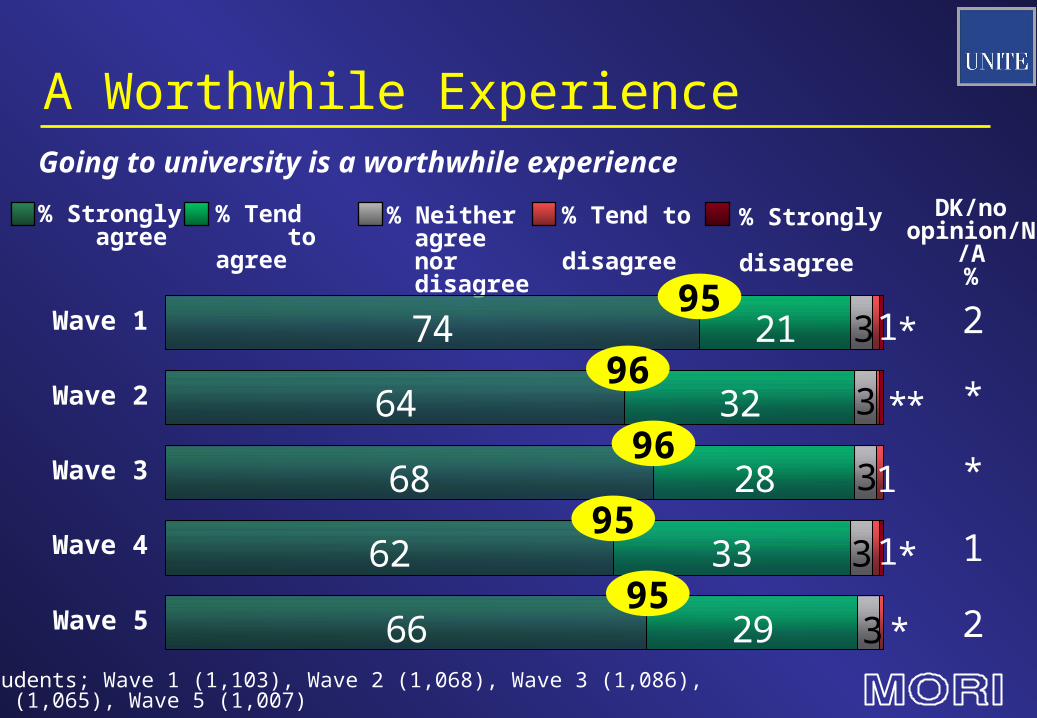
A Worthwhile Experience
Wave 4
64
68
62
66
21
32
28
33
29
74
3
3
3
3
3
1
*
1
1
*
*
*
*
Base: All students; Wave 1 (1,103), Wave 2 (1,068), Wave 3 (1,086), Wave 4 (1,065), Wave 5 (1,007)
Going to university is a worthwhile experience
Wave 2
Wave 1
Wave 3
% Strongly agree
% Tend to agree
% Tend to disagree
% Strongly disagree
DK/no opinion/N/
A%
Wave 5
2
*
*
1
2
95
96
96
95
95

What Next?

24%
22%
19%
18%
13%
37%
What Next?Q26 Which of these statements, if any, comes closest to what
you intend to do when you have graduated?
Top Mentions
Start work straight away in a ‘graduate’ job
Look for a ‘graduate’ job
Further study straight away
Take a temporary job
Go travelling
Go on holiday
W3%
Change(+/-)
33
23
20
17
+2
+4
+1
+2
+3
17
+112
Base: All students; Wave 3 (1,086), Wave 5 (1,007)

Employment ProspectsI’m optimistic about getting a job when I finish my course
9%4%
38%
45%
3%
Don’t know / no opinion
Neither agree nor disagree
Strongly agree
Tend to disagree
Tend to agree
Strongly disagree (1%)
Base: All students; Wave 5 (1,007)
Strongly agree
%
All students 38
Science & engineering
43Social sciences 37Arts 30

Widening ParticipationEffect on Gaining EmploymentIncreasing numbers of graduates will make it harder for me to get a job
13%
15%
6% 21%4%
40%
Don’t know/no opinion
Neither agree nor disagree
Strongly agree
Tend to disagree
Tend to agree
Strongly disagree
Base: All students; Wave 3 (1,086), Wave 5 (1,007)
Strongly agree
%
Wave 3 10Wave 5 21Change +11

23%
10%3%
32%
10%
22%
Don’t know/ no opinion
Neither agree nor disagree
Strongly agree
Tend to disagree Tend to agree
Strongly disagree
Money & SuccessI feel under a lot of pressure to succeed and make money
Base: All students; Wave 1 (1,103), Wave 2 (1,068); Wave 3 (1,086), Wave 4 (1,065), Wave 5 (1,007)
Strongly agree
%
Wave 1 8Wave 2 10Wave 3 13Wave 4 15Wave 5 10
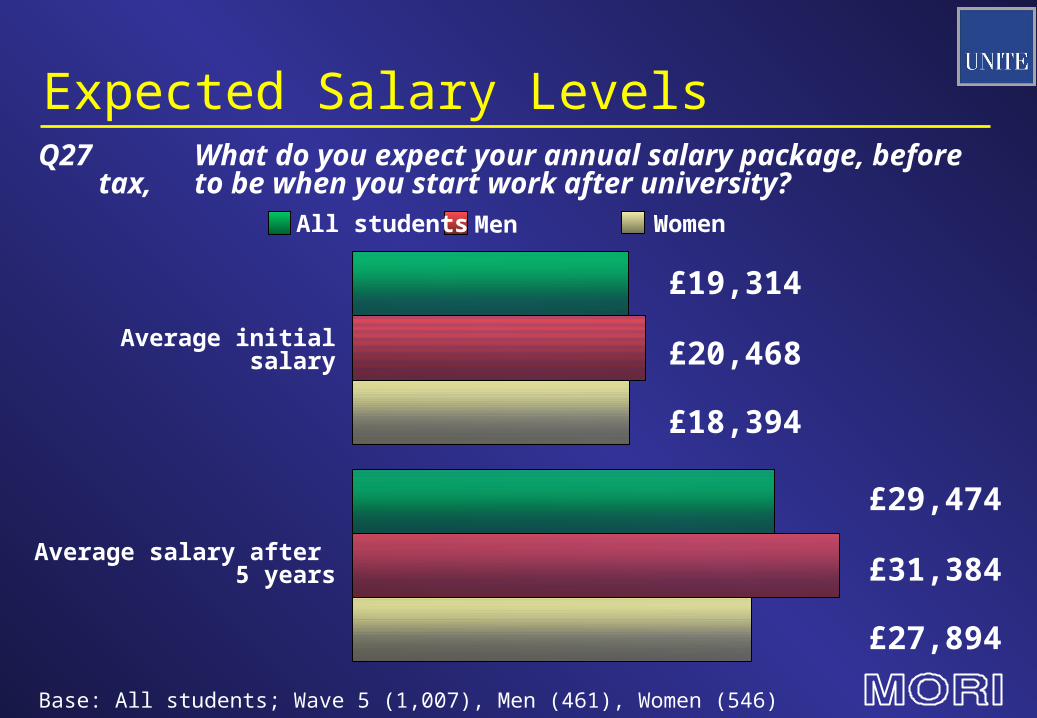
Expected Salary LevelsQ27 What do you expect your annual salary package, before
tax, to be when you start work after university?
Average initial salary
Average salary after 5 years
Base: All students; Wave 5 (1,007), Men (461), Women (546)
WomenAll students Men
£19,314
£20,468
£18,394
£29,474
£31,384
£27,894

Preparation for Working LifeUniversity has set me in good stead for my working life
47%
12%34%
3%
Don’t know/no opinion (3%)
Neither agree nor disagree Strongly
agree
Tend to disagree
Tend to agree
Strongly disagree (1%)
Base: All students; Wave 5 (1,007)
Strongly agree
%
All students 34
New university 30Old university 37

Will equip (1st Year)
Self confidence
Ability to work underpressure
Problem solving
Organisational ability
Working constructively with others
70%
64%
56%
51%
49%
Development of Soft SkillsQ22 First years….Which, if any do you feel university will equip you
with?Q23 Third+ years…Which, if any, has university already equipped you with?
Base: All 1st year students; Wave 5 (284), All 3+ year students (302)
49%
61%
48%
47%
46%
Already equipped (3+ Years)
47%
45%
45%
42%
24%
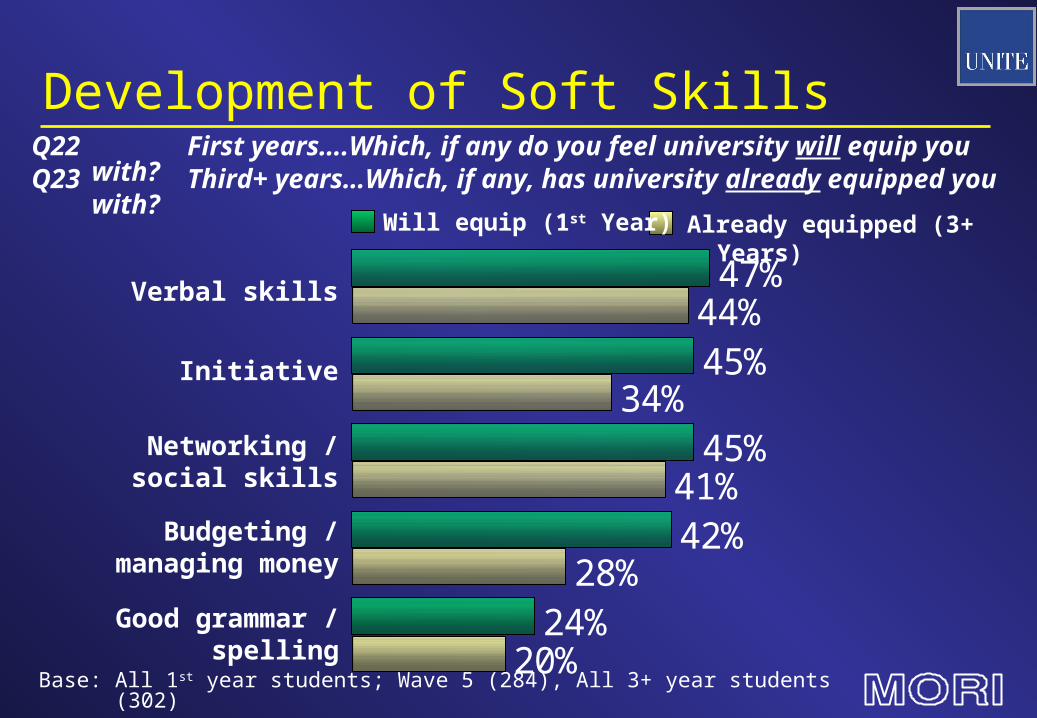
Development of Soft SkillsQ22 First years….Which, if any do you feel university will equip you
with?Q23 Third+ years…Which, if any, has university already equipped you with?
Base: All 1st year students; Wave 5 (284), All 3+ year students (302)
44%
34%
41%
28%
20%
Will equip (1st Year) Already equipped (3+ Years)
Verbal skills
Initiative
Networking / social skills
Budgeting / managing money
Good grammar / spelling

57%
49%
47%
43%
Development of Business SkillsQ22 First years….Which, if any do you feel university will equip you
with?Q23 Third+ years…Which, if any, has university already equipped you with?
Base: All 1st year students; Wave 5 (284), All 3+ year students (302)
58%
44%
48%
37%
Will equip (1st Year) Already equipped (3+ Years)
Giving presentations / speeches
IT skills
Report writing skills
Analyse complex issues

22%
13%
10%
Development of Business SkillsQ22 First years….Which, if any do you feel university will equip you
with?Q23 Third+ years…Which, if any, has university already equipped you with?
Base: All 1st year students; Wave 5 (284), All 3+ year students (302)
20%
9%
9%
Will equip (1st Year) Already equipped (3+ Years)
Good business sense
Commercially astute
Office skills

Key Findings

Key Findings (1) No statistically significant changes in social class profile of
students over five waves
Two-thirds receive a “great deal” of encouragement to go university by their family
The course remains the most important factor in the choice of university

Key Findings (2) Students are generally happy and contented, believing university to be
a worthwhile experience
Those who live away from home are happier, enjoying the freedom to live how they choose
The proportion of students who are feeling stressed is on the increase
Money continues to be a problem – and accounts for three of the top five “worst” aspects of university life
One the whole, students have a positive view of their university and are satisfied with the quality of teaching they receive

Key Findings (3) Few see academic aspects as key contenders for additional
funds, the library and increased security are given as the top priorities
Courses appear less demanding, as fewer students now feel “fully” stretched
One in eight have or are seriously considering changing course – most likely to be a result of them changing their mind or because the course had not met their expectations
Although sympathetic to the environment and social concerns, the majority are not active ethical consumers.

Key Findings (4) Students are less likely than the average British adult to
either donate their time or money to charity
Almost a quarter say they “will not vote” or are “undecided” on who they will vote for if there was a General Election tomorrow
Those who state a preference are most likely to support the Liberal Democrats
Four in ten students work during term-time, with the majority claiming to work to pay for basic essentials

Key Findings (5) Most likely to be employed in retail, bars and catering – few are
using the skills learned on their course
Most students consider themselves to be financially organised and to feel they are “keeping up with their bills & commitments”
As more feel confident about their abilities to manage their finances, fewer worry about paying off their debts than at any time since the study began
Most students are optimistic about getting a job despite possessing few business skills - they believe that university has given them a good grounding for their working life

Sample Profile (1)
All students (base) 1,103 1,068 1,086 1,065 1,007
Social class:AB 37% 38% 42% 41% 45%C1 41% 42% 41% 37% 34%C2DE 22% 18% 17% 20% 20%
Subject:Science and engineering 42% 41% 44% 44% 44%Social sciences 22% 25% 23% 22% 23%Arts 21% 20% 21% 22% 20%Other 15% 15% 12% 13% 13%(combined and education)
Unweighted percentages
Wave 1 Wave 2 Wave 3 Wave 4 Wave 5

Sample Profile (2)
All students (base) 1,103 1,068 1,086 1,065 1,007
Gender:Men 46% 46% 48% 44% 46%Women 54% 54% 52% 56% 54%
Type of student:Undergraduates 86% 89% 88% 86% 85%Postgraduates 12% 11% 12% 14% 15%
Mature student 33% 30% 29% 34% 32%
Type of university:Old 41% 50% 53% 51% 50%New 59% 50% 47% 49% 50%
Wave 1 Wave 2 Wave 3
Unweighted percentages
Wave 4 Wave 5