
Tikrit Journal of Eng. Sciences/Vol.14/No.1/March 2007
STUDY OF BENDING BEHAVIOR OF
REINFORCED CONCRETE SECTIONS UNDER
CYCLIC LOADS
Dr. Bayar Jaafer Al sulayfani Muna Mubarak Abdullah
Professor Ass. Lecturer Civil Engineering Dept.-Mosul University
ABSTRACT
This paper is concerned with the bending behavior of
reinforced concrete sections subjected to cyclic loads, such as
wind loads or earthquake loads. Previous studies have indicated
that the cyclic loading of such kind can cause failure in the joints
of a structure which subseguently put the structure into the state
of insability or collapse.the papear also pays attention to the
behavior of reinforced concrete beams and frames.
Modeling of the cyclic relationship between moment and
curvature is presented for the reinforced concrete sections under
effect of axial load and moment on the assumption of full bond
between steel and concrete. The shear deformation however is
sidestepped.
The stiffness method with the effective secant stiffness is
used in the analysis of the structures for calculating displacement
in each section and then getting the load-displacement curves,
moreover, the recurrence method is used in the analysis of simple
members in structures like reinforced concrete beams subjected
to cyclic loads.
(1-27) 1

Tikrit Journal of Eng. Sciences/Vol.14/No.1/March 2007
The current study presents a numerical model which is
capable of predicting the behavior of a reinforced concrete beam,
frame and joint subjected to cyclic loading. The effect of axial
force on the structure is also considered.
The study concludes that the effect of axial force in the
structural members is to decrease the energy absorption by these
members and increases their failure loads. It also shows that the
model used in the analysis of reinforced concrete sections has a
good accuracy, it has ability to decrease the time of computer
running compared with other methods, this makes it possible to
depend on the analysis .The stiffness and recurrence method
show good activity in the analysis from the obtained results.
KEYWORDS
Reinforced Concrete, Cyclic Loads, Beam-Column Connection,
Bending Behavior, Nonlinear Analysis.
NOTATIONS
M represents moment
Stand for curvature
EIºº and EI1º are the slopes of the two lines (A-A ) and(C-L)
G a constant value
represents the difference in curvature value
2,1 aa constant
YM is the yield moment
(2-27) 2

Tikrit Journal of Eng. Sciences/Vol.14/No.1/March 2007
INTRODUCTION
The beam to column connection, as pointed out by Ahmed,
J.D. and James, K.W. (1987) [1], is the portion of column with in
the depth of farming beams depending on its location in the
building, it may simply be a connection of two beams and a
column, as in the corner joints of the uppermost story of a
building frame .or it may be a complex as an interior joint with
members framing in all four monolithically with floor beams.
In the past, structural failure under cyclic load has been seldom
directly attributed to the failure of connections. Nevertheless, the
behavior of connection under cyclic loads like earthquake
concerns both the designers of multistory building and the
researchers who are engaged in developing satisfactory design
procedures .
REVIEW OF LITERATURE
The behavior of RC joint under cyclic loads like
earthquake was first introduced by Hanson and Connor 1967 [2];
they also introduced the relationship between moment-curvature
and load-deflection. They concluded that the cumulative ductility
of a test specimens provide a measure of the ability of a structure
to stand with seismic deformation.
A study by Robert Park, Kent, Sampson 1972 [3], concluded that
the moment-curvature responded by using stress -strain curve of
steel and concrete
(3-27) 3

Tikrit Journal of Eng. Sciences/Vol.14/No.1/March 2007
Namia and Darwin 1986 [4]; also found that, for several cyclic
loading, a decrease in the flexural reinforcement ratio reduces
both the maximum shear and compressive stress in concrete and
thus reduces the ratio of degradation.
Another study by Pilakoutas and Elnashai 1995 [5], present
the Load-deflection curve and compared it with the theoretical
results they found a good diversion between them.
In 2001 [6], a study by Hyo-Gyoung Kwak and Sun-Pil
Kim concluded that the moment-curvature relationship of a
reinforced concrete section can simulate the cyclic behavior of
reinforced concrete beams
Finally, Mustafa and Eren 2002 [7] draw the load-
deflection curves and found that using of SFRC (steel fiber
reinforced concrete) tends to increase the strength of bending
moment and shear force, and increasing the ductility.
MOMENT-CURVATURE RELATIONSHIP
Since the structure is composed of many structural
members and a member is formed by the integration of each
section, the nonlinear behavior of section causes nonlinear
behavior in the structure .In the case of beams inelastic
deformation occurs in the beam-column joint and/or at some
sections near mid span .These regions have been defined as
"critical" [8]. The stiffness at a critical region is defined as the
slop of the moment-curvature relationship .So, the nonlinear
(4-27) 4
Tikrit Journal of Eng. Sciences/Vol.14/No.1/March 2007
analysis of reinforced concrete members can be conducted using
moment-curvature relationship constructors by section analysis.
Under the cyclic loading, the shape of the moment-
curvature relationship of reinforced concrete section is very
much governed by the shape of stress -strain loop for the steel
because the applied moment is carried very largely by the steel
reinforcement placed in a section after the first yield excursion
and a ccompanships the rounding and pinching in the moment-
curvature loops [6] .This implies that there are generally assumed
parallelogram of classical elastoplastic behavior.
BASIC ASSUMPTIONS:
This paper is based on three assumptions:
1- Neglecting the deformation caused by shear.
2- Assuming perfect bond between steel and concrete.
3- Neglecting concrete strength in tension.
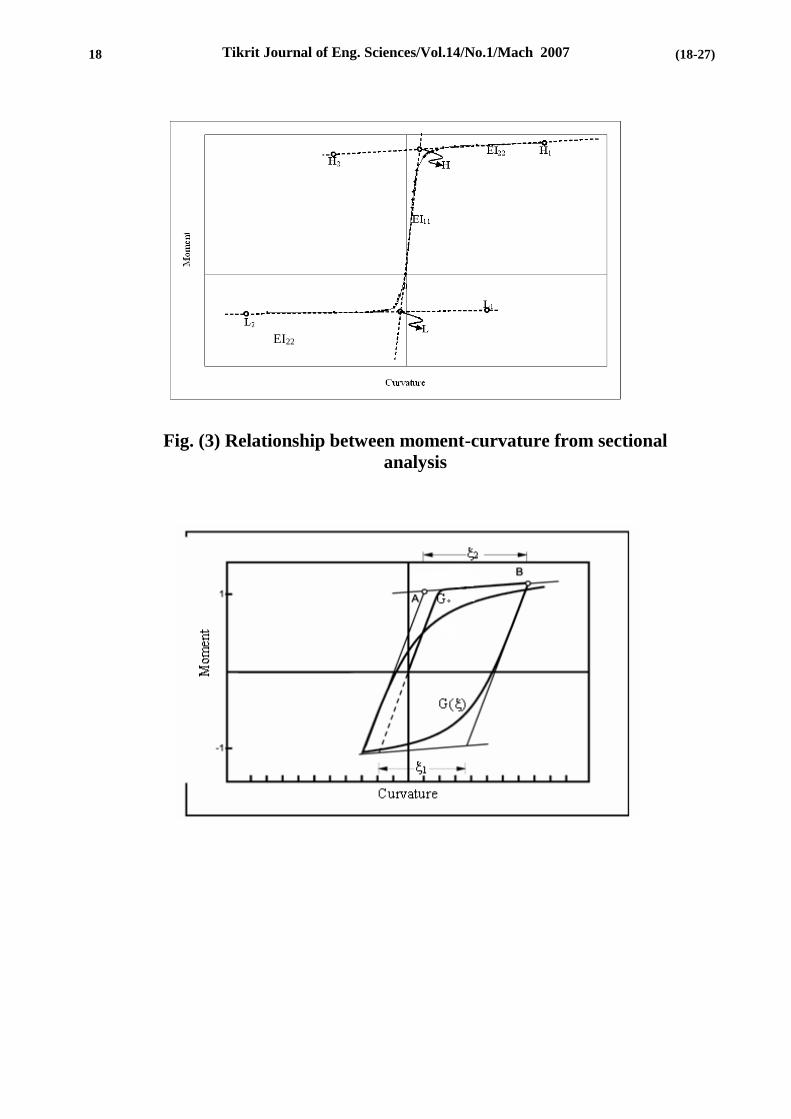
DEFINITION OF HYSTRESTIC CURVE:
Region 1 (Linear Region): Initial elastic branch with stiffness
EI path (O-A) and (O-A) Fig (1).
The region characterizes elastic loading and unloading as
the positive yielded moment +MY and the negative yielding
moment –MY is not exceeded the relationship between moment-
curvature is semi- linear.
(5-27) 5

Tikrit Journal of Eng. Sciences/Vol.14/No.1/March 2007
Region 2 (Curved Region): path (A-B) Fig (1).
The case of section when the concrete begin to creak and
loss large amount of its strength.
Region3 (Semi Linear Region): path (B-C) Fig (1).
This region can be defined as a semi-Linear Region where
the section loses a large amount of concrete strength, and the
sectional behavior will be under steel control.
The three regions can be expressed by this relation:
GG /1)1/()1(. +−+= ………………………………………… (1)
M represents moment
Stand for curvature
Can be defined from this relation:
oo
o
EI
EI1= …………………………………………………………………… (2)
)/()( o= ……………………………………………………………… (3)
)/)( o=…………………………………………………………... (4)
EIºº and EI1º are the slopes of the two lines (A-A ) and(C-L)
Fig(1), they will be explained later.
G a constant value will be explained later.
(6-27) 6

Tikrit Journal of Eng. Sciences/Vol.14/No.1/March 2007
Region 4 (Unloading Region): path (C-F) Fig (1).
The curve of this region is curved along the straight line
(c-t) with slope EI .The moment-curvature response of a section
initiates a shape very similar to that of the stress -strain of steel
[9] , and this trend continue during closing of crack because the
behavior in this region is dominantly affected by the amount of
longitudinal tension and compression reinforcement. This
phenomenon makes it possible to define the moment-curvature
relationship based on the hysteretic curve of steel Menegotto and
Pinto, (1973).
Region 5 (Reloading Region): from point (F-v) Fig (1).
The curve of this region is curved along the straight line (f-
z) with slop EI . The moment-curvature response of a section
initiates a shape very similar to that of the stress -strain of steel
.The behavior in this region is dominantly affected by the amount
of longitudinal tension and compression reinforcement.
The two regions (4 and 5) can be expressed by this
equations:
GG /1)1/()1(. +−+= ………………………………….. (5)
)/()( rr −−=
……………………………………………………….. (6)
)/()( r−−=
……………………………………………... (7)
(7-27) 7

Tikrit Journal of Eng. Sciences/Vol.14/No.1/March 2007
The stiffness EI represents the slope of line (O-S), and
the stiffness EI1 represents the slope of the line (D-a) .The two
points S2, S and the stiffness EI, EI1 can be calculated from the
analysis of the reinforced concrete section , assuming that the
concrete strain changed from (0-0.003) and then the location of
neutral axis can be calculated in every time the strain changed by
the equilibriums of the interior force see Fig. (2)
TCC NNN =+ 21 …………………………………………………………. (8)
In this way the value of moment and curvature can be
found for every location of neutral axis .The value of the
negative moment and curvature can be found by the same way by
changing the section from compression to tension.
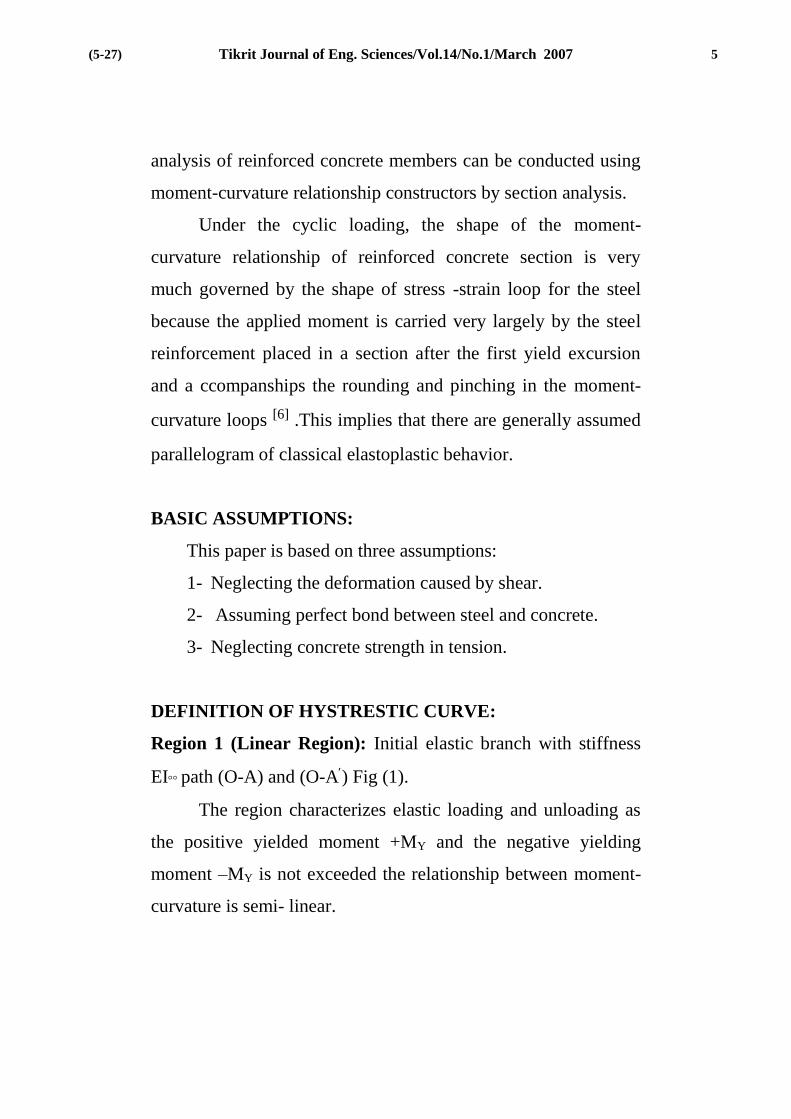
After that we can draw the relation between moment and
curvature as in Fig. (3) Below.
From the curve in Fig.(3), we can get the slope of the two
straight lines( H1-H2( ,)H-L( and point of intersection (H),and
straight lines (L1-L2)(, ) H-L( and point of intersection (L( as
well. In this way, the value of EI,EI1 and the two point S,S2 will
be known for the proposed model.
The two points (C and F) represent the last curvature
reversal with a moment of equal sign as in Fig (1).the change in
stiffness caused by the cracked section cannot sustain the
moment of an uncracked section due to the presence of open
(8-27) 8

Tikrit Journal of Eng. Sciences/Vol.14/No.1/March 2007
cracks in the compression region. The two points (r, Mr( and
(,) are updated after each curvature reversal.
Moreover, a critical issue in the curved hysteretic loop is
the determination of parameter G in eq.(1) since it influences the
shape of transition curve even though the influences of the G
value may not be great in the structural behavior. The G value in
eq.(1) cannot be easily determined because the shape of the
transition curve depends on many variables such as the amount
of compression and tensile of steel and its relative ratio, amount
of effective strain hardening, moment to shear ratio, and shape of
the cross section.
To calculate the value of G we can depend on this relation.
+−= 2/.1)( aaGG ………………………………………………... (9)
The value of represents the difference in curvature value
at any step iو i, the value of (,) will be updated after each
curvature reversal. See Fig. (4)
The value of each constant 2,1 aa can be calculated from
these relations:
c
s
E
Ea =1 ………………………………………………………………….. (10)
(9-27) 9

Tikrit Journal of Eng. Sciences/Vol.14/No.1/March 2007
cfHW
fsAAsa
y
+=
)(2 …………………………………………………... (11)
The relations (9 and 10) give a good diversion between the
experimental and theoretical values. Also the constant G can be
calculated to give a good diversion between the experimental and
theoretical values from this relation:
3851.00315.00522
−+−−= YYEG ………………………... (12)
Where YM is the yield moment in the reinforced concrete
section, see Fig. (5).
The equation (12) calculated by analysis group of
reinforced concrete section differed in dimensions and
reinforcement.
During unloading and reloading from an inelastic region a
signification reduction in stiffness occurs as the number of a
ternating loading cycle's increases.
Accordingly, neglecting loss of stiffness may lead to an
over estimating of the energy absorption capacity of the structure
and also to a reduction of the constitutive of moment -curvature
relationship propose
(10-27) 10

Tikrit Journal of Eng. Sciences/Vol.14/No.1/March 2007
NUMERICAL APPLICATIONS
To establish the applicability of the proposed hysteretic
moment-curvature relationship, a reinforced concrete beam and
frame are investigated and discussed
BEAM ANALYSIS
Beam P1
The geometric and cross -section dimension of the
specimen Beam P1are presented in Fig. (6) [10], and table (1)
shows the details of the longitudinal sections for beam p1, and
Fig. (7) Shows the chart of applied load on the beam p1
Fig (8) compares the moment-curvature relationship
obtained by the proposed model with the experimental results of
beam P1. Very satisfactory agreement between analysis and
experimental is observed. Fig. (9) shows the load-deflection
Relationship of beam P1.
Also the curves of moment-curvature and load-deflection
under partial reversal and repeated cyclic loads were drawn as
shown in these figers.
FRAME ANALYSIS:
We have two cases of frame analysis as shown in Fig. (14)
and table (2) shows the details of the longitudinal sections for
frame under analysis [11].
(11-27) 11

Tikrit Journal of Eng. Sciences/Vol.14/No.1/March 2007
First case:
The geometric and cross -section dimensions of the frame
are presented in Fig (15). Fig. (16) show the chart of applied load
on the frame (first case).
Fig (17) show the moment-curvature relationship obtained
by the proposed model and Fig (18) show the load-deflection
Relationship of the frame (first case).
Second case:
The geometric and cross -section dimensions of the frame
are presented in Fig. (19)
Fig. (20) Show the chart of applied load on the frame
(second case).
Fig. (21) Shows the moment-curvature relationship
obtained by the proposed model, and Fig. (22) Shows the load-
deflection Relationship of the frame (second case).
CONCLUSIONS
From the analytical obtained from this study, it can be
conclude that:
1. The proposed model for the nonlinear analysis of the
reinforced concrete section shows a good efficiency for the
analysis through the good representation of the moment-
curvature relationship for reinforced concrete section under
cyclic load.
(12-27) 12

Tikrit Journal of Eng. Sciences/Vol.14/No.1/March 2007
2. The proposed model can be effectively used to predict
structural response under cyclic loading, and its application can
be extended to the dynamic analysis of frame structure.
(13-27) 13

Tikrit Journal of Eng. Sciences/Vol.14/No.1/Mach 2007
REFERNCES
1- Ahmed, J.D. and James, K.W., "Earthquake Resistance of
Reinforced Concrete Interior Connection Including a Floor
Slab'', ACI Structural Journal, Sep - Oct, 1987.
2- Hanson, Norman W. and Connor, Harold W., "Seismic
Resistance of Reinforced Concrete Beam - Column
Joints'', Journal of Structural Division July, 1967. pp. 533-
560.
3- Park, Robert and Kent Dudley, Charles and. Sampson,
Richard A., "Reinforced Concrete Members with Cyclic
Loading", Journal of Structural Division July, vol. 98,
No.ST5, 1972, PP. 1341-1360.
4- Charies k. Nmai and David Darwin," Lightly Reinforced
Concrete Beams Under Cyclic Load", ACI Journal, Sep –
Oct, 1986.
5- Pilakoutas, Kypros and Elnashal, Amr, " Cyclic Behavior
of Reinforced Concrete Cantilever Walls, Part 1:
Experimental Results", ACI Structural Journal, May -June,
1995.
6- Kwak, Hyo-Gyoung and Kim, Sun-Pil, "Nonlinear
Analysis of R.C. Beam Subjected to Cyclic Loading",
Journal of Structural Engineering, vol.127, No.12, Des.
2001, PP. 1436-1444.
7- Gencoglu, Mustafa and Eren, Ilhan, " An Experimental
Study On The Effect Of Steel Fiber Reinforced Concrete
(14-27) 14

Tikrit Journal of Eng. Sciences/Vol.14/No.1/Mach 2007
On The Behavior of The Exterior Beam-Column Joints
Subjected to Reversal Cyclic Loading", Istanbul Technical
University, Civil Engineering Faculty, Division of
Structure, Feb. 2002.
8- Filippou, Filip-C. and Issa, Ahmad, "Nonlinear Reinforced
Concrete Frame Under Cyclic Load Reversals'', Report
No.USB/EERC-88/12 Earthquake Engineering, University
of California, Berkeley, Sep, 1988.
9- Kwak, Hyo-Gyoung and Filippou, Filip C., ''Finite
Element Analysis of R.C Structures Under Monotonic
Loads", Department of Civil Engineering, University of
California, Berkeley, Nov, 1990.
10- Al–Sulayfani, Bayar J.," Contribution A L'etude
Comportement Des Ossatures En Beton Arme Sous
Solicitations Cycliques Analysis Non-Linear Globale",
Docteur De L' Université De Nantes, Sepecialite Genie
civil, No.87-St, 1986.
11- Al-Taii, Hateim, "Behavior of Fibrous Prestressd Concrete
Frames Under Cyclic Loads'', M.SC. Thesis, Department
of Civil Engineering, University of Mosul, Iraq, January,
2004.
(15-27) 15

Tikrit Journal of Eng. Sciences/Vol.14/No.1/Mach 2007
Table (2) Details of the longitudinal sections for
frame under analysis.
Sectional
width (mm)
Sectional
hight (mm)
Area of
reinforcement (2mm)
(Mpa) fc
(Mpa) yf
200 400 402
23 573
402
Table (1) Details of the longitudinal sections for Beam P1
case Sectional
width (mm) Sectional
hight (mm) Area of
reinforcement 2(mm)
fc(Mpa)
yf
(Mpa)
First
and
second
300
300
300
400
1000
764
25 585 1000
764
member
column
beam 25 585
(16-27) 16

Tikrit Journal of Eng. Sciences/Vol.14/No.1/Mach 2007
0.85fc
As
As
d
d
w
d c
sb
c
st
c-d
d-d
Nt
Nc2
Nc1
Nt
Nc2
Nc1
Fig. (2) Analysis of reinforced concrete section
v
Fig.(1) Details of the mode used in this study .
(17-27) 17
Tikrit Journal of Eng. Sciences/Vol.14/No.1/Mach 2007
22EI
(18-27)
Fig. (3) Relationship between moment-curvature from sectional
analysis
18

Tikrit Journal of Eng. Sciences/Vol.14/No.1/Mach 2007
0
100
200
300
400
500
600
700
0 2 4 6 8 10 12
Mom
ent(
kN
.m)
G
Fig (5) Relation between moment and G
3000
mm
p
200 mm
40
0 m
m
2-16mm
2-16 mm
Fig (6) Details of Beam P1
-150
-100
-50
0
50
100
150
0 1 2 3 4 5
Cycle No.
Loa
d (k
N)
Lo
ad (
kN
)
Fig. (7) Chart of applied load on the beam p1
(19-27) 19
8

Tikrit Journal of Eng. Sciences/Vol.14/No.1/Mach 2007
19
8
-150
-100
-50
0
50
100
150
-0.02 -0.01 0 0.01 0.02 0.03
Deflection (m)
Load
(kN
)
Fig. (9) Load-deflection Relationship of Beam P1
-100
-80
-60
-40
-20
0
20
40
60
80
100
-0.1 -0.08 -0.06 -0.04 -0.02 0 0.02 0.04 0.06 0.08
Curvature (rad/m)
Mo
men
t (k
n.m
)
expremental
curent study
Fig. (8) Moment-curvature Relationship of Beam P1
-60
-40
-20
0
20
40
60
80
100
0 0.02 0.04 0.06 0.08 0.1
Curvature (rad/m)
Mo
men
t (k
N.m
)
Fig. (10) Moment-curvature relationship of beam P1 under
partial reversal loads
(20-27) 20
19
8

Tikrit Journal of Eng. Sciences/Vol.14/No.1/Mach 2007
-80
-60
-40
-20
0
20
40
60
80
100
120
0 0.005 0.01 0.015 0.02
Deflection (m)
Loa
d (k
N)
Fig. (11) Load-deflection Relationship of Beam P1 under partial reversal
loads
0
20
40
60
80
100
120
0 0.01 0.02 0.03 0.04 0.05
Deflection (m)
Fig. (13) Load-deflection Relationship of Beam P1 under partial rep
Lo
ad (
kN
)
0
20
40
60
80
100
0 0.02 0.04 0.06 0.08 0.1 0.12
Curvature (rad/m)
Fig. (12) Moment-curvature relationship of beam P1 under
partial repeated loa
Lo
ad (
kN
)
(21-27) 21
98

Tikrit Journal of Eng. Sciences/Vol.14/No.1/Mach 2007
21
98
3-18 mm
40
0
300
Section B-B
300 3
00
4-18 mm
Section A-A
4-18 mm
3-18 mm
3
5
2
1
7
8
9
4 6
4
1
3
2 7
8
5 6
1,2,…, Member No.
1 2 , ,… Node No.
P +
-
P
- +
Mode 1 Mode 2
Fig. (14) Cases of frame under analysis
-
+
3 5
2
1
7
8
9
4 6
P B
B
A A
3 m
5 m
-
+
P
Fig (15). Geometric and cross -section dimensions of the frame
(first case)
(22-27) 22
19
8

Tikrit Journal of Eng. Sciences/Vol.14/No.1/Mach 2007
-150
-100
-50
0
50
100
150
-0.02 -0.015 -0.01 -0.005 0 0.005 0.01 0.015
Cervature (rad/m)
Mo
men
t (k
N.M
)
Curvature (rad/m)
Mo
men
t (k
N.m
)
Fig. (18) (Load-deflection) Relationship of the frame (first case).
Fig (16) Chart of applied load on the frame (first case).
-150
-100
-50
0
50
100
150
-0.04 -0.03 -0.02 -0.01 0 0.01 0.02 0.03 0.04
Cervature (Rad/m)
Mo
mem
t (k
N.m
)
Curvature (rad/m)
Fig. (17) The (moment-curvature) relationship
(23-27) 23
21
98

Tikrit Journal of Eng. Sciences/Vol.14/No.1/Mach 2007
B
B
A A
3 m
5 m
-
+ P
2
3 5
1
7
8
9
4 6 -
+ P
3-18 mm
40
0
300
Section B-B
300
30
0
4-18 mm
Section A-A
4-18 mm
3-18 mm
Fig. (19) Geometric and cross -section dimensions of the
frame (first case)
-300
-200
-100
0
100
200
300
0 1 2 3 4 5
Cycle No.
Load
(kN
)
Fig. (20) Chart of applied load on the frame (second case).
(24-27) 24
19
8

Tikrit Journal of Eng. Sciences/Vol.14/No.1/Mach 2007
Curvature (rad/m)
Mo
men
t (k
N.m
)
Fig. (21) Moment-curvature relationship
Fig. (22) Load-deflection Relationship of the frame
(Second case).
-150
-100
-50
0
50
100
150
-0.03 -0.02 -0.01 0 0.01 0.02
Cervature (rad/m)
Mo
men
t (k
n.m
)
-250
-200
-150
-100
-50
0
50
100
150
200
250
-0.01 -0.005 0 0.005 0.01 0.015
Deflection (m)
Lo
ad (
kN
.m)
(25-27) 25
19
8

Tikrit Journal of Eng. Sciences/Vol.14/No.1/Mach 2007
تحت تاثير االحمال دراسة سلوك االنحناء للمقاطع الخرسانية المسلحة الدورية
بيار جعفر السليفاني منى مبارك عبدهللا د.
استاذ مدرس مساعد جامعة الموصل-قسم الهندسة المدنية
الصةالخ
بخر ذءنة بملذوث بمقذءع النثنذء فذي ذوكية في هذا بحثذت ذر سة ذ بمعرضذذ ىبذذم ل مذذءة سوةمذذ ير مذذءة برمذذءا لو بوذذك ل ةضذذة و بذذ بمذذء ذذ و ذذ لهمةذذذ فذذذي ذذذوقر ةم لو ف ذذذإ بمن ذذذءل ل ى بذذذك ل ذذذ أذذذ ة بحثذذذك و ب ة ذذذءل ل
ءصذذإ فةوذذء ومعوذذا اوةوذذء ذذر بمنذذءعا بف ذذإ دثذذ فذذي بمن ذذءل فعذذ ل ف ذذإ بمف بثرج . يمء عرق بحثت ىبم سة وكك بوةءكإ و بعوحءل بخر ءنة بملوث .
ومقذذذ ل بحثذذذت نمك جذذذء ةمءضذذذةء اذذذواو فلذذذوكك بعوحذذذءل و بوةءكذذذإ و بمفءصذذذإ بخر ءنة بملوث بك قع ثت رثةر مءة ب وةم .
قذذذ ب وةمذذذ عذذذة بعذذذكل و بوقذذذك بومقعذذذ و ذذذر فذذذي هذذذا ب ة ذذذ نماجذذذ بع بخر ءني بملوح ثت رثةر قكى بعكل و بضغط بمثكةمة قوذر ة وجذكس ذر فط ذءل
عة بخر ءن و ا بولوةح وموة رثةر بو ك بنء ج قكى بقص .كمء مت إلفءسة ذ عرمقذ بالذء ة و بالذء ة بقعءاةذ بمذيثرة فذي ثوةذإ
ل و لذذذءل بعذذذكول الف ذذذءل فذذذي يذذذإ قعذذذ و ءبوذذذءبي بث ذذذكة اوذذذم ا قذذذذ بمن ذذذء إلف ذذ ( ل فضذذ اذذ ذذوخ ل عرمقذذ بواء ذذإ فذذي ثوةذذإ اضذذء بحلذذةع -) بثمذذإ
بمن ر يءبعوحءل بخر ءنة بملوث بمعرض بأل مءة ب وةم . دضء . و ر في ب ة سأءة ءثةر بقكى بمثكةم اوم ها بمن ءل
أو ذذذذت ب ة ذذذذ بذذذذم بقذذذذكة بمثكةمذذذذ بمذذذذيثرة اوذذذذم اضذذذذء إلن ذذذذء ة ل ذذذومت فذذذي أوذذذك ة قءعوةذذذ هذذذا اضذذذء اوذذذم و ذذذء بعءقذذذ ال لنوذذذء سل بذذذم
(26-27) 26
19
8

Tikrit Journal of Eng. Sciences/Vol.14/No.1/Mach 2007
فمذذءسة مذذإ بف ذذإ بوذذا اضذذء فذذر ورل ب ة ذذ بنمذذك ل بملذذوخ ل فذذي ثوةذذإ عوذء و ذذرا فذذي اموةذذ بونفةذذا قءةنذذ بمقعذ بخر ذذءني بملذذوح امذذإ ف فذذء ة الفذذر
بعر ا أرى اعإ فذي إل ذء الاومذءس اوةذ فذي اموةذ بوثوةذإ . يمذء عةنذت عرمقوي بالء ة و بواء إ يفء ة جة ة في اموة بوثوةإ و بذ ذ أذ ة بنوذء ج بوذي
ر بث كة اوةوء.
الكلمات الدالة عة الام ة و بعك ةض. م ، الة حءط بخر ءن بملوث ، ال مءة ب وة
(27-27) 27
61
98


