
Study on the Determination Model of Four Kinds ofTea Polyphenols in Fresh Tea Based on Visible andNear-infrared SpectroscopyHailiang Zhang
East China JiaoTong UniversityWentao Dong
East China JiaoTong UniversityWei Luo
East China JiaoTong UniversityBaishao Zhan
East China JiaoTong UniversityHaihua Huang
East China JiaoTong UniversityHong Chen
East China JiaoTong UniversityKai Min
East China JiaoTong UniversityXuemei Liu ( [email protected] )
East China JiaoTong University https://orcid.org/0000-0001-9542-8656
Research
Keywords: Visible and near-infrared spectroscopy, Tea polyphenols, Partial least squares, Multiple linearregression, Least squares support vector machine, Characteristic wavelengths
Posted Date: December 15th, 2020
DOI: https://doi.org/10.21203/rs.3.rs-127370/v1
License: This work is licensed under a Creative Commons Attribution 4.0 International License. Read Full License

1
Study on the determination model of four kinds of tea polyphenols 1
in fresh tea based on visible and near-infrared spectroscopy 2
Hailiang Zhang1, Wentao Dong1, Wei Luo1, Baishao Zhan1, Haihua Huang1, Hong Chen2, Kai 3
Min3, Xuemei Liu3,* 4
5
1 College of Electrical and Automation Engineering, East China Jiaotong University, Nanchang 6
330013, China 7
2 Rail Transit Technology Innovation Center, East China Jiaotong University, Nanchang 330013, 8
China 9
3 College of Civil Engineering and Architecture, East China Jiaotong University, Nanchang 10
330013, China 11
12
Abstract 13
Background: For tea, tea polyphenols is an essential indicator to measure the quality of tea. In 14
this paper, the content of four tea polyphenols in fresh tea was determined by visible and 15
near-infrared spectroscopy combined with chemometrics. 16
Results: First, the spectrum data of three kinds of tea, Juhuachun (J), Zhenong25 (Z) and 17
Yingshuang (Y) were collected. A total of 159 samples were collected, 106 of which were used for 18
calibration and 53 for prediction. Then the content of tea polyphenols was determined by HPLC 19
and the physicochemical value samples were established. Subsequently, the spectral data was 20

2
preprocessed to eliminate noise interference, and a partial least squares (PLS) model was 21
established to select the optimal preprocessing method. In order to improve the efficiency and 22
accuracy of detection, Competitive adaptive reweighted sampling (CARS), Successive projections 23
algorithm (SPA) and Random frog algorithm (RF) were used to extract characteristic wavelengths 24
from the pretreatment spectrum. Based on characteristic wavelengths, PLS, multiple linear 25
regression (MLR) linear models and least squares support vector machine (LS-SVM) nonlinear 26
models were established to predict the content of four tea polyphenols. The performance of 27
LS-SVM models is superior to that of PLS and MLR models. The RP2 values of the four tea 28
polyphenols LS-SVM models based on SPA and CARS were increased to 0.996, 0.991, 0.997, 29
0.988 and 0.997, 0.991, 0.997, 0.984, respectively. The RP2 values of the four tea polyphenols 30
LS-SVM models based on RF were also increased to 0.996, 0.986, 0.994 and 0.977. 31
Conclusions: It can be found that the LS-SVM model based on SPA is the most suitable 32
prediction model for the content of tea polyphenols. It has the least input variables and better 33
performance. Therefore, visible and near-infrared spectroscopy can be used as an effective method 34
to measure the content of tea polyphenols in fresh tea. 35
Keywords:Visible and near-infrared spectroscopy; Tea polyphenols; Partial least squares; 36
Multiple linear regression; Least squares support vector machine; Characteristic wavelengths; 37
38
1. Introduction 39
Green tea is one of the three drinks with the largest consumption in the world because of its 40
unique taste, high nutritional value and health care effect on human body. Tea polyphenols are also 41

3
the most important functional substance in tea. Its main components not only affect the taste of tea, 42
but also have a remarkable influence on the nutritional value of tea. The content difference of tea 43
polyphenols in tea leaves has important influence on the quality of tea leaves. 44
Tea polyphenols are the general term for polyphenol compounds in tea and its main 45
component is catechin. There are 9 kinds of catechin monomers, of which 4 monomers, EGC 46
(epigallocatechin), EGCG (epigallocatechin gallate), EC (epicatechin) and ECG (epicatechin 47
gallate) content is higher than other monomers [1]. Studies have shown that tea polyphenols, as an 48
antioxidant, have a preventive effect on cancer and various cardiovascular diseases [2]. It can 49
improve the immunity of human body and have a good health care effect on human body, which is 50
an important symbol to measure the quality of tea [3]. 51
At present, the detection of tea polyphenols and other chemical components in tea mainly 52
adopts high performance liquid chromatography (HPLC) [4]. This method has some disadvantages 53
such as longer analysis time, more complicated operation and higher requirement on instrument 54
and equipment. The non-destructive spectroscopy technology can provide sample information 55
without damaging the sample. Therefore, in recent years, the spectral detection technology has 56
been studied deeply [5] and the spectral based tea quality detection technology has also been 57
developing continuously. Zhang et al. [6] used visible and near-infrared spectroscopy to rapidly 58
detect the water content in tea leaves. Jin [7] achieved rapid quantitative detection of physiological 59
and biochemical indicators of tea under heavy metal stress based on hyperspectral imaging 60
technology. Dutta et al. [8] combined remote sensing technology and near-infrared spectroscopy to 61
identify the quality of black tea and green tea. Chen et al. [9] used surface-enhanced Raman 62
spectroscopy to analyze the quality of tea. 63

4
Near-infrared spectroscopy technology has been widely used in the detection of tea chemical 64
components in recent years because of its fast, simple and portable characteristics. Bai et al. [10] 65
established a detection model for tea polyphenols, moisture and caffeine content in tea powder 66
based on near-infrared spectroscopy technology. Liu Ze et al. [11] rapidly determined tea 67
polyphenols and other compounds in Pu'er tea by combining near-infrared spectroscopy and 68
weighted partial least square method. Zhang [12] used near-infrared spectroscopy to detect the 69
content of tea polyphenols in different leaf positions. 70
In this article, three tea varieties were used as samples. After preprocessing the spectral data 71
by different methods, established a partial least squares regression model. Then, successive 72
projections algorithm (SPA) , competitive adaptive reweighted sampling (CARS) and random frog 73
(RF) were used to extract the characteristic wavelengths. Based on the characteristic wavelengths, 74
partial least squares regression model (PLS), multiple linear regression model (MLR) and least 75
square support vector machine model (LS-SVM) were established respectively. And through the 76
determination coefficient (R2) and root mean square error (RMSE) to evaluate the predictive 77
ability of the model. 78
The objectives of this study were: (1) to explore the feasibility of visible and near-infrared 79
spectroscopy in predicting tea polyphenols content; (2) to evaluate the performance of the three 80
kinds of method to extract characteristic wavelengths; (3) to establish a high efficiency and high 81
accuracy predictive model to detect the content of tea polyphenols in tea. 82
2. Materials and methods 83
2.1. Sample preparation 84
5
Three tea samples were used in this experiment, Juhuachun (J), Zhenong25 (Z) and 85
Yingshuang (Y), which were picked at the Huajiachi Campus of Zhejiang University (120.206 E, 86
30.274 N). A total of 159 tea samples were obtained for the experiment, and all the samples were 87
divided into calibration set and prediction set according to 2:1. There were 106 samples in the 88
calibration set and 53 samples in the prediction set. 89
2.2. Spectra acquisition 90
The Vis-NIR spectra were collected by using a near infrared spectrometer (XDS, Foss Pacific 91
Pty Ltd, Denmark) in this experiment. Spectral resolution of 2 nm over the range of 400-2498 nm, 92
and it contains 1050 bands. To simulate the state of the tea leaves just picked, no tea samples were 93
processed. In order to improve the signal to noise ratio, each tea sample was scanned three times 94
and the average data of the three spectra was used for the next analysis. The spectral collection 95
and analysis were conducted by the ISIscan 1.50 (Infrasoft International LLC, State College, PA, 96
USA). 97
2.3. HPLC measurement 98
After collecting the spectra, the tea samples were frozen in a freeze-dryer (LABCONCO, 99
USA) for 24 hours. Then, the sample was ground into a powder with a grinder (FW100, Taisite 100
Instrument Co., Ltd., Tianjin, China) and sieved through a 60-mesh sieve to obtain a sample of tea 101
powder. Subsequently, 0.1g of each tea powder sample was weighed and 25mL water was added 102
to stir evenly. The tea powder was heated in a water bath at 85℃ for 20min. The supernatant was 103
filtered by a 0.22μm membrane filter and then analyzed by HPLC [13]. The whole experiment was 104
conducted at room temperature and in the dark to avoid the decomposition of tea polyphenols. 105

6
In this experiment, shimadzu LC-2-AD HPLC system (Shimadzu Co., Kyoto, Japan) with 106
UV–Visible detector (wavelength range: 190–600 nm) was used. Mobile phase were: (A) acetic 107
acid/acetonitrile/distilled water (0.5:3:96.5) and (B) acetic acid/acetonitrile/distilled water 108
(0.5:30:69.5). The flow rate was 1.0 mL/min and the injection volume was 10μL. The UV 109
detection wavelength was 280nm and the column temperature was maintained at 35℃. 110
2.4. Spectral preprocessing 111
In addition to the chemical composition information of the sample, the spectral data collected 112
through near-infrared spectroscopy may also include noise pollution and baseline drift caused by 113
some equipment or the external environment. It will reduce the accuracy of the calibration model. 114
Therefore, the data needs to be processed to eliminate the interference of these irrelevant 115
information. This article uses three preprocessing methods, namely Savitzky-Golay smoothing, 116
standard normal variate (SNV), and baseline correction (Baseline). The PLS model is established 117
by pretreatment spectrum, and the effect of the preprocessing method is evaluated according to the 118
performance of the model. The preprocessing and PLS modeling were carried out in Unscrambler 119
10.1. 120
2.5. Extraction of characteristic wavelengths 121
NIR spectroscopy usually contains thousands of variables, of which quite a few variables 122
have a collinearity relationship and some variables contain useless information. Therefore, using 123
full spectral data for modeling will not only increase the calculation time of the model and reduce 124
the detection efficiency, but also has a certain impact on the predictive ability of the model. To 125
address this problem, it is necessary to extract characteristic wavelengths from the full spectrum 126

7
data to reduce the dimension of the NIR spectrum [14]. The CARS, SPA and RF were used to 127
extract characteristic wavelengths in this paper. 128
2.5.1. Competitive adaptive reweighted sampling 129
CARS is a common method for selecting spectral variables. By combining exponentially 130
decreasing function (EDF) with adaptive reweighted sampling (ARS) , the wavelength points with 131
large absolute regression coefficient in the PLS model are selected and the wavelength points with 132
small weight are eliminated. Then, the lowest the root mean square error (RMSE) subset is 133
selected as the characteristic wavelength set through cross-validation [15]. The running process of 134
CARS mainly includes the following four steps: (1) Sample the model by Monte Carlo method; (2) 135
Remove variables by exponentially decreasing function; (3) Remove variables further by adaptive 136
reweighted sampling; (4) Calculate the RMSEV value of the variable subset, and selecting the 137
subset with the smallest RMSEV as the characteristic wavelength set [16]. 138
2.5.2. Successive projections algorithm 139
SPA is mainly used to solve collinearity problems in multiple linear regression problems. In 140
recent years, it has been widely used. SPA is a forward cycle selection method, which begins with 141
a wavelength, successive cycle forward calculation. Each time the projection of the selected 142
wavelength on the unselected wavelength is calculated, the wavelength with the largest projection 143
distance is introduced into the characteristic wavelength set. Finally, a multiple linear regression 144
model is established for each selected wavelength to obtain RMSE of the validation set. The 145
smallest RMSE the characteristic wavelength subset is the optimal set [17]. SPA can select the 146
wavelength with minimum collinearity from all spectral data to reduce the number of wavelengths 147

8
required for model establishment. Thus, it can improve detection efficiency. SPA mainly includes 148
the following three steps: (1) Calculate the projection of the selected wavelength on the unselected 149
wavelength through the algorithm, and obtain the candidate subset with the minimum collinearity 150
variable; (2) Calculate the RMSEV of the validation set using multiple linear regression; (3) Select 151
the subset corresponding to the minimum RMSEV and remove the irrelevant variables [18]. 152
2.5.3. Random frog algorithm 153
Random frog algorithm is an algorithm proposed based on inspiring group optimization to 154
solve combinatorial optimization problems. It constructs a Markov Chain in the model space to 155
calculate the probability of each variable being selected, and selects the characteristic wavelength 156
according to the probability of being selected. RF has high detection efficiency and excellent 157
global search capability. The main steps of RF are divided into the following 3 steps: (1) Initialize 158
the variable subset V0 containing variable Q, the number of iterations N and other parameters; (2) 159
Propose a candidate subset V* containing variable Q* based on V0, take V* with a certain 160
probability as V1 and replace V0 with V1. Then, perform a new round of iterations until N 161
iterations are performed; (3) Calculate the probability of each wavelength being selected. The 162
greater the probability, the more important the wavelength [19]. Thus, the characteristic 163
wavelength is selected. 164
2.6. Model establishment and evaluation 165
In this paper, PLS and MLR were used to establish a linear model and LS-SVM was used to 166
establish a nonlinear model to predict four kinds of tea polyphenol monomers. 167
PLS is the most widely used modeling method in spectral analysis due to its advantages of 168

9
convenience, stability, accuracy, and wide applicability [20]. In PLS analysis, the information in 169
the spectral matrix and the concentration matrix can be considered at the same time. Thereby 170
improving the predictive ability of the model and having the ability to process a large amount of 171
spectral data [21]. Therefore, PLS was used to model the full spectrum data and characteristic 172
wavelengths in this paper. And through the performance of the PLS model to evaluate the effect of 173
the pretreatment method. 174
MLR is a method used to analyze the relationship between multiple independent variables 175
and a single dependent variable. It is often used to deal with linear problems in models [22]. MLR 176
is only applicable to data with a sample number more than the spectral number, so MLR is often 177
used to establish a calibration model based on the characteristic wavelength. 178
LS-SVM is an improved algorithm based on support vector machine. It replaces the more 179
complicated quadratic programming method in the original SVM by solving a set of linear 180
equations to increase the speed of calculation and reduce the complexity [23]. The input variables 181
with rich information content can improve the operational efficiency of LS-SVM, so LS-SVM can 182
deal with both linear and nonlinear problems [24]. 183
After the model was established, the predictive performance of the model was evaluated by 184
R2, RMSE and residual predictive deviation (RPD), respectively [25]. The calculation formula of 185
these indicators is as follows: 186
n
1i
2
1
22 ˆ1 ii
n
i
ii y-yy-y-R (1) 187
n
i
ii-yyn
RMSE1
21 (2) 188

10
2
1
1
P-RRPD (3) 189
Where n is the number of samples, iy is the actual chemical value of the ith sample,
iy 190
is the predicted value of the ith sample, and iy is the average of the actual chemical values of all 191
samples. This study was conducted in Unscrambler10.1 (CAMO PRECESS AS, Oslo, Norway) 192
and Matlab2010a (The Math Works, Natick, USA) . 193
3. Results and discussion 194
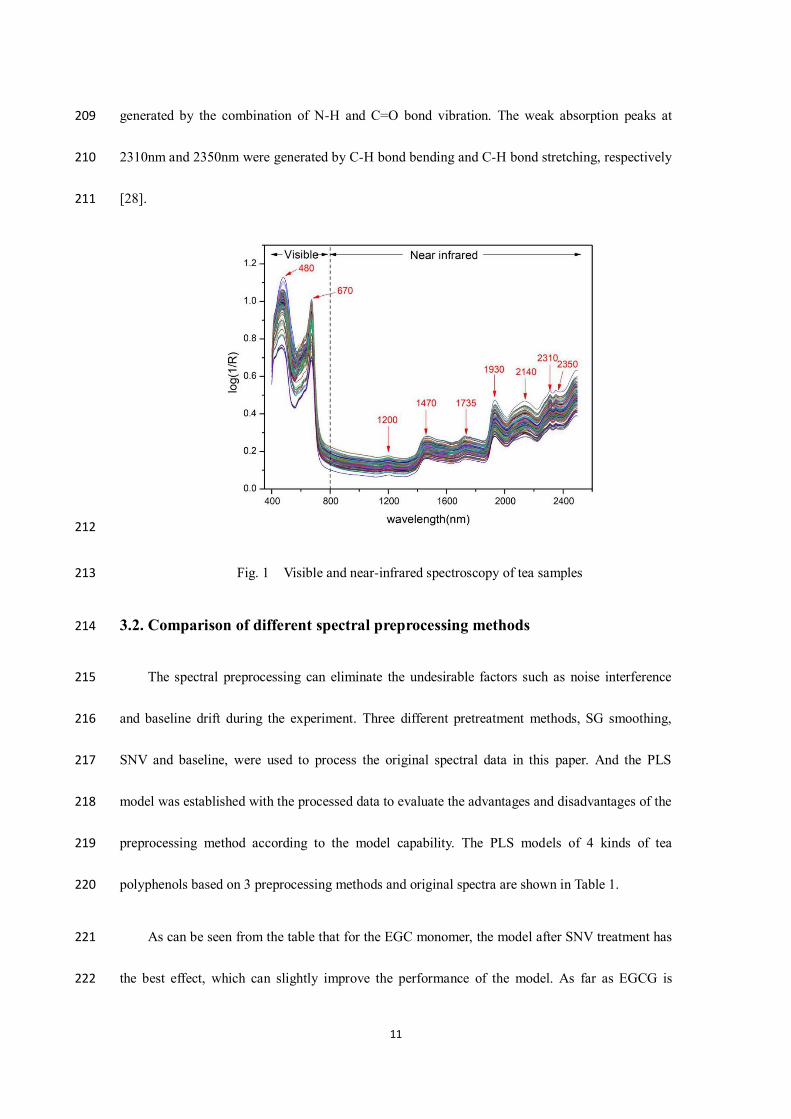
3.1. Vis-NIR spectroscopy analysis 195
NIR spectroscopy is based on the stretching vibration and combined frequency between 196
molecules to absorb the spectrum. Because the spectral absorption characteristics of different 197
groups are significantly different, the near-infrared spectrum can reflect the molecular structure 198
and composition information of the sample. The Vis-NIR spectroscopy of tea samples within the 199
range of 400nm-2500nm are shown in Figure. 1. The visible region is 400-800nm, and the 200
near-infrared region is 800-2500nm. 201
There were two absorption peaks in the visible region, located at 480nm and 670nm, which 202
were mainly caused by the absorption of O-bonds and O-H bonds [26]. There were 7 main 203
absorption peaks in the near-infrared region, and the relatively flat absorption peak at 1200nm was 204
mainly caused by the C-H bond stretching of CH2. The absorption peak around 1470nm was 205
generated by the O-H and C-H bonds. The absorption peak near 1735nm was generated by the 206
vibration of the C-H bond of CH3. While the strong absorption peak at 1930nm was caused by the 207
combined transformation of O-H bond and HOH [27]. The absorption peak at 2140nm was 208
11
generated by the combination of N-H and C=O bond vibration. The weak absorption peaks at 209
2310nm and 2350nm were generated by C-H bond bending and C-H bond stretching, respectively 210
[28]. 211
212
Fig. 1 Visible and near-infrared spectroscopy of tea samples 213
3.2. Comparison of different spectral preprocessing methods 214
The spectral preprocessing can eliminate the undesirable factors such as noise interference 215
and baseline drift during the experiment. Three different pretreatment methods, SG smoothing, 216
SNV and baseline, were used to process the original spectral data in this paper. And the PLS 217
model was established with the processed data to evaluate the advantages and disadvantages of the 218
preprocessing method according to the model capability. The PLS models of 4 kinds of tea 219
polyphenols based on 3 preprocessing methods and original spectra are shown in Table 1. 220
As can be seen from the table that for the EGC monomer, the model after SNV treatment has 221
the best effect, which can slightly improve the performance of the model. As far as EGCG is 222

12
concerned, the ability of the model after preprocessing is somewhat reduced. The model of EC 223
monomer is similar to that of EGC, SNV can improve the predictive ability of the model slightly. 224
Similar to EGCG, the ECG model based on raw spectral data is superior to the model built after 225
data preprocessing. From what has been discussed above, in the subsequent research, EGC and EC 226
monomers were pretreated by SNV, and raw spectral data were used for modeling for EGCG and 227
ECG. 228
Table 1 The PLS model processed by different preprocessing methods 229
Constituent Pretreatment RMSEC RC2 RMSEV RV
2 RMSEP RP
2 RPD
EGC
Raw 6.974 0.932 7.889 0.914 6.882 0.933 3.863
SNV 6.580 0.940 7.761 0.917 6.592 0.939 4.048
Baseline 6.863 0.933 7.859 0.915 7.120 0.928 3.726
SG 6.974 0.931 7.889 0.914 6.882 0.933 3.863
EGCG
Raw 9.887 0.953 11.163 0.941 9.687 0.955 4.714
SNV 11.935 0.931 14.413 0.902 11.658 0.935 3.922
Baseline 11.681 0.934 13.239 0.917 11.710 0.934 3.892
SG 9.888 0.953 11.164 0.941 9.688 0.954 4.662
EC
Raw 2.461 0.915 2.934 0.881 2.480 0.913 3.390
SNV 2.460 0.916 3.033 0.873 2.450 0.916 3.450
Baseline 2.432 0.917 2.863 0.887 2.473 0.914 3.409
SG 2.461 0.915 2.935 0.881 2.481 0.913 3.390
ECG
Raw 5.460 0.893 6.221 0.864 5.467 0.892 3.042
SNV 5.515 0.891 6.161 0.866 5.545 0.889 3.001
Baseline 5.619 0.887 6.366 0.857 5.550 0.889 3.001
SG 5.462 0.893 6.222 0.864 5.468 0.891 3.028
3.3. Extraction of characteristic wavelengths 230
13
The prediction model based on full spectrum contains 1050 wavelengths. The model takes a 231
long time to calculate and the data collinearity is serious. There are many interference information. 232
Therefore, in order to solve this problem, CARS, SPA and RF were used in this study to extract 233
characteristic wavelengths from the pretreatment spectrum data [29]. 234
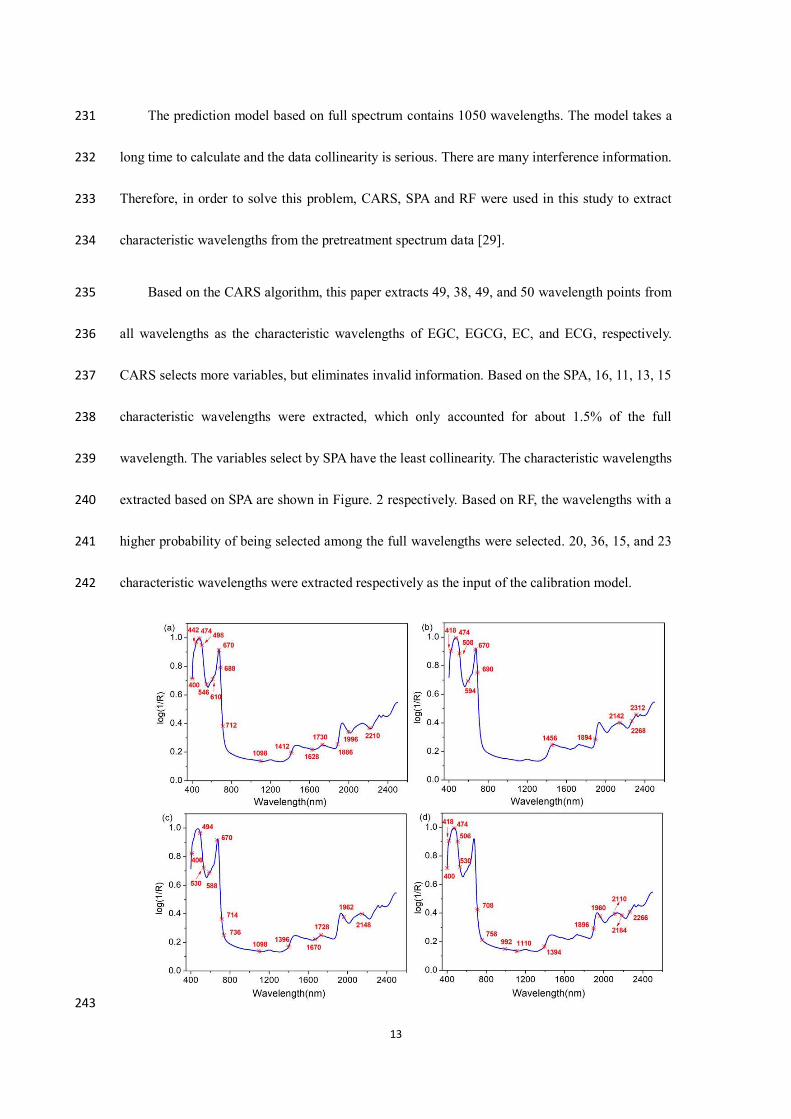
Based on the CARS algorithm, this paper extracts 49, 38, 49, and 50 wavelength points from 235
all wavelengths as the characteristic wavelengths of EGC, EGCG, EC, and ECG, respectively. 236
CARS selects more variables, but eliminates invalid information. Based on the SPA, 16, 11, 13, 15 237
characteristic wavelengths were extracted, which only accounted for about 1.5% of the full 238
wavelength. The variables select by SPA have the least collinearity. The characteristic wavelengths 239
extracted based on SPA are shown in Figure. 2 respectively. Based on RF, the wavelengths with a 240
higher probability of being selected among the full wavelengths were selected. 20, 36, 15, and 23 241
characteristic wavelengths were extracted respectively as the input of the calibration model. 242
243
14
Fig. 2 The characteristic wavelength is extracted from the optimal pretreatment spectrum 244
based on SPA, (a)EGC (b)EGCG (c)EC (d)ECG 245
3.4. The establishment of linear model 246
After the characteristic wavelength extraction, the number of wavelength is greatly reduced 247
and the detection efficiency is improved. Subsequently, the characteristic wavelength extracted 248
based on CARS、SPA and RF are used to establish PLS and MLR models, and compared with the 249
PLS model established at the full wavelength to evaluate the performance of the model. The 250
modeling results of the PLS model and MLR model established with different wavelengths are 251
shown in Table 2 and Table 3. 252
As can be seen from Table 2, the PLS model based on full wavelength is the best for EGC. 253
The performance of models established based on CARS, SPA and RF extracted characteristic 254
wavelengths have decreased, which may be caused by excluding some useful information when 255
extracting characteristic wavelengths. But RP2 still has 0.914 and 0.923, the performance of the 256
model is still acceptable. The EGCG model is similar to EGC. The model based on the full 257
wavelength has the best effect, but the model based on CARS is close to the full wavelength 258
model. As far as EC is concerned, the model based on CARS has the best performance and RP2 is 259
increased to 0.928. For ECG, the model based on SPA has the best performance. The RP2 is 0.898, 260
which is close to 0.9, and the effect is acceptable. It can be seen from Table 3 that, for all tea 261
polyphenol monomers, the MLR model based on the characteristic wavelength extracted by 262
CARS has the best performance. As far as EGCG is concerned, the performance of the MLR 263
model based on RF is better than that of the model based on SPA. For EGC, EC and ECG, the 264

15
effects of the RF model and the SPA model are similar, but both are worse than the CARS model. 265
Comparing the results in Table 2 and Table 3, it can be found that the performance of the 266
MLR model based on the characteristic wavelength is generally better than the PLS model. This 267
shows that the MLR model is more suitable for predicting the content of tea polyphenols than the 268
PLS model. In summary, CARS, SPA and RF are all effective feature wavelength extraction 269
methods. The RP2 value of the model based on the characteristic wavelength is above 0.9 or close 270
to 0.9, and the effect is within the acceptable range. Moreover, it simplifies the input wavelength 271
and improves the detection efficiency. 272
Table 2 PLS models of four tea polyphenols based on different wavelengths 273
Constituent Pretreatment Num RMSEC RC2 RMSEV RV
2 RMSEP RP
2
EGC SNV
1050 6.580 0.940 7.761 0.917 6.592 0.939
16 7.296 0.925 8.323 0.904 7.400 0.923
49 7.213 0.927 8.300 0.905 7.800 0.914
20 7.797 0.914 9.227 0.882 8.068 0.908
EGCG Raw
1050 9.887 0.953 11.163 0.941 9.687 0.955
11 11.078 0.941 12.410 0.927 10.909 0.943
38 10.150 0.950 11.757 0.935 9.702 0.954
36 11.678 0.934 12.933 0.921 10.753 0.944
EC SNV
1050 2.460 0.916 3.033 0.873 2.450 0.916
13 2.952 0.878 3.418 0.839 2.965 0.877
49 2.107 0.937 2.444 0.918 2.269 0.928
15 2.094 0.938 2.334 0.925 2.059 0.940
ECG Raw
1050 5.460 0.893 6.221 0.864 5.467 0.892
15 5.239 0.901 5.845 0.880 5.325 0.898

16
50 5.682 0.884 6.459 0.853 5.727 0.882
23 5.460 0.893 5.976 0.875 5.670 0.884
274
Table 3 MLR models of four tea polyphenols based on different wavelengths 275
Constituent Pretreatment Num RMSEC RC2 RMSEP RP
2
EGC SNV
16 5.004 0.979 5.349 0.964
49 2.367 0.992 4.668 0.984
20 5.402 0.977 5.695 0.959
EGCG Raw
11 9.687 0.977 10.145 0.950
38 5.612 0.990 6.368 0.984
36 7.201 0.980 9.032 0.975
EC SNV
13 1.725 0.979 1.812 0.954
49 0.874 0.989 1.476 0.984
15 1.664 0.980 1.772 0.956
ECG Raw
15 4.282 0.961 4.630 0.934
50 2.494 0.977 3.872 0.973
23 4.196 0.968 4.089 0.940
3.5. The establishment of nonlinear model 276
As PLS and MLR are both linear calibration methods, to further improve the accuracy of the 277
model, a nonlinear modeling method is used for research. This article uses the LS-SVM algorithm 278
to build the model. LS-SVM is an improved algorithm based on the SVM algorithm, which can 279
effectively deal with linear and nonlinear problems in multivariate analysis, and is a common 280
nonlinear modeling method. In this paper, the characteristic wavelength extracted by CARS, SPA 281
and RF is used as the input of the model. The performance of the model is shown in Table 4. The 282
scatter plots of model predicted values and measured values are shown in Figure. 3, Figure. 4 and 283

17
Figure. 5. 284
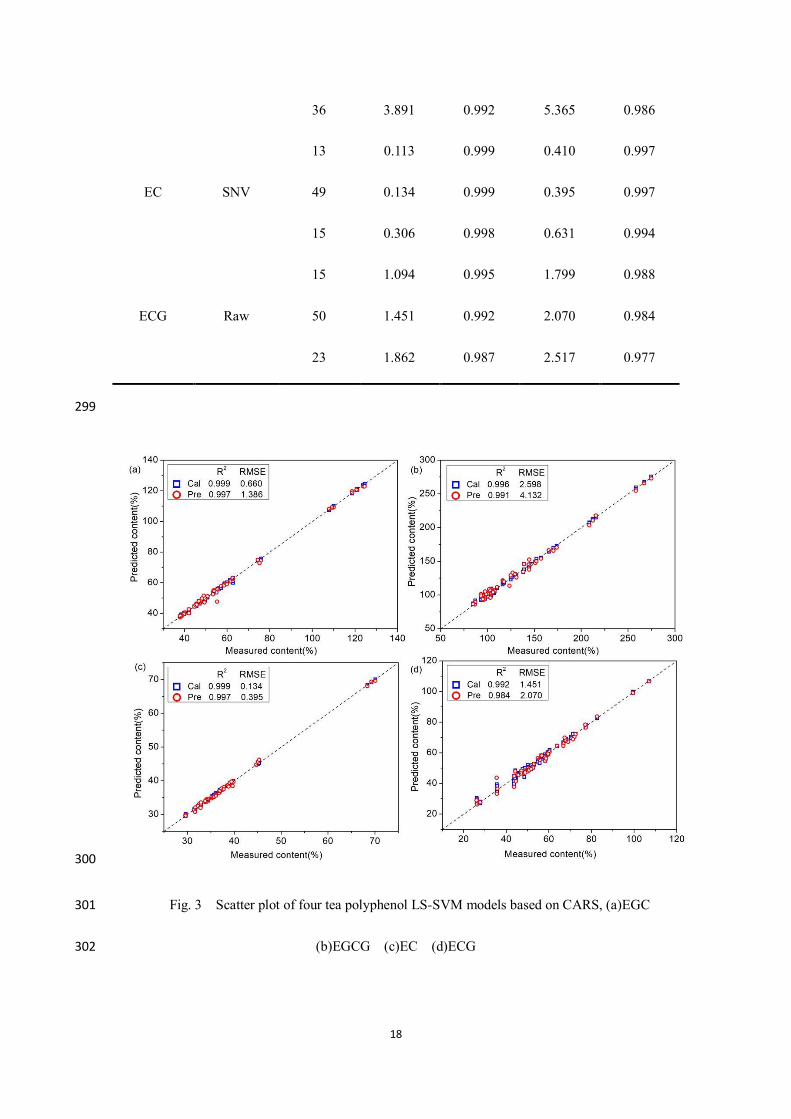
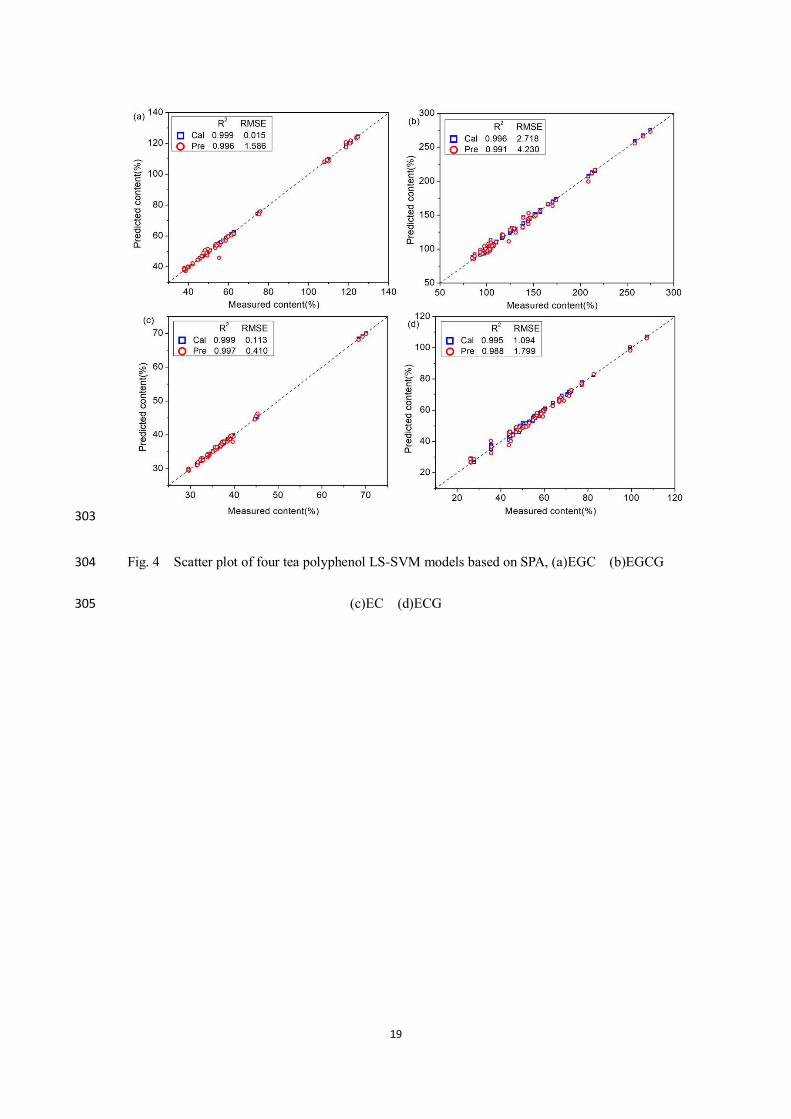
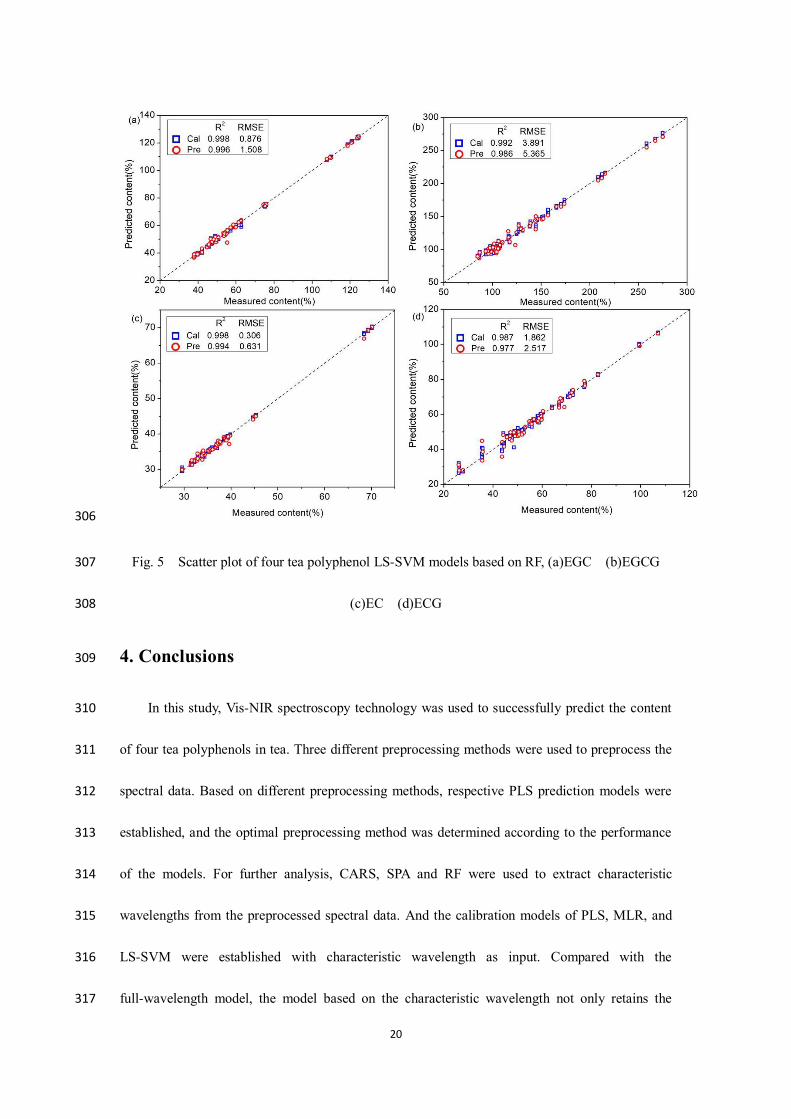
By comparing Table 2, Table 3 and Table 4, it can be seen that compared with the PLS and 285
MLR models, the predictive ability of the LS-SVM model has been greatly improved. The RP2 286
values of the four tea polyphenols models based on SPA and CARS were increased to 0.996, 0.991, 287
0.997, 0.988 and 0.997, 0.991, 0.997, 0.984, respectively. The RP2 values of the four tea 288
polyphenols models based on RF were also increased to 0.996, 0.986, 0.994 and 0.977. This 289
indicates that there is a nonlinear relationship between the spectral information and the content of 290
tea polyphenol. The LS-SVM model can process linear and nonlinear relationships at the same 291
time, so the performance of the model is relatively excellent. In summary, the LS-SVM model 292
based on the characteristic wavelength extracted by SPA, CARS and RF has achieved good 293
prediction effect. Among them, the LS-SVM model based on SPA is most suitable for detecting 294
the content of tea polyphenols. This model has the least number of input wavelengths, improves 295
the detection efficiency, and achieves relatively excellent results. It has high scientific significance 296
for realizing rapid non-destructive testing. 297
Table 4 LS-SVM models of four tea polyphenols based on characteristic wavelengths 298
Constituent Pretreatment Num RMSEC RC2 RMSEP RP
2
EGC SNV
16 0.015 0.999 1.586 0.996
49 0.660 0.999 1.386 0.997
20 0.876 0.998 1.508 0.996
EGCG Raw
11 2.718 0.996 4.230 0.991
38 2.598 0.996 4.132 0.991
18
36 3.891 0.992 5.365 0.986
EC SNV
13 0.113 0.999 0.410 0.997
49 0.134 0.999 0.395 0.997
15 0.306 0.998 0.631 0.994
ECG Raw
15 1.094 0.995 1.799 0.988
50 1.451 0.992 2.070 0.984
23 1.862 0.987 2.517 0.977
299
300
Fig. 3 Scatter plot of four tea polyphenol LS-SVM models based on CARS, (a)EGC 301
(b)EGCG (c)EC (d)ECG 302
19
303
Fig. 4 Scatter plot of four tea polyphenol LS-SVM models based on SPA, (a)EGC (b)EGCG 304
(c)EC (d)ECG 305
20
306
Fig. 5 Scatter plot of four tea polyphenol LS-SVM models based on RF, (a)EGC (b)EGCG 307
(c)EC (d)ECG 308
4. Conclusions 309
In this study, Vis-NIR spectroscopy technology was used to successfully predict the content 310
of four tea polyphenols in tea. Three different preprocessing methods were used to preprocess the 311
spectral data. Based on different preprocessing methods, respective PLS prediction models were 312
established, and the optimal preprocessing method was determined according to the performance 313
of the models. For further analysis, CARS, SPA and RF were used to extract characteristic 314
wavelengths from the preprocessed spectral data. And the calibration models of PLS, MLR, and 315
LS-SVM were established with characteristic wavelength as input. Compared with the 316
full-wavelength model, the model based on the characteristic wavelength not only retains the 317

21
accuracy of the model, but also reduces the number of input wavelengths and improves the 318
detection efficiency. Among them, the LS-SVM model based on SPA is most suitable for detecting 319
the content of tea polyphenols. In summary, CARS, SPA and RF are all very effective feature 320
wavelength extraction methods. The results of this study show that the combination of Vis-NIR 321
spectroscopy and chemometrics can effectively detect the content of tea polyphenols, and it has 322
high scientific significance for rapid non-destructive testing of the physicochemical information of 323
tea. 324
325
Acknowledgement 326
The authors are grateful for the National natural science foundation of China (41867020), 327
Jiangxi provincial department of science and technology project. 328
329
Funding 330
This study was supported by grants from the National natural science foundation of China 331
(41867020). 332
333
Authors' contributions 334
HZ and WD wrote original draft. WL, BZ and HH performed the experiments. HC, KM and 335
XL analyzed the data. All the authors discussed the results and collectively edited the manuscript. 336
All authors read and approved the final manuscript. 337

22
Availability of data and materials 338
The datasets during and/or analysed during the current study available from the 339
corresponding author on reasonable request. 340
341
Ethics approval and consent to participate 342
Not applicable. 343
344
Consent for publication 345
Not applicable. 346
347
Competing interests 348
The authors declare that they have no competing interests. 349
350
References 351
1. Brahma N S, Sharmila S, Rakesh K S. Green tea catechin, epigallocatechin-3-gallate (EGCG): 352
Mechanisms, perspectives and clinical applications. Biochemical Pharmacology. 2011;82(12). 353
2. Xinrong W, Yuefei W, Shikang Z, Ping X, Xianqiang Y. Research Progress on the Health Functions 354
of Tea Polyphenols and Development of Healthy Foods. Journal of Tea Science. 355
2010;30(S1):501-505. 356

23
3. HaiJun C. Study on the physiological health function of tea polyphenols and its detection methods. 357
Light Industry Science and Technology. 2009;25(03):4-5. 358
4. Jinchuan Y, Xuemei B. Simultaneous Determination of Catechins and Caffeine Content in Tea by 359
HPLC. Guizhou Agricultural Sciences. 2020;48(02):99-102. 360
5. Ainara G, Silvia F D V, Nerea E, Alberto D D, Juan M M. Non-destructive Spectroscopy combined 361
with chemometrics as a tool for Green Chemical Analysis of environmental samples: A review. 362
Trends in Analytical Chemistry. 2016;76. 363
6. Xiaolei Z, Wei X, Shanhu T. Rapid determination of moisture content in fresh tea leaves based on 364
visible and near infrared spectroscopy. Journal of Southwest Minzu University(Natural Science 365
Edition). 2018;44(04):352-357. 366
7. JuanJuan J. Detection of Heavy Metal Stress in Camellia sinensis and Physiologiacl Indices 367
Changes Based on Spectral Technology. Zhejiang University. 2019 368
8. Dutta R, Stein A, Bhagat R M. Integrating satellite images and spectroscopy to measuring green and 369
black tea quality. Food chemistry. 2011;127(2). 370
9. JinLei C, Ying S, De Z, DeJiang N, Pei L, Zhi Y. Application of surface enhanced Raman 371
spectroscopy in tea safety inspection and quality analysis. Journal of Food Safety & Quality. 372
2020;11(13):4304-4309. 373
10. Xiaoli B, Weihua G, Junhao K, Shunhang L, Changwen L. Establishment of a Method for the Rapid 374
Measurement of Moisture, Caffeine and Tea-polyphenols in Instant Pu'er Tea by Near Infrared 375
Spectroscopy. Science and Technology of Food Industry. 2019;40(01):234-238. 376
24
11. Ze L, Hualin X, Lin C, Jianhua H. An Improved Weighted Partial Least Squares Method Coupled 377
with Near Infrared Spectroscopy for Rapid Determination of Multiple Components and 378
Anti-Oxidant Activity of Pu-Erh Tea. Molecules. 2018;23(5). 379
12. Yuying Z. Detection of the Tea Polyphenol in Green Tea Based on Spectroscopy. Zhejiang 380
University. 2017 381
13. Yifeng H, Wentao D, Alireza S, Xiaoming W, Wei L, Baishao Z, Xuemei L, Ruili L, Hailiang Z, 382
Xiaoli L. Development of simple identification models for four main catechins and caffeine in fresh 383
green tea leaf based on visible and near-infrared spectroscopy. Computers and Electronics in 384
Agriculture. 2020;173. 385
14. Zhang L, Sun H, Rao Z, Ji H. Non-destructive identification of slightly sprouted wheat kernels 386
using hyperspectral data on both sides of wheat kernels. Biosystems Engineering. 2020;200. 387
15. Hongdong L, Yizeng L, Qingsong X, Dongsheng C. Key wavelengths screening using competitive 388
adaptive reweighted sampling method for multivariate calibration. Analytica Chimica Acta. 389
2009;648(1). 390
16. Guo T, Jing H, Hong Y, Yuquan Z, Yanmei X, Shungeng M. Determination of active ingredients in 391
matrine aqueous solutions by mid-infrared spectroscopy and competitive adaptive reweighted 392
sampling. Optik - International Journal for Light and Electron Optics. 2016;127(3). 393
17. Mário C U A, Teresa C B S, Roberto K H G O, Takashi Y, Henrique C C, Valeria V. The successive 394
projections algorithm for variable selection in spectroscopic multicomponent analysis. 395
Chemometrics and Intelligent Laboratory Systems. 2001;57(2). 396
25
18. Yujie W, Luqing L, Shanshan S, Ying L, Jingming N, Zhengzhu Z. Rapid detection of quality index 397
of postharvest fresh tea leaves using hyperspectral imaging. Journal of the Science of Food and 398
Agriculture. 2020;100(10). 399
19. Jingjing W, Muhammad Z, Peihuan H, Hao S, Quansheng C, Huanhuan L, Qin O, Zhiming G, 400
Zhengzhu Z, Delian X. Evaluation of matcha tea quality index using portable NIR spectroscopy 401
coupled with chemometric algorithms. Journal of the science of food and agriculture. 2019;99(11). 402
20. Mishra P, Nikzad L R. Partial least square regression versus domain invariant partial least square 403
regression with application to near-infrared spectroscopy of fresh fruit. Infrared Physics & 404
Technology. 2020;111(prepublish). 405
21. Kumar K. Competitive adaptive reweighted sampling assisted partial least square analysis of 406
excitation-emission matrix fluorescence spectroscopic data sets of certain polycyclic aromatic 407
hydrocarbons. Spectrochimica acta. Part A, Molecular and biomolecular spectroscopy. 2020;244. 408
22. Hailiang Z, Shuai Z, Yin C, Wei L, Yifeng H, Dan T, Baishao Z, Xuemei L. Non-destructive 409
determination of fat and moisture contents in Salmon ( Salmo salar ) fillets using near-infrared 410
hyperspectral imaging coupled with spectral and textural features. Journal of Food Composition 411
and Analysis. 2020;92. 412
23. Jiangbo L, Wenqian H, Chunjiang Z, Baohua Z. A comparative study for the quantitative 413
determination of soluble solids content, pH and firmness of pears by Vis/NIR spectroscopy. Journal 414
of Food Engineering. 2013;116(2). 415
24. Yankun L, Xueguang S, Wensheng C. A consensus least squares support vector regression 416
(LS-SVR) for analysis of near-infrared spectra of plant samples. Talanta. 2006;72(1). 417
26
25. Xiaoli L, Chanjun S, Liubin L, Yong H. Determination of tea polyphenols content by infrared 418
spectroscopy coupled with iPLS and random frog techniques. Computers and Electronics in 419
Agriculture. 2015;112. 420
26. Komal G, James T E, Christopher J Z, Jeffrey J R. Tuning Excited State Isomerization Dynamics 421
through Ground State Structural Changes in Analogous Ruthenium and Osmium Sulfoxide 422
Complexes. Chemistry – A European Journal. 2013;19(35). 423
27. Xiaoli L, Juanjuan J, Chanjun S, Dapeng Y, Yufei L. Simultaneous determination of six main types 424
of lipid-soluble pigments in green tea by visible and near-infrared spectroscopy. Food Chemistry. 425
2019;270. 426
28. Lee M, Hwang Y, Lee J, Choung M. The characterization of caffeine and nine individual catechins 427
in the leaves of green tea (Camellia sinensis L.) by near-infrared reflectance spectroscopy. Food 428
chemistry. 2014;158. 429
29. Li Y, Bin S, Jiancheng Y, Tianyu T, Yuan Y. Application of Different Smoothing Ensemble CARS 430
Algorithm in Spectral Discrimination of Black Tea Grade. Spectroscopy and Spectral Analysis. 431
2020;40(10):3254-3259. 432
433
434

Figures
Figure 1
Visible and near-infrared spectroscopy of tea samples
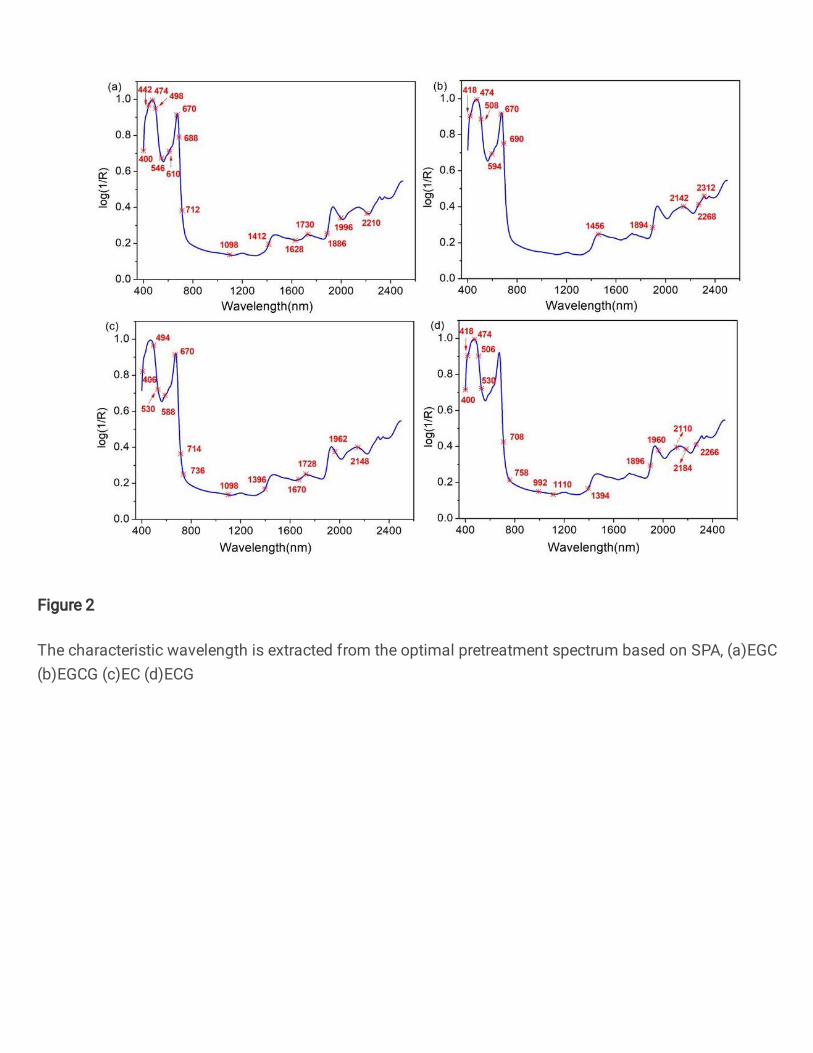
Figure 2
The characteristic wavelength is extracted from the optimal pretreatment spectrum based on SPA, (a)EGC(b)EGCG (c)EC (d)ECG
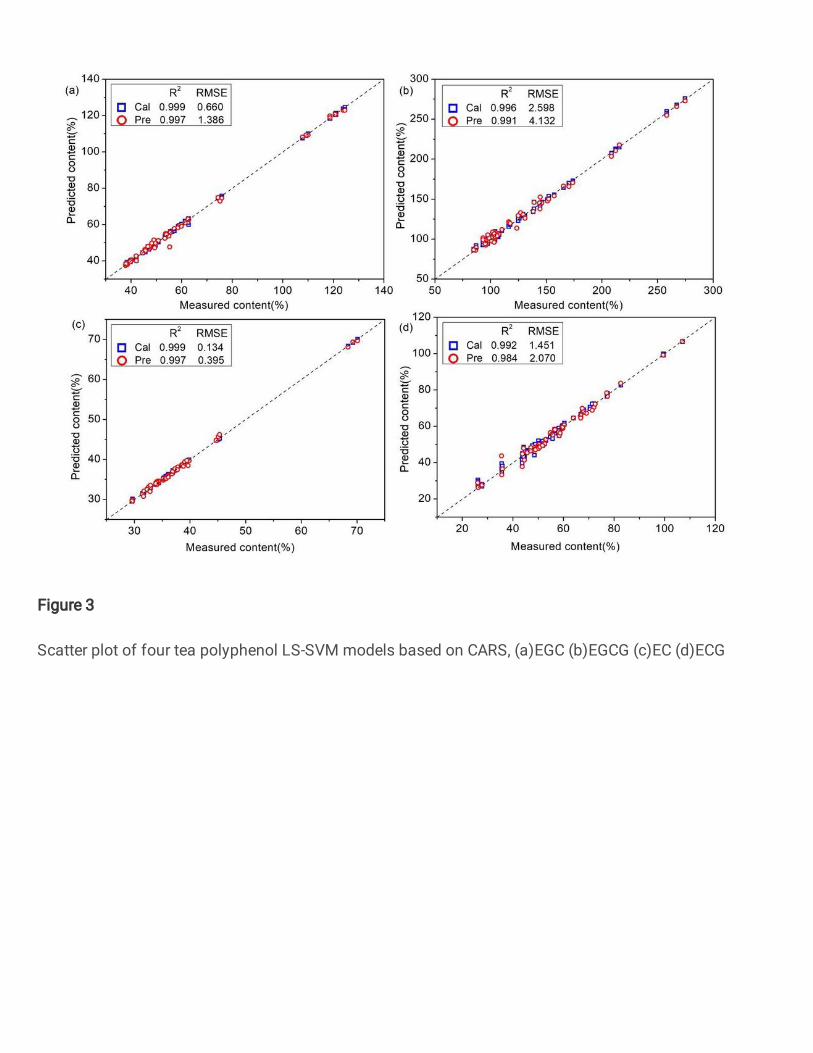
Figure 3
Scatter plot of four tea polyphenol LS-SVM models based on CARS, (a)EGC (b)EGCG (c)EC (d)ECG

Figure 4
Scatter plot of four tea polyphenol LS-SVM models based on SPA, (a)EGC (b)EGCG (c)EC (d)ECG
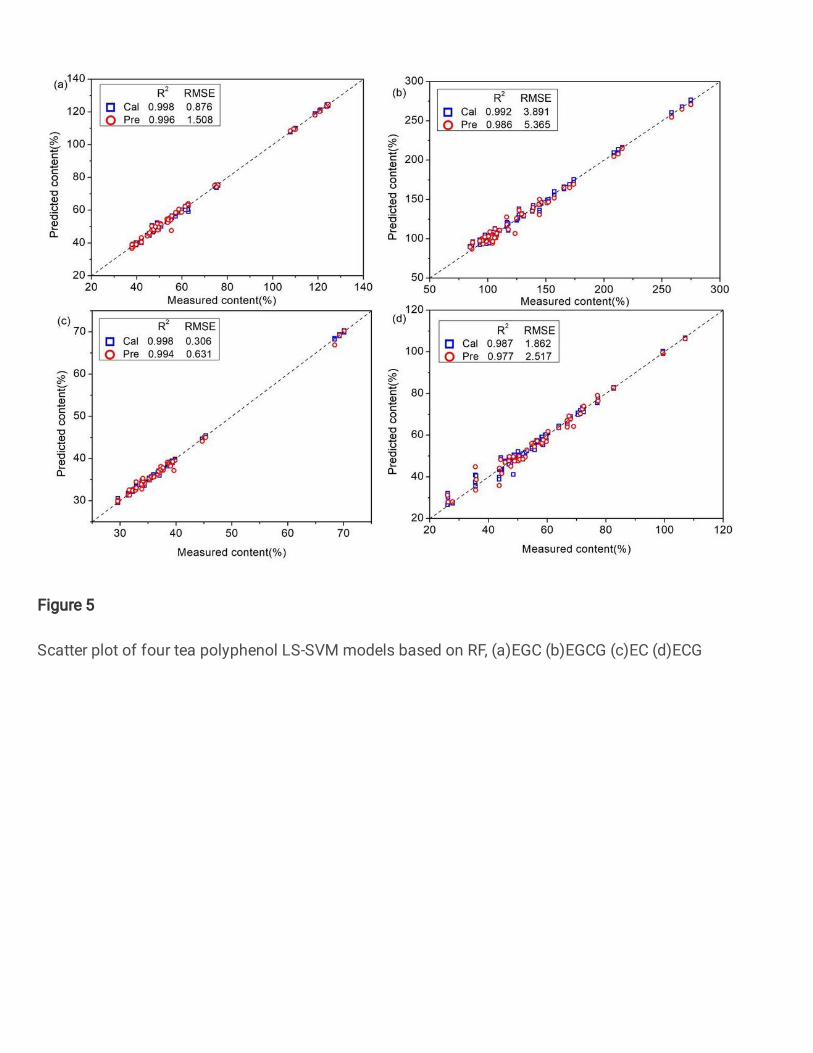
Figure 5
Scatter plot of four tea polyphenol LS-SVM models based on RF, (a)EGC (b)EGCG (c)EC (d)ECG


![21956606 CBSE XII Chemistry Project Determination of Caffeine in Tea Samples[1]](https://cdn.vdocument.in/doc/165x107/577d2fa51a28ab4e1eb23de4/21956606-cbse-xii-chemistry-project-determination-of-caffeine-in-tea-samples1.jpg)


