Download - Studying the Adaptive Comfort Model

Studying the Adaptive Comfort Model
A Case Study in Arid Climate: Cairo, Egypt.
Amgad Aly Fahmy Farghal
This thesis is submitted in partial fulfilment
of the requirements of Karlsruhe Institute of Technology
for the award of Doctor of Engineering
Faculty of Architecture
Karlsruhe Institute of Technology, KIT, Germany
January 2011


iii
Studying the Adaptive Comfort Model
A Case Study in Arid Climate: Cairo, Egypt.
Zur Erlangung des akademichen Grades eines
Doktor-Ingenieurs
Von der Fakultät für
FÜR ARCHITEKTUR - Fachgebiet Baupysik und Technischer Ausbau
des Karlsruher Instituts für Technologie (KIT)
genehmigte
DISSERTATION von
Amgad Aly Fahmy Farghal, M.Sc.
Tag der mündlichen Prüfung: 24. January 2011 Hauptreferent: Prof. Andreas Wagner Karlsruhe Institute für Technologie (KIT), Deutschland. Korreferent: Prof. Richard de Dear
The University of Sydney, Australia
Karlsruhe 2011


Studying the Adaptive Comfort Model A Case Study in Arid Climate: Cairo, Egypt
Abstract
Thermal Comfort is an important parameter in determining user satisfaction; the
definition of the boundaries affecting comfort conditions allows energy conservation
and helps in setting the standards. This study focused on investigating the thermal
environment and its effect on the comfort mechanism in the hot arid climate of Cairo,
Egypt.
The effects of individual factors on the perception and preference of occupants
in three educational buildings in the Greater Cairo Region were studied. The buildings
were allocated in Cairo University and Ain Shams University and The Arab Academy
for Science and Technology (AAST), the first two buildings are naturally ventilated and
the third building is a mixed mode one. The buildings were analyzed in order to form a
class three thermal comfort field study. The development of the questionnaire used in
the study is discussed showing the common questions adopted from other similar
research work and the modifications made to suit the study in a different culture.
The architecture department in all the former places was the focus of the study.
In Cairo University there are four floors each 2225m2 serving the department’s needs,
the study examined the main halls of 1250 m2 where sections are held, and also the
lecturing space of 225 m2 were examined together with employees’ rooms ranging from
50 m2 to 100 m2. In Ain Shams University two floors each 1850 m2 is serving the
department of architecture, the examined spaces include drawing halls and studios of
975 m2, and lecturing halls of 145 m2, employees’ rooms range from 50 m2 to 100 m2.
In AAST building the spaces used to serve the department’s needs are allocated within
the four floors of the building, the department is using drawing halls and studios of
about 275 m2 and the lecturing halls are about 75 m2, employees’ rooms are about 100
m2.
The study shows the difference between comfort perceptions according to the
different size of examined spaces. The field studies were carried out during the autumn
2007, spring 2008, autumn 2008 and spring 2009. A transverse sampling was used in
the field studies, the days selected in the four field studies considered the main schedule
of the working days excluding days after holidays in order to avoid any bias in the data
obtained. Three intervals of time were considered, from 10 to 12 in the morning, from
12 to 2 at noon and from 2 to 4 resembling the end of day.
Data gathered represent physical measurements of air temperature and relative
humidity in the examined spaces, together with the data from a paper based survey
filled by the subjects at the end of their classes. Air temperature and relative humidity
were measured using data loggers (Hobo of the company Onset), and a Nomad portable
weather station (Casella) were used in some days of the survey to verify the data from
the data loggers.
The survey results were processed, correlations between thermal sensations and
physical parameters were found and the neutral temperatures were calculated for each
season. The buildings’ thermal environments were checked for conformity to the
acceptable environments according to the adaptive comfort model implemented in the
international ASHRAE Standard 55-2004. The data points representing the indoor
temperatures for votes rating (slightly cool, just right and slightly warm) on the
ASHRAE scale were correlated with their corresponding mean outdoor temperatures,
and then plotted against the adaptive comfort model. The results showed that the
population of the study could bear higher indoor temperatures than that incorporated in
the current model. The Adaptive Comfort Model and the detailed slopes of different
climatic zones for different buildings were analysed. An ANOVA test for different
buildings’ neutralities across different climatic zones resulted in a significant difference
between these thermal neutralities which can be explained by the different climates, this
led to the suggestion of a variable comfort model depending on different climate zones.

Studying the Adaptive Comfort Model A Case Study in Arid Climate: Cairo, Egypt
vii
Eine Untersuchung des Adaptiven Komfortmodells
Eine Felduntersuchung in einem trockenen Klima: Kairo,
Ägypten
Kurzfassung
Der thermische Komfort ist ein wichtiger Parameter bei der Ermittlung der
Nutzerzufriedenheit. Die Bestimmung von Komfortgrenzwerten ermöglicht
Energieeinsparungen und hilft beim Festlegen von Normen. Diese Studie untersucht die
thermischen Bedingungen im trockenheißen Klima Kairos und ihren Einfluss auf den
Komfortmechanismus.
Der Einfluss individueller Faktoren auf das Empfinden und die Präferenz von
Nutzern in drei Hochschulgebäuden im Großraum Kairo wurde untersucht. Die
Gebäude gehören zur Universität Kairo, zur Ain Shams University und zur Arabischen
Akademie für Wissenschaft und Technik (AAST). Die ersten beiden Gebäude sind
natürlich belüftet, das dritte Gebäude ist klimatisiert. Die Studie ist als
Felduntersuchung des thermischen Komforts angelegt, die den Anforderungen der
Klasse 3 nach ASHRAE RP-884 entspricht. Die Entwicklung des Fragebogens, der in
dieser Untersuchung verwendet wurde, wird erläutert. Dabei wird gezeigt, welche
Fragen aus anderen, ähnlichen Forschungsarbeiten übernommen wurden und welche
Anpassungen an den kulturellen Hintergrund vorgenommen wurden.
Schwerpunkt der Untersuchung waren die Architekturfakultäten der oben
genannten Einrichtungen. Die Architekturfakultät der Universität Kairo verfügt über
vier Geschosse mit jeweils 2.225 m² Fläche. Die Studie untersuchte die 1.250 m²
großen Säle, in denen Übungen stattfinden, Hörsäle von jeweils 225 m² und Räume der
Angestellten, die 50 bis 100 m² groß sind. Die Architekturfakultät der Ain Shams
University verfügt über zwei 1.850 m² große Geschosse. Die untersuchten Bereiche
umfassen Zeichensäle und Studios von 975 m², Hörsäle von 145 m² und Räume der
Angestellten, die 50 bis 100 m² groß sind. In der AAST sind die Räume der
Architekturfakultät im viergeschossigen AAST-Gebäude untergebracht. Die Fakultät

nutzt Zeichensäle und Studios von ca. 275 m² und Hörsäle von ca. 75 m², die Räume
der Angestellten sind ca. 100 m² groß.
Die Studie zeigt die Abhängigkeit des Komfortempfindens von der Größe des
untersuchten Raumes. Die Felduntersuchungen wurden im Herbst 2007, Frühling 2008,
Herbst 2008 und Frühling 2009 durchgeführt und sind als Querschnittstudie angelegt.
Bei der Auswahl der Tage für die vier Felduntersuchungen wurde der Stundenplan
berücksichtigt. Arbeitstage nach Feiertagen wurden ausgeschlossen, um Verzerrungen
in den gewonnenen Daten zu vermeiden. Drei Zeitabschnitte wurden betrachtet, 10:00
bis 12:00 Uhr am Vormittag, 12:00 bis 14:00 Uhr am Mittag und 14:00 bis 16:00 Uhr
als Ende des Arbeitstages.
Die gesammelten Daten umfassen physikalische Messungen der Lufttemperatur
und der relativen Feuchte in den untersuchten Räumen sowie die Daten aus den
Papierfragebögen, die von den Probanden am Ende ihres Unterrichts ausgefüllt wurden.
Lufttemperatur und relative Feuchte wurden mit Hilfe von Hobo-Datenloggern
gemessen (Firma Onset), eine tragbare Nomad-Wetterstation (Firma Casella) wurde an
einigen Tagen verwendet, um die Messwerte der Datenlogger zu überprüfen.
Bei der Analyse der Daten zeigten sich Korrelationen zwischen thermischem
Empfinden und physikalischen Parametern, die neutrale Temperatur wurde für jede
Jahreszeit berechnet. Die Konformität der Raumklimabedingungen der Gebäude mit
den Komfortgrenzen des adaptiven Komfortmodells nach dem internationalen
ASHRAE Standard 55-2004 wurde überprüft. Die Innentemperaturen, die bei einer
Bewertung auf der ASHRAE-Skala von „eher kühl“, „genau richtig“ oder „eher warm“
gemessen wurden, wurden mit der entsprechenden mittleren Außentemperatur korreliert
und dann mit dem adaptiven Komfortmodell verglichen. Die Ergebnisse zeigen, dass
die Grundgesamtheit dieser Studie höhere Innentemperaturen akzeptiert als das aktuelle
Modell ausweist. Das adaptive Komfortmodell und die Wertekurven verschiedener
Klimazonen mit mehreren Gebäuden wurden analysiert. Eine Varianzanalyse des
neutralen Wertes verschiedener Gebäude in unterschiedlichen Klimazonen zeigte einen
signifikanten Unterschied zwischen diesen neutralen Werten, der mit den verschiedenen
Klimaten erklärt werden kann. Daraus wurde der Vorschlag eines variablen
Komfortmodells abgeleitet, das die Klimazone berücksichtigt.

Studying the Adaptive Comfort Model A Case Study in Arid Climate: Cairo, Egypt
ix
Acknowledgements
I am most grateful to God, for blessing me strength, health and will to prevail
and finish this work. I wish to thank the following people sincerely for their
contribution towards the successful completion of this work,
Prof. Andreas Wagner, my Supervisor, for his assistance, guidance, support and
enthusiasm for this study. His professional guidance has been a source of inspiration
and vital in the completion of this work. He offered me insight thinking and challenging
thoughts developing my abilities in writing such an academic research, and providing
feedback and valuable advice.
I would like to thank Prof. Michael Humphrey and Prof. Richard de Dear; their
comments helped me in analyzing my data and the adaptive comfort model.
I would like to thank Omaima Ouf and her mother Mariam HobAllah for their
great effort in revising the language of the study.
I would like to give special thanks to all the people whom gave me a part of
their precious time in filling my questionnaire. Lots of gratitude and appreciation for the
buildings’ managers whom allowed the study to take place in their buildings
I would like to thank the Department of Architecture & Environmental Design,
at The Arab Academy for Science & Technology, Cairo campus for funding my
studies.
Last, but not least, I thank my wife, whom I could find no words to thank her,
for her interest and encouragement in my studies.


Studying the Adaptive Comfort Model A Case Study in Arid Climate: Cairo, Egypt
Contents
Abstract.........................................................................................................................v
Kurzfassung................................................................................................................vii
Acknowledgements......................................................................................................ix
Contents.......................................................................................................................xi
List of Tables...............................................................................................................xv
List of Figures.......................................................................................................................xvii
CHAPTER One Research Overview .......................................................................... 3
1.1 Introduction ......................................................................................................... 3 1.2 Problem Definition ............................................................................................. 4 1.3 Research Scope ................................................................................................... 4 1.4 Research Goal ..................................................................................................... 5 1.5 Research Methodology ....................................................................................... 5
CHAPTER Two Literature Review ............................................................................ 9
2.1 Introduction ......................................................................................................... 9 2.2 Historic review .................................................................................................... 9 2.3 Comfort models ................................................................................................ 11
2.3.1 Types of Thermal Comfort Models ....................................................... 12
2.3.2 Limitations of each type ......................................................................... 30
2.3.3 Importance of comfort models ............................................................... 36
2.4 Comfort studies ................................................................................................. 36 2.4.1 The Respondents .................................................................................... 37
2.4.2 Time Sampling ....................................................................................... 38
2.4.3 The Measurement of Physical Parameters ............................................. 38
2.4.4 The measurement of personal parameters .............................................. 39
2.4.5 Scaling.................................................................................................... 39
2.4.6 Survey design ......................................................................................... 40
2.4.7 Data analysis .......................................................................................... 41
2.4.8 Classification of field studies ................................................................. 43
xii
2.4.9 Strengths and weaknesses of field studies ............................................. 44
2.5 Conclusion ........................................................................................................ 45
CHAPTER Three Objectives and Methodology ..................................................... 49
3.1 Objectives ......................................................................................................... 49 3.1.1 Observation and specification of the different thermal environments
within each building in order to investigate the thermal characteristics of the
indoor environment within each of the selected buildings: ................................. 49
3.1.2 Determination of the comfortable temperatures and the acceptable
environments as indicated by the occupants, and investigation of the effect of
different indoor thermal environments within and between spaces on the
occupants’ comfort and satisfaction: ................................................................... 49
3.1.3 Characterization of the main physical and psychological factors
influencing thermal comfort and satisfaction, quantification of the effect of the
indoor/outdoor environments on the characteristics of these factors: ................. 50
3.1.4 Comparison of the results obtained with the current models resulting
from comfort theories: ......................................................................................... 51
3.2 Methodology ..................................................................................................... 51 3.2.1 Pre-Stage of the field study: ................................................................... 51
3.3 Field study setting ............................................................................................. 57 3.3.1 Sampling strategy................................................................................... 58
3.3.2 Thermal environment monitoring .......................................................... 63
3.3.3 Clothing and clo values .......................................................................... 64
3.3.4 Questionnaire distribution ...................................................................... 64
3.3.5 Statistical analysis of the results ............................................................ 65
CHAPTER Four Data analysis ................................................................................. 69
4.4 Frequency of votes and their distribution ......................................................... 69 4.5 Distribution of votes by age and gender ........................................................... 72 4.6 Thermal environment’s characteristics ............................................................. 73
4.6.1 Air Temperature ..................................................................................... 73
4.6.2 Relative Humidity .................................................................................. 78
4.6.3 Summary ................................................................................................ 78

Studying the Adaptive Comfort Model A Case Study in Arid Climate: Cairo, Egypt
xiii
4.7 comfort votes .................................................................................................... 79 4.7.1 Thermal sensation votes ......................................................................... 80
4.7.2 Thermal preference votes ....................................................................... 83
4.7.3 Relation between thermal sensation and thermal preference ................. 85
4.7.4 Acceptance votes ................................................................................... 89
4.7.5 Humidity sensation votes ....................................................................... 90
4.7.6 Humidity preference .............................................................................. 91
4.7.7 Humidity acceptance .............................................................................. 91
4.8 The mean temperature for different thermal sensation categories .................... 92 4.9 The distribution of thermal sensation votes for classes of indoor air temperatures ................................................................................................................ 95 4.10 Clo value ........................................................................................................... 97 4.11 general satisfaction with the methods available to adapt to the indoor climatic conditions .................................................................................................................... 98 4.12 Relation between outdoor temperature expectation and the general satisfaction with indoor climatic conditions ............................................................... 99 4.13 Relation between indoor temperature expectation and the general satisfaction with indoor climatic conditions ................................................................................ 100 4.14 Relation between thermal sensation votes and the general satisfaction with indoor climatic conditions ......................................................................................... 102 4.15 Relation between different parameters and both the general satisfaction with indoor climatic conditions and thermal sensation votes ........................................... 103 4.16 Relation between description of the internal air quality and the general satisfaction with indoor climatic conditions ............................................................. 104 4.17 Correlations between thermal sensations and indoor thermal environment and outdoor thermal environment .................................................................................... 106 4.18 Correlation between thermal sensation and adaptive opportunities ............... 107 4.19 The calculation of neutral temperatures for both building types .................... 108
CHAPTER Five Discussion ..................................................................................... 112
5.1 Frequency of votes and their distribution ....................................................... 112 5.2 Thermal sensation votes and their distribution among indoor air temperatures113 5.3 Thermal neutrality obtained from sensation votes and preference votes ....... 115 5.4 Acceptance votes ............................................................................................ 116 5.5 clo value and the social concerns .................................................................... 119 5.6 ASHRAE adaptive model and the results from the study .............................. 121
CHAPTER Six Conclusion ...................................................................................... 127
6.1 Findings and implications ............................................................................... 127 6.2 Further research .............................................................................................. 131
References 132

xiv
Appendix A: Metabolic Rates .................................................................................... 139
Appendix B: Clothing Insulation Values .................................................................. 140
Appendix C: The cover page of the questionnaire. .................................................. 142
Appendix D: The translated cover page of the questionnaire. ............................... 143
Appendix E: The final version of the questionnaire. ............................................... 144
Appendix F: The translated version of the final questionnaire. ............................. 149
Appendix G: The list of garments included in the study and the clo value of each.154
Appendix H: Indoor air temperature and mean outdoor air temperature. .......... 155
Appendix I: The analysis of variance of the indoor air temperature for different building types, across the four seasons of the study. ............................................... 155
Appendix J: The ANOVA test for the Humidity Preference of naturally ventilated buildings and the least significant difference (LSD) pair wise multiple comparison test............................................................................................................ 156

Studying the Adaptive Comfort Model A Case Study in Arid Climate: Cairo, Egypt
List of Tables
Table 1: The schedule shows the Relations between different variables, as assumed by
traditional comfort research. (Auliciems 1981) ........................................................... 11
Table 2: Climatic zones covered by the Adaptive Comfort Standard are shown, and
the number of buildings in each zone is indicated. ...................................................... 26
Table 3: Applicability of the categories and their associated acceptable temperature
ranges in free-running mode. (Nicol and Humphreys 2010) ....................................... 29
Table 4: The “ASHRAE” scale and the “Bedford” scale of warmth, with their
categories being numbered as used in many field studies ........................................... 41
Table 5: The distribution of votes on each day over the four seasons of the study ..... 71
Table 6: The cumulative percentage of the indoor air temperature for different
building types across the four seasons of the study ..................................................... 77
Table 7: Percentage of thermal sensation votes for each type of buildings over the four
seasons of the study ..................................................................................................... 81
Table 8: The percentage of thermal preference votes across each category of the
thermal sensation scale for both types of buildings ..................................................... 87
Table 9: The distribution of thermal sensation votes subject to the indoor air
temperatures for naturally ventilated buildings ........................................................... 95
Table 10: The distribution of thermal sensation votes subject to the indoor air
temperatures for mixed mode buildings ...................................................................... 96
Table 11: The percentage of general satisfaction with the available methods of
controlling the indoor climate in both types of buildings ............................................ 98
Table 12: Pearson correlations between thermal sensation and physical environment
of naturally ventilated buildings ................................................................................ 106
Table 13: Pearson correlations between thermal sensation and physical environment
of mixed mode buildings ........................................................................................... 106
Table 14: Pearson correlations between thermal sensation and adaptive opportunities
in naturally ventilated buildings................................................................................. 107
Table 15: Pearson correlations between thermal sensation and adaptive opportunities
in mixed mode buildings ............................................................................................ 107

xvi
Table 16: The regression of the thermal sensation vote on the indoor air temperature
in all buildings through the different seasons ............................................................ 108
Table 17: The number of garments worn throughout the study in both building types
classified by corresponding indoor air temperature ................................................... 119

Studying the Adaptive Comfort Model A Case Study in Arid Climate: Cairo, Egypt
List of Figures
Figure 1: The research methodology ............................................................................. 6
Figure 2: Predicted percentage dissatisfied (PPD) as a function of predicted mean vote
(ASHRAE standard-55, 2004) ..................................................................................... 15
Figure 3: Behavioral feedback loop. (de Dear, Brager and Cooper 1997) ................. 17
Figure 4: Physiological feedback loop. ( (de Dear, Brager and Cooper 1997) ............ 19
Figure 5: Psychological feedback loop. (de Dear, Brager and Cooper 1997) ............ 20
Figure 6: Scatter diagram of mean temperature and neutral temperature, for
Humphrey's 1975 comfort model. After (M. A. Humphreys 1976) ............................ 21
Figure 7: The statistical dependence of indoor thermal neutralities on climate. (After
(M. A. Humphreys 1976)). .......................................................................................... 22
Figure 8: Observed and predicted indoor comfort temperatures from RP-884 database,
for naturally ventilated buildings. (Brager and de Dear 2001) .................................... 24
Figure 9: The adaptive comfort standard, showing the acceptable operative
temperature ranges for naturally conditioned spaces. (ASHRAE Standard-55 2004) . 27
Figure 10: Design values for the upper (continuous lines) and lower (dashed lines)
limits for operative temperature in buildings without mechanical cooling systems (free
running) for the different categories of buildings as a function of the exponentially
weighted running mean of the external temperature. (Nicol and Humphreys 2010) ... 29
Figure 11: The data loggers of the company Onset used in the field studies .............. 53
Figure 12: Climatic Classifications for Different Regions in Egypt & Average
Summer Conditions ( Egyptian Climatic Authorities 1997) ........................................ 58
Figure 13: A typical floor plan of the Architecture Department in Cairo University. . 60
Figure 14: A typical floor plan of the Architecture Department in Ain Shams
University. .................................................................................................................... 61
Figure 15: A typical floor plan of the Architecture Department in AAST .................. 61
Figure 16: The data Loggers distributed over the whole space and their heights
adjusted to the level of the students' heads. ................................................................. 64
Figure 17: The days included in the study and frequency of votes on each day for both
building types across the four seasons of the study, (N.V.) stands for naturally
ventilated buildings and (M.M.) stands for mixed mode buildings ............................. 70

xviii
Figure 18: The distribution of votes according to different space types on all days of
the study ....................................................................................................................... 70
Figure 19: The distribution of votes in naturally ventilated buildings by age and
gender ........................................................................................................................... 72
Figure 20: The distribution of votes in mixed mode buildings by age and gender ..... 73
Figure 21: The mean indoor air temperature values (°C) recorded during the days of
the study, and the mean outdoor air temperature values (°C) obtained from the
Egyptian Meteorological Authority for naturally ventilated buildings ........................ 74
Figure 22: The mean indoor air temperature values (°C) recorded during the days of
the study, and the mean outdoor air temperature values (°C) obtained from the
Egyptian Meteorological Authority for mixed mode buildings ................................... 75
Figure 23: The mean indoor air temperature for the different building types across the
four seasons of the study .............................................................................................. 76
Figure 24: The mean indoor relative humidity (%) for the days of the study together
with the corresponding outdoor relative humidity for naturally ventilated buildings . 79
Figure 25: The mean indoor relative humidity (%) for the days of the study together
with the corresponding outdoor relative humidity for mixed mode buildings ............ 79
Figure 26: The distribution of thermal sensation votes of the different building types
in autumn 2007, and the analysis of variance across different building types (α = 0.05,
F (1,777) = 1.546 and P = 0.214) ................................................................................. 81
Figure 27: The distribution of thermal sensation votes of the different building types
in spring 2008, and the analysis of variance across different building types (α = 0.05,
F (1,672) = 5. 096 and P = 0.024) ................................................................................ 82
Figure 28: The distribution of thermal sensation votes of the different building types
in autumn 2008, and the analysis of variance across different building types (α = 0.05,
F (1,821) = 0.224 and P = 0.636) ................................................................................. 82
Figure 29: The distribution of thermal sensation votes of the different building types
in spring 2009, and the analysis of variance across different building types (α = 0.05,
F (1,906) = 4.386 and P = 0.037) ................................................................................. 82
Figure 30: The mean thermal sensation for each type of building for the four seasons
of the study ................................................................................................................... 83

Studying the Adaptive Comfort Model A Case Study in Arid Climate: Cairo, Egypt
xix
Figure 31: The distribution of preference votes for the different building types across
the four seasons of the study ........................................................................................ 84
Figure 32: The cumulative percentage (%) of preference votes for different building
types across the four seasons of the study ................................................................... 85
Figure 33: The distribution of thermal preference votes across the thermal sensation
votes for naturally ventilated buildings........................................................................ 86
Figure 34: The distribution of thermal preference votes across thermal sensation votes
for mixed mode buildings ............................................................................................ 87
Figure 35: The percentage of adjusted preferred condition in naturally ventilated
buildings ....................................................................................................................... 88
Figure 36: The percentage of adjusted preferred condition in mixed mode buildings 88
Figure 37: The percentage of acceptance of the indoor thermal conditions for both
building types across the four seasons of the study ..................................................... 89
Figure 38: The percentage of acceptance of the indoor thermal conditions for the
central thermal sensation categories (-1, 0, 1) ............................................................. 90
Figure 39: The humidity sensation vote for different building types across the four
seasons of the study ..................................................................................................... 91
Figure 40: The humidity preference for different building types across the four
seasons of the study ..................................................................................................... 92
Figure 41: The percentage of humidity acceptance for both building types across the
four seasons of the study .............................................................................................. 92
Figure 42: The thermal sensation categories subject to the range of indoor air
temperature of each category in naturally ventilated buildings for both seasons of the
study. The thick lines in the boxes represent the median values, the colored boxes
cover the mean 50%of the values and the thin lines show the whole range of all values
except for the small circles indicate outliers of each category .................................... 94
Figure 43: The thermal sensation categories subject to the range of indoor air
temperature of each category in mixed mode buildings for both seasons of the study.
The thick lines in the boxes represent the median values, the colored boxes cover the
mean 50%of the values and the thin lines show the whole range of all values except
for the small circles indicate outliers of each category ................................................ 94

xx
Figure 44: The percentage of thermal sensation votes subject to the indoor air
temperatures for naturally ventilated buildings ........................................................... 96
Figure 45: The percentage of thermal sensation votes subject to the indoor air
temperatures for mixed mode buildings ...................................................................... 96
Figure 46: The value of the mean clothing insulation for different building types
across the four seasons of the study ............................................................................. 97
Figure 47: The relation between the outdoor climatic condition expectations and the
general satisfaction with the indoor climatic conditions for naturally ventilated
buildings ....................................................................................................................... 99
Figure 48: The relation between the outdoor climatic condition expectations and the
general satisfaction with the indoor climatic conditions for mixed mode buildings . 100
Figure 49: The relation between the indoor climatic condition expectations and the
general satisfaction with the indoor climatic conditions for naturally ventilated
buildings ..................................................................................................................... 101
Figure 50: The relation between the indoor climatic condition expectations and the
general satisfaction with the indoor climatic conditions for mixed mode buildings . 101
Figure 51: The relation between thermal sensation votes and the general satisfaction
with the indoor climatic conditions in naturally ventilated buildings, the numbers
indicate the votes corresponding to each category .................................................... 102
Figure 52: The relation between thermal sensation votes and the general satisfaction
with the indoor climatic conditions in mixed mode buildings, the numbers indicate the
votes corresponding to each category ........................................................................ 103
Figure 53: The relation between different parameters and both mean thermal sensation
votes and the mean satisfaction with the indoor climatic conditions ......................... 104
Figure 54: The relation between describing the air quality and the general satisfaction
with the indoor climatic conditions in naturally ventilated buildings, the numbers
indicate the votes corresponding to each category .................................................... 105
Figure 55: The relation between describing the air quality and the general satisfaction
with the indoor climatic conditions in mixed mode buildings .................................. 105
Figure 56: Thermal sensation across indoor air temperature of naturally ventilated
buildings ..................................................................................................................... 113

Studying the Adaptive Comfort Model A Case Study in Arid Climate: Cairo, Egypt
xxi
Figure 57: Thermal sensation across indoor air temperature of mixed mode buildings
.................................................................................................................................... 113
Figure 58: Preferred temperature in naturally ventilated buildings ........................... 116
Figure 59: Preferred temperature in mixed mode buildings ...................................... 116
Figure 60: The percentage of unacceptable votes for each degree indoor air
temperature in both types of buildings ....................................................................... 117
Figure 61: Acceptability against temperature at the workstation; winter; NV and MM
buildings in the ASHRAE database, ((Zhang, Arens and Pasut 2010) ...................... 118
Figure 62: Acceptability against temperature at the workstation; summer; NV and
MM buildings in the ASHRAE database, (Zhang, Arens and Pasut 2010) ............... 118
Figure 63: The blue line represent the outcome of the study, it is the regression of the
indoor air temperature on the mean outdoor air temperature for the thermal sensation
votes “slightly cool, just right and slightly warm” of the naturally ventilated buildings.
The red line represents the adaptive comfort standard implemented in the ASHRAE
55-2004 ...................................................................................................................... 122
Figure 64: The different buildings of different climatic zones incorporated into the
Adaptive Comfort Standard of ASHRAE standard 55-2004 ..................................... 124


Studying the Adaptive Comfort Model A Case Study in Arid Climate: Cairo, Egypt
1
CHAPTER ONE RESEARCH OVERVIEW
CHAPTER TWO LITERATURE REVIEW
CHAPTER THREE OBJECTIVES AND METHODOLOGY
CHAPTER FOUR DATA ANALYSIS
CHAPTER FIVE DISCUSSION
CHAPTER SIX CONCLUSION


Studying the Adaptive Comfort Model A Case Study in Arid Climate: Cairo, Egypt
3
CHAPTER ONE RESEARCH OVERVIEW
1.1 INTRODUCTION
Thermal comfort standards are required to help building designers and managers
to provide a satisfying indoor climate that building occupants will find thermally
comfortable. The definition of a good indoor climate is important to the success of a
building; it secures comfortable indoor thermal conditions and at the same time
regulates the energy consumption in the building. As humans can and do live in a range
of climates from the tropics to high latitudes, the internationally accepted definition of
thermal comfort as used by ASHRAE is “that condition of mind which expresses
satisfaction with the thermal environment”. Perceptions of this environment are
mainly affected by six parameters, four that are measured represented in air
temperature, radiant temperature, relative humidity and air velocity. The other two
parameters are estimated represented in the activity and clothing of subjects (Nicol and
Humphreys 2002).
In order to define a thermal comfort range two approaches have been developed,
in both approaches tests with people giving subjective votes and correlating them with
measured climate parameters were performed. The first approach depends on tests in
laboratory using climate chambers, while the second approach depends on field
experiments in real buildings testing people in their real environment. The first
approach determined a range of comfort temperatures which occupants of buildings will
find comfortable. This range is mainly determined in the ASHRAE standard 55-2004
by a PMV “predicted mean vote” derived from studies of individuals in tightly
controlled conditions. According to further studies, the feasibility to meet such range is
found in buildings including air conditions and may as well include heating systems;
these buildings provide better temperature control than could be obtained from opening
windows.
The second approach which is the adaptive approach is based on field surveys of
thermal comfort, and demonstrates that people are more tolerant to temperature changes
than climate chamber studies. Occupants consciously and unconsciously act to affect

Chapter One
4
the heat balance of the body. These actions may change metabolic heat production by
changing activity or affecting the rate of heat loss from the body by changing clothing
and posture, or change their thermal environment by controlling windows, doors,
blinds, fans, etc. Adaptive variables are extremely important in “free running buildings”
those buildings without active heating or cooling systems (Gossauer and Wagner 2007).
1.2 PROBLEM DEFINITION
The adaptive comfort model implemented in the ASHRAE standard 55-2004 is
a relation between mean outdoor air temperature and the corresponding acceptable
indoor air temperatures. The standard is based mainly on 36 naturally ventilated
buildings, where most of these buildings represent the moderate climates and only two
buildings representing the desert climate. The effect of this is that the standard is limited
to the mean outdoor temperatures ranging from 10 °C to 33 °C, while the mean outdoor
temperatures in hot arid climates in the summer reach a higher limit. The study of the
relation between mean outdoor temperatures and accepted indoor temperatures in hot
arid climates may give a wider range than that incorporated in the existing standard.
Another issue is that the adaptive comfort standard is generalised over different
climatic zones. The classification of the standard into different climate zones, and
setting a standard to each climate may expand the range of acceptable temperatures and
give the opportunity for more energy conservation.
1.3 RESEARCH SCOPE
The research is mainly based on educational buildings in the Greater Cairo
Region, in Egypt, a hot arid climate. The buildings are studied in the autumn and spring
seasons where most of the academic calendar lies. The outcomes represented two types
of buildings, the naturally ventilated educational buildings and the mixed mode
educational buildings. The results could not be generalized over the whole country
unless other studies are carried out in other different building types and different
climatic zones within the country.

Research Overview
1.4 RESEARCH GOAL
The intention of the fieldwork was to observe and specify the different thermal
environments within each building, determine the comfortable temperatures and the
acceptable environments as indicated by the occupants, also to investigate the effect of
different indoor thermal environments within and between spaces on the occupants’
comfort and satisfaction, characterize the main physical and psychological factors
influencing thermal comfort and satisfaction perception, and to compare the results
obtained with the current adaptive comfort standard.
1.5 RESEARCH METHODOLOGY
The research is divided into three parts. The first is a review concerning the
thermal comfort research, in an attempt to formulate a detailed background about the
subject and to accomplish the understanding of the basic ideas behind thermal
comfort. In this section a review of the literature that deals with thermal comfort is
carried out, where the main principles of comfort are set to formulate the second part.
The research follows in its second part by an analytical approach explaining
the research methodology and the data analysis. This part introduces the methodology
followed in the field studies carried out and explains the methods used to gather
different types of data and the reasoning behind each. It also discusses the methods
used in the analysis of the data. The part of data analysis extracts the outcome from
the field studies and correlates the comfort votes to the thermal environments’
variables.
Finally, concluding the experience gained in the previous part, the third part
shows the conclusion from the data analysis and applies the conclusions to a wider
scope. Figure 1 shows the map of the research methodology.

Chapter One
6
The Research Methodology
Part
one
Theo
retic
al Chapter One
Introduction To The Study
Chapter Two Literature Review
Part
Tw
o
Ana
lytic
al
Chapter Three
Objectives and Methodology
Chapter Four Data Analysis
Chapter Five Discussion
Discuss the data analyzed from the previous chapter and compare them to other research outcomes
Part
Thr
ee
Eva
luat
ion
Chapter Six Conclusion
Introduce the research aims, scope and methodology
Introduce the historic review about thermal comfort and the precedent actions and prospective aims.
Conclusion and set of parameters to act as guiding for the future
Showing the objectives of the research and the methods followed in obtaining data.
Introduce the outcome from the data gathered and its analysis.
Figure 1: The research methodology

Studying the Adaptive Comfort Model A Case Study in Arid Climate: Cairo, Egypt
CHAPTER ONE RESEARCH OVERVIEW
CHAPTER TWO LITERATURE REVIEW
CHAPTER THREE OBJECTIVES AND METHODOLOGY
CHAPTER FOUR DATA ANALYSIS
CHAPTER FIVE DISCUSSION
CHAPTER SIX CONCLUSION

8

Studying the Adaptive Comfort Model A Case Study in Arid Climate: Cairo, Egypt
9
CHAPTER TWO LITERATURE REVIEW
2.1 INTRODUCTION
Building occupants are affected by the design of buildings and their input after
occupancy, where they can evaluate real life conditions, is a valuable source of data.
The data gathered can be used to judge the indoor thermal quality, and its effect on
comfort. Achieving thermal comfort is the main target behind designing mechanically
conditioned office buildings (Schiller 1990). It was found that temperature is one of the
most important aspects that affect the occupants’ satisfaction and at the same time it is
one of the factors that users frequently complain from (Brill, et al. 1984).
As climate control devices are among the largest sources of energy use in
buildings, it is important to balance energy savings against occupant needs. This could
be used to determine the range of thermal comfort conditions that could be used in the
design of new buildings. A lot of studies were carried out in recent decades aiming at
determining the comfortable thermal conditions within different types of buildings
regarding the methods of heating and cooling used in each. In these studies, two main
methodical approaches were used. The first was laboratory experiments using a climate
chamber as an environment for the study. The second method was running field studies
in real life context using real buildings as an environment of the study. Advantages and
disadvantages of both types are pointed out in this chapter and the outcome of both
approaches is described. Moreover, the second method of field studies is fully discussed
as it is the base of this research.
2.2 HISTORIC REVIEW
Thermal comfort is an important issue, hence a wide variety of scientific
disciplines are interested in studying it, ranging from environmental psychologists,
concerned with perceived comfort and productivity in buildings, to engineers (Gossauer
and Wagner 2007). Comfort conditions from the physiological point of view can be
obtained when a person maintains a normal balance between production and loss of
heat at normal body temperature and without sweating (Yaglou 1949).

Chapter Two
10
Other concepts, which are of interest to many of the comfort community, are
based on three main assumptions as pointed out by (Auliciems 1981). The first
assumption describes the relation between thermoregulatory activity and subjective
acceptability, indicating that minimal thermoregulatory activity is equated to maximum
subjective acceptability. The second assumption sets the relation between thermal
sensation and levels of discomfort implying that both are synonymous. The third
assumption determines that perception of warmth is exclusively the function of thermal
stimuli. None of the previous assumptions consider that thermal sensation depends on
parameters of past cultural and climatic experience and personal expectations.
It was until the late seventies when comfort community depended on the
previous concepts in deriving their comfort models. These concepts are translated into
equivalent relations between different variables that are related to comfort as shown in
Table 1. As indicated by (Auliciems 1981), the need to consider environmental
perceptions beyond the level of physiological reception, response and simple evaluation
is implied in the above description of comfort relations.
In the 1980s there was a great progress in the air conditioning industry, and
buildings were strongly influenced by social, technical and material changes. The
former progresses lead to the extension of the definition of thermal comfort to include
the environmental and expectations from memory. It was argued that thermal comfort is
a multivariate phenomenon that is influenced by behaviour (clothing and activity) and
expectations as well as by environment and memory (Brager and de Dear 2003).
Today, the general and common definition of thermal comfort is given in
ASHRAE 55, in 1992, as “that condition of mind that expresses satisfaction with
the thermal environment”. The term “expresses satisfaction” must involve, in
addition to the affective component, that of cognition which is necessary to the
processes of environmental perception. With the growing complexity of indoor
environment, it became almost impossible to “measure” comfort directly (Brager and
de Dear 2003).

Literature Review
The following parts of this chapter will describe the different methodical
approaches of measuring thermal comfort as well as the outcome and drawbacks of
each.
Table 1: The schedule shows the Relations between different variables, as assumed by traditional comfort research. (Auliciems 1981)
Environmental
Warmth
Thermoregulatory
response
Thermal
sensation
Assumed
comfort level
Hotter than neutral Sweating Warm - Hot Unacceptable
Nearly neutral Vasodilatation Slightly warm Acceptable
Neutral Minimal None Maximum
Nearly neutral Vasoconstriction Slightly cool Acceptable
Colder than neutral Thermo genesis Cool - Cold Unacceptable
2.3 COMFORT MODELS
In order to discover formulas that describe the thermal comfort state, subjective
sensations resulting from external thermal stimuli are adopted as a valid measure of the
thermal quality of the surrounding thermal environment. The estimation of the thermal
comfort level is largely based upon the responses on verbal scales of sensation. Subjects
are asked to vote, expressing their sensation on a verbal scale. Measurements of the
physical environmental factors are also determined. Both are, then, combined in order
to indicate the conditions of the thermal comfort state.
The study, here, will focus on the thermal comfort models implemented in the
ASHRAE standard 55 (2004). Two types of thermal comfort models form the base of
the standard in order to define temperature ranges that should result in thermal
satisfaction for at least 80% of occupants in a space. The standard is based on two types
of thermal comfort models. The first is developed by Fanger and colleagues on the basis

Chapter Two
12
of laboratory studies (Fanger 1970). This is known as the Fanger’s Predicted Mean Vote
(PMV) model which is adopted by many international standards and guidelines,
providing an index of thermal comfort. The second type of thermal comfort models is
based on field studies in the real environments resulting in a new adaptive model
developed in the 1990s by Brager and de Dear that is incorporated alongside the PMV
model as an optional method to be used in the case of free running buildings. Both
types of models will be discussed here.
2.3.1 Types of Thermal Comfort Models
Models can be classified into heat balance models and adaptive models. The
heat balance models are mainly due to experiments in climate chambers, while the
adaptive models are developed based on field studies. It became obvious that different
results are obtained when testing people in their real life conditions, especially in the
case when these conditions are not an air-conditioned space. In the 1970s the use of air
conditioning and the development of new materials grew which brought up the
necessity of quantifying thermal comfort (Gossauer and Wagner 2007). Today, the
need to conserve energy in a manner that promotes the usage of naturally ventilated
buildings but does not sacrifice the occupants’ satisfaction implies the usage of adaptive
thermal comfort models (de Dear and Brager 2002)
2.3.1.1 Heat balance models
Thermal comfort may be approached from the standpoint of thermal physiology.
This approach seeks the body-states people find comfortable at various levels of
activity, establishes the heat and moisture transfer properties of clothing, and evaluates
the effects of the physical environment (air temperature, radiation exchange, air
movement and humidity). The research is commonly conducted in climate controlled
rooms with subjects in standard clothing and performing standard tasks. The resulting
models of human response are used to assess the effect of any proposed environment
and clothing ensemble. The best known model is the PMV-PPD model (Fanger 1972)
which is incorporated into the ASHRAE standard 55; the model implies a steady state
human heat balance, which is independent of external climate factors. It predicts the
mean thermal sensation of a group of people on a scale from cold (-3) through neutral

Literature Review
(0) to hot (3), together with the predicted percentage of people dissatisfied (PPD) with
the environment (Humphreys and Nicol 2007)
PMV is based on Fanger’s comfort equation (see Equation 1). The satisfaction
of the comfort equation is a condition for optimal thermal comfort of a large group of
people, or, when most of this group experiences thermal neutrality, and no local
discomfort exists (Fanger 1967). Fanger used data from another study (McNall, et al.
1967) to derive a linear relationship between activity levels and sweat rate. In this
study, college-age participants, who were exposed to different thermal conditions while
wearing standardised clothing, voted on their thermal sensation using the ASHRAE
scale. The linear relationship was formed from those participants (n=183) who stated
that they felt thermally neutral (i.e. voted ‘0’) for a given activity level. Then another
study was conducted, on 20 college-age participants, to derive a linear relationship
between activity level and mean skin temperature (Fanger 1967). In this experiment,
participants wore standardised clothing and took part in climate chamber tests at four
different activity levels (sedentary, low, medium and high). It is important to note that
participants were not asked to vote on their thermal sensation in this study. Instead, the
experimental conditions used temperatures that had been found to achieve thermal
neutrality in another study (McNall, et al. 1967). Although Fanger assumed that the
participants were at, or near, thermal neutrality, this assumption was not directly tested
(Charles 2003).
After that the results were transformed into two linear relationships of heat
balance equations, to create a ‘comfort equation’. The comfort equation describes all
combinations of the six PMV input variables that result in a neutral thermal sensation.
These variables are divided into four physical variables, air temperature, radiant
temperature, air velocity and relative humidity, and two personal variables, the
metabolic rate and clothing insulation. Activity level is measured in terms of metabolic
rate, or met units, and clothing insulation in clo units, these values are estimated using
tables (see Appendix A for estimation of metabolic rates and Appendix B for estimation
of clothing insulation). The comfort equation was, then, validated against other studies
(Nevins, et al. 1966) and (McNall, et al. 1967), in which college-age participants rated

Chapter Two
14
their thermal sensation in response to specified thermal environments. The predictions
made by the comfort equation were in agreement with the results from these studies.
f (M, Icl, v,tr,ta,pw) = 0
Equation 1: Fanger's comfort Equation. Where M = metabolic rate in met units, Icl = cloth index in clo units. v = air velocity in m/s, tr = mean radiant temperature in oC, ta = ambient air temperature in oC, Pw = vapour pressure of water in ambient air in Pa units.
The comfort equation predicts conditions where occupants will feel thermally
neutral. However, for practical applications, it is also important to consider situations
where subjects do not feel neutral. By combining data from the previous studies with
his own studies, Fanger used data from 1396 participants to expand the comfort
equation. Fanger derived his comfort equation (Fanger 1967) based on college-age
students exposed to steady-state conditions in a climate chamber for a 3-hour period in
winter at sea level (1,013 hPa) while wearing standardized clothing and performing
standardized activities while exposed to different thermal environments. The resulting
equation described thermal comfort as the imbalance between the actual heat flow from
the body in a given thermal environment and the heat flow required for neutral
conditions for a given activity. This expanded equation related thermal conditions to a
seven-point thermal sensation scale, and became known as the PMV index (Fanger
1970). The final equation for optimal thermal comfort is fairly complex and need not
concern us here. The PMV model is based on the fact that the human body produces
heat, exchanges heat with the environment, and loses heat by diffusion and evaporation
of body liquids. During normal activities these processes result in an average core body
temperature of approximately 37°C. The body’s temperature control system tries to
maintain these temperatures even when thermal disturbances occur. The human body
should meet a number of conditions in order to perceive thermal comfort. According to
(Fanger 1970) the requirements for steady-state thermal comfort are: (i) the body is in
heat balance, (ii) mean skin temperature and sweat rate, influencing this heat balance,
are within narrow limits, and (iii) no local discomfort exists. Local discomfort to be
avoided includes draughts, radiant asymmetry, or temperature gradients. The PMV
model applies to healthy adult people and cannot, without corrections, be applied to
children, older adults and the disabled (Hoof 2008). The model has been globally

Literature Review
applied for almost 40 years throughout all building types, although Fanger was quite
clear that his PMV model was intended for application by the heating, ventilation and
air-conditioning (HVAC) industry in the creation of artificial climates in controlled
spaces (de Dear and Brager 2002).
Based on PMV, the predicted percentage of people dissatisfied (PPD) can be
determined. The PPD index is related to the PMV as shown in Figure 2. It is based on
the assumption that people voting +2, +3, –2, or –3 on the thermal sensation scale are
dissatisfied, and the simplification that PPD is symmetric around a neutral PMV. The
Predicted Percentage Dissatisfied (PPD is calculated from PMV, and predicts the
percentage of people who are likely to be dissatisfied within a given thermal
environment. The PMV and PPD form a U-shaped relationship, where percentage
dissatisfied increases for PMV values above and below zero.
Figure 2: Predicted percentage dissatisfied (PPD) as a function of predicted mean vote (ASHRAE standard-55, 2004)
The PMV thermal sensation index predicts the mean thermal sensation vote for
a large group of persons and indicates the deviation from presumed optimal thermal
comfort (thermal neutrality). The index provides a score that corresponds to the
ASHRAE thermal sensation scale. It is generally accepted that a person with a thermal
sensation in one of the three middle categories considers his environment acceptable,
and that someone voting in one of the four outer categories is dissatisfied with his
thermal environment (D. McIntyre 1980) (ASHRAE 2004).

Chapter Two
16
To ensure a comfortable indoor environment, PMV should be kept 0 with a
tolerance of ±0.5 scale units. Fanger stated that the PMV model was derived in
laboratory settings and should, therefore, be used with care for PMV values below -2
and above +2 (Hoof 2008). The PMV model is designed to predict the average thermal
sensation for a large group of people. Within such a group, optimal thermal conditions
are likely to vary between individuals by up to 1.15ºC (Fanger and Langklide 1975), or
up to 1 scale unit of the ASHRAE thermal sensation scale (Humphreys and Nicol
2002). Therefore, even if the thermal environment in a space is maintained in
accordance with the PMV model, there will be some occupants who are thermally
uncomfortable. These differences between people are acknowledged by (Fanger 1970),
and are also reflected in the PPD index. At the neutral temperature, as defined by the
PMV index, PPD indicates that 5% of occupants will still be dissatisfied with the
thermal environment. Therefore, while the PMV model can be used to determine
appropriate temperatures that will satisfy the majority of occupants, it is unrealistic to
expect all occupants to be thermally satisfied.
2.3.1.2 Adaptive models
Thermal comfort may also be approached from the standpoint of human
adaptation; this adaptive approach investigates the dynamic relation between people and
their everyday environment, paying attention to the “adaptations” people make to their
clothing and to their thermal environment to secure comfort. It sees thermal comfort as
part of a self-regulating system because it concerns the whole range of actions people
take to ensure their comfort. In the adaptive approach of modelling thermal comfort, it
is not only the physics that affect the perception of the environment; other factors such
as climatic settings, social conditioning, economic considerations and other contextual
factors play a role in thermal preferences (Brager and de Dear 1998).
The adaptive hypothesis states that one’s satisfaction with the indoor climate is
achieved by matching the actual thermal environmental conditions prevailing at that
point in time and space, with one’s thermal expectations. This is achieved either
through the way people interact with the environment and modify their own behaviour;
or the way they may change their expectations and thermal preferences because of
contextual factors and past thermal history. The adaptive theory explains thermal

Literature Review
comfort, not as an exclusive product of heat balance formulae, but as a more holistic
concept, involving other variables, in which human adaptation plays a fundamental role.
The adaptive model reflects a ‘give and take’ relationship between the environment and
the user, the person is no longer considered as a passive recipient but instead is an
active agent interacting with and adjusting to the person-environment system via
multiple feedback loops. There are mainly three feedback loops, behavioural feedback-
adjustment, physiological feedback-acclimatization and psychological feedback –
habituation and expectation; each is discussed here in details (de Dear, Brager and
Cooper 1997).
1) Behavioral feedback – adjustment:
Also referred to as physical adaptation, which mainly includes all modifications
a person can consciously or unconsciously make in order to change the heat and mass
fluxes governing the body’s thermal balance. The sense of discomfort is considered an
initiator of the adaptive response; physical adaptation is considered as being the most
effective form of adaptation, offering the greatest opportunity for people to play an
active role in maintaining their own comfort. Figure 3 summarizes the behavioural
feedback loop.
Figure 3: Behavioral feedback loop. (de Dear, Brager and Cooper 1997)
Physical adjustment can be categorized into three main categories as follows
(Brager and de Dear 1998):
a. Personal adjustment: which includes personal variables, where persons
adjust themselves to the surroundings by adjusting clothing, activity,
posture, eating or drinking hot and cold things, and even moving to a
different location seeking more comfortable environments … etc.
Chapter Two
18
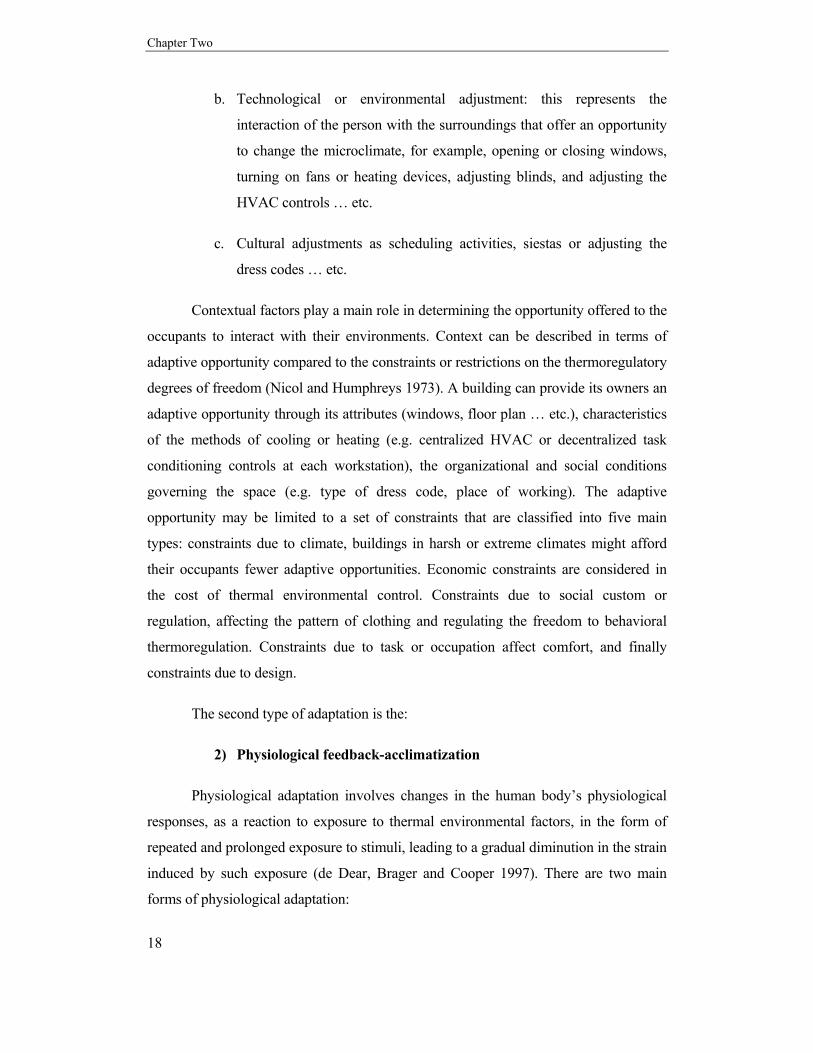
b. Technological or environmental adjustment: this represents the
interaction of the person with the surroundings that offer an opportunity
to change the microclimate, for example, opening or closing windows,
turning on fans or heating devices, adjusting blinds, and adjusting the
HVAC controls … etc.
c. Cultural adjustments as scheduling activities, siestas or adjusting the
dress codes … etc.
Contextual factors play a main role in determining the opportunity offered to the
occupants to interact with their environments. Context can be described in terms of
adaptive opportunity compared to the constraints or restrictions on the thermoregulatory
degrees of freedom (Nicol and Humphreys 1973). A building can provide its owners an
adaptive opportunity through its attributes (windows, floor plan … etc.), characteristics
of the methods of cooling or heating (e.g. centralized HVAC or decentralized task
conditioning controls at each workstation), the organizational and social conditions
governing the space (e.g. type of dress code, place of working). The adaptive
opportunity may be limited to a set of constraints that are classified into five main
types: constraints due to climate, buildings in harsh or extreme climates might afford
their occupants fewer adaptive opportunities. Economic constraints are considered in
the cost of thermal environmental control. Constraints due to social custom or
regulation, affecting the pattern of clothing and regulating the freedom to behavioral
thermoregulation. Constraints due to task or occupation affect comfort, and finally
constraints due to design.
The second type of adaptation is the:
2) Physiological feedback-acclimatization
Physiological adaptation involves changes in the human body’s physiological
responses, as a reaction to exposure to thermal environmental factors, in the form of
repeated and prolonged exposure to stimuli, leading to a gradual diminution in the strain
induced by such exposure (de Dear, Brager and Cooper 1997). There are two main
forms of physiological adaptation:

Literature Review
a. Genetic adaptation: This becomes part of the genetic heritage of an
individual or group of people. This type of adaptation develops at a time
scale beyond the lifetime of an individual, and involves the time
between generations.
b. Acclimatization: This can be carried out within a person’s lifetime.
Acclimatization occurs after several days of exposure to a certain
thermal stimuli, e.g. hotter or cooler environments, but in general it is a
prolonged seasonal process where its full attainment results from
everyday experiences. Physiological acclimatization is mediated by the
automatic nervous system and directly affects the physiological
thermoregulation set points.
Acclimatization is an unconscious feedback loop mediated by the autonomic
nervous system, which directly affects our physiological thermoregulation set points.
Like the behavioural adjustment depicted earlier, the physiological feedback process of
acclimatization can also be depicted schematically in Figure 4.
Figure 4: Physiological feedback loop. ( (de Dear, Brager and Cooper 1997)
3) Psychological feedback – habituation and expectation
Psychological adaptation includes the effects of cognitive and cultural variables
and describes the extent to which habituation and expectation alter one’s perception of
and reaction to sensory information. As described by researchers in psychophysics, it is
the repeated exposure to an environmental stressor that leads to a diminution of the
evoked sensation’s intensity. Psychological adaptation, which is not considered in heat
balance equations, can have a great influence on thermal comfort. Although being one
Acclimatization
Outdoor
Climate
Indoor
climate
Physiological strain
and regulation
Discomfort and
dissatisfaction

Chapter Two
20
of the most important adaptive processes, it is the least studied, mostly due to its
complex nature. The adaptive model recognizes the potential for a feedback loop where
one’s past and current thermal experiences, with both indoor and outdoor climate, can
directly affect one’s thermal response and cognitive assessment of acceptability as
described in Figure 5 (de Dear and Brager 1998).
Figure 5: Psychological feedback loop. (de Dear, Brager and Cooper 1997)
The principle research method of getting an adaptive model is the field studies
as fully described later in this chapter (Humphreys and Nicol 2007). The following is a
review of some of the earliest studies of adaptation that resulted in adaptive comfort
models; this will give a glimpse of the attempts done before the implementation of any
of the adaptive models in the international standards. Then a peer review will explain
the mechanism of the existing adaptive model that is part of the international standard
ASHRAE – 55 (2004).
The early attempts at deducing an adaptive model was that of (M. A.
Humphreys 1976), using the early field studies preceding the model by forty years, with
a total number of observations exceeding 200,000, from a wide variety of climates and
countries, ranging from winter in Sweden to summer in Iraq. The equation derived
predicted the temperature of thermal neutrality, Tn, from the mean temperature, Tm,
experienced by the respondents during the survey is Equation 2.
Tn = 2.56 + 0.831 Tm (°C)........................(r = + 0.96)
Equation 2: The Adaptive Comfort Model of Humphrey's (1975). Tm is considered as the mean air temperature or the globe temperature recorded within the building, Tn is the neutral temperature

Literature Review
Figure 6 is a scatter diagram showing the mean temperature and the neutral
temperature. Over 92% of the variation of the neutral temperature is associated with the
variation of the mean temperature.
Figure 6: Scatter diagram of mean temperature and neutral temperature, for Humphrey's 1975 comfort model. After (M. A. Humphreys 1976)
After that, (Auliciems 1969) suggested that there might be a statistical
relationship between indoor thermal neutralities and outdoor climate. (M. Humphreys
1978) investigated this relationship further and found convincing evidence for
adaptation to outdoor climate as shown in Figure 7. The outdoor climate affected indoor
neutrality especially in the case of free running buildings, which depended on natural
ventilation. In such buildings, the adaptive model of dependence of indoor comfort
temperatures upon the mean monthly outdoor temperature is depicted in Equation 3,
where 94% of the variation of the neutral temperature in free running buildings is
associated with the variation of the mean monthly outdoor temperature.
Tn = 11.9 + 0.534 Tm …………………….(r = 0.97)
Equation 3: The Adaptive comfort model of Humphreys (1978). Where Tn is the predicted neutral temperature and Tm is the mean outdoor temperature for the months in question.
Neu
tral a
ir te
mpe
ratu
re. °
C
Mean air or globe temperature. °C

Chapter Two
22
Figure 7: The statistical dependence of indoor thermal neutralities on climate. (After (M. A. Humphreys 1976)).
In 1981, Auliciems reviewed the data used by Humphreys, and supplemented it
by others. These revisions increased the database to 53 separate field studies in various
climatic zones covering more countries and more climates, resulting in an enlarged
database. Using both types of buildings, the free running buildings and the conditioned
ones, he derived the adaptive model in Equation 4, and this was valid for Tn between
18°C and 28°C.
Tn = 17.6 + 0.31 Tm ………………(r = 0.88)
Equation 4: The Adaptive comfort model of Auliciems (1981). Where Tn is the predicted neutral temperature and Tm is the mean outdoor temperature for the months in question.
Since then many other researchers found similar correlations, but none of these
attempts were included in the international standards of thermal comfort. It was not
until 1998 when a research (de Dear, Brager and Cooper 1997) based on the analysis of
21,000 sets of raw data compiled from field studies in 160 buildings, both air
conditioned and naturally ventilated, located on four continents in different climatic
zones, suggested the different ways the adaptive comfort model could be used for the
design, operation, or evaluation of buildings, and for research applications. The
resulting model was the base of the new ASHRAE standard -55 (2004) where it
implemented an adaptive comfort model to be used as an optional method in free
Mean monthly outdoor temperature. °C
Indo
or n
eutra
lity
°C

Literature Review
running buildings. The following is an explanation of this model which is the reference
point in this study.
The purpose of ASHRAE Standard 55 (Thermal Environmental Conditions for
Human Occupancy), is “to specify the combinations of indoor space environment and
personal factors that will produce thermal environmental conditions acceptable to 80%
or more of the occupants within a space”. While “acceptability” is never precisely
defined by the standard, it is commonly accepted within the thermal comfort research
community that “acceptable” is synonymous with “satisfaction”, and that “satisfaction”
is indirectly associated with thermal sensations of “slightly warm”, “neutral”, and
“slightly cool”, and that “thermal sensation” is the question most commonly asked in
both laboratory and field studies of thermal comfort.
The Adaptive Comfort Standard (ACS) is mainly an outcome of analyzing a
global database of 21000 measurements accompanied with their subjective votes, where
office buildings were the most common type of buildings surveyed. According to the
method of heating and cooling used, the buildings could be classified into three main
prototypes: air conditioned, naturally ventilated and mixed mode. Locations include
Bangkok, Indonesia, Singapore, Athens, Michigan, several locations each in California,
England, and Wales, six cities across Australia, and five cities in Pakistan.
The focus, here, will be on naturally ventilated buildings, where the natural
ventilation occurred through operable windows that were directly controlled by the
occupants. The standard includes an adaptive comfort model which is a relation
between mean outdoor air temperature and the corresponding acceptable indoor air
temperatures. The data concerning the naturally ventilated buildings in the global
database were extracted separately, forming a subgroup depending only on naturally
ventilated buildings. The statistical analysis underlying the model considered each
building as the unit of analysis, and a weighted analysis followed, where the number of
votes in each building represented the weight.
A comparison of the observed and predicted lines within each building
illustrates the role of adaptation in free running building type as shown in Figure 8 . The
difference between these two lines in the naturally ventilated buildings shows that such

Chapter Two
24
behavioural adjustments accounted for only half of the climatic dependence of comfort
temperatures. The rest must come from influences not accounted for by the PMV
model, and the analysis done by the researchers (de Dear, Brager and Cooper 1997)
suggested that psychological adaptation is the most likely explanation.
Figure 8: Observed and predicted indoor comfort temperatures from RP-884 database, for naturally ventilated buildings. (Brager and de Dear 2001)
The outdoor climatic environment for each building was characterized in terms
of mean outdoor dry bulb temperature Ta,out, instead of ET*. Optimum comfort
temperature, Tcomf, was then re-calculated based on mean Ta,out as in Equation 5.
Tcomf = 0.31 x Ta,out + 17.8 (deg C)
Equation 5: The Adaptive Comfort Model of ASHRAE Standard 55 (2004). Where Tcomf is the predicted comfortable temperature and Ta,out is the mean outdoor temperature for the months in question (Brager and de Dear 2001)
Only statistically significant (at p< 0.05) buildings (data points) were
considered, forming the data on which the (ACS) model is based upon. This criterion in
the selection of the database forming the model resulted in 36 out of 44 significant
buildings, with almost 8900 subjective votes. The buildings selected covered seven
climatic zones, the type of each climatic zone and the number of buildings covering
each zone is listed in Table 2.

Literature Review
The next step was to define a range of temperatures corresponding with 90%
and 80% acceptability. Only a small subset of the studies in the RP-884 database
included direct assessments of thermal acceptability, and the analysis of these data was
not statistically significant. “Acceptability” was inferred from the thermal sensation
votes, and started with the widely used relationship between group mean thermal
sensation vote and thermal dissatisfaction (i.e., the classic PMV-PPD curve see Figure
2). The PMV-PPD relationship indicates that a large group of subjects expressing mean
thermal sensation vote of +0.5 (or +0.85) could expect to have 10% (or 20%) of its
members voting outside the central three categories of the thermal sensation scale.
Applying the + 0.5 and + 0.85 criteria to each building’s regression model of thermal
sensation ,as a function of indoor temperature, produced a 90% and 80% acceptable
comfort zone, respectively, for each building. Arithmetically averaging those comfort
zone widths for all the NV buildings produced a mean comfort zone band of 5°C for
90% acceptability, and 7°C for 80% acceptability, both centered on the optimum
comfort temperature shown in Equation 5. These mean values were applied as a
constant temperature range around the empirically-derived optimum temperature in
Equation 5. The resulting 90% and 80% acceptability limits are shown in Figure 9.
As indicated by the standard, in order for this optional method to apply, the
space in question must be equipped with operable windows that open to the outdoors
and that can be readily opened and adjusted by the occupants of the space. There must
be no mechanical cooling system for the space (e.g., refrigerated air conditioning,
radiant cooling, or desiccant cooling). Mechanical ventilation with unconditioned air
may be utilized, but opening and closing of windows must be the primary means of
regulating the thermal conditions in the space. The space may be provided with a
heating system, but this optional method does not apply when the heating system is in
operation. It applies only to spaces where the occupants are engaged in near sedentary
physical activities, with metabolic rates ranging from 1.0 met to 1.3 met. This optional
method applies only to spaces where the occupants may freely adapt their clothing to
the indoor and/or outdoor thermal conditions.

Chapter Two
26
Table 2: Climatic zones covered by the Adaptive Comfort Standard are shown, and the number of buildings in each zone is indicated.
Climate Number of Buildings
Desert 2
Semi Desert 6
West coast marine
8
Mediterranean 10
Humid subtropical 5
Tropical savannah 4
Wet equatorial 1
Total 36
A very similar adaptive comfort model is now implemented in the European
standard EN 15251 (Indoor environmental input parameters for design and assessment
of energy performance of buildings). The intended standard for thermal comfort for
buildings in the free running mode is based on the data collected from the European
project Smart Controls and Thermal Comfort (SCATs), where physical measurements
were made and subjective responses were recorded in 26 European offices in France,
Greece, Portugal, Sweden and the United Kingdom at monthly intervals over
approximately one year.

Literature Review
Figure 9: The adaptive comfort standard, showing the acceptable operative temperature ranges for naturally conditioned spaces. (ASHRAE Standard-55 2004)
Many of these data were gathered from naturally ventilated office buildings
which were in free running mode outside the heating season. To be noticed that a free
running building is one which no energy is being used either for heating or for cooling
at the time of the survey. The use of fans to increase air movement doesn’t exclude the
building from the free running mode. These criteria resulted in 1449 buildings to
represent the free running buildings and to be used for analysis to set out the standard.
To calculate the neutral temperature from fairly a small sample of comfort votes
on a particular day in a particular building, the Griffiths method is used, where the
neutral temperature can be calculated from the comfort vote using Equation 6, by
assuming that a comfort vote of zero (neutral) will represent comfort. The Griffiths’
constant describes the relation between subjective warmth and temperature assuming no
adaptation takes place, the Grifiths constant is taken to be 0.5 in the calculation of the
standard.
Tcomf = Tg – C/G
Equation 6: The estimation of neutral temperature T comf (°C) using Griffiths’ method, where Tg is the globe temperature (°C), C is the comfort vote and G (K‐1) is the Griffiths constant. (Nicol and Humphreys 2010)
The adaptive approach to predicting neutral temperature in free running
buildings has to relate the neutral temperature to a measure of outdoor temperature. An

Chapter Two
28
improvement on the monthly means in this standard is to use an exponentially weighted
running mean of the daily mean air temperature. The exponentially weighted running
mean temperature Trm for any day is expressed in the series
Trm = (1- α) {Tod-1 + α Tod-2 + α2 Tod-3…….}
Equation 7: Where α is a constant (<1), Trm is the exponentially weighted running mean temperature ,Tod-1 etc are the 24 – daily mean temperature for yesterday, the day before and so on. (Nicol and Humphreys 2010)
For a series of days the value of Trm for any day can be simply calculated from
the value of the running mean and of the mean outdoor temperature for the previous day
( Trm-1 and Tod-1) as in Equation 8.
Trm = (1- α) Tod-1 + α Trm-1
Equation 8: The values of the exponentially weighted running mean temperature Trm for any day. (Nicol and Humphreys 2010)
The resulted preferred relationship between neutral temperature and outdoor
temperature using Griffiths’ constant of value 0.5 and α of value 0.8 is:
Tcomf = 0.33 Trm + 18.8
Equation 9: The adaptive comfort equation implemented in the European standard EN 15251. (Nicol and Humphreys 2010)
The limits of Equation 9 are shown in Figure 10, coming from Annex A2 in the
standard. The categories shown in the diagram refer to the descriptors shown in Table 3
, and are placed in order of building type. Categories are defined by the type of building
and are not intended to imply the superiority of a particular category. To achieve
inclusion in any particular category the indoor operative temperature should not fall
outside the given temperature range for more than 3-5 % of occupied hours at any
particular running mean value of the outdoor temperature.

Literature Review
Table 3: Applicability of the categories and their associated acceptable temperature ranges in free-running mode. (Nicol and Humphreys 2010)
Figure 10: Design values for the upper (continuous lines) and lower (dashed lines) limits for operative temperature in buildings without mechanical cooling systems (free running) for the different categories of buildings as a function of the exponentially weighted running mean of the external temperature. (Nicol and Humphreys 2010)
Although the adaptive comfort charts of both standards, the ASHRAE standard
and the European standard, are conceptually similar but there are many differences
between both standards, these differences are as follows,
First of all the databases are different ASHRAE 55-2004 uses the data from the
ASHRAE world database of field experiments collected by de Dear, while EN15251
uses the data from the more recent European SCATs project. Secondly the building
classification is different The ASHRAE chart applies only to naturally ventilated
buildings, while the EN15251 chart applies to any building in the free running mode.
Another difference is the derivation of the neutral temperature. For EN15251 a standard
relation between thermal sensation and operative temperature was derived, and then

Chapter Two
30
applied to every observation in the data. For the ASHRAE standard the data were
divided into batches, each batch being the data from a particular survey in a particular
building. Separate regression coefficients had been derived from each contributing
batch of data, and batches whose regression coefficient failed to reach statistical
significance were excluded. The different methods will not yield identical neutral
temperature. Also the outdoor temperature is defined differently. The ASHRAE chart is
expressed in terms of the monthly mean outdoor air temperature. For EN15251
contemporaneous weather data were used for all the contributing surveys. This enabled
the construction and testing of an exponentially weighted running mean of the outdoor
air temperature. (Nicol and Humphreys 2010)
2.3.2 Limitations of each type
Laboratory and field evidence, as well as everyday observations, establish that
expression of human thermal states cannot be encompassed adequately by physiological
parameters alone. At present, it is proved that thermal experiences and expectations are
functions of both the natural climatic and techno-cultural environments, thus
satisfaction is also related to both these environments. It is noted by a large number of
researchers that people in different parts of the world may become accustomed to and
express satisfaction with temperatures other than those found “comfortable” in other
regions. These differences, therefore, may be – in part – a result of cultural factors,
including levels of microclimatic control (Auliciems 1981). The limitation of both types
of thermal comfort models is discussed below.
2.3.2.1 PMV-PPD
The strength of the PMV model is the possibility of comprehensive
measurement in controlled conditions, and the use of sound experimental design
(Humphreys and Nicol 2007). The PMV model is based on climate chamber
experiments, during which the four physical variables (air temperature, mean radiant
temperature, relative humidity, and air velocity) can be closely controlled and
monitored. The use of standardised clothing and activities does not ensure that clothing
insulation and activity level can be accurately quantified. In field study settings,
discrepancies between actual and predicted thermal sensations reflect, in part, the

Literature Review
difficulties inherent in obtaining accurate measures of clothing insulation and activity
level. In most practical settings, poor estimations of these two variables are likely to
reduce the accuracy of PMV predictions. In field settings, it is more difficult to control
or to accurately measure these six variables. Measurement error resulting from these
difficulties has been argued to contribute to the discrepancies found between PMV and
actual thermal sensation (Benton, Bauman and Fountain 1990), (de Dear and Brager
1998), (N. Oseland 1994).
Establishing the insulating properties of clothing is a time-consuming and
detailed process that is usually conducted in laboratory experiments, where clothing
insulation tables are constructed, and usually using thermal manikins in conditions of
still air. Clothing insulation studies show good agreement between thermal manikins
and humans during sedentary activities, but that their correspondence decreases for
other activity levels (Oseland and Humphreys 1994). Clothing insulation is not
measured in thermal comfort studies, instead an estimate is considered to represent that
value using tables that have been developed from clothing insulation studies (see
Appendix B). Some researchers assume an average clo value for all occupants based on
the season and climate of the study location. More detailed studies ask occupants to
complete a garment checklist, which can, then, be used to select a more appropriate clo
value for the group, or separate clo values for each participant. Using detailed garment
checklists, up-to-date clothing insulation tables, and accounting for chair insulation can,
therefore, improve thermal comfort researchers’ estimations of clo values. The
difference between measured clo value and the estimated values in comfort studies
repulse the correspondence between PMV and actual thermal sensation votes. In
addition, clo estimates do not accurately reflect differences between people, changes in
clothing during the day, or social and contextual constraints on clothing choices (de
Dear and Brager 2002) (Oseland and Humphreys 1994). Therefore, clo values present a
source of concern for PMV calculations, and are likely to contribute to discrepancies
between predicted and actual thermal sensation.
Activity level is measured in terms of metabolic rate, or ‘met’ (Gagge, Burton
and Bazett 1941). Analyses using the ASHRAE RP-844 database showed that the
PMV’s accuracy varied according to met rate. The PMV model best predicted actual

Chapter Two
32
thermal sensation for activity levels below 1.4 met. Above 1.8 met, PMV overestimated
actual thermal sensation by up to one scale unit (Humphreys and Nicol 2002). The most
accurate method for determining met is through laboratory studies, where heat or
oxygen productions are measured for participants conducting specific activities
(Havenith, Holmer and Parsons 2002). Alternatively, the participant’s heart rate can be
measured and compared to previously developed tables of heart rate for specific
activities. It is also very important to consider the activity prior to the comfort
experiment as it might influence the current met rate. All of these methods, however,
are time-consuming and invasive, and are generally not practical for use by thermal
comfort researchers. Instead, these researchers relied on estimates, based on tables of
met rates for specific activities and occupations. In most studies, an average met rate is
assumed for the group. More recent studies ask occupants to record their activities over
the last hour, and this information is used to develop a more accurate average for the
group, or individualised met estimates for each participant. Activity level is probably
one of the least well-described parameters of all the parameters that affect thermal
sensation, comfort and temperature preferences indoors. Current met tables provide
information for the ‘average’ person, and as such do not accurately reflect differences
between people or contexts (Charles 2003).
Fanger conducted a series of climate chamber experiments to investigate the
existence of physiological acclimatisation (Fanger 1970), (Fanger, Hojbjere and
Thomsen 1977), (Olesen and Fanger 1971). It was found that there is not a significant
change in the neutral temperature when exposing a person for a period of 10 days to
35°C in a climate chamber. In further studies, native participants from Denmark and the
United States were compared to native participants from the Tropics, as well as
participants regularly exposed to cold environments (meat-packing workers and cold-
water swimmers). Participants’ physiological processes (sweat rate, heart rate … etc.)
were found to differ only slightly between the groups. The only significant finding from
these comparisons was that the meat-packers’ neutral temperature was 1ºC lower than
that of non-cold exposed participants. The researchers considered this difference of
minor importance in practice and concluded that people are not physiologically adept at
changing their neutral temperatures (Olesen and Fanger 1971).

Literature Review
The PMV model was developed from laboratory studies, but the effects of the
building type were not investigated during its development. Studies that compared
PMV applications in naturally ventilated and air conditioned buildings suggest that
there are differences based on the building type. A number of studies showed that the
observed neutral temperature in air-conditioned buildings differs from that in naturally
ventilated buildings. Human response to conditions in real buildings may be influenced
by a range of complex factors that are not accounted for in the heat balance models.
These can include demographics (gender, age, culture and economic status), context
(building design, building function, season, climate and semantics), environmental
interactions (lighting, acoustics, and indoor air quality) and cognition (attitude,
preference and expectations). Researchers and practitioners believe that non-thermal
factors cannot be dismissed so easily (Brager and de Dear 1998). Studies in Australia
found differences in the neutral temperature of different building types ranging from 1.3
to 1.7°C, and found that PMV predictions for air-conditioned buildings were between
0.8ºC higher and 0.6ºC lower than reported neutral temperatures (de Dear and
Auliciems 1985). Another study found that the neutral temperatures in naturally
ventilated buildings in Bangkok were 2.7°C higher than those of air conditioned spaces
(Busch 1992). Predictions in naturally ventilated buildings were, by comparison,
between 0.6ºC lower and 2.1ºC higher than observed neutral temperatures. A similar
trend with PMV over-predicting neutral temperatures in naturally ventilated buildings
by 3.4ºC, but over-predicting air-conditioned buildings by only 0.8ºC (Bush 1990).
Finally, (de Dear, Leow and Foo 1991) found that PMV under-predicted neutral
temperatures in air-conditioned buildings by 0.2ºC, but over-predicted them in naturally
ventilated buildings by 2.8ºC. From this, it can be concluded that researchers found that
PMV predictions agree with actual thermal sensation better in air-conditioned
buildings, when compared to naturally ventilated buildings.
The PMV model does not directly address the influence of outdoor climate.
However, it was noted above that studies conducted in different parts of the world
reported different neutral temperatures, suggesting that outdoor climate could have an
influence on thermal sensation. A number of recent field studies also suggested that
neutral temperatures differ by climate or season (Cena and de Dear 2001) and (de Dear,
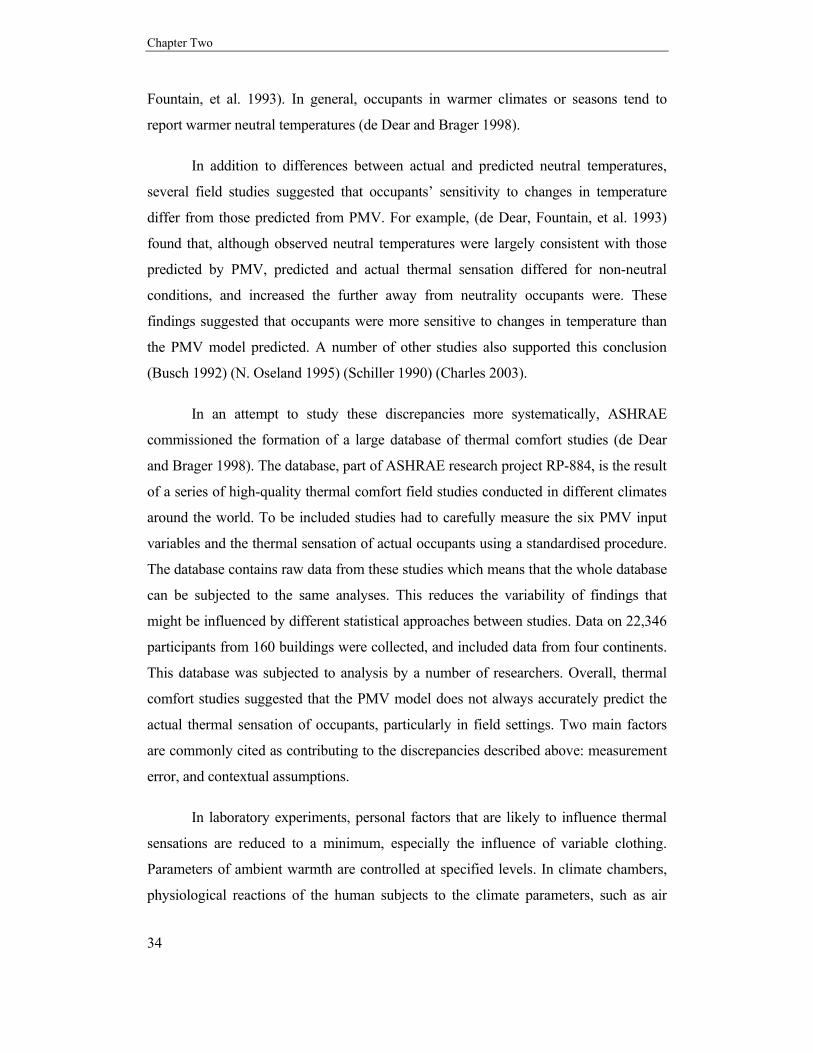
Chapter Two
34
Fountain, et al. 1993). In general, occupants in warmer climates or seasons tend to
report warmer neutral temperatures (de Dear and Brager 1998).
In addition to differences between actual and predicted neutral temperatures,
several field studies suggested that occupants’ sensitivity to changes in temperature
differ from those predicted from PMV. For example, (de Dear, Fountain, et al. 1993)
found that, although observed neutral temperatures were largely consistent with those
predicted by PMV, predicted and actual thermal sensation differed for non-neutral
conditions, and increased the further away from neutrality occupants were. These
findings suggested that occupants were more sensitive to changes in temperature than
the PMV model predicted. A number of other studies also supported this conclusion
(Busch 1992) (N. Oseland 1995) (Schiller 1990) (Charles 2003).
In an attempt to study these discrepancies more systematically, ASHRAE
commissioned the formation of a large database of thermal comfort studies (de Dear
and Brager 1998). The database, part of ASHRAE research project RP-884, is the result
of a series of high-quality thermal comfort field studies conducted in different climates
around the world. To be included studies had to carefully measure the six PMV input
variables and the thermal sensation of actual occupants using a standardised procedure.
The database contains raw data from these studies which means that the whole database
can be subjected to the same analyses. This reduces the variability of findings that
might be influenced by different statistical approaches between studies. Data on 22,346
participants from 160 buildings were collected, and included data from four continents.
This database was subjected to analysis by a number of researchers. Overall, thermal
comfort studies suggested that the PMV model does not always accurately predict the
actual thermal sensation of occupants, particularly in field settings. Two main factors
are commonly cited as contributing to the discrepancies described above: measurement
error, and contextual assumptions.
In laboratory experiments, personal factors that are likely to influence thermal
sensations are reduced to a minimum, especially the influence of variable clothing.
Parameters of ambient warmth are controlled at specified levels. In climate chambers,
physiological reactions of the human subjects to the climate parameters, such as air

Literature Review
temperature, radiant temperature, humidity and air velocity, can be investigated under
controlled conditions.
2.3.2.2 Adaptive model
The problem with a field study is that the measurements of the physical
parameters are not precise and obtaining accuracy is always difficult. Secondly, it is
difficult to generalize from the statistical analysis, because the results from the analysis
of one survey often do not apply to the data from another even in similar circumstances.
An additional problem mentioned is that errors in the input data can give rise to errors
in the relationships predicted by the statistical analysis; this is due to the inaccuracy of
the measurements resulting from a transient environment (Nicol and Humphreys 2002)
The strength of the adaptive approach is that it touches on many topics including
climatology, the design and construction of buildings, the provision and use of thermal
controls, the history and sociology of clothing and the influences of culture together
with human thermal physiology. It, therefore, encompasses all aspects of thermal
comfort studied in the laboratory (Humphreys and Nicol 2007)
Several researchers have developed relationships between thermal sensation and
outdoor temperature as mentioned before. Researchers examined the results of a large
number of field studies from around the world, and developed an equation that related
thermal sensation to mean monthly outdoor temperature, as (M. Humphreys 1978),
(Auliciems 1981) and more recently by (Brager and de Dear 2001), using the ASHRAE
RP-884 database. In all of these cases, mean monthly outdoor temperature was found to
be a significant predictor of occupants’ thermal sensation. In order for the field studies
to have a general applicability, the individual results should be combined to produce
general rules (F. Nicol 1993).
Behavioural adaptation refers to the actions that occupants might take to achieve
comfortable thermal conditions. These behaviours include opening windows, adjusting
blinds or shading devices, operating fans, adjusting thermostats or blocking ventilation
outlets, changing clothing, moving to a different room, modifying activity levels, and
even consuming hot or cold food and drinks. (Baker and Standeven 1996) observed
office occupants in Greece in order to investigate their behavioural adaptations. During

Chapter Two
36
863 observed hours, they recorded 273 adjustments to the environmental aspects of the
room, and 62 clothing adjustments. Occupants also reported that the outdoor
temperature influenced their choice of clothing for the day. In addition to behavioural
adjustments, occupants might also modify their expectations and attitudes towards the
thermal environment. This psychological adaptation is argued to be influenced by
culture, social norms, and previous experience, and is likely to be context dependent
(Baker and Standeven 1996) (N. Oseland 1995).
2.3.3 Importance of comfort models
User satisfaction is a main issue that should be considered while designing
buildings, and of the main effective parameters on the user satisfaction is the thermal
conditions. (Griffiths 1990) found that the ‘right temperature’ is one of the things
people considered most important in buildings.
The issue is to identify desirable indoor air temperature and, thus, determine
building design temperature which, in turn, implies rates of energy consumption
(Auliciems 1981). A decrease in the outdoor-indoor temperature difference will
decrease the usage of heating or cooling machines, thus leading to energy consumption.
Comfort models are also used in the development or planning of air
conditioning systems, and the development of standards and design guidelines that
could be used to promote the usage of new energy efficient building concepts and
technologies, especially those featuring natural ventilation and passive cooling
techniques (Gossauer and Wagner 2007). The implication of a single temperature for
energy consumption is that a building may need both heating and cooling at different
times of the year. A variable temperature standard, as implemented in the new
ASHRAE standard-55 (2004) for free running buildings, helps in energy conservation.
2.4 COMFORT STUDIES
The physical conditions for voting vary from carefully controlled experiments in
laboratory studies to the naturally encountered conditions in field studies. In both cases,
the verbal scales are presented to subjects who have to cast votes to describe their

Literature Review
particular state of the thermal environment. The purpose of these studies is to define the
range of conditions that are acceptable by the subjects involved.
Field studies are the principle research method of obtaining adaptive models.
This methodology is fully described here, where people are asked for their response to
their thermal environment. The response is recorded while the thermal environment is
measured simultaneously. Notes on clothing and activity may be taken from which the
thermal insulation of the ensembles and the metabolic rates of people can be estimated.
The opening or closing of windows, the raising or lowering of blinds, and the switching
on or off of fans may be noted, together with any other actions that people take to
ensure their comfort. Usually no attempt is made by the researcher to control the
environment, while in some cases the interventions are made to investigate the subjects’
reactions. The researcher in such surveys has often been a local person, or someone
with an interest in that particular climate. From such field studies an understanding has
developed of how people achieve thermal comfort in daily life, and what environments
people typically create or accept in different cultures and climates (Humphreys and
Nicol 2007). The interest is, generally, in finding a range of temperatures and other
environmental variables that represent the comfort conditions for the people of the
studied locality. Because the aim is to obtain a typical reaction to conditions, there is no
attempt to interfere with the normal conditions or modes of dress, in order to study
people in their normal life conditions to assess the full complexity of the situation (F.
Nicol 1993). The setting of the field study is discussed here in details.
2.4.1 The Respondents
People who accept the involvement in a field study of thermal comfort are the
occupants of the space within their normal surroundings; this is only intruded upon
when measurements are taken or when questionnaires are filled in. The method of
taking measurements and the time of distributing and filling out the questionnaire
determine the intensity of interference in the normal life of the occupants. Most studies
involved occupants who led a lightly active everyday life (M. A. Humphreys 1976).
The subjects need to be briefed on the aims and methods of the survey, and they need to
be clear about what is expected of them.

Chapter Two
38
In choosing a sample, it is important to choose people familiar with their
surroundings and the climate they are living in. The sample should represent the
diversity in the population in such things as sex, age and bodily dimensions. There are
two basic forms of survey sampling: the transverse and the longitudinal sampling. The
transverse sampling allows the whole population to give a single or small number of
comfort assessments. In the longitudinal sampling, the subject gives more than one
assessment over a long time period providing a large amount of data (F. Nicol 1993).
2.4.2 Time Sampling
Time plays an important part in the adaptive process. Choosing the time of day
and time of year at which a survey is carried out is an important issue. The human
response to the conditions at a specific moment depends on one’s experience of
conditions over the previous period, in other words on one’s thermal history. People can
adapt to the change of conditions in about a week, therefore, the survey should not take
too long to complete. The recommendation is to keep the time sampling as short as it
could be, no longer than two weeks. Also, it is recommended to keep surveys
throughout the day and evening so that time series effects in the responses can be
investigated.
Avoiding any interference in the normal conditions of the space makes the field
study lose some of the advantages of the planned experiments. Although this is the
trend in most field studies, some of them, when studying people in air conditioned
spaces, controlled the temperature in order to cause some variations in the thermal
conditions. By altering the temperature around the operating level, they were able to
obtain a variation of response sufficient for analysis (M. A. Humphreys 1976).
2.4.3 The Measurement of Physical Parameters
In most cases of field studies and often for simplicity, only the air temperature is
measured. If the measuring device is not protected from the effect of radiation, so the
readings are to some extent affected by the mean radiant temperature of the surrounding
surfaces. While in some other studies, the air temperature, the mean radiant
temperature, the relative humidity and the air velocity are measured, allowing the
calculation of any composite thermal index depending on these variables. The accuracy

Literature Review
of the physical measurement should be ±0.5 K for air temperatures. If the globe
temperature is to be measured and used to evaluate the mean radiant temperature, then
the accuracy of the globe and air temperature measurements needs to be ±0.2 K (F.
Nicol 1993).
2.4.4 The measurement of personal parameters
The subjective sensation of warmth, or thermal comfort, of the subjects is
traditionally measured using the seven point scale as described in 2.4.5. Using a
descriptive scale as the ASHRAE scale or Bedford scale may cause the danger of
overlapping with the cultural use of words. This can be overcome by using a scale of
preference. The most commonly used is the three point preference scale, where
respondents are asked about what they prefer, and the answer is sorted in three
categories (F. Nicol 1993).
Two other personal parameters affect the thermal sensation of the subjects
involved in a field study, their clothing and their metabolic rate. As for the clothing, it is
not controlled in the field studies, and it can be recorded in two different manners. The
first is by describing the overall suits worn by the respondent, and the second is by
recording each item. This may help in determining the clo value, which gives an
indication of the way people have adjusted to the prevailing temperature, and could also
be used in determining the respondent’s thermal state using the PMV model.
The metabolic rate varies according to the physical activity of the respondent,
but, as mentioned before, most of the field studies involved occupants who led a lightly
active everyday life, where the metabolic rate was given as a general description of the
activity of the respondents. The complete record of activity requires both the continuous
supervision of the respondent and the recording of oxygen consumption which is
normally not applicable (M. A. Humphreys 1976).
2.4.5 Scaling
The estimation of comfort levels has been largely based upon the responses on
verbal scales of sensation, where the verbal scales contain discrete thermal sensations to

Chapter Two
40
describe the environment and which have been assigned sequential numerical values.
The verbal scales are assumed to be ratio scales (Auliciems 1981).
As noted by (M. A. Humphreys 1976), the number of steps per scale ranged
from three to twenty five, but the most common used verbal scales are the ASHRAE
scale (1968) and the Bedford scale (1936). Both are symmetrical scales with seven
categories as shown in Table 4. The Bedford scale tends to confuse sensation and
comfort as it is a combined estimate of warmth and comfort compared to the ASHRAE
scale; this appears to be considered negligible by researchers as stated by (Auliciems
1981) depending on the relations in Table 1, while (M. A. Humphreys 1976) criticized
this combination based on the fact that the relation between warmth and comfort is not
necessarily constant.
The scales are introduced to the subjects of a thermal field study in the form of a
question asking about either their thermal state as “How do you feel at the moment?” or
asking about the state of the space as “How do you find the space temperature”. The
question is normally one of a structured series of questions covering various aspects of
the environment.
2.4.6 Survey design
Two basic types of sampling techniques are used, the “transverse” and the
“longitudinal” types. The first type allows a larger number of subjects to contribute to
the study at the same time, as each respondent gives one assessment of the thermal
environment. This type indicates the extent of variation among individuals’ responses,
which gives a good estimation of the population. The inclusion of a large number of
subjects (representing the whole or most of the population) results in avoiding any bias
in the results. This also means that the intrusion of the privacy of the respondents will
be kept to a minimum. The problem with such a method appears when conducting the
survey for a short time (e.g. one day), then the variety of the environmental variables
and conditions surrounding the subjects is limited, and may not represent the normal
life conditions faced by the population. To overcome this defect it is better to conduct
the survey over a number of days or even weeks (F. Nicol 1993).

Literature Review
The longitudinal sampling ends in a small number of observations, due to the
number of instruments afforded or the number of volunteers mustered. One problem is
that subjects are required to exert a certain amount of dedication, particularly if the
survey is extended beyond the subjects’ working hours. The small number of sampling
may lead to a sampling bias in the results or the sample may not be typical of the whole.
However, such a way of sampling allows insight into the effect of time series on
comfort (F. Nicol 1993).
Table 4: The “ASHRAE” scale and the “Bedford” scale of warmth, with their categories being numbered as used in many field studies
ASHRAE scale Bedford Scale Common
numerical coding
Hot Much too warm +3
Warm Too warm +2
Slightly warm Comfortably
warm +1
Neutral Comfortable 0
Slightly cool Comfortably cool -1
Cool Too cool -2
Cold Much too cool -3
2.4.7 Data analysis
The method of evaluating the thermal conditions of the space is done by
correlating the subjective vote of the occupants to the measured climate parameters. In
the standards, the base of the commonly used models is the regression analysis, while in

Chapter Two
42
practice and research the Probit analysis is another method that is used for analysis (M.
A. Humphreys 1976)
Regression analysis is one of the methods used to analyze the data gathered
from a thermal field study; the method is valid based on two main assumptions as
indicated by (Auliciems 1981). The first assumption is that there is an equal increase in
the thermal sensation corresponding to an equal increase in the thermal stimuli; the
second is that transformation of subjective votes of thermal sensation into real numbers
is valid. This leads to treating the verbal scales, used in the field study, as ratio scales,
which means that the thermal sensation is treated as a continuous variable.
This method allows the prediction of the thermal sensation, as it is considered a
dependant variable based upon the independent variable “the indoor temperature” in
thermal field studies, which allows the calculation of the neutral temperature. This is
done by using the equation of the correlation between the thermal sensations and the
indoor temperature (M. A. Humphreys 1976). The magnitude of correlation coefficients
varies considerably between studies depending upon several factors which include the
number of sensation steps used, the precision of the physical measurements, the
variability between the subjects and the sample size. The slope of the regression line
depends on the size of the correlation coefficient. The procedures employed in
laboratory work are likely to eliminate a variety of noise factors, producing higher
values of correlation coefficients, which means steeper slopes. It is noted that in
laboratory experiments the multiple correlation coefficient may approach values
between r = 0.70 and r = 0.85, while in the field these values usually decrease to reach a
value between r = 0.30 and r = 0.55. Thus typical regression coefficients using a 7 point
verbal scale for laboratory work are between b = 0.30 and b = 0.35, and for field studies
between b = 0.15 and b = 0.25, depending mainly on the population and circumstances
of the survey (McIntyre 1978).
The second method of analysis is the transition boundaries known as Probit
analysis, which was first applied to thermal sensation by Chrenko (1955). This method
finds the proportions of comfort assessments which are on the several response
categories over the range of environments encountered in the study. From these
proportions the neutral temperature can be calculated and used to estimate the variation

Literature Review
in the responses among the population in the case of a transverse study, or of individual
consistency in the case of a longitudinal survey.
2.4.8 Classification of field studies
(Brager and de Dear 1998) classified thermal comfort field studies into three
main groups based on the standard of the instrumentation used for recording the
different indoor physical parameters (air temperature, radiant temperature, air velocity
and relative humidity), as well as on the procedures used. The classification is as
follows:
Class (i) represents the study in which all the sensors and procedures are in 100
percent compliance with the specifications in ASHRAE 55 (ASHRAE 2004) . In this
type of field study, the measurements should be taken at three heights above the floor
level with laboratory grade instrumentation. This procedure allows a careful
examination of the effects of non-uniformities in the environment as well as a
comparison between buildings.
Class (ii) indicates studies where all the physical environmental variables
necessary for calculating the PMV and the PPD indices are measured and collected at
the same time and place when and where the thermal questionnaire are administered,
most likely at one height. This allows an assessment of the impact of behavioural
adjustment and control on subjective responses.
Class (iii) is based on simple measurements of indoor temperature and possibly
relative humidity at one height above the floor. The physical measurements can
possibly be asynchronous with subjective measurements usually represented by a
questionnaire with rating scales. This class offers the widest range of published data.
Another classification by (F. Nicol 1993), is also divided into three types as
follows:
Level (i): it is formed of simple measurements of temperature in the occupied
space, and no subjective response is needed in this case.

Chapter Two
44
Level (ii): where measurements of the thermal environment is accompanied by
the subjective response to it.
Level (iii): in which all factors needed to calculate the heat exchange are
measured together with the subjective response.
2.4.9 Strengths and weaknesses of field studies
The freedom of the respondents and their uncontrolled environments are at once
the strengths and weaknesses of the field study. The strength of such conditions is that
the assessments represent the feelings of daily life, and not a conditional status for a
period of time as in the climate chamber studies. Also the process of adaptation to the
everyday variations could be observed which is not obtainable in case of climate
chambers.
The weakness is that this condition of freedom of the respondents and the
environmental conditions can not allow the precise measurement of the factors affecting
the heat exchange between the respondents and their environment. This makes it
difficult to compare the results from one study to the predictions based on the heat
transfer theory. But this could be overcome by comparing the results of many field
studies when combining their results together.
Also if insufficient attention has been paid to the presentation of specific
questions asked for the respondents, for example it is not clear if significant differences
are obtained when the subjects are asked to interpret their own thermal states, or
alternatively to comment on the state of the environment by response on the same
subjective scale. Perhaps the least satisfactory of all is the insufficient detail given to
sampling procedures, in view of the repeatedly demonstrated large variability between
and within people, little reliance can be placed upon the recommendations of specific
thermal level, or comparisons between groups of people and regions of the world if
small samples have been employed.

Literature Review
2.5 CONCLUSION
Field studies showed the diversity of the environments that populations find
comfortable to be greater than can readily be explained by current heat balance models.
With the strong likelihood of global warming, and in an era of increasingly expensive
fuel, there is a powerful incentive to reduce energy-use in buildings. If field studies
guided the formulation of standards of thermal comfort in buildings, consumption of
energy for heating and cooling could be reduced without sacrificing comfort or well
being.
Fanger’s PMV model combined four physical variables (air temperature, air
velocity, mean radiant temperature, and relative humidity), and two personal variables
(clothing insulation and activity level) into an index that can be used to predict the
average thermal sensation of a large group of people in a space. The PMV model is not
always a good predictor of actual thermal sensation, particularly in field study settings.
Discrepancies between actual and predicted neutral temperatures reflect the difficulties
inherent in obtaining accurate measures of clothing insulation and metabolic rate. In
most practical settings, poor estimations of these two variables are likely to reduce the
accuracy of PMV predictions. Bias in PMV predictions varies by context, and is more
accurate in air-conditioned buildings than in naturally ventilated ones, in part because of
the influence of outdoor temperature and opportunities for adaptation. The most
appropriate method allowing the deduction of adaptive comfort models is field studies.
The use of several field studies allowed the production of the adaptive comfort model,
implemented in the ASHRAE 55 (2004) standard, which can be used as an alternative
method in the design and evaluation of free running buildings.

Chapter Two
46

Objectives and methodology
CHAPTER ONE RESEARCH OVERVIEW
CHAPTER TWO LITERATURE REVIEW
CHAPTER THREE OBJECTIVES AND METHODOLOGY
CHAPTER FOUR DATA ANALYSIS
CHAPTER FIVE DISCUSSION
CHAPTER SIX CONCLUSION

Chapter Three
48

Objectives and methodology
CHAPTER THREE OBJECTIVES AND METHODOLOGY
In response to the newly implemented “adaptive comfort model” in the
ASHRAE standard 55-2004, a field survey was carried out in Cairo, Egypt, a hot dry
climate, during the seasons of autumn 2007, spring 2008, autumn 2008 and spring
2009.Three university buildings were chosen to represent the main types of universities
in Cairo. In terms of thermal environment, two of them were naturally ventilated and
the third was a mixed mode building.
This chapter describes the design of the field study, and clarifies the objectives
and methodology of the study. The buildings surveyed are presented in this chapter.
3.1 OBJECTIVES
The intention of the proposed fieldwork was
3.1.1 Observation and specification of the different thermal environments
within each building in order to investigate the thermal characteristics of the
indoor environment within each of the selected buildings:
This part targets the investigation of the effect of design requirements on the
thermal environment variability in each of the selected buildings. In order to satisfy the
different functional requirements within the same building, spaces may differ in their
area or use, thereby affecting the indoor thermal environment.
The indoor thermal environment treatment might depend on passive strategies
as natural ventilation or active strategies involving different types of air conditioning.
The study investigated the different types of treatment applied in each building and
categorized the spaces according to the governing control strategy in each, comparing
naturally ventilated spaces to mixed mode spaces.
3.1.2 Determination of the comfortable temperatures and the acceptable
environments as indicated by the occupants, and investigation of the effect of
different indoor thermal environments within and between spaces on the
occupants’ comfort and satisfaction:

Chapter Three
50
The scope, here , was to assess the indoor thermal environment based on the
feedback from the occupants through their subjective votes of thermal sensation,
preference and acceptability, together with their votes of satisfaction regarding the
indoor thermal environment in variable zones in the same space and even in different
spaces within the same building. The effect of different thermal control strategies that
might be applied in different spaces within the same building on the comfort perception
was also assessed.
The purpose was to assess whether there was a difference in the occupants’
experience and expectations regarding different thermal conditions and different
technologies within and between different spaces within the same building. This
allowed the comparison of the outcome due to different buildings, where they
incorporated different circumstantial restraints.
The aim was to determine the temperature range that satisfied the majority of
the occupants, as well as their degree of acceptance of different thermal indoor
conditions; and to determine the influence of different control strategies on the
occupants’ response, indicating the influence on the adaptive opportunities and the
impact on defining comfort and satisfaction.
3.1.3 Characterization of the main physical and psychological factors
influencing thermal comfort and satisfaction, quantification of the effect of the
indoor/outdoor environments on the characteristics of these factors:
The indoor thermal environment affects occupant’s reactions; therefore, the
purpose of this part was to determine the impact of the indoor thermal environment on
the adaptive behaviour, together with the effect of these behaviours on the voting
process. The aim was to observe and record to what extent people interact and in what
ways they perceive and adapt to their surroundings.
Behavioural adjustment is classified into three main sub-categories (refer to
2.3.1.2). The first is related to the personal adjustment to the surroundings, the second
defines the technological and environmental adjustments that are available, for example
opening and closing of windows or changing the set points of air conditioning if
possible. The third concerns cultural and social adjustments as adjusting clothing or
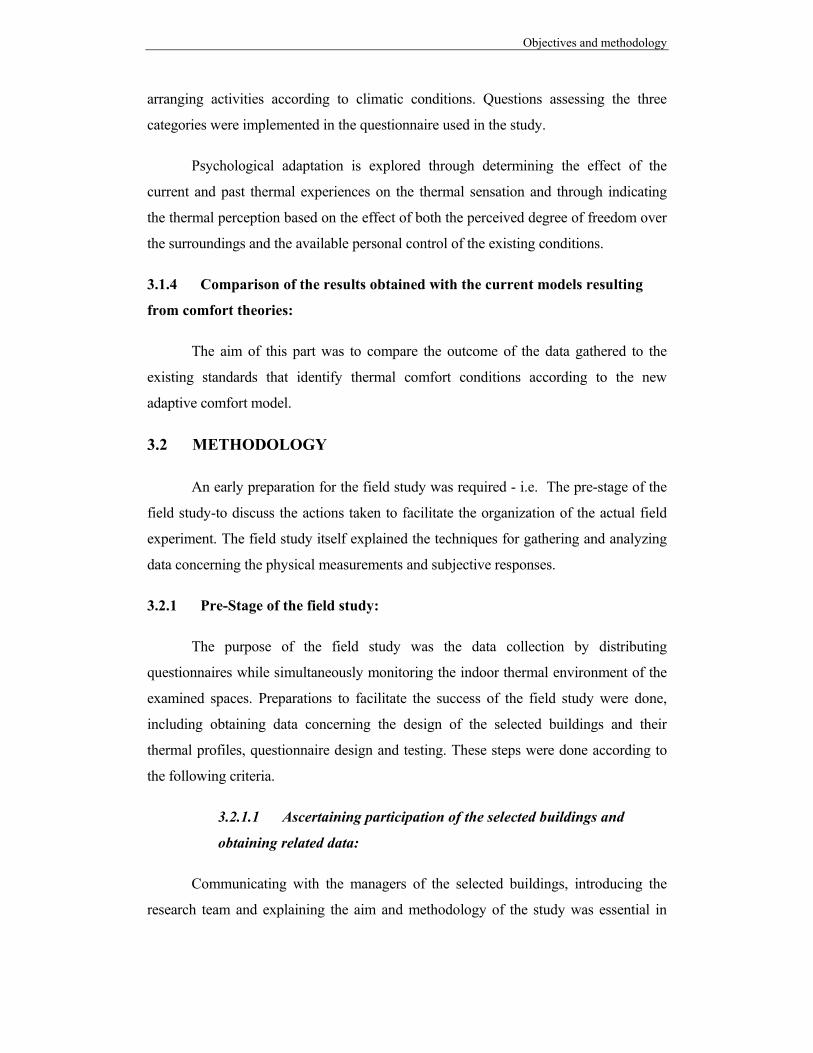
Objectives and methodology
arranging activities according to climatic conditions. Questions assessing the three
categories were implemented in the questionnaire used in the study.
Psychological adaptation is explored through determining the effect of the
current and past thermal experiences on the thermal sensation and through indicating
the thermal perception based on the effect of both the perceived degree of freedom over
the surroundings and the available personal control of the existing conditions.
3.1.4 Comparison of the results obtained with the current models resulting
from comfort theories:
The aim of this part was to compare the outcome of the data gathered to the
existing standards that identify thermal comfort conditions according to the new
adaptive comfort model.
3.2 METHODOLOGY
An early preparation for the field study was required - i.e. The pre-stage of the
field study-to discuss the actions taken to facilitate the organization of the actual field
experiment. The field study itself explained the techniques for gathering and analyzing
data concerning the physical measurements and subjective responses.
3.2.1 Pre-Stage of the field study:
The purpose of the field study was the data collection by distributing
questionnaires while simultaneously monitoring the indoor thermal environment of the
examined spaces. Preparations to facilitate the success of the field study were done,
including obtaining data concerning the design of the selected buildings and their
thermal profiles, questionnaire design and testing. These steps were done according to
the following criteria.
3.2.1.1 Ascertaining participation of the selected buildings and
obtaining related data:
Communicating with the managers of the selected buildings, introducing the
research team and explaining the aim and methodology of the study was essential in

Chapter Three
52
order to finalize the selections of buildings and to discover their responses and
willingness to participate in the study. This resulted in the participation of three
buildings out of five buildings.
After finalizing the selection of buildings, during this stage, the architectural
drawings for the selected buildings were obtained. The buildings were carefully studied
in their existing conditions and within their actual contextual environments.
Interviews with the buildings’ designer were arranged to obtain data concerning
the general architectural concept of the buildings together with the architecture
drawings of the buildings. The designers’ opinions concerning the use of air
conditioning or passive techniques were debated and their impact on the design features
was pointed out. The designers’ comments on the design of the spaces and his opinion
about their thermal environments were considered through the process of sampling.
When the designer was not available, such as in the case with old buildings, the
interview was conducted with the building’s managers and those responsible for the
building services.
3.2.1.2 Site visits, data acquisition and validation:
Site visits to the different buildings were done after obtaining the architectural
drawings (mainly the plans of different building floors) to ensure the accuracy of the
data obtained and at the same time to indicate the original setting on the drawings and
to modify any changes within the buildings, just to form an as built set of drawings.
Different thermal concepts were indicated and oriented onto the drawings. The
aim was to produce a set of drawings which included the architectural and mechanical
features that might affect the indoor thermal environments of the spaces in order to aid
in the process of selection.
Although the main aim was to investigate the real site, it was also important to
familiarize with the different buildings and the spaces that will be examined.

Objectives and methodology
3.2.1.3 Investigating the indoor thermal profile of the targeted
spaces:
A preliminary study of the spaces that were selected in each building was done
in order to specify the characteristics of the indoor thermal environment. That has a
reflection when placing the measuring instruments in the real study and it showed the
critical zones within spaces. For a minimum of three days, throughout the working
hours of the building, the spaces were monitored using the same instruments that were
used in the field study together with an internal weather station obtained from the
Housing and Building Research Center (HBRC) of Egypt. Air temperature and relative
humidity were measured using data loggers (HOBO of the company Onset) and, on
some days of the survey, a Nomad portable weather station (Casella) was used to verify
the data from the data loggers as a method of calibration. Moreover, the ten data loggers
used were calibrated with each other to point out the differences between their records;
the differences did not exceed 0.5 degree for temperature and 5% for relative humidity.
The data loggers measurement range for temperature as specified by the
manufacturing company is -20° to 70°C, (accuracy: ±0.4°@ 25°C), and for relative
humidity 25% to 95% RH, (accuracy: ±3.5% over the whole range). The response time
of the data loggers in air flow of 1m/s is 6 minutes for 90% temperature and 1 minute
for 90% relative humidity. The data logger is shown in Figure 11.
Figure 11: The data loggers of the company Onset used in the field studies

Chapter Three
54
Using the Nomad portable weather station with accuracy: ±0.3° C@ 0°C and
±55° C@ 50°C measurement for temperature and accuracy: ±3 % for relative humidity
revealed that the difference between the air temperature and the radiant air temperature
did not exceed one degree Celsius. This justified considering the air temperature
measured by the data loggers as the operative temperature, as operative temperature is
approximated by the simple average of the air temperature and mean radiant
temperature. In addition, the measurements showed that the air velocity didn’t exceed
0.06 m/sec in all the spaces even when using ceiling fans and that was why the air
velocity was not measured in the main field study. The data loggers were distributed
over the whole space and were placed on the working plane with a stand to adjust their
heights to the same level as the students’ heads.
3.2.1.4 Questionnaire design and its examination:
Questionnaires used previously in other field studies (Wagner, et al. 2006)
influenced the design of the questionnaire adopted in this study. The questionnaire
design followed several steps starting with the compilation of a six-page first draft. The
target of the questionnaire was to obtain information about the respondents’
expectations and experiences before their entry to the building, their comfort votes for
the time of the survey, their psychological perception of the degree of freedom
available, and the physical actions done to accommodate themselves to the indoor
climate. The method of obtaining such data is discussed below:
To understand the norms of thermal quality the respondents were accustomed
to, they were asked to answer questions about experiences and expectations, questions
assessing their psychological adaptation methods and inquiring about their daily routine
that focused on the usage of air conditioning and heaters, in addition to the type of
transportation used. The question asking about the usage of air conditions was deleted
in later versions of the questionnaire as it is not applicable in the case of naturally
ventilated buildings. In addition, the respondents were asked about their expectations
of the outdoor climate in the day of the survey together with their expectations
regarding the indoor climate of the space where the survey was taking place.

Objectives and methodology
In comfort votes, semantic differential scales are the most popular scales and are
recommend (F. Nicol 1993). This type of scaling allows for an easy conversion of the
results into interval numerical scales. In the case of assessing thermal sensation the
seven point scale, 3 = very warm, 2 = warm, 1= slightly warm, 0 = temperate, -
1=slightly cool, -2 = cool and -3 very cool, was used. The semantics differed from that
in the ASHRAE scale for ease of translation. The semantics of the ASHRAE original
scale is not translated easily. “Neutral”, existing on the ASHRAE Scale, was replaced
by temperate. In addition, the two extremes of the scale “hot” and “cold” were avoided,
and semantics expressing the graduation of being cool or warm were used.The Arabic
language does not contain two different words for cool versus cold or for warm versus
hot, which made it more practical to use the semantics for slightly cool, cool and very
cool as well as using slightly warm, warm and very warm.
The thermal sensation was assessed using a seven-point scale. (McIntyre 1978)
pointed out that the seven point scale was in line with common practice of many
psychological scales. Moreover, it was the most common in this field, which means that
it would be easy to compare to the results of other field studies in this area of research.
The traditional language for comfort questionnaires is English, and translation to
other languages is not easy as the terms used may have different meanings than the ones
used in English language questionnaires. In order to overcome such issues and to
examine the clarity of semantics, the questionnaire was tested in Karlsruhe on five
people whose mother tongue was Arabic, the native language in Egypt.
The thermal preference was assessed using a five-point scale which is preferable
to a three-point scale. This made occupants much more precise about their selections
and it gave the occupants a wider scale for selection. A question assessing the
acceptance of the thermal environment was also directly asked, with only two answers
provided, “acceptable or not acceptable”. Similar questions were asked to assess the
humidity.
The second part of the questionnaire assessed physical adaptation, through
questions assessing the available options for the occupants to change their indoor

Chapter Three
56
climate, and their degree of satisfaction with the perceived degree of freedom in order
to change their indoor environments.
A question assessing the degree of satisfaction was answered on a six-point
scale that differentiated between being satisfied or not. There was no intermediate
neutral point; the respondent was either "satisfied" or "unsatisfied" on three different
levels. Other questions were related to environmental adaptation i.e. opening/closing
windows and doors, etc. and personal adaptation i.e. changing clothes, drinking and
eating.
Another question asking about the clothes worn by the subjects was included.
Social customs and cultural needs, together with the seasonal pattern of outdoor
weather conditions, are the main factors affecting the type of ensembles and garments
worn by people throughout their lives. The database adopted in Appendix B, lacks
values corresponding to items of clothing used in Egypt especially the exact values for
the veil (Hijab) and Abaya. Even a study concerning the clothing area factors of typical
Arabian Gulf ensembles did not provide these values. The veil is mainly made of a
large variety of fabrics and colours used as an Islamic head cover to conceal female
hair. The Abaya is a traditional silk or wool loose cloak, reflecting the female religious
belief, covering the whole body except for the face, palms of hands and toes.
Egyptian female clothing consists basically of three types of attires: (1) Islamic
attire (Abaya); (2) Conservative traditional attire (long dress with long sleeve); (3)
Western style attire (jeans and blouse). Another piece of clothing that is not included in
the standards is a body-hugging long-sleeved top very widely known in Egypt as a
"body" usually worn by females under clothes to hide any visible body parts.
Another shortage in the available resources was the clo value of flip-flop
slippers. Within both seasons of the study some of the males reported wearing flip-
flops-a popular summer footwear- on hot days.
A cover page was designed in order to introduce the research team, the aim of
the study and the instructions on how to complete the questionnaire. It described how
"confidentiality” was reserved and provided contacts for further information to the
respondents. The first version for the cover page is attached in Appendix C. The

Objectives and methodology
translated version is in Appendix D and the used questionnaire is attached in Appendix
E and the translated version is in Appendix F.
After designing the questionnaire, an examination of the outcome was done, to
ensure intelligibility of the semantics forming the questionnaire, as it is mainly adapted
from other questionnaires that were originally formed in different languages.
The examination also helped to determine the average time it took to introduce
it to the occupants and the time required by the occupants to fill it. These were essential
issues that led to some modifications to the questionnaire before the real study.
It was very obvious that the questionnaire was too long as it required from ten to
fifteen minutes to fill, while the students’ breaks between lectures were around twenty
minutes. These results led to the shortening of the questionnaire. The cover page was
not distributed, but it was verbally stated that it was available for those respondents who
were interested in more information. Moreover, some of the questions were excluded
e.g. the questions inquiring about general use of heaters and air conditioning at home.
Questions assessing the air quality, the description of the air quality within the space
and air velocity were omitted as there was not a measured reference quantity for these
parameters. The questions inquiring about physical adaptation and methods of
controlling the space were replaced by the researcher’s observations during his presence
in the place where the subjects were attending their lectures. The list concerning the clo
value was modified to include items such as the veil, Abaya and body, as well as flip-
flops and other sports foot-wear common in the Egyptian culture.
3.3 FIELD STUDY SETTING
Several field studies to investigate thermal comfort have been carried out; the
data acquired by researchers differed in their details according to two main disciplines,
the information obtained and the measurements done. The descriptions of field studies
according to these two variables were classified into different categories. According to
(Brager and de Dear 1998) a class 3 field study is based on simple physical
measurements of the indoor environment with possibly asynchronous subjective
questionnaires. (F. Nicol 1993) defined a level 3 survey indicating that a number of

Chapter Three
58
subjects provided subjective responses while the surrounding environment was
concurrently measured and which included data on clothing and activity. The following
field study description and explanation followed the attributes of class 3 and level 3
field studies, refer to 2.4.8.
3.3.1 Sampling strategy
This section discusses the sampling strategies used to select the population, the
type of buildings, spaces within each building, and the selection of subjects.
3.3.1.1 Selection of population and their environment
Egypt lies in a hot arid climate; it extends between the northern latitudes of 23º
and 32º and eastern longitudes of 25º and 36º. According to the Köppen Climate
Classification System, Egypt is located within the hot dry climate. Bioclimatic
classifications that were carried out, based on temperatures, humidity and solar heat
gains, for Egypt shows main six regional climates as shown in Figure 12 ( Egyptian
Climatic Authorities 1997). The study was carried on in region number six.
Figure 12: Climatic Classifications for Different Regions in Egypt & Average Summer Conditions ( Egyptian Climatic Authorities 1997)

Objectives and methodology
The selected region represents the Greater Cairo region. The educational
buildings that were selected in this study were universities. The selection of university
buildings is based on the hypothesis that the managers will allow and promote such a
study in their buildings as they are mostly scientists.
Many researchers previously obtained data examining thermal adaptation to the
indoor thermal environments from students (Corgnati, Filippi and Viazzo 2007). Three
universities were surveyed. The main criteria used in the choice of the buildings were
the willingness of the managers to allow the study to be carried out in their premises;
variability of the building age, recently designed verses older buildings and the
distribution of buildings over the Greater Cairo Region. In addition, the design concept
played a role in the selection of the buildings, as passively designed buildings were
selected as well as mixed mode buildings to investigate the different design features
influencing thermal comfort perception. The sample from each university considered
the type of acclimatization used, size and number of floors, population size and their
distribution, and degree of personal control over the environment.
Two of the buildings examined are part of Cairo University and Ain Shams
University campuses. The selected parts are naturally ventilated buildings using ceiling
fans, and they represent the governmental educational buildings in Greater Cairo
Region. The third building is part of the Arab Academy for Science, Technology and
Maritime Transport (AAST) – the Cairo Campus. It represents a private organization
within the same geographical zone which uses air conditioning. The Architectural
Departments in all of the former buildings were the focus of the study, in addition to the
spaces that were used by the employees.
In Cairo University, the Architectural Department building has four floors with
an area of 2225 m2 each. The study focused on the main halls with an area of 1085 m2
each where studios and drawing sections are held, as well as the lecture halls with an
area of 239 m2 each. Figure 13 shows a typical floor plan of the Architecture
Department in Cairo University. The employees occupied other scattered spaces in
different buildings ranging from 30 m2 with two to four persons and up to 100 m2 with
seven to fifteen persons.
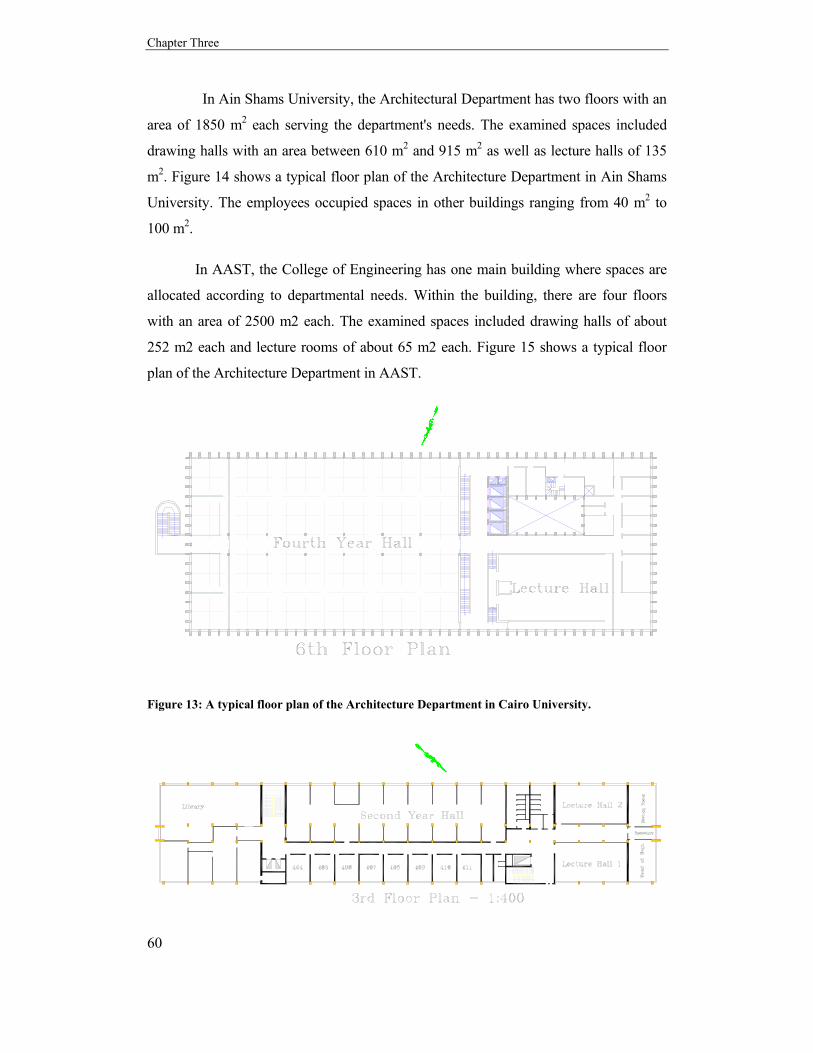
Chapter Three
60
In Ain Shams University, the Architectural Department has two floors with an
area of 1850 m2 each serving the department's needs. The examined spaces included
drawing halls with an area between 610 m2 and 915 m2 as well as lecture halls of 135
m2. Figure 14 shows a typical floor plan of the Architecture Department in Ain Shams
University. The employees occupied spaces in other buildings ranging from 40 m2 to
100 m2.
In AAST, the College of Engineering has one main building where spaces are
allocated according to departmental needs. Within the building, there are four floors
with an area of 2500 m2 each. The examined spaces included drawing halls of about
252 m2 each and lecture rooms of about 65 m2 each. Figure 15 shows a typical floor
plan of the Architecture Department in AAST.
Figure 13: A typical floor plan of the Architecture Department in Cairo University.
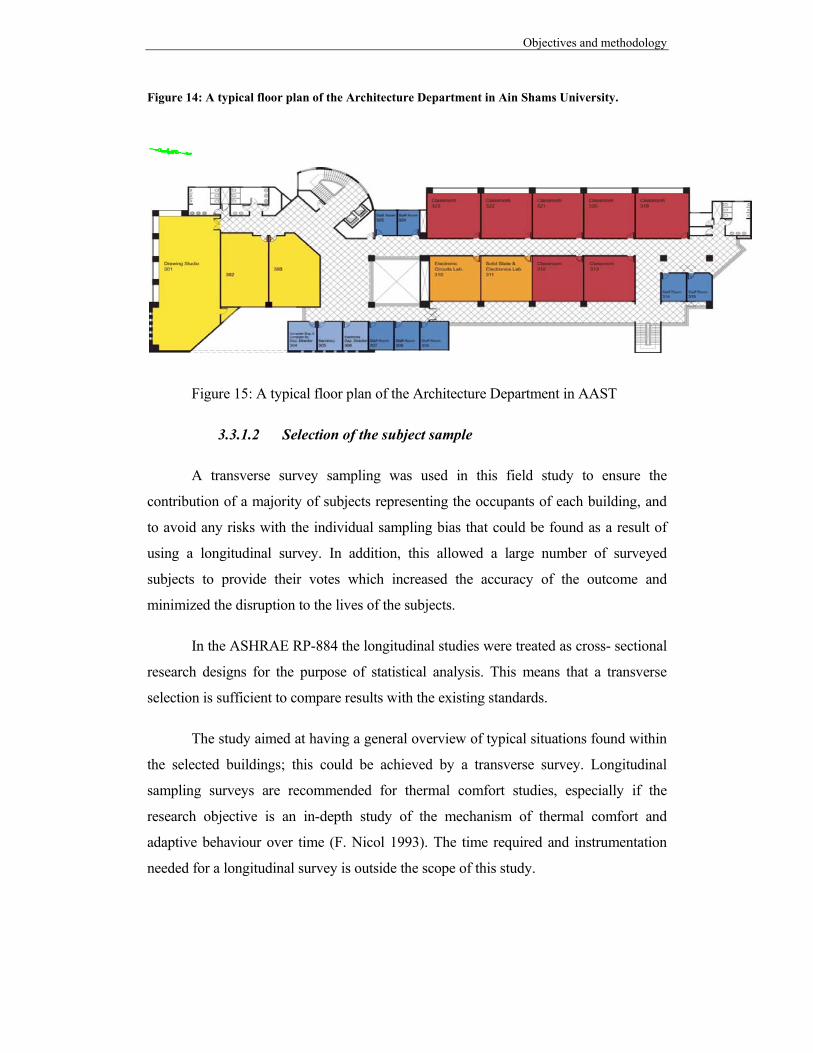
Objectives and methodology
Figure 14: A typical floor plan of the Architecture Department in Ain Shams University.
Figure 15: A typical floor plan of the Architecture Department in AAST
3.3.1.2 Selection of the subject sample
A transverse survey sampling was used in this field study to ensure the
contribution of a majority of subjects representing the occupants of each building, and
to avoid any risks with the individual sampling bias that could be found as a result of
using a longitudinal survey. In addition, this allowed a large number of surveyed
subjects to provide their votes which increased the accuracy of the outcome and
minimized the disruption to the lives of the subjects.
In the ASHRAE RP-884 the longitudinal studies were treated as cross- sectional
research designs for the purpose of statistical analysis. This means that a transverse
selection is sufficient to compare results with the existing standards.
The study aimed at having a general overview of typical situations found within
the selected buildings; this could be achieved by a transverse survey. Longitudinal
sampling surveys are recommended for thermal comfort studies, especially if the
research objective is an in-depth study of the mechanism of thermal comfort and
adaptive behaviour over time (F. Nicol 1993). The time required and instrumentation
needed for a longitudinal survey is outside the scope of this study.

Chapter Three
62
Referring to Nicol’s Handbook for Field Study, the recommended minimum
number for a transverse survey is 100 subjects (F. Nicol 1993), as the number of
subjects represents the same number of observations. This number of subjects was
reached in each building. The number of subjects within each space varied according to
the space size. Spaces with 25 to 50 persons were considered small or medium sized,
and in this case, all the subjects within the space were invited to fill in the questionnaire
at the same time. In large spaces, with more than 50 persons, the researcher also invited
all the subjects to fill in the questionnaire while measuring their surrounding physical
environment.
3.3.1.3 Time sampling
The role of time when conducting the survey was as important as the subject
sampling. The selection of time reflects the experience of the subjects at the period of
filling the questionnaire, as well as the dynamic relationship between the subjects and
their thermal environments. Three strategies governed the time selection in the field
study: concerning the seasons, the days of the week and the timing within the day of the
survey.
The first strategy was the selection of the seasons. Spring and autumn were
selected to represent the extreme conditions within the whole year, as they represent the
coldest and hottest times of the academic year. November and December typified cold
periods and February, March, April and May were the hot period. The study extended
in July where employees were the subjects of the study.
The second strategy was the selection of the days of the week. Humans
expressing their relationship to their thermal environment are affected by their
experience of conditions over the previous period (F. Nicol 1993). This shows that the
response of the subjects during the time of the survey is influenced by their thermal
experience in the past. The study considered the main schedule of the working days
while excluding those following holidays in order to avoid any bias in the data
obtained.
The third strategy was the selection of the time during the survey day. The
survey was carried out over the working hours of the day, three intervals of time were
Objectives and methodology
considered, from 10 to 12 in the morning, from 12 to 2 at noon and from 2 to 4 at the
end of day.
The former strategies dealt with the selection of time to run the survey; the
duration of the surveys is dealt with here. Within the same building the survey did not
extend longer than one week. The time required by the subjects to fill in the
questionnaire was minimized as much as possible, averaging from 10 minutes to a
maximum of 15 minutes.
3.3.2 Thermal environment monitoring
The indoor thermal environment was simultaneously measured during the
distribution of the questionnaire. The subjects were asked to start filling the
questionnaire only if they passed a minimum of 30 minutes in the space. The
measurements characterized the environment by measuring air temperature and relative
humidity. These measurements are related to the comfort assessments in the chapter of
data analysis.
In mixed mode spaces, air handling units were identified and the distribution of
the measuring tools followed the critical zones of the surveyed room. The use of data
loggers “Hobos” had the advantage of little intrusion and interference and allowed the
measurements to take place every 5 minutes. The distribution of measuring tools took
place before the beginning of lectures.
Proper placement of the tools was determined by a pre-test determining the
qualitative patterns in each space. Selection regarding the proximity of windows, doors,
solid corners, centre of the room, and level of the workplace was considered carefully to
ensure the accurate measuring of the conditions in each space in general. Equipments
were placed at a number of places on a horizontal plane at a vertical height of about 0.9
meter when the subjects were seated, and at a height of 1.1 meter when they are
standing. One of these points was at the centre of the room and the others were
indicated according to the previous features. Figure 16 shows the distribution of the
measuring equipments in one of the studied spaces.

Chapter Three
64
Figure 16: The data Loggers distributed over the whole space and their heights adjusted to the level of the students' heads.
Metrological data collected at the local weather station of Cairo were obtained.
The external outdoor air temperature in each of the surveyed buildings was measured
by placing one of the Hobos in the external environment; the aim was to regard any
extreme differences due to the micro climatic conditions and urban heating. Air
temperature and relative humidity were measured using data loggers (HOBO of the
company onset), the measurement range of temperature is -20° to 70°c, and for relative
humidity 5% to 95% RH.
3.3.3 Clothing and clo values
Social customs and cultural needs, together with seasonal pattern of outdoor
weather conditions, are the main factors affecting the type of ensembles and garments
worn by people throughout their lives. The clo values of the garments that are used in
the calculation of the overall clo value are attached in Appendix G.
3.3.4 Questionnaire distribution
Group-administered questionnaires were distributed to students 20 minutes prior
the end of classes in spaces allocated for lectures and studios, where the occupants were
at least one hour within the space prior their voting. In other places, such as employees’
rooms, the subjects were asked to vote after spending at least 30 minutes in the space.

Objectives and methodology
The questionnaires were distributed to the respondents with verbal explanations
and a written statement. After collecting the answered questionnaires, data were
organized at the end of each day, and the data sets were managed on a daily basis for
coordination with the data obtained from the data loggers.
3.3.5 Statistical analysis of the results
According to (F. Nicol 1993) the statistical analysis is the most common way of
analyzing data obtained out of field studies, where the comfort votes are treated as the
dependant variable and the environmental parameters as the independent variable. The
data obtained were analyzed statistically using SPSS (Statistical packages for the Social
Science).
Correlations are inferred; although that will not specify any causal effects, for
considering the correlation statistically significant, significance value should be lower
than 0.05. The Pearson correlation is used to measure the degree and direction of linear
relationship between two variables. This is done in the chapter of the data analysis later
in this work.
The analysis of variance (ANOVA) is a hypothesis testing procedure that is
used to evaluate mean differences between two or more populations. The format for
reporting the results states that the degrees of freedom for between and within
treatments respectively. These values are placed in parentheses immediately following
the symbol F. Next the calculated value for F is reported, followed by probability of
committing a type I error (Gravetter and Wallnau 2004).
The development of formulas that predicted the relation between different
variables was done using regression analysis. Regression analyses, as well as
parametric correlations are suitable to scores measured on interval scales, normally
distributed and have roughly the same variability. This assumption was fulfilled; it
certainly breaks down in the end categories of the comfort scale, which had ranges that
were semi infinite. In most cases, however, the majority of comfort votes were in the
central categories with only a few votes at the extremities.

Chapter Three
66
The chapter of data analysis is mainly based on the previous facts and it shows
the outcome from the data collected.

Studying the Adaptive Comfort Model A Case Study in Arid Climate: Cairo, Egypt
CHAPTER ONE RESEARCH OVERVIEW
CHAPTER TWO LITERATURE REVIEW
CHAPTER THREE OBJECTIVES AND METHODOLOGY
CHAPTER FOUR DATA ANALYSIS
CHAPTER FIVE DISCUSSION
CHAPTER SIX CONCLUSION


Studying the Adaptive Comfort Model A Case Study in Arid Climate: Cairo, Egypt
69
CHAPTER FOUR DATA ANALYSIS
This chapter presents the results of the four field surveys’ data analysis. The
thermal environment’s characteristics and their impact on comfort votes are studied. A
comparison of the outcome from the actual field surveys to the adaptive comfort model
is shown. The adaptive behaviour and its impact on comfort votes are discussed. The
data analysis is mainly divided into two sections; the first section compares the outcome
from the naturally ventilated buildings to the outcome from the mixed mode buildings;
the second section focuses on the calculation of neutral temperature from naturally
ventilated buildings and mixed mode buildings.
4.4 FREQUENCY OF VOTES AND THEIR DISTRIBUTION
The days included in the study and the frequency of votes on each day, for both
building types and across the four seasons of the study, are shown in Figure 17. The
study included a total number of 48 surveyed days, 27 of them had more than 50 votes
and the rest, 21 days, had less than 50 votes each. The buildings, included in the study,
were of two types regarding the control of the internal thermal conditions; Cairo and
Ain Shams are naturally ventilated buildings, and AAST is a mixed mode building.
The months included in the study were February, March, April, May, July,
November and December. The votes in July came from employees of the buildings; in
the other months, both employees and students participated in the study. Figure 18
shows the distribution of votes according to different spaces for all days of the study
across the four seasons included in the study.
The study conducted in autumn 2007 focused on students only; while in spring
2008, the study included both employees and students who participated on separate
days. Studies conducted during the following two seasons allowed students and
employees to participate on the same days, making it possible to compare different

Chapter Four
70
types of users experiencing the same indoor thermal conditions, but having different
methods of adaptations.
Figure 17: The days included in the study and frequency of votes on each day for both building types across the four seasons of the study, (N.V.) stands for naturally ventilated buildings and (M.M.) stands for mixed mode buildings
Figure 18: The distribution of votes according to different space types on all days of the study
46
153
6356
34
91
2334 30
63
16
72
40
116
37 31
70
27
211
111
6068
106
37
97
31 3139
86
125
94110
5166
51
123134
5668
3333 36
75
93
46 40 4130
0
50
100
150
200
250
06.11.07
07.11.07
11.11.07
12.11.07
14.11.07
19.11.07
21.11.07
22.11.07
09.12.07
18.03.08
26.03.08
07.04.08
23.04.08
05.05.08
06.05.08
07.05.08
26.05.08
06.07.08
07.07.08
08.07.08
10.07.08
15.07.08
04.11.08
05.11.08
09.11.08
10.11.08
11.11.08
16.11.08
17.11.08
19.11.08
01.12.08
15.12.08
16.12.08
16.02.09
18.02.09
22.02.09
23.02.09
24.02.09
08.03.09
16.03.09
25.03.09
30.03.09
31.03.09
01.04.09
13.04.09
14.04.09
03.05.09
13.05.09
Date Date Date Date
Num
ber o
f votes
Cairo (N.V.)
Ain Shams (N.V.)
AAST (M.M)

Data Analysis
71
Table 5: The distribution of votes on each day over the four seasons of the study
Season Date Space Number of votes
Autumn 2007 06.11.07 Cairo 46 07.11.07 Cairo 153 11.11.07 Ain Shams 211 12.11.07 Ain Shams 111 14.11.07 Ain Shams 60 19.11.07 AAST 68 21.11.07 AAST 33 22.11.07 AAST 33 09.12.07 Cairo 63
Spring 2008 18.03.08 Cairo 56
26.03.08 Ain Shams 68 07.04.08 Cairo 34 23.04.08 Ain Shams 106 05.05.08 Cairo 91 06.05.08 Ain Shams 37 07.05.08 Ain Shams 97 26.05.08 AAST 36 06.07.08 Cairo 23 07.07.08 Ain Shams 31 08.07.08 Cairo 34 10.07.08 Ain Shams 31 15.07.08 Cairo 30
Autumn 2008 04.11.08 Ain Shams 39
05.11.08 Ain Shams 86 09.11.08 Ain Shams 125 10.11.08 AAST 75 11.11.08 Cairo 63 16.11.08 Ain Shams 94 17.11.08 AAST 93 19.11.08 Cairo 16 01.12.08 Ain Shams 110 15.12.08 Cairo 72 16.12.08 Ain Shams 51
Spring 2009 16.02.09 Cairo 40
18.02.09 AAST 46 22.02.09 Ain Shams 66 23.02.09 AAST 40 24.02.09 Cairo 116 08.03.09 AAST 41 16.03.09 Cairo 37 25.03.09 Ain Shams 51 30.03.09 Ain Shams 123 31.03.09 Cairo 31 01.04.09 AAST 30 13.04.09 Ain Shams 134 14.04.09 Cairo 70 03.05.09 Ain Shams 56 13.05.09 Cairo 27

Chapter Four
72
The number of votes on each day of the field studies, over the four seasons is
clarified in Table 5 . The study covered four seasons, autumn 2007, spring 2008,
autumn 2008 and spring 2009. The number of votes in autumn 2007 was 778. The
number of votes in spring 2008 was 674. The number of votes in autumn 2008 was 824
and the number of votes in spring 2009 was 908. The resulting number of votes was
3184, where 2689 votes represented the naturally ventilated spaces and 495 votes
represented the mixed mode spaces.
4.5 DISTRIBUTION OF VOTES BY AGE AND GENDER
The distribution of votes by age and gender is shown in Figure 19 and Figure 20
for both building types. In naturally ventilated buildings, Figure 19, the percentage of
female votes was 60.7 %, while the percentage of male votes was 36.2 %; 3.1 % did not
answer the question determining the gender type. 82.7 % of the votes were younger
than 25; this age category represented students, while the other age categories
represented employees and lecturers. In mixed mode buildings, the percentage of male
votes was 65.1 %, while the percentage of female votes was 33.9 %, only 1 % did not
indicate their gender. Regarding the age, 89.5 % of the votes were less than 25, while
10.5 % represented the other age categories.
Figure 19: The distribution of votes in naturally ventilated buildings by age and gender
7
875
41 34 1614
1331
62 86 139
0
200
400
600
800
1000
1200
1400
no answer less than 25 from 25 to 35
from 35 to 45
more than 45
age
Naturally Ventilated
Num
ber o
f votes
no answer
male
female

Data Analysis
73
Figure 20: The distribution of votes in mixed mode buildings by age and gender
4.6 THERMAL ENVIRONMENT’S CHARACTERISTICS
This section deals with the thermal environment in the four different field
studies. The parameters measured were the indoor air temperature and the relative
humidity. The value of each represents the mean value calculated from the readings of
all devices that were placed in each space. The values obtained for each space and the
mean values of each building during the different four seasons of the field studies are
discussed. The indoor air temperature was found to be almost the same as the operative
temperature as discussed before in the methodology followed in measuring the indoor
parameters. The outdoor air temperature was obtained from the Egyptian
Meteorological Authority from the nearest metrological station, less than 50 km from
any of the three buildings. The mean of the 6 a.m. and 3 p.m. readings represented the
value of each point.
4.6.1 Air Temperature
The indoor air temperature was measured in one or more spaces on each day of
the field studies. The mean indoor air temperature and the mean outdoor air temperature
for naturally ventilated buildings in each day of the field studies over the four seasons
are shown in Figure 21. It can be observed that the maximum mean indoor temperature
recorded was 34.33°C, and the minimum mean indoor air temperature was 20.53°C,
1
295
23 1 22
146
19 0 10
50100150200250300350
no answer less than 25 from 25 to 35
from 35 to 45
more than 45
age
MIxed Mode
Num
ber o
f votes
no answer
male
female

Chapter Four
74
which means that the study covered a range of 14 K. The minimum mean outdoor air
temperature was 16.1 and the maximum mean outdoor temperature was 34.95°C,
covering a range of outdoor temperatures of 19 K.
Figure 21: The mean indoor air temperature values (°C) recorded during the days of the study, and the mean outdoor air temperature values (°C) obtained from the Egyptian Meteorological Authority for naturally ventilated buildings
The mean indoor air temperature and the mean outdoor air temperature for
mixed mode buildings in each day of the field studies over the four seasons are shown
in Figure 22. It can be observed that the maximum mean indoor temperature recorded
was 27.07°C, and the minimum mean indoor air temperature was 21.23°C, which
means that the study covered a range of 6 K. The minimum mean outdoor air
temperature was 17°C and the maximum mean outdoor temperature was 26.6°C,
covering a range of outdoor temperatures of 9.5 K.
The general trend in the autumn seasons was that the recorded indoor
temperature started from a high temperature and decreased as the study continued,
while the reverse occurred in the spring seasons. The mean outdoor air temperature was
always lower than the mean indoor air temperature as the survey was conducted
between the 10 a.m. and 4 p.m., while the mean outdoor air temperature was calculated
as the average of the 6 a.m. and the 3p.m. readings.

Data Analysis
75
Figure 22: The mean indoor air temperature values (°C) recorded during the days of the study, and the mean outdoor air temperature values (°C) obtained from the Egyptian Meteorological Authority for mixed mode buildings
The mean indoor air temperature, with the 95% confidence interval, for different
building types across each season is shown in Figure 23. The mean indoor air
temperature in the case of mixed mode buildings was lower than the mean indoor air
temperature in the case of naturally ventilated buildings; this was due to the usage of air
conditioning in the case of mixed mode buildings.
Spring 2008 had the higher means for both building types, and it was higher
than the average range covered by the other studies in the other three seasons. This led
to the investigation of the thermal range covered in each building type across the four
seasons. On reviewing Table 6, it is clear that the days covered in spring 2008 had
indoor air temperatures more than 25° C, which led to a higher mean of the indoor air
temperature than the other seasons investigated in the study. The range of indoor air
temperatures between 21°C and 25°C was clearly represented in the season of spring
2009; this had an impact on the neutral temperature calculated for each season later on.
The analysis of variance of the indoor air temperature for different types of
buildings is shown in Appendix I, where there was no difference in autumn 2008; this is
also clear from Figure 23. But in autumn 2007, spring 2008 and spring 2009 there was a
significant difference between the indoor air temperatures of both types of buildings
within each of these seasons. For autumn 2007, α = 0.05, F (1,776) = 42.494 and P <

Chapte
76
0.001
0.05,
and P
Figureseason
er Four
1, for spring
F (1,822) =
P < 0.001.
e 23: The means of the study
2008, α = 0.
0.090 and P
an indoor air ty
05, F (1,672
= 0.765, and
temperature f
2) = 23.37 an
d for spring 2
for the differen
nd P < 0.001,
2009, α = 0.0
nt building ty
, for autumn
05, F (1,906)
pes across the
2008, α =
) = 11.915
e four

Data Analysis
77
Table 6: The cumulative percentage of the indoor air temperature for different building types across the four seasons of the study
season Building Type Frequency Percent Valid Percent Cumulative Percent21.00 63 9.8 9.8 9.824.00 113 17.5 17.5 27.325.00 60 9.3 9.3 36.626.00 251 39.0 39.0 75.627.00 111 17.2 17.2 92.932.00 46 7.1 7.1 100.0Total 644 100.0 100.023.00 43 32.1 32.1 32.124.00 33 24.6 24.6 56.725.00 21 15.7 15.7 72.426.00 37 27.6 27.6 100.0Total 134 100.0 100.024.00 56 8.8 8.8 8.825.00 34 5.3 5.3 14.127.00 50 7.8 7.8 21.928.00 84 13.2 13.2 35.129.00 68 10.7 10.7 45.830.00 91 14.3 14.3 60.031.00 61 9.6 9.6 69.632.00 96 15.0 15.0 84.633.00 34 5.3 5.3 90.035.00 21 3.3 3.3 93.336.00 43 6.7 6.7 100.0Total 638 100.0 100.026.00 18 50.0 50.0 50.028.00 18 50.0 50.0 100.0Total 36 100.0 100.021.00 51 7.8 7.8 7.822.00 74 11.3 11.3 19.123.00 91 13.9 13.9 32.924.00 7 1.1 1.1 34.025.00 72 11.0 11.0 45.026.00 108 16.5 16.5 61.427.00 227 34.6 34.6 96.028.00 26 4.0 4.0 100.0Total 656 100.0 100.023.00 15 8.9 8.9 8.924.00 49 29.2 29.2 38.125.00 35 20.8 20.8 58.926.00 69 41.1 41.1 100.0Total 168 100.0 100.021.00 217 28.9 28.9 28.922.00 138 18.4 18.4 47.323.00 22 2.9 2.9 50.224.00 66 8.8 8.8 59.025.00 21 2.8 2.8 61.826.00 27 3.6 3.6 65.428.00 190 25.3 25.3 90.732.00 70 9.3 9.3 100.0Total 751 100.0 100.021.00 25 15.9 15.9 15.922.00 34 21.7 21.7 37.623.00 27 17.2 17.2 54.825.00 30 19.1 19.1 73.926.00 41 26.1 26.1 100.0Total 157 100.0 100.0
Naturally Ventilated
MIxed Mode
Air Temperature
Autumn 2007
Spring 2008
Autumn 2008
Spring 2009
Naturally Ventilated
MIxed Mode
Naturally Ventilated
MIxed Mode
Naturally Ventilated
MIxed Mode

Chapter Four
78
4.6.2 Relative Humidity
The mean indoor relative humidity of each day and corresponding mean outdoor
relative humidity for naturally ventilated buildings are shown in Figure 24. The
minimum indoor relative humidity was 20.60% and the maximum indoor relative
humidity was 60.43%, covering a range of 40%. The minimum outdoor relative
humidity was 22% and the maximum outdoor relative humidity was 65.50%, covering a
range of 43.50%.
The mean indoor relative humidity of each day and corresponding mean outdoor
relative humidity for mixed mode buildings are shown in Figure 25. The minimum
indoor relative humidity was 25.27% and the maximum indoor relative humidity was
55.25%, covering a range of 30%. The minimum outdoor relative humidity was 35%
and the maximum outdoor relative humidity was 67.50%, covering a range of 32.50%.
In most cases in both building types, the indoor relative humidity percentage is
within acceptable ranges, the mean indoor relative humidity lay between the 40% and
the 60% as recommended by (CIBSE 1997) for office work.
4.6.3 Summary
The fact that the buildings’ mean indoor air temperature was always higher than
the mean outdoor air temperature shows that there was a great potential for using
passive cooling techniques to lower the internal air temperatures. This could be applied
to both types of buildings, while in the case of mixed mode buildings this would result
in reducing the need for air condition.
The hottest season examined was spring 2008, and the coldest season was spring
2009, the mean indoor air temperatures examined were on average 25 °C except in
spring 2008.
The analysis of variance showed a significant difference between the mean air
temperatures of both building types except for the season of autumn 2008.
The indoor relative humidity percentages were within the acceptable limits for
office work in autumn seasons, in spring seasons it went below this range.

Data Analysis
79
Figure 24: The mean indoor relative humidity (%) for the days of the study together with the corresponding outdoor relative humidity for naturally ventilated buildings
Figure 25: The mean indoor relative humidity (%) for the days of the study together with the corresponding outdoor relative humidity for mixed mode buildings
4.7 COMFORT VOTES
This section presents the results of the votes obtained in the four seasons’
questionnaires on the various comfort parameters. It includes thermal comfort
parameters such as thermal sensation, thermal preference and thermal acceptance; it
also includes humidity comfort parameters such as humidity sensation, humidity

Chapter Four
80
preference and humidity acceptance. The last parameter discussed is the overall
satisfaction with climatic conditions.
4.7.1 Thermal sensation votes
The distribution of thermal sensation votes across the different building types in
the four seasons of the study is shown in Figure 26, Figure 27, Figure 28 and Figure 29.
The percentages of the votes across the seven categories of the ASHRAE scale are
shown in Table 7. In the autumn seasons, the percentage of votes for the central
category of the scale (-1, 0, 1) is 88% for the mixed mode buildings, and the case of
naturally ventilated buildings did not differ except in the autumn 2008, which was 84%.
This meant that in the autumn seasons, the response to the thermal sensation did not
differ among different building types. This was confirmed by the analysis of variance in
the autumn seasons, where in autumn 2007 the ANOVA is α = 0.05, F (1,777) = 1.546
and P = 0.214, and in autumn 2008 the ANOVA is α = 0.05, F (1,821) = 0.224 and P =
0.636.
The case differed for the spring seasons. Spring 2008 (refer to 4.6.1) was
considered the hottest conditions of the whole study. The percentage of votes for the
central category of the ASHRAE scale (-1, 0, 1) was 67% for mixed mode buildings
and 54% for naturally ventilated buildings. In spring 2009, the percentage of votes for
the central category of the ASHRAE scale (-1, 0, 1) was 88% for the mixed mode
buildings and 78% for the naturally ventilated buildings.
The ANOVA test showed that there was a difference between the votes of
mixed mode buildings and naturally ventilated spaces, where ANOVA for spring 2008
was α = 0.05, F (1,672) = 5. 096 and P = 0.024, and for spring 2009 was α = 0.05, F
(1,906) = 4.386 and P = 0.037. This difference reflected the effect of using air
conditioning in the spring season in the mixed mode buildings, which resulted in a
higher percentage of comfortable votes in mixed mode buildings than in naturally
ventilated buildings. The case was different in the autumn seasons as using the air
conditioner is not common during this period of the year.

Data Analysis
81
Table 7: Percentage of thermal sensation votes for each type of buildings over the four seasons of the study
Mixed Mode % of votes
Naturally Ventilated % of votes
Cold 0 0Cool 5 2Slightly Cool 16 17Just Right 53 52Slightly Warm 19 19Warm 5 8Hot 1 2Cold 0 0Cool 0 0Slightly Cool 0 2Just Right 56 32Slightly Warm 11 20Warm 22 20Hot 11 26Cold 0 1Cool 1 2Slightly Cool 9 14Just Right 55 47Slightly Warm 24 23Warm 8 10Hot 4 5Cold 0 0Cool 1 1Slightly Cool 6 8Just Right 52 47Slightly Warm 30.6 23Warm 8.3 14Hot 1.9 7
Autumn 2007
Spring 2008
Autumn 2008
Spring 2009
Figure 26: The distribution of thermal sensation votes of the different building types in autumn 2007, and the analysis of variance across different building types (α = 0.05, F (1,777) = 1.546 and P = 0.214)
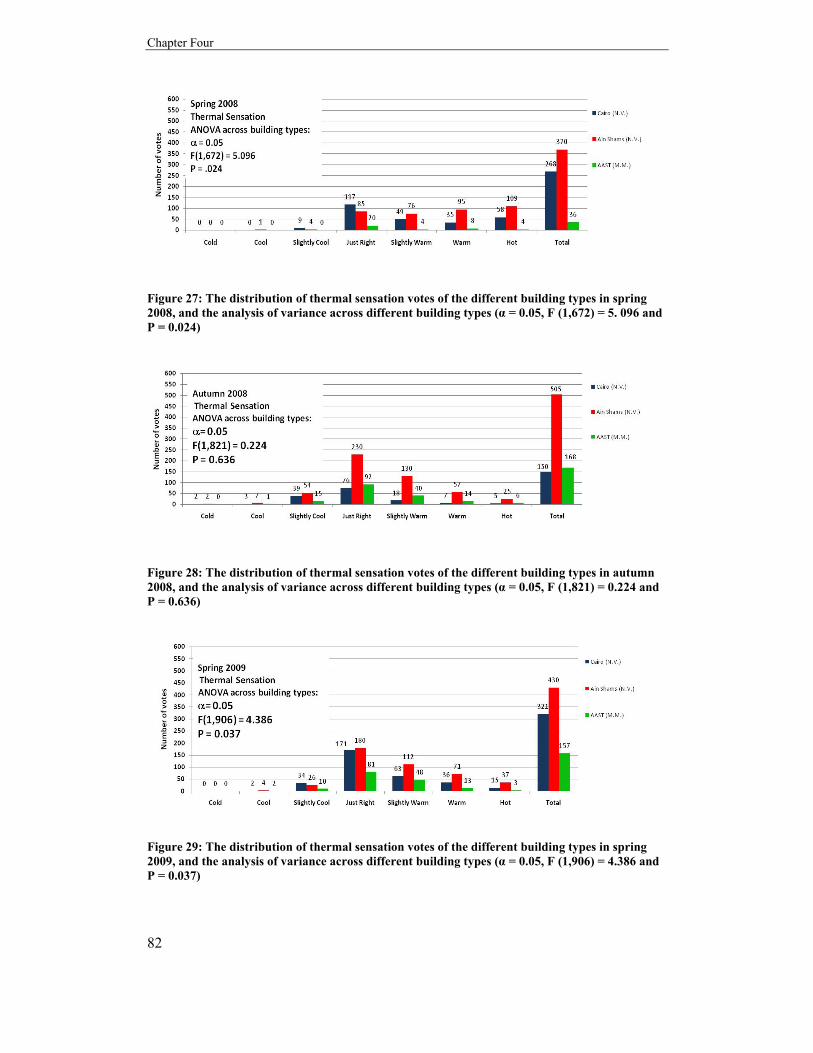
Chapter Four
82
Figure 27: The distribution of thermal sensation votes of the different building types in spring 2008, and the analysis of variance across different building types (α = 0.05, F (1,672) = 5. 096 and P = 0.024)
Figure 28: The distribution of thermal sensation votes of the different building types in autumn 2008, and the analysis of variance across different building types (α = 0.05, F (1,821) = 0.224 and P = 0.636)
Figure 29: The distribution of thermal sensation votes of the different building types in spring 2009, and the analysis of variance across different building types (α = 0.05, F (1,906) = 4.386 and P = 0.037)

Data Analysis
83
Figure 30 shows the mean of the thermal sensation vote for the different types of
buildings for the four seasons of the study. It is obvious that the mean for mixed mode
buildings was always below the naturally ventilated buildings except in autumn 2008
where they are almost coinciding. The higher means were in the hottest season spring
2008.
Figure 30: The mean thermal sensation for each type of building for the four seasons of the study
The study took place in a hot dry climate, so the votes corresponding to the
cold category of the ASHRAE scale was almost not found. The votes were generally
inclined towards the warm zone of the scale.
4.7.2 Thermal preference votes
The distribution of preference votes for both building types across the four
seasons of the study are shown in Figure 31. It is obvious that in autumn seasons, the
most common preference votes are slightly cooler and unchanged, while in spring
seasons, the preference votes reflected the pattern of the sensation votes, i.e the votes
seemed to prefer more a cooler environment than in the case of the autumn seasons. The
case was the same in both building types.
0.200.37
1.37
0.63
0.08
0.41
0.89
0.44
‐1.00
0.00
1.00
2.00
Autumn 2007Autumn 2008 Spring 2008 Spring 2009
Thermal Sen
sation Naturally
Ventilated
Mixed Mode

Chapter Four
84
The cumulative percentage of the preference votes for the different building
types across the four seasons of the study is shown in Figure 32. The cumulative
percentage for the categories cooler, slightly cooler and unchanged was almost above
80% in all cases, except for the mixed mode spaces in autumn 2007. This emphasised
the tendency to prefer cooler environments in all seasons included in the study. The
highest cumulative percentage at the vote unchanged is also occurred in the hottest
season spring 2008.
Figure 31: The distribution of preference votes for the different building types across the four seasons of the study
0
50
100
150
200
250
300
350
Cooler
Slightly Coo
ler
Unchanged
Slightly W
armer
Warmer
Cooler
Slightly Coo
ler
Unchanged
Slightly W
armer
Warmer
Cooler
Slightly Coo
ler
Unchanged
Slightly W
armer
Warmer
Cooler
Slightly Coo
ler
Unchanged
Slightly W
armer
Warmer
autumn 2007 autumn 2008 spring 2008 spring 2009
Num
ber o
f votes
Naturally Ventilated
MIxed Mode

Data Analysis
85
Figure 32: The cumulative percentage (%) of preference votes for different building types across the four seasons of the study
4.7.3 Relation between thermal sensation and thermal preference
The distributions of thermal preference votes across thermal sensation votes are
shown in Figure 33 for naturally ventilated buildings and in Figure 34 for mixed mode
buildings. The percentage of thermal preference votes across different thermal sensation
categories is shown in Table 8 for both types of buildings. In naturally ventilated
buildings, in the “just right” category of the thermal sensation scale, 62.1 % of the votes
preferred the thermal conditions to be the same, 28.7% preferred cooler conditions
while only 9.1% preferred warmer conditions. In mixed mode buildings, for the “just
right” thermal sensation category 56.1% of the votes preferred the same thermal
conditions, 31.8% preferred cooler conditions, while 12.1% preferred warmer
conditions.
The distribution of preference votes across thermal sensation votes followed the
logical concept in both types of buildings. In the case where subjects feel “slightly cool
0
20
40
60
80
100
120
Cooler
Slightly Coo
ler
Unchanged
Slightly W
armer
Warmer
Cooler
Slightly Coo
ler
Unchanged
Slightly W
armer
Warmer
Cooler
Slightly Coo
ler
Unchanged
Slightly W
armer
Warmer
Cooler
Slightly Coo
ler
Unchanged
Slightly W
armer
Cooler
Slightly Coo
ler
Unchanged
Slightly W
armer
Warmer
Cooler
Slightly Coo
ler
Unchanged
Slightly W
armer
Warmer
Cooler
Slightly Coo
ler
Unchanged
Slightly W
armer
Warmer
Cooler
Slightly Coo
ler
Unchanged
Slightly W
armer
Warmer
Naturally Ventilated
MIxed Mode Naturally Ventilated
MIxed Mode Naturally Ventilated
MIxed Mode Naturally Ventilated
MIxed Mode
Autumn 2007 Spring 2008 Autumn 2008 Spring 2009
Cumulative Pe
rcen
t %

Chapter Four
86
or cool or cold” they preferred warmer conditions, and on the contrary when they felt
“slightly warm or warm or hot” they preferred cooler conditions.
Figure 33: The distribution of thermal preference votes across the thermal sensation votes for naturally ventilated buildings

Data Analysis
87
Figure 34: The distribution of thermal preference votes across thermal sensation votes for mixed mode buildings
Table 8: The percentage of thermal preference votes across each category of the thermal sensation scale for both types of buildings
Thermal Sensation * Temperature preference Cross tabulation
Building Type Temperature preference
cooler slightly cooler
unchanged slightly warmer
warmer
Naturally Ventilated
Thermal Sensation
Cold 25.00% 0% 0% 50.00% 25.00%
Cool 0% 3.00% 18.20% 51.50% 27.30% Slightly
Cool 0.70% 5.10% 43.60% 45.10% 5.50%
Just Right 1.80% 26.90% 62.10% 7.70% 1.40% Slightly
Warm 11.90% 75.30% 9.60% 2.60% 0.50%
Warm 33.00% 61.50% 3.10% 1.40% 0.90% Hot 51.70% 42.20% 1.90% 2.70% 1.50% Mixed Mode Thermal
Sensation Cool 0% 10.00% 0% 60.00% 30.00%
Slightly Cool
0% 2.20% 41.30% 50.00% 6.50%
Just Right 1.10% 30.70% 56.10% 10.60% 1.50% Slightly
Warm 7.60% 72.90% 15.30% 1.70% 2.50%
Warm 28.60% 66.70% 2.40% 0% 2.40% Hot 80.00% 20.00% 0% 0% 0%
It seems that there were a percentage of subjects who misunderstood the
meaning of the thermal preference question. This category was divided in two groups,
the first group includes those subjects who preferred cooler conditions while voting for
an existing cold condition in the space (thermal sensation votes “slightly cool or cool or
cold”). The second group consists of those subjects who preferred a warmer condition
on the preference scale, while voting for “slightly warm or warm or hot” on the thermal
sensation scale. This could be checked by adding the thermal preference to the thermal
sensation vote for each subject; the logical outcome should present a “just right”
condition. The addition of both scales will be named here as the adjusted preferred
condition which is shown in Figure 35 for naturally ventilated buildings and in Figure
36 for mixed mode buildings. The “just right” category was represented by 52.8% in
naturally ventilated buildings; the same category was represented by 54.9% in mixed
mode buildings.The central category “slightly cool, just right and slightly warm”, which

Chapter Four
88
is considered the comfort zone in the existing ASHRAE standard -55 2004, was 91.7%
in the case of naturally ventilated buildings and 96.1% in the case of mixed mode
buildings. This indicates that the probability of misunderstanding the meaning of the
two questions asking about the thermal sensation and thermal preference was lower
than 10% in both types of buildings and also indicated that people may prefer to feel
slightly cool or slightly warm in some cases, this is noted as “semantic artifact” in the
thermal sensation scales. When people are in a hot climate they tend to use words like
“slightly cool” to describe their preferred thermal sensation, and in cold climate they
use words like “slightly warm” to describe their preferred thermal sensation.
Figure 35: The percentage of adjusted preferred condition in naturally ventilated buildings
Figure 36: The percentage of adjusted preferred condition in mixed mode buildings
0.10% 1.70%
19.60%
52.80%
19.30%
5.90% 0.70%0%
20%
40%
60%
80%
100%
Cold Cool Slightly Cool
Just Right Slightly Warm
Warm Hot
Percen
tage of votes
0.20% 0.80%
23.20%
54.90%
18%
2.20% 0.60%0%10%20%30%40%50%60%70%80%90%
100%
Cold Cool Slightly Cool
Just Right Slightly Warm
Warm Hot
Percen
tage of votes

Data Analysis
89
4.7.4 Acceptance votes
The percentage of accepted indoor thermal conditions is shown in Figure 37.
The percentage of acceptability was 75 % or more in most cases except for the hottest
season of spring 2008; it went down to 50% in the naturally ventilated buildings and 60
% in the mixed mode buildings. The mixed mode buildings showed a higher acceptance
of the indoor thermal conditions than the naturally ventilated buildings, although the
analysis of variance did not show a great significance between the percentages of
acceptance in different building types. The study was carried out in the spring and
autumn seasons, when methods of adaptation are almost the same as the usage of air
conditioning are not common in both seasons.
Figure 38 shows the actual acceptance percentage for the indoor thermal
conditions corresponding to the votes of the central category of the ASHRAE scale (-1,
0, 1). It was 85% or more in all the cases for both types of buildings and in all seasons.
This differed from the assumption of the Adaptive Comfort Standard that the
percentage of acceptance for this category is 80% (refer to 2.3.1.2.).
Figure 37: The percentage of acceptance of the indoor thermal conditions for both building types across the four seasons of the study
85%
15%
77%
23%
54%46%
76%
24%
90%
10%
83%
17%
64%
36%
78%
22%
0.00%10.00%20.00%30.00%40.00%50.00%60.00%70.00%80.00%90.00%100.00%
accepted
unacceptable
accepted
unacceptable
accepted
unacceptable
accepted
unacceptable
Autumn 2007Autumn 2008 Spring 2008 Spring 2009
Percen
tage of a
ccep
tance Naturally
Ventilated
MIxed Mode

Chapter Four
90
Figure 38: The percentage of acceptance of the indoor thermal conditions for the central thermal sensation categories (-1, 0, 1)
4.7.5 Humidity sensation votes
The percentage of humidity sensation is shown in Figure 39, where the central
category (slightly dry, neutral and slightly humid) represents 75 % of the votes in most
cases, except for the naturally ventilated buildings in spring 2008. With reference to the
thermal environment’s characteristics in 4.6.2, it was found that some days in that
season were not part of the recommended percentage (between 40 % and 60 %). The
analysis of variance showed that there was a difference between both types of buildings
in this season, ANOVA α = 0.05, F (1,672) = 8.082 and P <0.05. The distribution of the
humidity sensation votes did not differ between both types of buildings except in spring
2008.
During the study, the respondents’ most commonly asked question was how to
judge the humidity percentage in the environment. Although it seemed difficult to
answer the question of the humidity sensation, the results attained were logical when
compared to the measured parameter.
92%85% 85% 90%92%
87% 88% 91%
0.00%
10.00%
20.00%
30.00%
40.00%
50.00%
60.00%
70.00%
80.00%
90.00%
100.00%
accepted accepted accepted accepted
Autumn 2007
Autumn 2008
Spring 2008 Spring 2009
Percen
tage of a
ccep
tance
Naturally Ventilated
MIxed Mode

Data Analysis
91
4.7.6 Humidity preference
Figure 40 shows the percentage of the humidity preference for the different
building types across the four seasons of the study. The general tendency of the votes
was towards the central category (slightly dry, unchanged and slightly humid), except in
the season spring 2008.
The analysis of variance showed that the distribution of votes in spring 2008
differed significantly from the other seasons for naturally ventilated buildings, ANOVA
α = 0.05, F (3, 3180) = 88.119 and P <0.05. The least significant difference (LSD) pair
wise multiple comparison tests showed that the difference was due to the spring 2008
season as seen in Appendix J. The case did not differ for mixed mode buildings. This
reflected the humidity sensation votes and the agreement between both votes.
4.7.7 Humidity acceptance
The percentage of humidity acceptance is shown in Figure 41. The percentage
of acceptability was 75% or more in all cases, except for the case of naturally ventilated
buildings in the season of spring 2008, it went down to 57%. This finding is coincided
with the analysis of the humidity sensation votes and the humidity preference votes. In
general, the mixed mode buildings showed a higher indoor humidity acceptance than
the naturally ventilated buildings.
Figure 39: The humidity sensation vote for different building types across the four seasons of the study
0.00%
20.00%
40.00%
60.00%
80.00%
100.00%
Very Dry
Dry
Slightly Dry
Neu
tral
Slightly Hum
idHum
idVe
ry Hum
idno
answer
Very Dry
Dry
Slightly Dry
Neu
tral
Slightly Hum
idHum
idVe
ry Hum
idno
answer
Very Dry
Dry
Slightly Dry
Neu
tral
Slightly Hum
idHum
idVe
ry Hum
idno
answer Dry
Slightly Dry
Neu
tral
Slightly Hum
idHum
idno
answer
Percen
tage of votes
Naturally VentilatedMIxed Mode

Chapter Four
92
Figure 40: The humidity preference for different building types across the four seasons of the study
Figure 41: The percentage of humidity acceptance for both building types across the four seasons of the study
4.8 THE MEAN TEMPERATURE FOR DIFFERENT THERMAL
SENSATION CATEGORIES
The mean indoor air temperatures for different thermal sensation categories of
naturally ventilated buildings for both seasons of the study are shown in Figure 42. The
mean indoor air temperature for the category “just right” was 24°C in spring and 26°C
0.00%
20.00%
40.00%
60.00%
80.00%
100.00%
Drie
r
Slightly Drie
r
Unchanged
Slightly Hum
id
More Hum
id
no answer
Drie
r
Slightly Drie
r
Unchanged
Slightly Hum
id
More Hum
id
no answer
Drie
r
Slightly Drie
r
Unchanged
Slightly Hum
id
More Hum
id
no answer
Drie
r
Slightly Drie
r
Unchanged
Slightly Hum
id
More Hum
id
no answer
Percen
tage of votes
Naturally VentilatedMIxed Mode
0.00%10.00%20.00%30.00%40.00%50.00%60.00%70.00%80.00%90.00%100.00%
no answer
Accep
ted
Unaccep
ted
no answer
Accep
ted
Unaccep
ted
no answer
Accep
ted
Unaccep
ted
no answer
Accep
ted
Unaccep
ted
Percen
tage of votes
Naturally Ventilated
MIxed Mode

Data Analysis
93
in autumn, which indicated the preference of subjects to warmer conditions in the
autumn season than in the spring season. The analysis of variance showed that the mean
indoor air temperature for the category “just right” differed significantly in the spring
and autumn seasons in naturally ventilated buildings, ANOVA α = 0.05, F (1, 1192) =
20.989 and P <0.05. The mean indoor air temperature of the categories “slightly cool
and cool” was lower in the spring season than in the autumn season, as spring was
hotter than autumn. The sensitivity to cool conditions in autumn was higher than in the
spring season as subjects sensation to cooler conditions in spring was different than in
autumn. The contrary appeared in categories of “slightly warm and warm”, the mean
indoor air temperature for these categories was higher in spring than in autumn, which
showed that subjects could accept hotter conditions in spring than in autumn, this may
be caused due to their adaptation in different seasons.
The mean indoor air temperature for different thermal sensation categories of
mixed mode buildings for both seasons of the study is shown in Figure 43. The mean
indoor air temperature for the category “just right” was 23°C in spring and 24°C in
autumn; it was higher in autumn than in spring, the same case as in the naturally
ventilated buildings. Subjects’ sensation was different in warmer conditions and cooler
conditions in different seasons.
The mean indoor air temperature for the thermal sensation categories “slightly
cool and cool” was lower in spring than in autumn as in naturally ventilated buildings.
The mean indoor air temperatures for the thermal sensation categories “slightly warm
and warm” coincided in the spring and autumn seasons; it is around 26°C, which might
indicate that people using air conditioning as a method of adaptation cannot accept
conditions more than 26°C. It was different from the case of naturally ventilated
buildings, where the mean indoor air temperature for the thermal sensation “slightly
warm” was 28°C in spring and the mean indoor air temperature for the thermal
sensation category “warm” was 30°C.
The analysis of variance among the different building types showed a significant
difference only in the spring seasons as discussed in 4.7.1. It is the season where air
conditioners are used as an adaptive opportunity, while in the autumn season they are

Chapter Four
94
rarely used, which means that the adaptive opportunity in both building types were
almost the same.
Figure 42: The thermal sensation categories subject to the range of indoor air temperature of each category in naturally ventilated buildings for both seasons of the study. The thick lines in the boxes represent the median values, the colored boxes cover the mean 50%of the values and the thin lines show the whole range of all values except for the small circles indicate outliers of each category
Figure 43: The thermal sensation categories subject to the range of indoor air temperature of each category in mixed mode buildings for both seasons of the study. The thick lines in the boxes represent the median values, the colored boxes cover the mean 50%of the values and the thin lines show the whole range of all values except for the small circles indicate outliers of each category
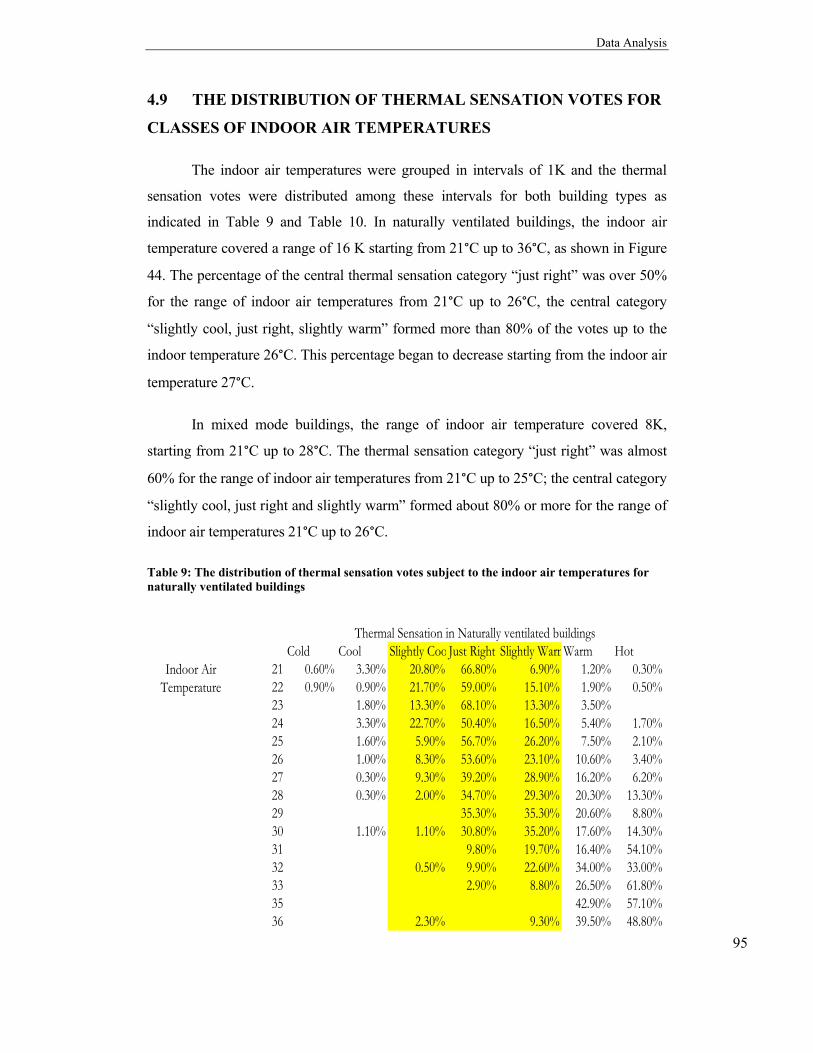
Data Analysis
95
4.9 THE DISTRIBUTION OF THERMAL SENSATION VOTES FOR
CLASSES OF INDOOR AIR TEMPERATURES
The indoor air temperatures were grouped in intervals of 1K and the thermal
sensation votes were distributed among these intervals for both building types as
indicated in Table 9 and Table 10. In naturally ventilated buildings, the indoor air
temperature covered a range of 16 K starting from 21°C up to 36°C, as shown in Figure
44. The percentage of the central thermal sensation category “just right” was over 50%
for the range of indoor air temperatures from 21°C up to 26°C, the central category
“slightly cool, just right, slightly warm” formed more than 80% of the votes up to the
indoor temperature 26°C. This percentage began to decrease starting from the indoor air
temperature 27°C.
In mixed mode buildings, the range of indoor air temperature covered 8K,
starting from 21°C up to 28°C. The thermal sensation category “just right” was almost
60% for the range of indoor air temperatures from 21°C up to 25°C; the central category
“slightly cool, just right and slightly warm” formed about 80% or more for the range of
indoor air temperatures 21°C up to 26°C.
Table 9: The distribution of thermal sensation votes subject to the indoor air temperatures for naturally ventilated buildings
Cold Cool Slightly Coo Just Right Slightly WarmWarm Hot
21 0.60% 3.30% 20.80% 66.80% 6.90% 1.20% 0.30%22 0.90% 0.90% 21.70% 59.00% 15.10% 1.90% 0.50%23 1.80% 13.30% 68.10% 13.30% 3.50%24 3.30% 22.70% 50.40% 16.50% 5.40% 1.70%25 1.60% 5.90% 56.70% 26.20% 7.50% 2.10%26 1.00% 8.30% 53.60% 23.10% 10.60% 3.40%27 0.30% 9.30% 39.20% 28.90% 16.20% 6.20%28 0.30% 2.00% 34.70% 29.30% 20.30% 13.30%29 35.30% 35.30% 20.60% 8.80%30 1.10% 1.10% 30.80% 35.20% 17.60% 14.30%31 9.80% 19.70% 16.40% 54.10%32 0.50% 9.90% 22.60% 34.00% 33.00%33 2.90% 8.80% 26.50% 61.80%35 42.90% 57.10%36 2.30% 9.30% 39.50% 48.80%
Thermal Sensation in Naturally ventilated buildings
Indoor Air Temperature

Chapter Four
96
Table 10: The distribution of thermal sensation votes subject to the indoor air temperatures for mixed mode buildings
Cold Cool Slightly Coo Just Right Slightly WarmWarm Hot
21 4.00% 4.00% 68.00% 12.00% 8.00% 4.00%22 2.90% 14.70% 64.70% 14.70% 2.90%23 5.90% 21.20% 57.60% 9.40% 5.90%24 2.40% 11.00% 64.60% 19.50% 1.20% 1.20%25 1.20% 3.50% 62.80% 25.60% 5.80% 1.20%26 6.10% 38.80% 37.00% 13.30% 4.80%28 27.80% 16.70% 38.90% 16.70%
Thermal Sensation in mixed mode buildings
Indoor Air Temperature
Figure 44: The percentage of thermal sensation votes subject to the indoor air temperatures for naturally ventilated buildings
Figure 45: The percentage of thermal sensation votes subject to the indoor air temperatures for mixed mode buildings
0%
20%
40%
60%
80%
21 22 23 24 25 26 27 28 29 30 31 32 33 35 36
TotalPercen
tage of votes
Indoor air temperature °C
Cold
Cool
Slightly Cool
Just Right
Slightly Warm
Warm
Hot
0%
20%
40%
60%
80%
21 22 23 24 25 26 28 Total
Percen
tage of votes
Indoor air temperature °C
Cold
Cool
Slightly Cool
Just Right
Slightly Warm
Warm
Hot

Data Analysis
97
4.10 CLO VALUE
The value of the mean clothing insulation “clo” is indicated in Figure 46 for the
different building types across the four seasons of the study. The average value was
around 0.6 clo, except in the hotter season of spring 2008 where it went below that
value. The analysis of variance showed a significant difference between the mean clo
values of both building types in the four seasons of the study. ANOVA for autumn
2007, α = 0.05, F (1,776) = 29.935, p <0.05, ANOVA for spring 2008, α = 0.05, F
(1,672) = 8.789, p <0.05, ANOVA for autumn 2008, α = 0.05, F (1,822) = 7.341, p
<0.05 and ANOVA for spring 2009, α = 0.05, F (1,906) = 3.857, p <0.05.
Figure 46: The value of the mean clothing insulation for different building types across the four seasons of the study
0
0.1
0.2
0.3
0.4
0.5
0.6
0.7
0.8
Naturally Ven
tilated
MIxed
Mod
e
Naturally Ven
tilated
MIxed
Mod
e
Naturally Ven
tilated
MIxed
Mod
e
Naturally Ven
tilated
MIxed
Mod
e
Autumn 2007 Spring 2008 Autumn 2008 Spring 2009
Clo value

Chapter Four
98
4.11 GENERAL SATISFACTION WITH THE METHODS
AVAILABLE TO ADAPT TO THE INDOOR CLIMATIC CONDITIONS
A general question was asked about the methods of adaptation to the indoor climate,
including opening or closing of windows, doors and internal curtains, controlling
ceiling fans, changing the set points of the air conditioners, asking others to do any of
the previous actions and finally putting on or taking off clothing. The question was
followed by another one asking about the general satisfaction with the available
methods to control the indoor climatic conditions. The percentage of the feedback
coming from this question is shown in Table 11. The percentage of the categories
“very satisfying, satisfying and slightly satisfying” was 64.6% in naturally ventilated
buildings, while the same category was 83.4% in mixed mode buildings. This showed
that the opportunity of using air conditioners might raise the satisfaction with the
methods available to control the climate by 20%.
Table 11: The percentage of general satisfaction with the available methods of controlling the indoor climate in both types of buildings
Building Type Evaluating satisfaction from the methods of controlling the indoor climate
Percent of votes
Naturally Ventilated
No answer 2.20% Very satisfying 16.70% Satisfying 35.90% Slightly satisfying 12% Slightly unsatisfying 12.10% Unsatisfying 12.30% Totally unsatisfying 8.80%
Mixed Mode
No answer 2.40% Very satisfying 33.90% Satisfying 40.40% Slightly satisfying 9.10% Slightly unsatisfying 6.10% Unsatisfying 5.30% Totally unsatisfying 2.80%

Data Analysis
99
4.12 RELATION BETWEEN OUTDOOR TEMPERATURE
EXPECTATION AND THE GENERAL SATISFACTION WITH
INDOOR CLIMATIC CONDITIONS
The relation between the expectations of the outdoor climatic conditions and the
general satisfaction with the indoor climatic conditions in naturally ventilated buildings
is shown in Figure 47. Subjects whose expectations about the outdoor climate met the
actual outdoor conditions were much more satisfied with the general indoor climatic
conditions. Subjects who found that the outdoor conditions were different from their
expectations were generally dissatisfied with the indoor climatic conditions. Pearson
correlation between the two parameters was r = + 0.096, n=2689, P < 0.001 (2- tailed),
a significant weak correlation.
The relation between the expectations of the outdoor climatic conditions and the
general satisfaction with the indoor climatic conditions in mixed mode buildings is
shown in Figure 48. Pearson correlation between the two parameters was r = + 0.08,
n=495, P = 0.074 (2- tailed), a non significant weak correlation.
Figure 47: The relation between the outdoor climatic condition expectations and the general satisfaction with the indoor climatic conditions for naturally ventilated buildings
44 453 467 215 14171
25 353 369 182 152132
0%10%20%30%40%50%60%70%80%90%
100%
Perc
enta
ge o
f vo
tes
Overall satisfaction
Expectations about the outdoor climate were not met
Expectations about the outdoor climate were met

Chapter Four
100
Figure 48: The relation between the outdoor climatic condition expectations and the general satisfaction with the indoor climatic conditions for mixed mode buildings
4.13 RELATION BETWEEN INDOOR TEMPERATURE
EXPECTATION AND THE GENERAL SATISFACTION WITH
INDOOR CLIMATIC CONDITIONS
The relation between the expectations of the indoor climatic conditions and the
general satisfaction with the indoor climatic conditions in naturally ventilated buildings
is shown in Figure 49. Subjects whose expectations about the indoor climate met the
actual indoor conditions were much more satisfied with the general indoor climatic
conditions. Pearson correlation between the two parameters was r = + 0.154, n=2689, P
< 0.001 (2- tailed), a significant weak correlation.
The relation between the expectations of the indoor climatic conditions and the
general satisfaction with the indoor climatic conditions in mixed mode buildings is
shown in Figure 50. Pearson correlation between the two parameters was r = + 0.17, n=
495, P < 0.001 (2- tailed), a significant weak correlation.
10130 83 24 8
3
6107 70 25 11
10
0%10%20%30%40%50%60%70%80%90%
100%
Perc
enta
ge o
f vo
tes
Overall satisfaction
Expectations about the outdoor climate were not met
Expectations about the outdoor climate were met
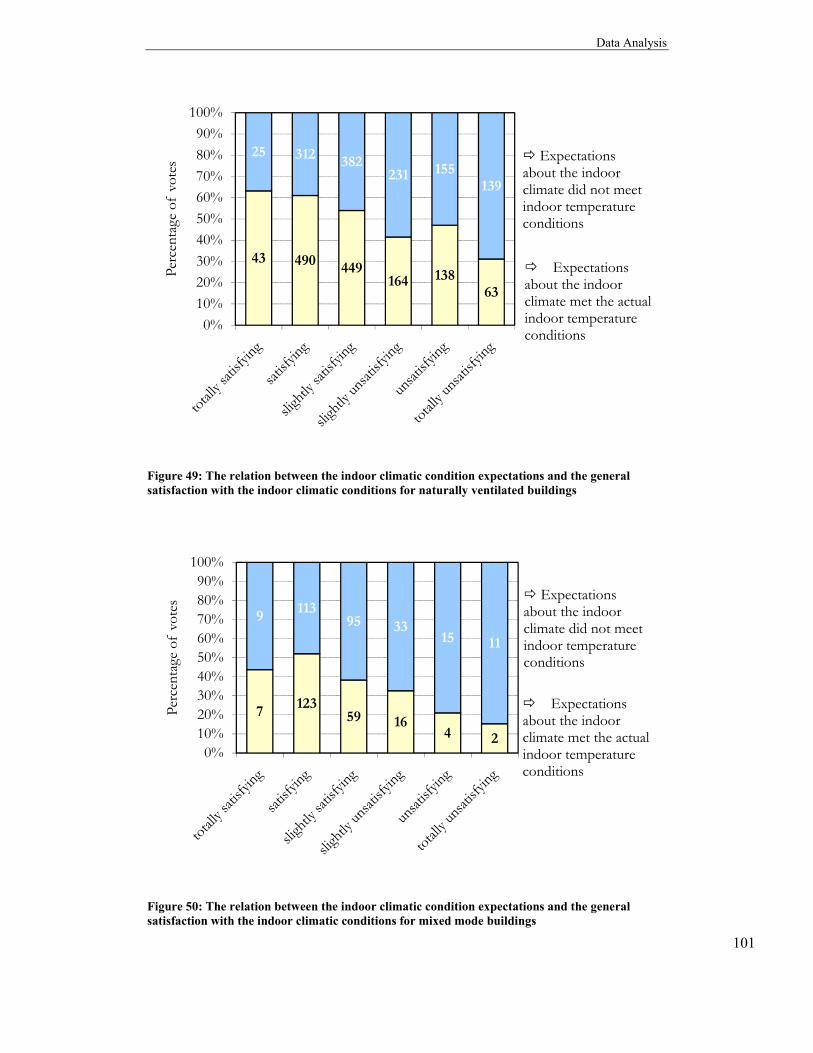
Data Analysis
101
Figure 49: The relation between the indoor climatic condition expectations and the general satisfaction with the indoor climatic conditions for naturally ventilated buildings
Figure 50: The relation between the indoor climatic condition expectations and the general satisfaction with the indoor climatic conditions for mixed mode buildings
43 490 449164 138
63
25 312 382231 155
139
0%10%20%30%40%50%60%70%80%90%
100%
Perc
enta
ge o
f vo
tes Expectations
about the indoor climate did not meet indoor temperature conditions
Expectations about the indoor climate met the actual indoor temperature conditions
7 12359 16
4 2
9 11395 33
15 11
0%10%20%30%40%50%60%70%80%90%
100%
Perc
enta
ge o
f vo
tes Expectations
about the indoor climate did not meet indoor temperature conditions
Expectations about the indoor climate met the actual indoor temperature conditions

Chapter Four
102
4.14 RELATION BETWEEN THERMAL SENSATION VOTES AND
THE GENERAL SATISFACTION WITH INDOOR CLIMATIC
CONDITIONS
The relation between the thermal sensation categories and the general
satisfaction with the indoor climatic conditions in naturally ventilated buildings is
shown in Figure 51, and in mixed mode buildings in Figure 52. People whose thermal
sensation votes lay in the central category of “slightly cool, just right and slightly
warm” were much more satisfied with the general indoor climatic conditions. In
naturally ventilated buildings, the Pearson correlation between the two parameters was r
= + 0.426, n=2689, P < 0.001 (2- tailed), a significant good correlation. In mixed mode
buildings, the Pearson correlation between the two parameters was r = + 0.339, n=495,
P < 0.001 (2- tailed), a significant good correlation.
Figure 51: The relation between thermal sensation votes and the general satisfaction with the indoor climatic conditions in naturally ventilated buildings, the numbers indicate the votes corresponding to each category
0 0 4 0 0 00 15 10 710 125 79 36
13 3
48 520
371118
6727
2
201
123
82
40
6117
73
84
33
3 9 55 42 47
100
0%
10%
20%
30%
40%
50%
60%
70%
80%
90%
100%
Per
cent
age
of v
otes
Overall satisfaction
Hot
Warm
Slightly warmJust right
Slightly coolCool
Cold
Thermal sensationThermal sensation
69 808 837 399 293 203

Data Analysis
103
Figure 52: The relation between thermal sensation votes and the general satisfaction with the indoor climatic conditions in mixed mode buildings, the numbers indicate the votes corresponding to each category
4.15 RELATION BETWEEN DIFFERENT PARAMETERS AND
BOTH THE GENERAL SATISFACTION WITH INDOOR CLIMATIC
CONDITIONS AND THERMAL SENSATION VOTES
The effect of different parameters such as gender, season, building type and hall
type on the thermal sensation votes and the general satisfaction with the indoor climate
is shown in Figure 53. In general, females voted for warmer mean thermal sensations
than males and were more dissatisfied with the internal climatic conditions. The seasons
of autumn were better than spring regarding the voting for lower mean thermal
sensations as well as more satisfaction with the indoor climatic conditions. Mixed mode
buildings were better than naturally ventilated buildings regarding both the mean
thermal sensation votes and the mean general satisfaction with the indoor climatic
conditions. Regarding the hall types, the labs were the best type, as they had to be
0 3 5 11 2019
3 11
12 16361
137
3
3
49
211
1
016
8
8
2
0 0 5 3 1
6
0%
10%
20%
30%
40%
50%
60%
70%
80%
90%
100%
Per
cent
age
of v
otes
Overall satisfaction
Hot
Warm
Slightly warmJust right
Slightly coolCool
Cold
Thermal sensation
16 237 155 49 19 13

Chapter Four
104
controlled using air conditioners for the safe up-keep of computers, followed by
drawing halls then by lecture halls, the worst type of spaces were the employees’
rooms.
Figure 53: The relation between different parameters and both mean thermal sensation votes and the mean satisfaction with the indoor climatic conditions
4.16 RELATION BETWEEN DESCRIPTION OF THE INTERNAL
AIR QUALITY AND THE GENERAL SATISFACTION WITH INDOOR
CLIMATIC CONDITIONS
Subjects were asked to describe the indoor air quality using one of the following
descriptions, “stifling, muggy, pleasantly dry, dusty, fresh, pure, unpleasant smell or
others”. The outcome from the answers to this question together with the subjects’ votes
about their general satisfaction with the indoor climate is shown in Figure 54 for
naturally ventilated buildings and in Figure 55 for mixed mode buildings. In general,
the selection of fresh, pleasantly dry and pure descriptions was associated with
satisfaction votes; the unsatisfied votes were associated with muggy and stifling
conditions. In naturally ventilated buildings, the Pearson correlation between the two
Lab
Lecture hall Male
Drawing hall
Spring
Mixed Mode
Female
AutumnEmployees
1.00
2.00
3.00
4.00
5.00
6.00
-3.00 -2.00 -1.00 0.00 1.00 2.00 3.00
Satisfying
Totally satisfying
Slightly satisfying
Slightly unsatisfying
Unsatisfying
Totally unsatisfying
Mean thermal sensation
Mea
nov
eral
l sat
isfa
ctio
n
Very cool
Very warm
Cool Slightly Cool
WarmSlightly warm
Just right
Naturally ventilated

Data Analysis
105
parameters was r = 0.039, n=2689, P < 0.05 (2- tailed), a significant weak correlation.
In mixed mode buildings, the Pearson correlation between the two parameters was r =
0.115, n=495, P < 0.05 (2- tailed), a significant weak correlation.
Figure 54: The relation between describing the air quality and the general satisfaction with the indoor climatic conditions in naturally ventilated buildings, the numbers indicate the votes corresponding to each category
Figure 55: The relation between describing the air quality and the general satisfaction with the indoor climatic conditions in mixed mode buildings
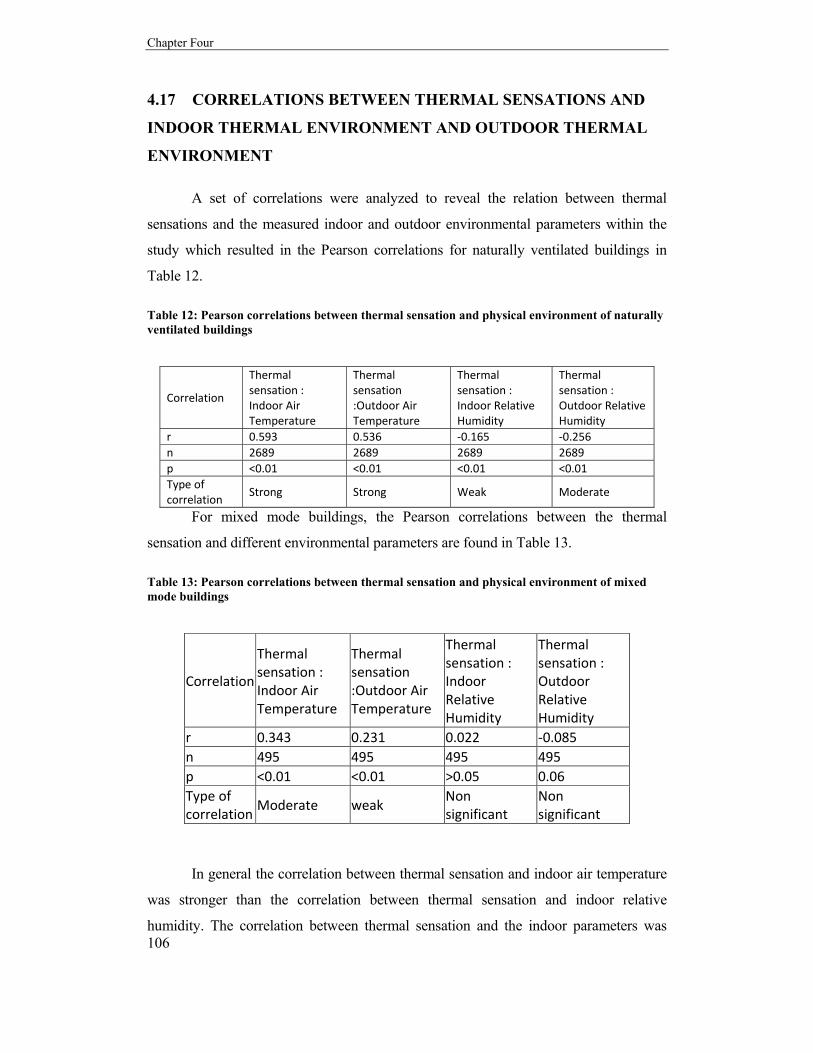
Chapter Four
106
4.17 CORRELATIONS BETWEEN THERMAL SENSATIONS AND
INDOOR THERMAL ENVIRONMENT AND OUTDOOR THERMAL
ENVIRONMENT
A set of correlations were analyzed to reveal the relation between thermal
sensations and the measured indoor and outdoor environmental parameters within the
study which resulted in the Pearson correlations for naturally ventilated buildings in
Table 12.
Table 12: Pearson correlations between thermal sensation and physical environment of naturally ventilated buildings
Correlation
Thermal sensation : Indoor Air Temperature
Thermal sensation :Outdoor Air Temperature
Thermal sensation : Indoor Relative Humidity
Thermal sensation : Outdoor Relative Humidity
r 0.593 0.536 ‐0.165 ‐0.256 n 2689 2689 2689 2689 p <0.01 <0.01 <0.01 <0.01 Type of correlation
Strong Strong Weak Moderate
For mixed mode buildings, the Pearson correlations between the thermal
sensation and different environmental parameters are found in Table 13.
Table 13: Pearson correlations between thermal sensation and physical environment of mixed mode buildings
Correlation
Thermal sensation : Indoor Air Temperature
Thermal sensation :Outdoor Air Temperature
Thermal sensation : Indoor Relative Humidity
Thermal sensation : Outdoor Relative Humidity
r 0.343 0.231 0.022 ‐0.085 n 495 495 495 495p <0.01 <0.01 >0.05 0.06 Type of correlation
Moderate weak Non significant
Non significant
In general the correlation between thermal sensation and indoor air temperature
was stronger than the correlation between thermal sensation and indoor relative
humidity. The correlation between thermal sensation and the indoor parameters was

Data Analysis
107
stronger than the correlation between thermal sensation and outdoor parameters for both
building types.
4.18 CORRELATION BETWEEN THERMAL SENSATION AND
ADAPTIVE OPPORTUNITIES
Question eleven of the questionnaire asked about various adaptive opportunities,
the Pearson correlations found between these opportunities and thermal sensation votes
in naturally ventilated buildings are shown in Table 14.The exploration of Pearson
correlations in mixed mode buildings between the adaptive opportunities and thermal
sensation votes showed that fewer adaptive actions resulted in significant correlations
with the thermal sensations; this is shown in Table 15.
Table 14: Pearson correlations between thermal sensation and adaptive opportunities in
naturally ventilated buildings
CorrelationThermal sensation : switching on and off of ceiling fans
Thermal sensation :drinking cold things during the last hour
Thermal sensation : closing and opening doors
Thermal sensation :closing and opening windows
Thermal sensation :putting off and wearing extra cloths
Thermal sensation :eating something cold during the last hour
Thermal sensation :eating something hot during the last hour
r 0.283 0.261 0.181 0.128 0.126 ‐0.048 ‐0.046n 2689 2689 2689 2689 2689 2689 2689p <0.01 <0.01 <0.01 <0.01 <0.01 <0.01 <0.05
Type of correlation
Moderate Moderate Weak Weak Weak Weak Weak
Table 15: Pearson correlations between thermal sensation and adaptive opportunities in mixed mode buildings
CorrelationThermal sensation :drinking cold things during the last hour
Thermal sensation :eating something cold during the last hour
Thermal sensation :closing and opening windows
Thermal sensation :drinking something hot during the last hour
r 0.125 -0.124 0.112 -0.11n 495 495 495 495p <0.01 <0.01 <0.05 <0.05
Type of correlation
Weak Weak Weak Weak

Chapter Four
108
4.19 THE CALCULATION OF NEUTRAL TEMPERATURES FOR
BOTH BUILDING TYPES
The method used to calculate the neutral “comfort” temperatures was regression
analysis. This method was used to predict the value of the dependent variable “thermal
sensation vote” for a particular value of the independent variable “indoor air
temperature”. The method assumes a linear relationship between “thermal sensation
votes” and “indoor air temperature”. The regression of the thermal sensation vote on the
indoor air temperature for the whole study and for different seasons was calculated and
represented in Table 16.
Table 16: The regression of the thermal sensation vote on the indoor air temperature in all buildings through the different seasons
Type of Building Season Neutral
TemperatureRegression Model
Coefficient constant R2 Naturally Ventilated
Whole study 22.85°C 0.192 ‐ 4.388 0.351
Naturally Ventilated
autumn 2007 24.51°C 0.170 ‐ 4.167 0.187
Naturally Ventilated
spring 2008 23.94°C 0.237 ‐ 5.674 0.406
Naturally Ventilated
autumn 2008 23.20°C 0.204 ‐ 4.733 0.161
Naturally Ventilated
spring 2009 20.98° C 0.173 ‐ 3.630 0.363
Mixed Mode Whole study 22.55° C 0.190 ‐ 4.284 0.118
Mixed Mode autumn seasons
24.0°C 0.335 ‐ 8.012 0.164
Mixed Mode spring seasons 21.0°C 0.157 ‐ 3.285 0.139
ASHRAE standard 55
36 buildings 24.6°C 0.27 ‐ 6.65 0.46
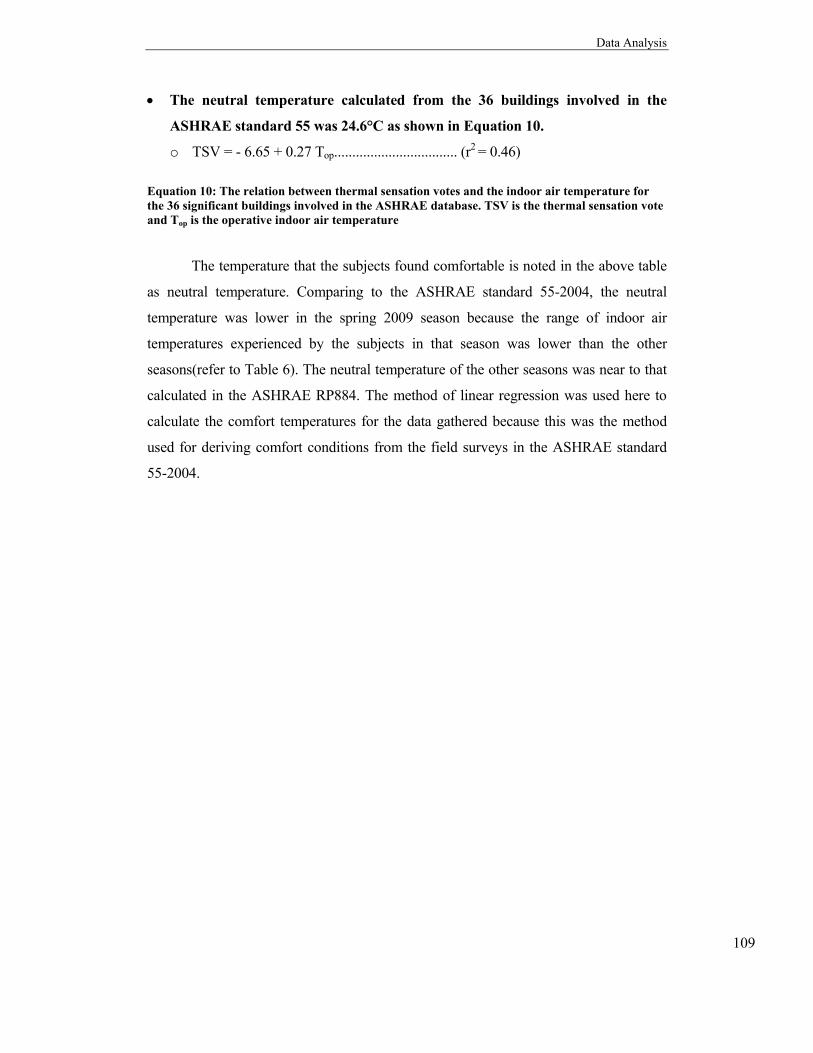
Data Analysis
109
• The neutral temperature calculated from the 36 buildings involved in the
ASHRAE standard 55 was 24.6°C as shown in Equation 10.
o TSV = - 6.65 + 0.27 Top.................................. (r2 = 0.46)
Equation 10: The relation between thermal sensation votes and the indoor air temperature for the 36 significant buildings involved in the ASHRAE database. TSV is the thermal sensation vote and Top is the operative indoor air temperature
The temperature that the subjects found comfortable is noted in the above table
as neutral temperature. Comparing to the ASHRAE standard 55-2004, the neutral
temperature was lower in the spring 2009 season because the range of indoor air
temperatures experienced by the subjects in that season was lower than the other
seasons(refer to Table 6). The neutral temperature of the other seasons was near to that
calculated in the ASHRAE RP884. The method of linear regression was used here to
calculate the comfort temperatures for the data gathered because this was the method
used for deriving comfort conditions from the field surveys in the ASHRAE standard
55-2004.

Studying the Adaptive Comfort Model A Case Study in Arid Climate: Cairo, Egypt
CHAPTER ONE RESEARCH OVERVIEW
CHAPTER TWO LITERATURE REVIEW
CHAPTER THREE OBJECTIVES AND METHODOLOGY
CHAPTER FOUR DATA ANALYSIS
CHAPTER FIVE DISCUSSION
CHAPTER SIX CONCLUSION


Studying the Adaptive Comfort Model A Case Study in Arid Climate: Cairo, Egypt
CHAPTER FIVE DISCUSSION
This chapter comments on the results and the data analyzed from the previous
chapter. It compares the outcome to other research work done in the same field. The
implication of the findings in terms of enhancing the existing adaptive comfort standard
is also discussed.
5.1 FREQUENCY OF VOTES AND THEIR DISTRIBUTION
The votes gathered from the four field experiments were distributed among the
naturally ventilated buildings and the mixed mode buildings. The naturally ventilated
buildings resulted in 2689 votes (84.5 % of total votes) and the mixed mode buildings
resulted in 495 votes (15.5 % of total votes). The number of votes in any of the four
field experiments conducted in the naturally ventilated buildings throughout the four
different seasons exceeded 600 votes in each field experiment, while the number of
votes resulted from the field experiments conducted in the mixed mode buildings did
not exceed 200 votes in any of the four field experiments.
This led to the ability of treating the experiments conducted in the naturally
ventilated buildings as four separate field studies in the calculations and statistical
analysis. The small number of votes resulted from the field experiments conducted in
the mixed mode buildings led to gathering the votes resulted from similar seasons;
autumn 2007 and autumn 2008 represented the autumn season while spring 2008 and
spring 2009 represented the spring seasons, to represent a set of data valid for
calculations and statistical analysis.
The distribution of votes among different space types showed that the study
mainly represented students, where 1702 votes came from students occupied lecture
halls (53.5 % of total votes), 1083 votes came from students occupied drawing halls and
computer labs (34 % of total votes), this means that 87.5 % of the votes came from
students. The number of votes representing employees in their offices was 399 votes
(12.5 % of total votes). If results from this study are to be generalized this means that

Discussion
113
the study mainly represented students in their occupied spaces, more studies are needed
to know the opinion and behaviour of employees.
5.2 THERMAL SENSATION VOTES AND THEIR DISTRIBUTION
AMONG INDOOR AIR TEMPERATURES
Regression of thermal sensation as a dependent variable on indoor air
temperature as an independent variable was performed for both building types; this
resulted in the graphs shown in Figure 56 and Figure 57.
Figure 56: Thermal sensation across indoor air temperature of naturally ventilated buildings
Figure 57: Thermal sensation across indoor air temperature of mixed mode buildings
y = 0.203x ‐ 4.672
‐0.50
0.00
0.50
1.00
1.50
2.00
2.50
3.00
20 22 24 26 28 30 32 34 36 38 40
Mean thermal sen
sation
Indoor air temperature °C
y = 0.183x ‐ 4.023
‐0.50
0.00
0.50
1.00
1.50
2.00
20 22 24 26 28 30
Mean thermal sen
sation
Indoor air temperature °C

Chapter Five
114
The red lines indicate the upper limits (0.5) of 90% thermal acceptability
according to the PMV model, and this limit coincides with 26°C in naturally ventilated
buildings and the same limit coincides with 25°C in mixed mode buildings. This
indicates that the occupants of naturally ventilated buildings accepted higher indoor air
temperatures than occupants of mixed mode buildings.
The relation between thermal sensation and indoor air temperature resulted in
Equation 11 for naturally ventilated buildings and in Equation 12 for mixed mode
buildings.
TSV = 0.2039 Tin – 4.6724…………………………….r2 = 0.937
Equation 11: The regression of mean thermal sensation vote (TSV) on indoor air temperature (Tin) for naturally ventilated buildings
TSV = 0.1832Tin – 4.0235…………………………….r2 = 0.685
Equation 12: The regression of mean thermal sensation vote (TSV) on indoor air temperature (Tin) for mixed mode buildings
The equations relating the thermal sensation to indoor air temperature in this
research are different from those obtained from the Pakistan project, as Equation 13
shows the results from the Pakistan project (Nicol, et al. 1999)
TSV = 0.151Tg + 0.11
Equation 13: The regression of mean thermal sensation vote (TSV) on indoor globe temperature (Tg) for Pakistan project
On average, mean thermal sensation changed one unit every 5 degrees of indoor
air temperature, whereas in Pakistan project a 6.5 degree change in the indoor globe
temperature was needed to shift mean thermal sensations by one unit, this indicate that
the occupants in this research were less able to adapt to their indoor environment than
their counterparts in the Pakistan project. This finding is reversed compared to the
ASHRAE RP884 project, where the equation indicating the relation between thermal
sensation and indoor operative temperature is shown in Equation 14, the ability of

Discussion
115
occupants to adapt to their indoor environment in this research is more than the findings
from the ASHRAE RP884 project.
TSV = 0.27Top - 6.65
Equation 14: The regression of mean thermal sensation vote (TSV) on indoor operative temperature (Top) for naturally ventilated buildings in the ASHRAE RP884 project
The slope of the regression line between the comfort vote and the mean indoor
temperature is related not just to the sensitivity to temperature change but also to the
extent to which longer –term adaptations have been made to offset its effect, thus the
Pakistan project assume that without adaptation the slope of the regression line would
be 0.3. The actual slope is less than this value and this implies that the difference is
absorbed by the ability of people to adapt.
5.3 THERMAL NEUTRALITY OBTAINED FROM SENSATION
VOTES AND PREFERENCE VOTES
Thermal neutrality is defined as the indoor temperature most closely with a
mean thermal sensation vote of zero (neutral), where warm buildings had warm
neutralities and vice versa. This is shown in section 4.19, from this section the
observation support the notion that building occupants’ thermal ideals are influenced by
their thermal experiences both indoors and outdoors.
Preferred temperature for a particular building did not necessarily coincide with
thermal neutrality, and this semantic discrepancy was also found in the ASHRAE
RP884 project, where preference was depressed below neutrality in warm climates and
elevated above neutrality in cold climates (i.e. people preferred to feel cooler than
neutral in warm climates, and warmer than neutral in cold climates.) The same is found
in this research, as it represented warm climates, the preferred temperatures in both
building types was below the neutral temperature calculated; this is shown in Figure 58
for naturally ventilated buildings and in Figure 59 for mixed mode buildings by solving
the two regression lines giving a value of 21.73°C for preferred temperature in mixed
mode buildings. The difference in naturally ventilated buildings is about 0.5 °C, and in
mixed mode buildings is about 0.7 °C.

Chapter Five
116
Figure 58: Preferred temperature in naturally ventilated buildings
Figure 59: Preferred temperature in mixed mode buildings
5.4 ACCEPTANCE VOTES
Thermal acceptability for this research was obtained directly from the occupants
who answered “acceptable” to the questionnaire when asked whether their thermal
conditions were acceptable or not. The percentage of actual unacceptable votes for each
degree indoor air temperature in both buildings was plotted as a function of the indoor
air temperature as shown in Figure 60.
0%10%20%30%40%50%60%70%80%90%
100%
202122232425262728293031323334353637383940
Percen
tage of votes
Indoor air temperature °C
Want cooler
Want warmer
y = 0.063x ‐ 0.888
y = ‐0.063x + 1.888
0%10%20%30%40%50%60%70%80%90%
100%
20 21 22 23 24 25 26 27 28 29 30
Percen
tage
of votes
Indoor air temperature °C
Want cooler
Want warmer
Linear (Want cooler)
Linear (Want warmer)

Discussion
117
Figure 60: The percentage of unacceptable votes for each degree indoor air temperature in both types of buildings
The findings from the previous graph indicate the up to 26 °C we can obtain
about 80% acceptability in both types of buildings. This finding coincides with that
from another research conducted in a similar context in Tunis, were 80 % of the votes
found the indoor thermal conditions acceptable for temperatures between 16 °C and
26.5 °C (Bouden and Ghrab 2005).
These findings differed from another study based on the ASHRAE database
included all ASHRAE studies in which thermal acceptability was measured seeking to
determine the acceptability threshold in these buildings (Zhang, Arens and Pasut 2010).
Figure 61 and Figure 62 show combined naturally ventilated buildings and mixed mode
buildings results, separating winter and summer seasons as the indoor operative
temperatures are quiet different in both seasons. In winter, the upper limit at which
acceptability drops below 80% occurs at 27.5 °C. In summer, the upper threshold at
which acceptability drops below 80% occurs at 30%, 2 K above the limit in winter.
This results shows that there is a high adaptation potential for a so wide
temperature range.
0%
10%
20%
30%
40%
50%
60%
70%
80%
90%
100%
20 21 22 23 24 25 26 27 28 29 30 31 32 33 34 35 36 37 38 39 40
Percen
tage of u
naccep
table votes
Indoor air temperature °C
Naturally ventilated
Mixed mode

Chapter Five
118
Figure 61: Acceptability against temperature at the workstation; winter; NV and MM buildings in the ASHRAE database, ((Zhang, Arens and Pasut 2010)
Figure 62: Acceptability against temperature at the workstation; summer; NV and MM buildings in the ASHRAE database, (Zhang, Arens and Pasut 2010)

Discussion
119
5.5 CLO VALUE AND THE SOCIAL CONCERNS
The success in achieving thermal comfort over a wide range of temperatures is
attributable to adaptive mechanism; one of the most important adaptive opportunities is
the flexibility of clothing in a certain community. Table 17 shows the number of
garments worn throughout the study in both building types classified by the
corresponding indoor air temperature. A pair of socks is reckoned as one garment as is a
pair of sandals or shoes. The most common number of garments worn in both types of
buildings is four and five pieces. This refers to t-shirt, trouser, socks and shoes
describing the four pieces, the five pieces could be achieved by wearing a veil or a body
and wearing both will lead to six worn garments.
Table 17: The number of garments worn throughout the study in both building types classified by corresponding indoor air temperature
3 4 5 6 7 821 3.9% 32.3% 35.6% 14.8% 6.3% 6.9%22 1.4% 34.0% 50.0% 10.8% 2.4% 1.4%
23 4.4% 25.7% 46.9% 21.2% 1.8%24 5.8% 45.9% 39.7% 7.9% .4% .4%
25 9.1% 44.9% 25.7% 7.0% 7.5% 5.9%26 11.1% 46.9% 32.4% 8.0% 1.6%
27 10.1% 42.3% 34.3% 10.6% 2.8%28 8.3% 48.0% 36.7% 6.3% .7%
29 11.8% 60.3% 22.1% 5.9%30 6.6% 48.4% 37.4% 6.6% 1.1%
31 11.5% 54.1% 31.1% 3.3%32 7.1% 50.5% 35.8% 5.2% .9% .5%
33 14.7% 58.8% 26.5%
35 19.0% 52.4% 19.0% 9.5%36 7.0% 60.5% 30.2% 2.3%
Total 7.7% 43.7% 35.7% 9.1% 2.4% 1.5%21 56.0% 32.0% 12.0%
22 8.8% 50.0% 35.3% 5.9%23 9.4% 44.7% 31.8% 10.6% 2.4% 1.2%
24 7.3% 51.2% 32.9% 7.3% 1.2%25 9.3% 47.7% 37.2% 5.8%
26 14.5% 56.4% 20.0% 7.3% 1.2% .6%28 33.3% 61.1% 5.6%
Total 11.1% 51.7% 28.3% 7.5% 1.0% .4%
Building Type
Naturally Ventilated
MIxed Mode
Percentage of number of garments wornIndoor Air Temperature

Chapter Five
120
The difference in the number of garments underestimates the real difference,
because it takes no account of the weight of garments. Although the checklist
describing the clothes worn by the subjects included different weight but the judgment
of different people on the weight and length of their clothes is different. One of the
problems that evolved while calculating the clo value of the garments is the presence of
some pieces that have no reference in the literature, this is for example included the clo
value of a veil, body, abaya and flip flop.
The clo value of a veil was taken as a medium head cover found in the Pakistan
project (Nicol, et al. 1999) its value was calculated as 0.07 clo. The clo value of a body
was estimated to be as a blouse, the heavy weight body was given the value of 0.25 clo
and the light weight body was given the value of 0.20 clo. The abaya was treated as a
long dress with long sleeves, the heavy weight abaya was given the value of 0.47 clo
and the light weight abaya was given the value of 0.33 clo. The flip flop was given the
same value as an opened sandal 0.02 clo. These values are a trial to estimate the values
of garments found in the Egyptian context and are not found in the ASHRAE list (refer
to Appendix B), an attempt was made to measure the clo value of these traditional
clothing but it was found that such an attempt is difficult and not easy to be made within
the scope of this work.
The value of the mean clothing insulation “clo” in the different building types
across the four seasons of the study was around 0.6 clo, and this value is related to the
social concerns, short garment are not accepted in the Egyptian context, this is why
there are lower clo values recorded in the western context mainly in Europe where the
clo value may reach to 0.5 clo and 0.4 clo which is not common in the Egyptian
context.
Clo value varies with the outdoor temperature, the relation between the clo
value and outdoor temperature in the naturally ventilated buildings in this research is
described in Equation 15 . The same analysis has been led by de Dear (de Dear, Brager
and Cooper 1997), he has found the expression found by regression and given by
Equation 16 . In the Tunisian context (Bouden and Ghrab 2005) the same analysis led
to the expression found in Equation 17 . The difference is that in the Egyptian context
the coefficient gradient of the outdoor temperature is lower this is due to the social

Discussion
121
concerns, where in the Egyptian context short and light transparent clothes are not
socially accepted.
Clo = - 0.015 Tout + 1.008……………….. (r2 = 0.12)
Equation 15: The relation between the clo value and outdoor temperature in the Egyptian context
Clo = - 0.04 Tout + 1.73 ……………….. (r2 = 0.18)
Equation 16: The relation between the clo value and outdoor temperature in the ASHRAE database
Clo = - 0.038 Tout + 1.33 ……………….. (r2 = 0.49)
Equation 17: The relation between the clo value and outdoor temperature in the Tunisian context
5.6 ASHRAE ADAPTIVE MODEL AND THE RESULTS FROM THE
STUDY
The outcome of the study was compared to the Adaptive comfort model. The
blue line in Figure 63 shows the regression of the indoor air temperature on the mean
outdoor air temperature. This data resulted from the votes of thermal sensation “just
right” that represent the comfort neutrality in naturally ventilated buildings.
Indoor air temperature = 11.729 + 0.633 Mean outdoor temperature, (r2= 0.69)
The red line represents the equation of the adaptive comfort model implemented
in the ASHRAE Standard 55-2004, the equation was:
Indoor air temperature = 17.8 + 0.31 Mean monthly outdoor temperature
It is obvious from the outcome that subjects in the study could bear higher
indoor temperatures compared to the temperatures set in the standard.
The adaptive comfort model is a relation between mean outdoor air temperature
and the corresponding acceptable indoor air temperatures. The data concerning the
naturally ventilated buildings in the global database were extracted separately, forming

Chapter Five
122
a subgroup depending only on naturally ventilated buildings. The statistical analysis
underlying the model considered each building as the unit of analysis, and a weighted
analysis followed, where the number of votes in each building represented the weight.
Figure 63: The blue line represent the outcome of the study, it is the regression of the indoor air temperature on the mean outdoor air temperature for the thermal sensation votes “just right” of the naturally ventilated buildings. The red line represents the adaptive comfort standard implemented in the ASHRAE 55-2004
Only statistically significant at (p < 0.05) buildings (data points) were
considered, forming the data on which the Adaptive Comfort Model was based upon.
This criterion in the selection of the database forming the model resulted in 36
significant naturally ventilated building out of 44 naturally ventilated buildings, with
almost 8900 subjective votes. The buildings selected covered seven climatic zones, the
type of each climatic zones and the number of buildings covering each zone are listed in
Table 2.
The following section proposes the idea of thinking in developing a variable
standard depending on different climatic zones. To better explain the idea of the
proposed development, it is necessary to state the limits of the model that are stated in
the ASHRAE -55 -2004. The limits of the adaptive comfort model are the boundaries
shown in the graph implemented in the ASHRAE Standard-55, section 5.3(refer to
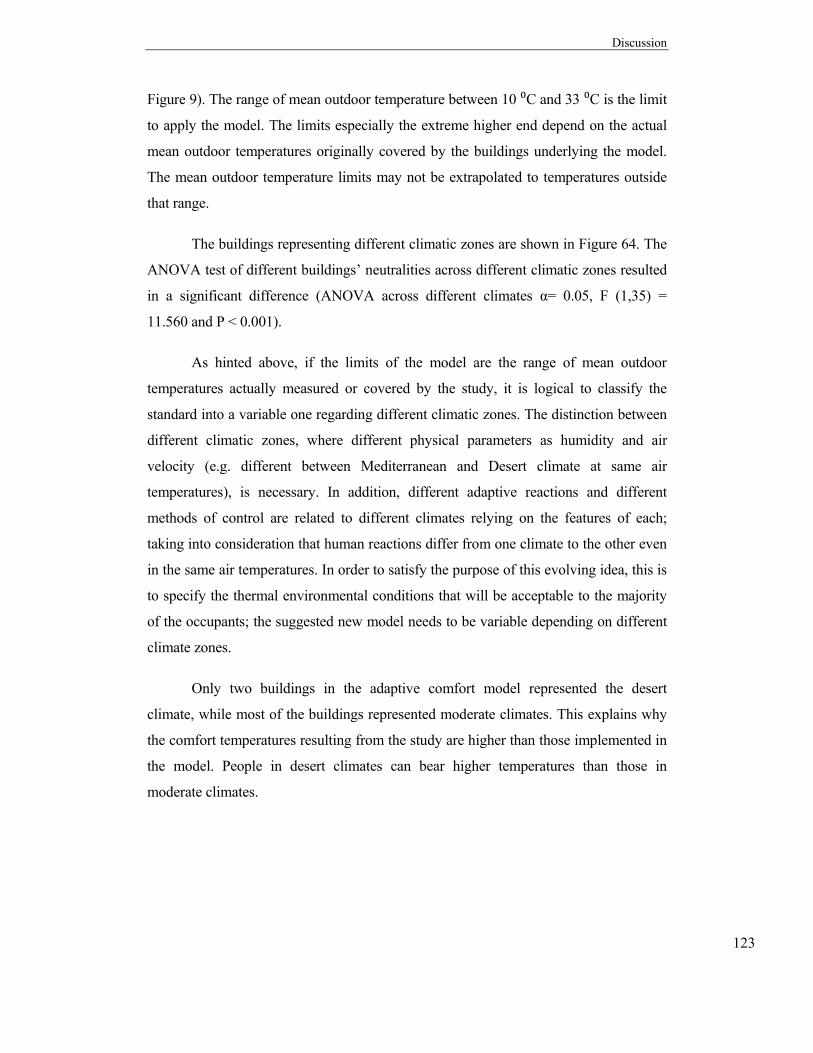
Discussion
123
Figure 9). The range of mean outdoor temperature between 10 ⁰C and 33 ⁰C is the limit
to apply the model. The limits especially the extreme higher end depend on the actual
mean outdoor temperatures originally covered by the buildings underlying the model.
The mean outdoor temperature limits may not be extrapolated to temperatures outside
that range.
The buildings representing different climatic zones are shown in Figure 64. The
ANOVA test of different buildings’ neutralities across different climatic zones resulted
in a significant difference (ANOVA across different climates α= 0.05, F (1,35) =
11.560 and P < 0.001).
As hinted above, if the limits of the model are the range of mean outdoor
temperatures actually measured or covered by the study, it is logical to classify the
standard into a variable one regarding different climatic zones. The distinction between
different climatic zones, where different physical parameters as humidity and air
velocity (e.g. different between Mediterranean and Desert climate at same air
temperatures), is necessary. In addition, different adaptive reactions and different
methods of control are related to different climates relying on the features of each;
taking into consideration that human reactions differ from one climate to the other even
in the same air temperatures. In order to satisfy the purpose of this evolving idea, this is
to specify the thermal environmental conditions that will be acceptable to the majority
of the occupants; the suggested new model needs to be variable depending on different
climate zones.
Only two buildings in the adaptive comfort model represented the desert
climate, while most of the buildings represented moderate climates. This explains why
the comfort temperatures resulting from the study are higher than those implemented in
the model. People in desert climates can bear higher temperatures than those in
moderate climates.

Chapter Five
124
Figure 64: The different buildings of different climatic zones incorporated into the Adaptive Comfort Standard of ASHRAE standard 55-2004

Studying the Adaptive Comfort Model A Case Study in Arid Climate: Cairo, Egypt
CHAPTER ONE RESEARCH OVERVIEW
CHAPTER TWO LITERATURE REVIEW
CHAPTER THREE OBJECTIVES AND METHODOLOGY
CHAPTER FOUR DATA ANALYSIS
CHAPTER FIVE DISCUSSION
CHAPTER SIX CONCLUSION

126

Studying the Adaptive Comfort Model A Case Study in Arid Climate: Cairo, Egypt
CHAPTER SIX CONCLUSION
The study screened three educational buildings in the Greater Cairo Region, two
of them are naturally ventilated and the third is mixed mode. The study focused on the
academic calendar and the months included in the study were February, March, April,
May, July, November and December. Both students and employees participated in the
study. Spaces included drawing halls, lecture spaces and employees’ rooms. The next
section presents a brief review of the most important findings of the study, and relates
these findings to the adaptive theory. The last section will discuss the areas in which
research is needed.
6.1 FINDINGS AND IMPLICATIONS
The methodology followed in data gathering was effective and proved its
coincidence with other research work. The physical environment were monitored using
a set of 10 data loggers. Using the Nomad portable weather station in some days of the
field studies revealed that the difference between the air temperature and the radiant air
temperature did not exceed one degree Celsius. This justified considering the air
temperature measured by the data loggers as the operative temperature, as operative
temperature is approximated by the simple average of the air temperature and mean
radiant temperature.
In addition, the measurements showed that the air velocity didn’t exceed 0.06
m/sec in all the spaces even when using ceiling fans and that was why the air velocity
was not measured in the field studies. The data loggers were distributed over the whole
space and were placed on the working plane with a stand to adjust their heights to the
same level as the students’ heads.
The data collected from a paper-based survey filled by the subjects at the end of
their classes formed the main database of the study, using this technique resulted in a
huge number of documents to be entered to the statistical analysis program which took
a long time for the data entry. But this method is probable in the case of subjects

Chapter Six
128
moving from one space to another and in the case of aiming to obtain a large number of
votes at the same time from each space.
Clothing insulation is a form of physical adaptation that was examined in one of
the questions found in Appendix E.The Clo values for every individual respondent were
calculated from the clothing garments pointed out by each. The database adopted in the
standards lack values corresponding to items of clothing used in Egypt especially the
exact values for the veil (Hijab) and Abaya. Even a study concerning the clothing area
factors of typical Arabian Gulf ensembles did not provide these values. The veil is
mainly made of a large variety of fabrics and colors used as an Islamic head cover to
conceal female hair. The Abaya is a traditional silk or wool loose cloak, reflecting the
female religious belief, covering the whole body except for the face, palms of hands and
toes. Another shortage in the available resources was the clo value of flip-flop slippers.
The traditional language for comfort questionnaires is English, and translation to
other languages is not easy as the terms used may have different meanings than the ones
used in the English Language questionnaire. In order to overcome such issues and to
examine the clarity of semantics, the questionnaire was tested in Karlsruhe on five
people whose mother tongue was Arabic, the native language in Egypt. In comfort
votes, semantic differential scales are the most popular and are highly-recommended.
This type of scaling allows for easy conversion of the results into interval numerical
scales. The thermal sensation was assessed using a seven-point scale which is in line
with the common practice of many psychological scales. Besides, it is the most
common in this field, which means that it will be easily compared to the results of other
field studies in this area of research.
In the case of assessing thermal sensation the seven point scale, 3=very warm,
2=warm, 1=slightly warm, 0=neutral, -1=slightly cool, -2=cool and -3 very cool was
used. The semantics used differed from that in the ASHRAE scale to facilitate
translation to the Arabic language. In particular, the scale is different in the naming of
the two extreme values compared to the ASHRAE scale. The word “hot” and “cold”
were avoided, and semantics expressing the levels of being cool or warm were used
instead as it was easier in translation to choose such a system of progression. The

Conclusion
129
Arabic language doesn’t contain two different words for cool versus cold or for warm
versus hot, which made it more practical to use the semantics for slightly cool, cool and
very cool as well as using slightly warm, warm and very warm.
The percentage of thermal sensation votes for the central categories (-1, 0, 1) of
the ASHRAE scale didn’t differ between mixed mode and naturally ventilated buildings
in autumn. Air conditions are not used during this period of the year, which resulted in
similar indoor conditions for both types of buildings. This percentage differed in spring
as a result of using air conditions.
The study showed that the percentage of acceptance for the central categories (-
1, 0, 1) on the ASHRAE Scale represented more than 80% in both types of buildings,
which differed from the PMV-PPD model, and which is adopted in the ASHRAE
Adaptive Comfort Model. This might lead to the revision of the percentage of
acceptance of the central category on the ASHRAE scale by studying more field
surveys and incorporating a straightforward question about the acceptance of the indoor
thermal conditions in the questionnaire templates.
Regarding thermal acceptability, up to 26°C the research obtained about 80%
acceptability in both building types. This finding is similar to what was obtained from a
research conducted in Tunis, and differed from another study based on the ASHRAE
RP884 project, where in the study the limits of obtaining 80% acceptability occurred at
higher degrees.
The mean temperature for different thermal sensation categories in the autumn
seasons varied from the spring seasons showing the possibility of energy saving in
moderate thermal conditions, thereby encouraging the usage of naturally ventilated
buildings and incorporating mixed mode strategies in hot arid climates, as far as they
can meet modern expectations of thermal comfort.
The percentage of satisfaction from the indoor climate conditions was in general
higher in mixed mode buildings than in naturally ventilated buildings, although the
voting for thermal sensation was almost the same except in higher indoor temperatures

Chapter Six
130
above 26 °C, which shows the psychological effect of the presence of air conditions in
mixed mode buildings.
The study showed that in the same building the use of the space may affect the
comfort votes and the overall satisfaction. The voting in spaces used as drawing halls
showed more satisfaction than voting coming from lecture halls, and voting from both
types of space were better than employees’ rooms. This shows the need to study the
effect of space design and usage on the comfort votes and user satisfaction.
The calculation of neutral temperatures showed the acclimatization of people to
the prescriptive climatic conditions, and that the neutral temperature is related to the
mean climatic conditions experienced by the population.
The equations relating the mean thermal sensation to indoor air temperature in
this research were different from those obtained from the Pakistan project, the Pakistan
project population were more able to adapt to the change in their indoor thermal
environment, while the population of this research were more able to adapt to their
indoor thermal environment than the population of naturally ventilated buildings
included in the ASHRAE RP884 project.
The preferred temperature in both building types was below the neutral
temperature calculated, the same as in ASHRAE RP884 project where preference was
depressed below neutrality in warm climates.
The outcome of the study showed the capability of the studied population to
adapt to hotter conditions than that set by the adaptive comfort model implemented in
the ASHRAE standard 55-2004.
At the same time the analysis of the adaptive comfort model showed the need of
revising the standards to be oriented towards different climatic zones, and to overcome
the shortage of data gathered concerning the hot arid climates. The classification of the
standard into different climate zones and setting a specific temperature range to each
climate may expand the range of acceptable temperatures and gives the opportunity for
more energy conservation.

Conclusion
131
6.2 FURTHER RESEARCH
The measured indoor air temperatures covered a range of 14 K corresponding to
mean outdoor temperatures of a range of 19 K. This range of thermal conditions
represents a wide range of indoor thermal conditions. While the study showed the
influence of various types of adaptive behaviours on the sensation of comfort, research
is still needed in terms of in-depth quantification of these relationships. This requires
more knowledge on the particular characteristics of each building, construction
materials and also cultural and socio-economic issues.
The study involved a transverse survey; a longitudinal survey may confirm the
outcomes from the study and also will allow a precise quantification of issues like
various types of adaptive opportunities and their frequency.
The development of adaptive standards to be more adequate to the variety of
buildings, climatic and cultural situations in hot arid climates is needed.
The influence of non-thermal factors on thermal comfort votes should be
investigated and if possible quantified; this may include cultural and socio-economic
status, maintenance and decoration, privacy, personal aspirations and other factors.
The study of the relation between energy and thermal comfort implications is
needed, it is important to know the effect of various passive and mixed mode strategies,
as well as their costs. The study of increasing the efficiency of existing passive
techniques and development of new techniques is needed, this may require the research
to develop mixed mode techniques whether using local air conditioning devices or
using central systems.

References
References
Egyptian Climatic Authorities. The Classifications of Climatic Regions In Egypt
Based on CIBSE, England Adopted @ 1999. Printed Data for Upper Egypt Climatic
Regions, 1997.
ASHRAE. ASHRAE Standard 55-2004: Thermal Environmental Conditions for
Human Occupancy. American Society of Heating, Refrigerating and Air-Conditioning
Engineers, Inc., 2004.
Auliciems, A. "Effects of weather on indoor thermal comfort." International Journal
of Biometeorology, 1969: 147-162.
Auliciems, A. "Towards a Psycho-Physiological Model of Thermal Perception."
International Journal of Biometeorology, 1981: 109-122.
Baker, N., and M. Standeven. "Thermal comfort for free-running buildings." Energy
and Buildings, 1996: 175-182.
Benton, C.C., F.S. Bauman, and M.E. Fountain. "A field measurement system for the
study of thermal comfort." ASHRAE Transactions, 1990: 623-633.
Bouden, C, and N Ghrab. "An adaptive thermal comfort model for the Tunisian
context: a field study results." Energy and Buildings, 2005: 952–963.
Brager, G.S., and R. de Dear. "Thermal Adaptation in the Built Environment : a
Literature Review." Energy and Buildings, 1998: 83-96.
Brager, G.S., and R. de Dear. "Thermal adaptation in the built environment: A
literature review." Energy and Buildings, 1998: 83-96.

References
133
Brager, G.S., and R.J. de Dear. "Climate, Comfort, and Natural Ventilation: A new
adaptive comfort standard for ASHRAE Standard 55." Proceedings of Windsor 2001.
UK: Oxford Brookes University, 2001.
Brager, G.S., and R.J. de Dear. "Historical and cultural influences on comfort
expectations." Buildings,Culture and Environment: Informing Local nd Global
Practices, 2003: 176-201.
Brill, M., S.T. Margulis, E Konar, and BOSTI. Using Office Design to
IncreaseProductivity. Buffalo, N.Y.: Workplace Design and Productivity, Inc., 1984.
Busch, J.F. "A tale of two populations: Thermal comfort in air-conditioned and
naturally ventilated offices in Thailand." Energy and Buildings, 1992: 235-249.
Bush, J.F. "Thermal responses to the Thai office environment." ASHRAE
Transactions, 1990: 859-872.
Cena, K., and R. de Dear. "Thermal comfort and behavioural strategies in office
buildings located in a hot-arid climate." Journal of Thermal Biology, 2001: 409-414.
Charles, K.E. Fanger’s Thermal Comfort and Draught Models. Ottawa, Canada:
National Research Council of Canada, 2003.
CIBSE. Natural Ventilation in Non-domestic Buildings. London: Chartered Institute
of Building Services Engineers, 1997.
Corgnati, Stefano Paolo, Marco Filippi, and Sara Viazzo. "Perception of the thermal
environment in high school and university classrooms: Subjective preferences and
thermal comfort ." Building and Environment, 2007: 951-959.
de Dear, R., et al. A Field Study of Occupant Comfort and Office Thermal
Environments in a Hot-Humid Climate. Final report, ASHRAE RP-702, 1993.

References
134
de Dear, R., G. Brager, and D. Cooper. Developing an Adaptive Model of Thermal
Comfort and Preference. USA: ASHRAE RP-884, 1997.
de Dear, R.J., and A. Auliciems. "Validation of the predicted mean vote model of
thermal comfort in six Australian field studies." ASHRAE Transactions, 1985: 452-
468.
de Dear, R.J., and G.S. Brager. "Developing an adaptive model of thermal comfort
and preference." ASHRAE Transactions, 1998: 1-18.
de Dear, R.J., and G.S. Brager. "Thermal comfort in naturally ventilated buildings,
revisions to ASHRAE standard 55." Energy and Buildings, 2002: 549-561.
de Dear, R.J., K.G. Leow, and S.C. Foo. "Thermal comfort in the humid tropics: Field
experiments in air conditioned and naturally ventilated buildings in Singapore."
International Journal of Biometeorology, 1991: 259-265.
Fanger, P.O. "Calculation of Thermal Comfort: Introduction of a Basic Comfort
Equation." ASHRAE transaction 73 (1967): 111.
—. Thermal Comfort. Copenhagen: Danish Technical Press, 1970.
—. Thermal Comfort: analysis and applications in environmental engineering. New
York: McGraw-Hill, 1972.
Fanger, P.O., and G. Langklide. "Interindividual differences in ambient temperatures
preferred by seated persons." ASHRAE Transactions, 1975: 140-147.
Fanger, P.O., J. Hojbjere, and J.O.B. Thomsen. "Can winter swimming cause people
to prefer lower room temperatures?" Intrnational Journal of Biometerology, 1977: 44-
50.

References
135
Gagge, A.P., A.C. Burton, and H.C. Bazett. "A practical system of units for the
description of the heat exchange of man with his environment." Science, 1941: 428-
430.
Gossauer, Elke, and Andreas Wagner. "Post -occupancy Evaluation and Thermal
Comfort: State of the Art and New Approaches." Advances in Building Energy
Research, 2007: 151-175.
Gravetter, Frederick J, and Larry B Wallnau. Statistics for the Behavioral Sciences.
USA: Wadsworth Thomson Learning, 2004.
Griffiths, I. Thermal comfort studies in buildings with passive solar features; field
studies: report to the Commission of the European Community. UK: ENS35 090 ,
1990.
Havenith, G., I. Holmer, and K. Parsons. "Personal factors in thermal comfort
assessment: clothing properties and metabolic heat production." Energy and
Buildings, 2002: 581-591.
Hoof, J.V. "Forty years of Fanger's model of thermal comfort: comfort for all?"
Indoor Air, 2008: 182-201.
Humphreys, M.A. "Outdoor temperatures and comfort indoors." Building Research &
Information, 1978: 92-105.
Humphreys, M.A., and J.F. Nicol. "Field Studies of Indoor Thermal Comfort and the
Progress of the Adaptive Approach." Advances in building energy research, 2007: 55-
88.
Humphreys, M.A., and J.F. Nicol. "The validity of ISO-PMV for predicting comfort
votes in everyday thermal environments." Energy and Buildings, 2002: 667-684.
Humphreys, Michael A. "Field Studies in Thermal Comfort compared and applied."
Building Services Engineer, 44, 1976: 5-27.

References
136
McIntyre. "Seven point scales of warmth." Building Services Eng.,45, 1978: 215-226.
McIntyre, D.A. Indoor climate. London: Applied Science Publishers Ltd, 1980.
McNall, P.E., J. Jaax, F.H. Rohles, R.G. Nevins, and W.E. Springer. "Thermal
comfort (thermally neutral) conditions for three levels of activity." ASHRAE
Transactions, 1967: I.3.1-I.3.14.
Nevins, R.G., F.H. Rohles, W. Springer, and A.M. Feyerherm. "A temperature-
humidity chart for thermal comfort of seated persons." ASHRAE Transactions, 1966:
283-291.
Nicol, F. Thermal Comfort - A Handbook for Field Studies Toward an Adaptive
Model. UK: University of East London, 1993.
Nicol, Fergus, and Michael Humphreys. "Derivation of the adaptive equations for
thermal comfort in free-running buildings in European standard EN15251." Building
and Environment, 2010: 11-17.
Nicol, J. F., and M. A. Humphreys. "Adaptive thermal comfort and sustainable
thermal standards for buildings." Energy and Buildings, 2002: 563-572 .
Nicol, J.F., and M.A. Humphreys. "Thermal comfort as part of a self-regulating
system." Building Research and Information, 1973: 174-179.
Nicol, J.Fergus, Iftikhar A. Raja, Arif Allaudin, and Gul Najam Jamy. "Climatic
variations in comfortable temperatures: the Pakistan projects ." Energy and Buildings,
1999: 261-279 .
Olesen, S., and P.O. Fanger. "Can man be adapted to prefer lower ambient
temperature?" Proceedings of the 5th International Congress for Heating, Ventilating
and Air_Conditioning. Copenhagen, Denmark: Copenhagen, Denmark: Polyteknisk
Forlag, 1971. 27-40.

References
137
Oseland, N. "Predicted and reported thermal sensation in climate chambers, offices
and homes." Energy and Buildings, 1995: 105-115.
Oseland, N.A. "A review of thermal comfort and its relevance to future design models
and guidance." Facing the Future. Yourk,Uk.: Proceedings of the BEPAC Conference
Building Environmental Performance, 1994. 205-216.
Oseland, N.A., and M.A. Humphreys. Trends in Thermal Comfort Research. UK:
BRE, 1994.
Schiller, G.E. "A comparison of measured and predicted comfort in office buildings."
ASHRAE Transactions, 1990: 609-622.
Wagner, Andreas, Cornelia Moosmann, Thomas Gropp, and Elke Gossauer. "Thermal
Comfort under Summer Climate Conditions - Results from a Survey in an Office
Building in Karlsruhe, Germany." Comfort and Energy Use in Buildings, Geting them
right. Windsor, United Kingdom: Network for Comfort Energy Use in Buildings
(NCEUB), 2006.
Yaglou, C.P. "Indices of Comfort. In physiology of Heat Regulation and the Science
of Clothing." L.H. Newburgh (ed.), Saunders, Philadelphia, 1949: 277-287.
Zhang, Hui, Edward Arens, and Wilmer Pasut. "Thresholds for indoor thermal
comfort and perceived air quality." Proceedings of Conference: Adapting to Change:
New Thinking on Comfort Cumberland Lodge. Windsor, UK: London: Network for
Comfort and Energy Use in Buildings, 2010.

138

139
Appendix A: Metabolic Rates

140
Appendix B: Clothing Insulation Values

141

142
Appen
Study
Greeti
This re
Unive
existin
comfo
Therm
researc
This is
throug
comfo
To co
of air i
reflect
throug
We ca
work i
The qu
researc
Last lett
Last lett
Last lett
Last thr
ndix C: The co
y of buildin
ings and after,
esearch follow
rsity of Karlsru
ng and new bui
ortable internal
mal comfort in
ch team condu
s one of these r
ghout the year w
ort inside the bu
onduct the searc
inside the spac
ting your asses
ghout the year t
all all whom ar
is voluntarily, b
uestions conce
cher intends to
ter of your first na
ter of your family
ter of your place o
ree numbers of you
over page of t
g’s indoor c
ws a several rese
uhe in German
ildings to find
environment.
the building is
ucted many rese
researches, and
within this bui
uilding that wi
ch, one of the r
ce, and asking a
ssment of the in
the same proce
re present to pa
but is very imp
rn personal op
o conserve your
ame
name
of birth
ur telephone numb
the questionna
climate:
earch work car
ny. The researc
solutions for c
s one of the rea
earch work aim
d its objective i
lding. This is t
ll be statistical
researchers wil
at the same tim
ndoor climate a
edure will be re
articipate in thi
portant for the
inion and expe
r privacy by gi
ber
aire.
rried out by “F
ch team workin
ombining ratio
asons for user s
med at improvi
is to find the ra
to be done by c
lly analyzed.
ll take measure
me your particip
and comfort w
epeated in the s
is scientific res
success of the
erience of the u
iving each pers
--
--
--
--
BTA” institute
ng in the Institu
onalizing energ
satisfaction ins
ng the internal
ange of therma
collecting some
ements of temp
pation, by fillin
ithin the space
summer.
search, your pa
research and o
user within the
son a code con
----------------------
----------------------
----------------------
----------------------
e, Architectura
ute is interested
gy consumption
side the buildin
l climate in pub
al comfort to th
e information o
perature, humid
ng out a questi
e. To obtain inf
articipation in t
obtaining reliab
space, therefo
sisting of:
--------------
--------------
---------------
---------------
l Department,
d in the study o
n and
ng that the
blic buildings.
he user
on thermal
dity and speed
onnaire
formation
this research
ble conclusions
re the
of
s.

If you
in the
answe
Appen
تجمع
و ايجاد
بمجال
في
جل
ي ھذا
ئج
ظ
have any ques
event of any fu
ered as soon as
ndix D: The tr
اجل ايجاد حلول
باجراء كثير من
و الھدف منه ھو
علومات الخاصة ب
داخل الفراغ، و ف
ل الفراغ و من اج
ن الى الاشتراك في
حث و استنتاج نتا
الباحثين على حفظ
stions during fi
urther question
possible,
ranslated cove
“buildin
مة و الجديدة من ا
قوم فريق البحث
ه الابحاث السابقة
ق جمع بعض المع
و سرعة الھواء د
خلي و راحته داخل
لمتواجدينا عو كل
يق نجاح البح تحق
لذلك حرصا من ا
---------
---------
---------
---------
illing out the qu
ns, you can sen
er page of the
ng physics and
اسة المباني القائم
خل المبنى لذلك يق
ذا البحث احد ھذه
تم ذلك عن طريق
حرارة، الرطوبة
تقيمه للمناخ الداخ
ندع. صل الصيف
ھام جدا من اجل
دم داخل الفراغ، ل
----------------
----------------
----------------
----------------
143
uestionnaire, y
nd to: amgad@
questionnaire
d technical se
لعمل بالمعھد بدر
.حة
تياح المستخدم داخ
يعد ھذ .نى العامة
تخل ھذا المبنى وي
.ھا احصائيا
خاصة بدرجات الح
ستبيان يعبر عن ت
ھذا البحث في فص
تطوعي، و لكنه
و تجربة المستخد
ود مكون من
---
---
---
---
you will find th
fbta.uni-karlsru
e.
:ى
”ervices معھد
يھتم فريق ال ،انيا
بيئة داخلية مريح
احد اسباب ارتن
اخ الداخلي بالمبان
لى مدار العام داخ
يتم تحليلھ ي سوف
باخذ القياسات الخ
ملئ اسعن طريق
العام سيتم تكرار
ھذا البحث عمل
الراي الشخصي و
طاء كل شخص كو
الخاص بك
he researcher in
uhe.de, questio
الداخلي بالمبنى
ة ابحاث يقوم بھا
عة كارلسروه بالما
ك الطاقة و توفير
خل المبنى تعد من
ف الى تحسين المنا
رية للمستخدم على
و التيخل المبنى
وم احد الباحثين ب
اركة المستخدم، ع
ومات على مدار ا
تبر مشاركتك فى
ھا،الاسئلة تخص
صيتك، سيتم اعط
ر من اسمك
من اسم الوالد
من محل ميلادك
م من رقم الھاتف
n response, and
ons will be
راسة عن المناخ
حية طيبة و بعد،
بع ھذا البحث عدة
سم العمارة بجامع
ن ترشيد استھلاك
راحة الحرارية داخ
لابحاث التي تھدف
جال الراحة الحرار
راحة الحرارية داخ
جراء البحث، يقو
س الوقت يتم مشا
حصول على معلو
بحث العلمي ، تعت
مكن الاعتماد عليھ
صوصيتك و شخص
الحرف الاخير
الحرف الاخير
الحرف الاخيرم
اخر ثلاث ارقام
d
در
تح
يتب
قس
بين
الر
الا
مج
الر
لاج
نفس
الح
البح
يمك
خص
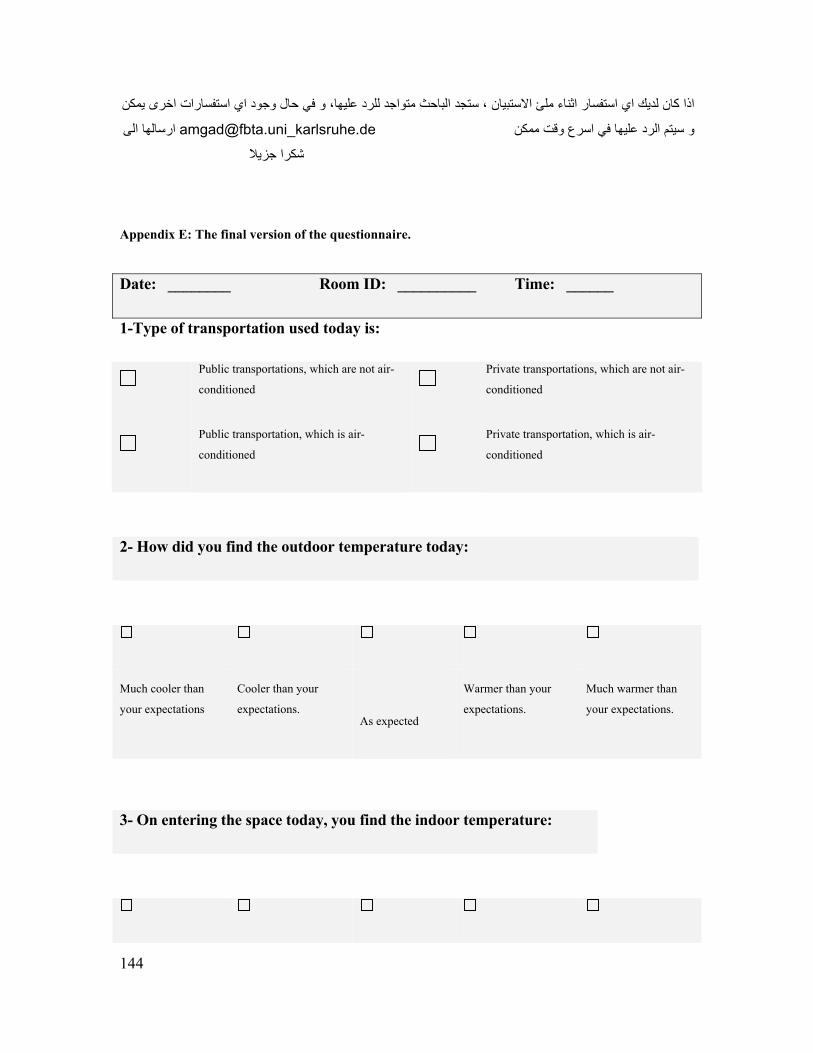
144
استفسارات اخرى يمكناذا كان لديك اي استفسار اثناء ملئ الاستبيان ، ستجد الباحث متواجد للرد عليھا، و في حال وجود اي
و سيتم الرد عليھا في اسرع وقت ممكن [email protected]_karlsruhe.de ارسالھا الى
شكرا جزيلا
Appendix E: The final version of the questionnaire.
Date: ________ Room ID: __________ Time: ______
1-Type of transportation used today is:
Public transportations, which are not air-
conditioned
Private transportations, which are not air-
conditioned
Public transportation, which is air-
conditioned
Private transportation, which is air-
conditioned
2- How did you find the outdoor temperature today:
Much cooler than
your expectations
Cooler than your
expectations.
As expected
Warmer than your
expectations.
Much warmer than
your expectations.
3- On entering the space today, you find the indoor temperature:

145
Much cooler than
your expectations
Cooler than your
expectations.
As expected
Warmer than your
expectations.
Much warmer than
your expectations.
4- How do you feel now?
Very Cold Cold Slightly cold Just right Slightly hot hot Very hot
5- You prefer the room temperature to be:
Colder Slightly colder As it is Slightly hotter hotter
6- In general, the room temperature now, is:
Acceptable Not acceptable
7- How do you feel the humidity in the space now?
Very dry
(very low)
Dry
(low)
Slightly dry
(slightly low)
Just right
Slightly
humid
(slightly high)
Humid
(high)
Very humid
(very High)
8- You prefer the humidity inside the space to be:
Lower humidity Slightly Lower As it is Slightly Higher Higher humidity

146
humidity humidity
9- The humidity now, is:
Acceptable Not acceptable
10- In general, you feel the atmosphere is: (Please select only one answer)?
Stifling Fresh
Muggy Pleasantly dry
Dusty Purely
Unpleasant smell Others Please specify …………………….
11- Did you do any of the following in order to change the indoor climate to satisfy
your needs?
Open windows Close windows
Open doors Close doors
Open inside curtains Close inside curtains
Open outside blinds Close outside blinds
Open ceiling fans Close ceiling fans
Open portable fans Close portable fans
Asking someone else to do any of the previous actions Asking someone else to do any of the previous
actions
Putting on more cloth Taking off some cloth

147
Changing the set point of the air conditioner others
Please specify
…………………
12- The means available for you to control the indoor climate are considered:
unsatisfying satisfying
13- You are wearing:
Head covering: veil cap
Others: ……………………………………………………………………..
Garment,
Shirts / Blouses
T-shirt / short sleeve Heavy weight Light weight
T-shirt / long sleeve Heavy weight Light weight
Shirt short sleeve Heavy weight Light weight
Shirt long sleeve Heavy weight Light weight
Blouse long sleeve Heavy weight Light weight
Blouse short sleeve Heavy weight Light weight
Body Heavy weight Light weight
Abaya Heavy weight Light weight
Others: ………………………………………………………………
Short skirt Heavy weight Light weight
Long skirt Heavy weight Light weight
Short Dress /short sleeves Heavy weight Light weight
Long Dress /short sleeves Heavy weight Light weight
Long Dress / short sleeves Heavy weight Light weight
Long Dress / long sleeves Heavy weight Light weight
Trousers Jeans
Short trouser Heavy weight Light weight
Normal trouser Heavy weight Light weight
Pullover / jackets pullover Heavy weight Light weight
light suit jacket
Heavy suit jacket
Others: ……………………………………………………………………

148
socks Normal short socks Heavy weight Light weight
Ankle socks Heavy weight Light weight
Long socks Heavy weight Light weight
others …………………………………………………………………….
shoes sandal open Close
shoes Thin soled Thick soled
Sports shoe Flip flop
Others: ……………………………………………………………………..
14- Within the last hour, you:
Drink something hot
Drink something cold
Eat something hot
Eat something cold
15- Overall, how satisfied are you with the indoor climate conditions (temperature, air
velocity, humidity etc...)?
Very unsatisfied unsatisfied satisfied Very satisfied
16- What were you doing during the last hour?
Sitting
(relaxed) Sitting
(working/studying) Standing Walking indoors Walking
outdoors Others, Please
specify
Last 30
minutes
From 30
to60
minutes

149
17- Personal information:
Gender: Man Women
Age: less than 25 years 26 to 35 36 to 45 more than 46
Thanks very much .....
Appendix F: The translated version of the final questionnaire.
_______ :_____ الوقت ______ رقم الغرفة________ التاريخ
عامة مكيفة :إستخدامك اليوم كان لوسيلة مواصلات عامة غير مكيفة
خاصة مكيفة خاصة غير مكيفة
_______________________________________ اخرى
؟اليوم وجدت درجة الحرارة الخارجية كيف
كنت أبرد كثيرا مما
تتوقعھا
كنت أبرد مما
تتوقعھا كما كنت تتوقعھا
كنت أدفئ مما
تتوقعھا
كنت أدفئ كثيرا مما
تتوقعھا
:المكان اليوم، وجدت درجة الحرارة داخل المكان ھذا عند دخولك
كنت أبرد كثيرا مما
تتوقعھا
كنت أبرد مما
تتوقعھا كما كنت تتوقعھا
كنت أدفئ مما
تتوقعھا
كنت أدفئ كثيرا مما
تتوقعھا

150
؟كيف تجد درجة حرارة المكان الان
رد جدااب رداب بعض الشئ رداب
ةمعتدل
بعض حار
الشئ
حار
حار جدا
:تفضل ان تكون درجة الحرارة داخل المكان
بعض الشئ ابرد ابرد بعض الشئ ادفئ كما ھي ادفئ
:درجة الحرارة داخل المكان الان تعد
غير مقبولة مقبولة
:داخل المكان الان كيف تجد الرطوبة
جاف
بعض الشئ جاف
معتدل
بعض الشئ رطب
رطب
:تفضل ان تكون الرطوبة داخل المكان

151
رطوبةاقل اكثر رطوبة بعض الشئ اكثر كما ھي بعض الشئ قل ا
:بوجه عام، الرطوبة داخل المكان الان تعد
مقبولة غير مقبولة
عديبوجه عام، الھواء داخل الفراغ الان
خانق صافي
مُغم, رطب حار جاف لطيف
نقَِيّ مغبر ترابي
______________________________اخرى رائحته كريھة
ير المناخ الداخلي ؟يتغل ھل قمت بعمل اى من الاشياء التالية
غلق شباك فتح شباك
غلق باب فتح باب
غلق ستائر داخلية فتح ستائر داخلية
مراوح سقف فتح مراوح سقف غلق
سؤال شخص اخر للقيام باى من الافعال
السابقة تغير درجة التكيف
بعض الملابس خلع لبس ملابس اضافية

152
__________________________________________________________ اخرى
احة لك لتتحكم في المناخ الداخلي تعدتالامكانيات الم تشعر انبوجه عام،
مرضية غيرمرضية
انت ترتدى الان
غطاء راس نوعه كاب طرحه
اخرى
ثقيل خفيف تى شيرت بكم قصير
الجزءالعلوي ملابس
ثقيل خفيف تى شيرت بكم طويل
ثقيل خفيف بكم قصير بلوزة
ثقيل يف خف بكم طويل بلوزة
ثقيل خفيف قميص بكم قصير
ثقيل خفيف بكم طويل قميص
بودي بكم قصير طويل بكم
ثقيل خفيف عباءة
ثقيل خفيف ربلوف
ثقيل خفيف جاكت
ثقيل خفيف بدله جاكت
الجزءالسفلي ملابس
ثقيل خفيف جونله قصيره
ثقيل خفيف جونله طويله
ثقيل خفيف بكم طويل فستان طويل
ثقيل خفيف بكم قصير فستان طويل
ثقيل خفيف بكم طويل -فستان قصير
ثقيل خفيف بكم قصير -رفستان قصي

153
جينز بنطلون
ثقيل خفيف قصير بنطلون
ثقيل خفيف بنطلون طويل
________________________________________ اخرى
ثقيل خفيف شراب عادي قصير
ثقيل شراب خفيف شراب حتى الركبه
ثقيل خفيف طويل فوق الركبه شراب
مغلق مفتوح صندل حذاء
نعل رفيع نعل سميك حذاء
رياضي حذاء شبشب
في خلال الساعة الاخيرة، ھل قمت بعمل شئ مما يلي
شرب مشروب ساخن
شرب مشروب بارد
اكل شئ ساخن
اكل شئ بارد
خلال الساعة الماضية، ماذا كنت تفعل؟
اخرىامشي خارج
المبنى
امشي داخل
المبنى واقف
اعمل، (جالس
)اذاكر مستكينجالس
دقيقة ٣٠آخر
دقيقة ٦٠حتى ٣٠من
رعة درجة الحرارة، الرطوبة، س( بوجه عام، ما مدى رضائك عن الاحوال المناخية داخل المكان ،
؟.......)الھواء
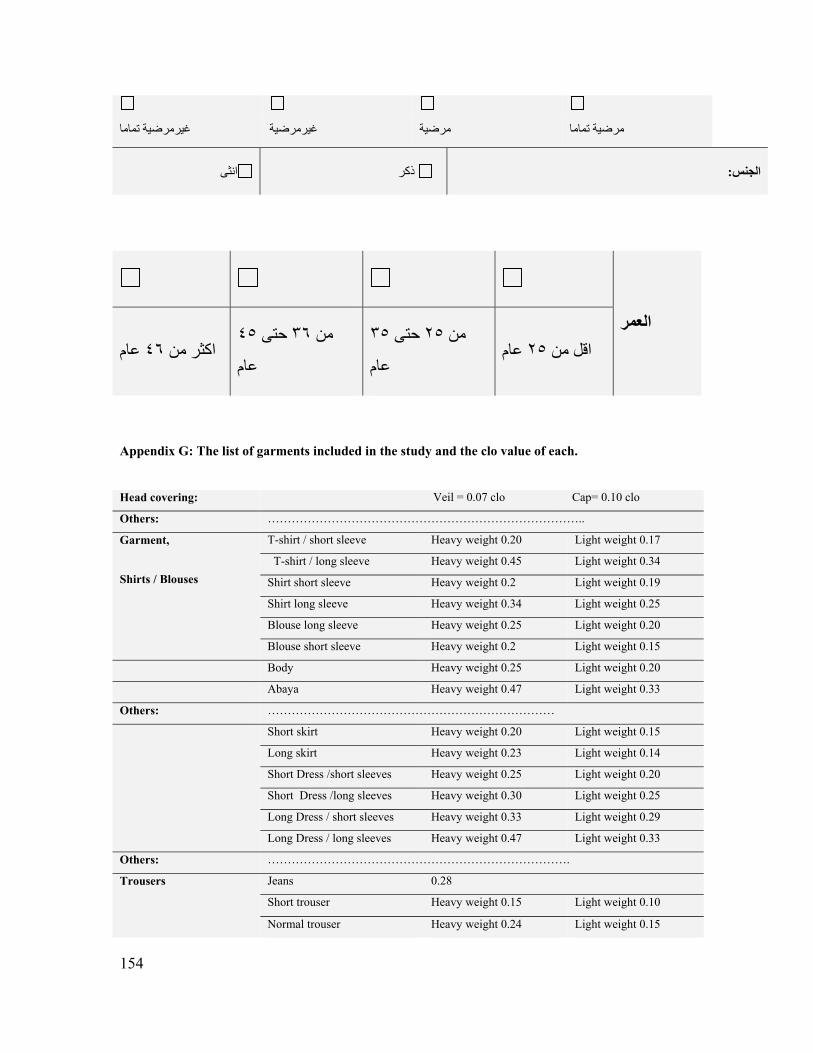
154
تماما غيرمرضية امامرضية تم مرضية غيرمرضية
:الجنس ذكر انثى
العمرعام ٤٦اكثر من
٤٥حتى ٣٦من
عام
٣٥حتى ٢٥من
عامعام ٢٥اقل من
Appendix G: The list of garments included in the study and the clo value of each.
Head covering: Veil = 0.07 clo Cap= 0.10 clo
Others: ……………………………………………………………………..
Garment,
Shirts / Blouses
T-shirt / short sleeve Heavy weight 0.20 Light weight 0.17
T-shirt / long sleeve Heavy weight 0.45 Light weight 0.34
Shirt short sleeve Heavy weight 0.2 Light weight 0.19
Shirt long sleeve Heavy weight 0.34 Light weight 0.25
Blouse long sleeve Heavy weight 0.25 Light weight 0.20
Blouse short sleeve Heavy weight 0.2 Light weight 0.15
Body Heavy weight 0.25 Light weight 0.20
Abaya Heavy weight 0.47 Light weight 0.33
Others: ………………………………………………………………
Short skirt Heavy weight 0.20 Light weight 0.15
Long skirt Heavy weight 0.23 Light weight 0.14
Short Dress /short sleeves Heavy weight 0.25 Light weight 0.20
Short Dress /long sleeves Heavy weight 0.30 Light weight 0.25
Long Dress / short sleeves Heavy weight 0.33 Light weight 0.29
Long Dress / long sleeves Heavy weight 0.47 Light weight 0.33
Others: ………………………………………………………………….
Trousers Jeans 0.28
Short trouser Heavy weight 0.15 Light weight 0.10
Normal trouser Heavy weight 0.24 Light weight 0.15

155
Others: …………………………………………………………………
Pullover / jackets pullover Heavy weight 0.25 Light weight 0.20
light suit jacket 0.36
Heavy suit jacket 0.42
Others: ……………………………………………………………………
socks Normal short socks Heavy weight 0.03 Light weight 0.02
Ankle socks Heavy weight 0.06 Light weight 0.03
Long socks Heavy weight 0.10 Light weight 0.03
others …………………………………………………………………….
shoes sandal Open 0.02 Close 0.03
shoes Thin soled 0.02 Thick soled 0.04
Flip flop 0.02 Sports shoe 0.03
Others: ……………………………………………………………………..
Appendix H: Indoor air temperature and mean outdoor air temperature.
Appendix I: The analysis of variance of the indoor air temperature for different building types, across the four seasons of the study.

156
season Sum of Squares df Mean Square F Sig.Between Groups
218.035 1 218.035 42.494 0.000
Within Groups 3,981.673 776 5.131Total 4,199.708 777Between Groups
247.164 1 247.164 23.370 0.000
Within Groups 7,107.264 672 10.576Total 7,354.428 673Between Groups
0.336 1 0.336 0.090 0.765
Within Groups 3,083.383 822 3.751Total 3,083.719 823Between Groups
146.635 1 146.635 11.915 0.001
Within Groups 11,149.515 906 12.306Total 11,296.149 907
ANOVAIndoor air temperature
Autumn 2007
Spring 2008
Autumn 2008
Spring 2009
Appendix J: The ANOVA test for the Humidity Preference of naturally ventilated buildings and the least significant difference (LSD) pair wise multiple comparison test.
ANOVA
Humidity Preference
Sum of Squares df Mean Square F Sig.
Between Groups 68.504 3 22.835 14.531 .000 Within Groups 4219.385 2685 1.571 Total 4287.888 2688


