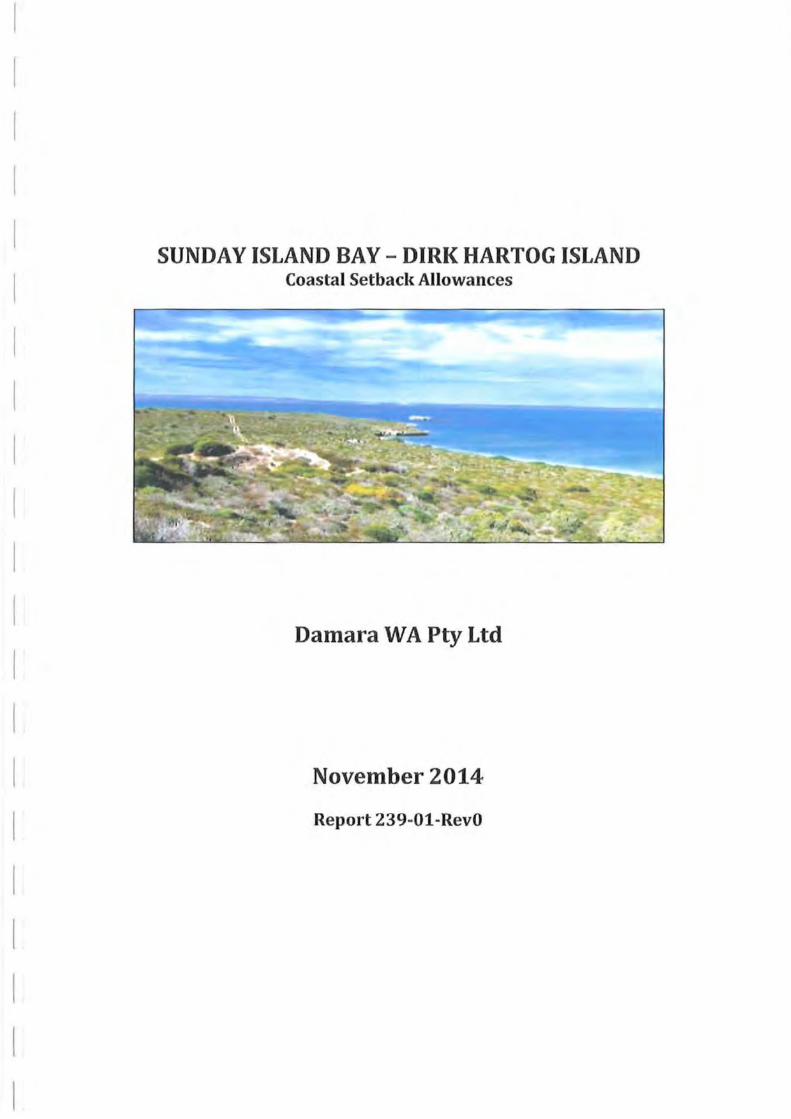
SUNDAY ISLAND BAY - DIRK HARTOG ISLAND Coastal Setback Allowances
Damara W A Pty Ltd
November 2014
Report239-01-Rev0
Damara WA Pty ltd
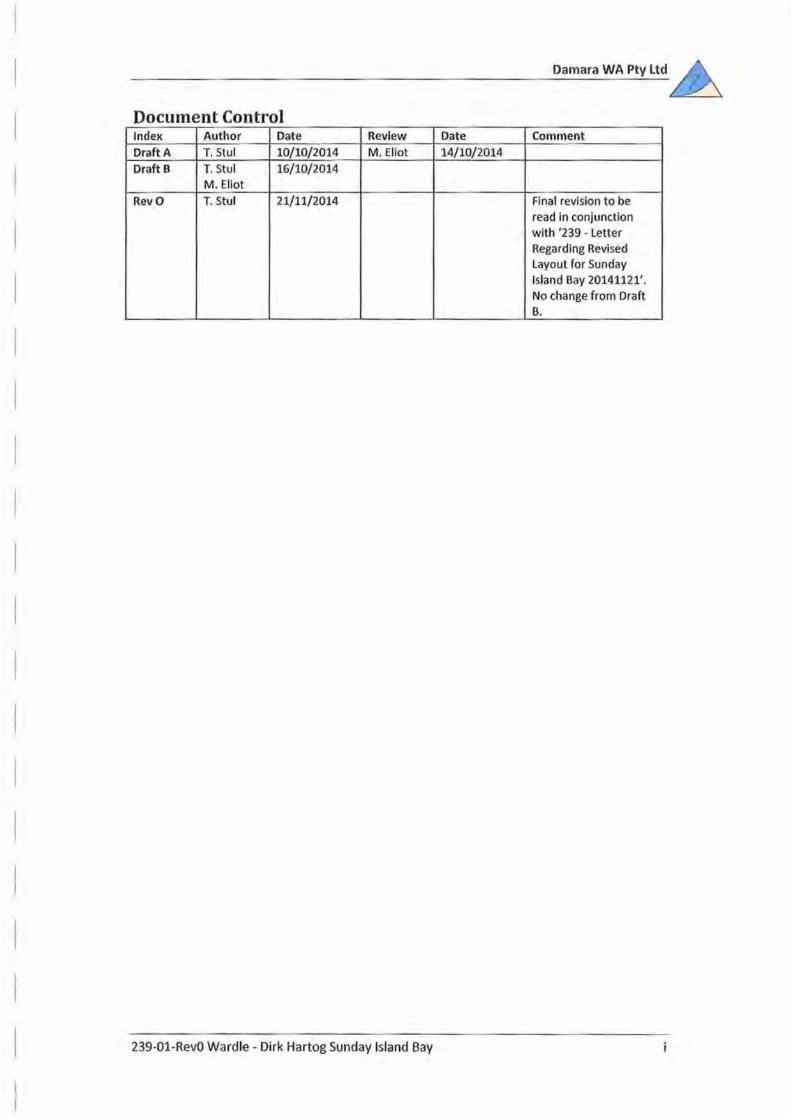
Document Control Index Author Date Review Date Comment Draft A T. Stul 10/10/2014 M. Eliot 14/10/2014 Draft B T. Stul 16/10/2014
M. Eliot Revo T. Stul 21/11/2014 Final revision to be
read in conjunction with '239 - Letter Regarding Revised Layout for Sunday Island Bay 20141121'. No change from Draft B.
239-01-RevO Wardle - Dirk Hartog Sunday Island Bay

Damara WA Pty ltd
Table of Contents 1. Introduction ............................................................................................................. 1
2. Setback Policy ........................................................................................................... 3
3. Default Assessn1ent of Schedule One ......................................................................... 4
4. Site Context ......... .. ........................................................................................... .. ...... 6
5. Revised Schedule One for Adaptive Hazard Assessment ........................................... 13
5.1. Storn1 Event (HSD, Sl and S4) ........................................ ............................ .. ............ 13
5.2. Chronic Erosion (52) ............................. ........... ... ...................................................... 17
5.3 . Response To Sea level Rise (53) ..... .................................... ....... .. , ........................... 19
5.4. Uncertainty .......................... ... ... .................. .. ......................................................... . 21
5.5. Revised Allowances for Erosion and Inundation .... .......... ... ...... ............................... 21
6. Recommendations ............................................................................ ................. ..... 25
7. References ............................................................................................................... 27
List of Figures Figure 1: Sunday Island Bay Site (Image: landgate 2007) ...... ................. .... ....... ................ .. ..... 1
Figure 2: Initial Site layout ............ ...... ...................................................................................... 2
Figure 3: Simple Measure of Distances on Site Layout ............................................................ 5
Figure 4: Bathymetry (Logan & Cebulski 1970) .......... .................................. ............................. 7
Figure 5: Site Geology (Butcher et al. 1984) ... ......................... .................................................. 8
Figure 6: Broad-Scale Bathymetry ......... ... ......................................... ........................................ 9
Figure 7: Focal Sediment Cells for Investigation (Source: landgate 2002) ............................. 10
Figure 8: Rock and Terrace Controls (Image: Google Earth 2013) ...................................... .... 11
Figure 9: Site Photo of Eastern Headland ...... .......... ................................................................ 11
Figure 10: Determining the Effective Fetch for Sunday Island Bay ......................................... 15
Figure 11: Selected profile for use in SBEACH Modelling .. .. .............................. .............. ......... 16
Figure 12: SBEACH Output for Artificial Extreme Event. ......................................................... 16
Figure 13: Historic Aerial Imagery 1972-2013 (Sources: landgate and GoogleEarth) .... .... .... 18
Figure 14: Mean Sea level for Carnarvon and Southern Oscillation Index {SOl) ........... ......... 19
Figure 15: Sea level Rise Allowance Time Series (Source: DoT 2.010) .................................... 21
Figure 16: Inundation Hazard of +4.7m AHD Inferred from 2m Contours ............. ...... .......... . 22
Figure 17: Erosion Setback According to Policy to 2070 ......................................................... 23
Figure 18: Method of Generating landward limit of Landforms or HSD+S1+S2 .................... 24
Figure 19: Recommended Erosion Setback Based on Landforms to 2070 ......... ... ......... ......... 24
List of Tables Table 1: Components of SPP2.6 Schedule One and possible refinements ................. .... .......... 4
Table 2: Characteristics of 'Direct Hit' Design Storms .... ... .......... .. ............... .................. ......... 13
Table 3: Evaluation of local Storm Surge Scenarios ......... ......... ................. .... ......................... 14
Table 4: Water levels associated with a Tropical Cyclone Event ............................................ 14
Table 5: Coastal Response to Sea level Rise ............... .......... ....... .......................................... 20
Table 6: Revised Components of SPP2.6 Schedule One .......................................................... 22
239-01-RevO Wardle- Dirk Hartog Sunday Island Bay ii
Damara WA Pty Ltd
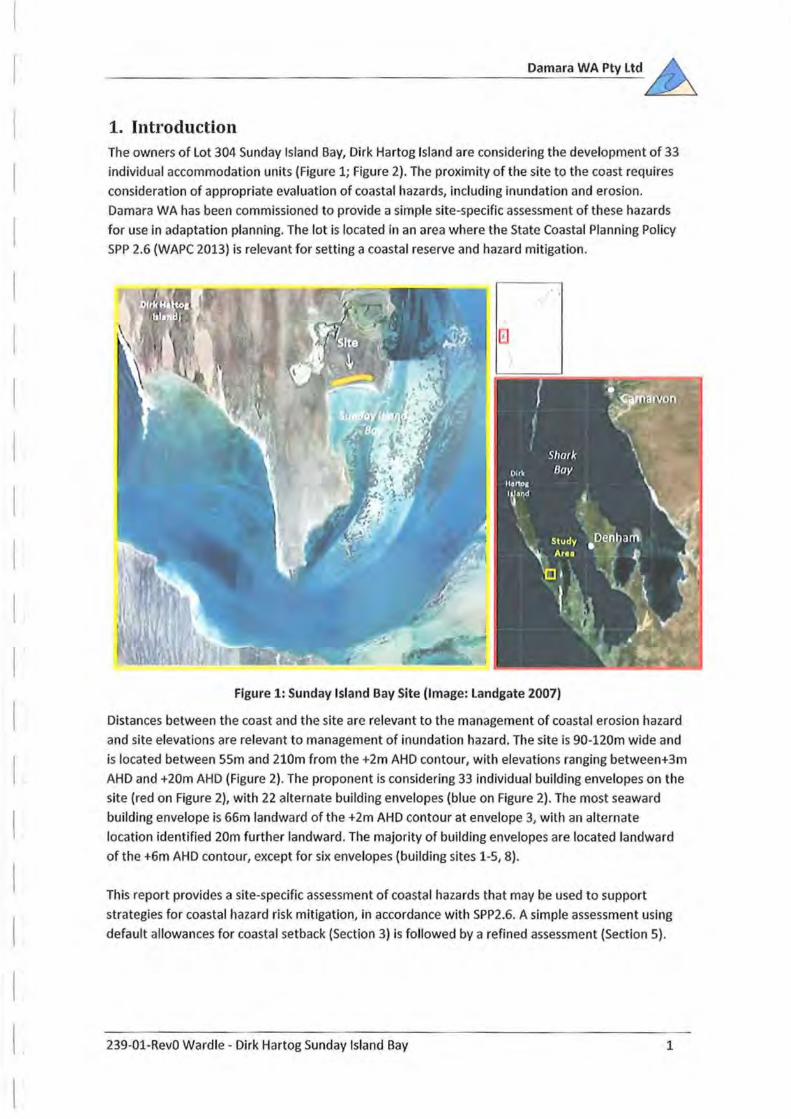
1. Introduction The owners of Lot 304 Sunday Island Bay, Dirk Hartog Island are considering the development of 33
individual accommodation units (Figure 1; Figure 2). The proximity of the site to the coast requires
consideration of appropriate evaluation of coastal hazards, including inundation and erosion.
Damara WA has been commissioned to provide a simple site-specific assessment of these hazards
for use In adaptation planning. The lot is located in an area where the State Coastal Planning Policy
SPP 2.6 (WAPC 2013) is relevant for setting a coastal reserve and hazard mitigation.
Figure 1: Sunday Island Bay Site (Image: landgate 2007)
Distances between the coast and the site are relevant to the management of coastal erosion hazard
and site elevations are relevant to management of inundation hazard. The site is 90-120m wide and
is located between SSm and 210m from the +2m AHD contour, with elevations ranging between+3m
AHD and +20m AHD (Figure 2) . The proponent is considering 33 individual building envelopes on the
site (red on Figure 2), with 22 alternate building envelopes (blue on Figure 2). The most seaward
building envelope is 66m landward of the +2m AHD contour at envelope 3, with an alternate
location identified 20m further landward . The majority of building envelopes are located landward
of the +6m AHD contour, except for six envelopes (building sites 1-5, 8).
This report provides a site-specific assessment of coastal hazards that may be used to support
strategies for coastal hazard risk mitigation, in accordance with SPP2.6. A simple assessment using
default allowances for coastal setback (Section 3) is followed by a refined assessment {Section 5) .
239-01-RevO Wardle- Dirk Hartog Sunday Island Bay 1
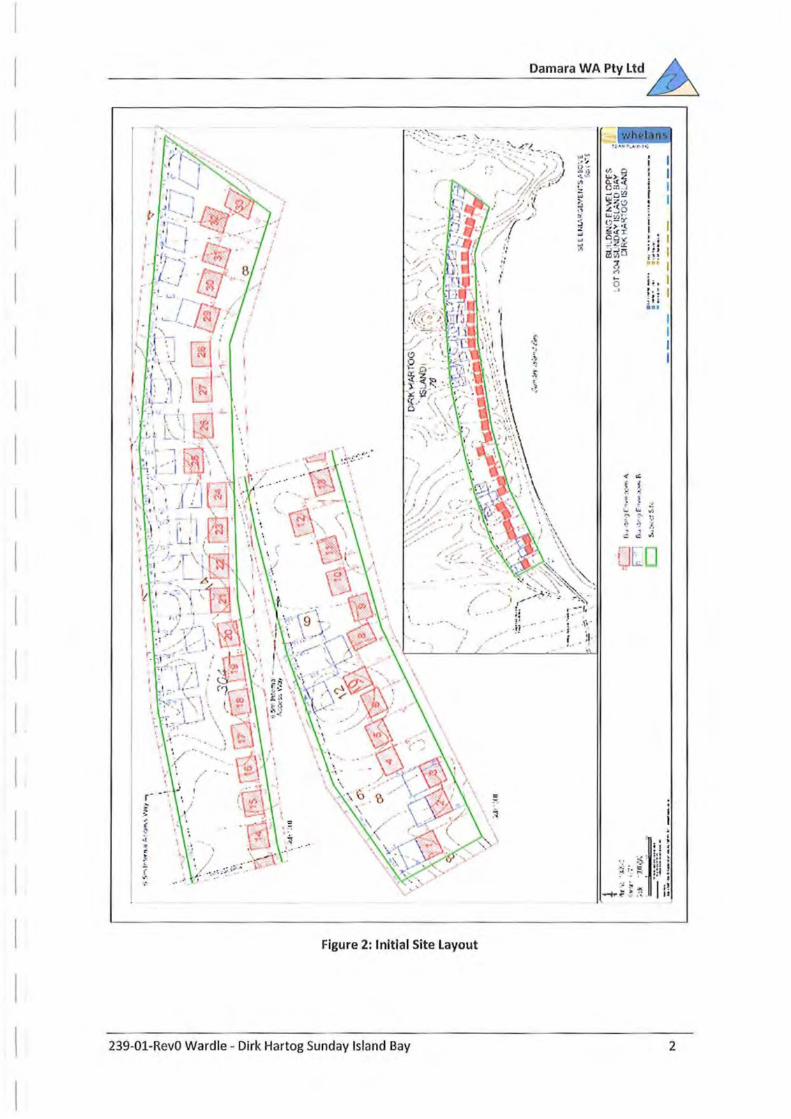
Figure 2: Initial Site Layout
239-01-RevO Wardle - Dirk Hartog Sunday Island Bay
Damara WA Pty ltd
-
. ~ ~ ..
~ "' ( I .· ~ .... .... "' ~ .,. ... ·: ·. " = ~ ~
2

Damara WA Pty ltd
2. Setbacl< Policy Coastal setbacks have been identified as one of the most effective forms of coastal hazard mitigation
on slowly varying coastlines, as the setback provides a buffer against short-term coastal fluctuations.
The approach acknowledges the natural tendency for erosion-recovery cycles and aims to avoid
expensive coastal protection works.
Guidance for development along the Western Australian coast is provided by relevant 'infrastructure
objectives' in the Coastal Zone Management Policy (WAPC 2001), including:
• Recognition of the dynamic nature of coastal environments and the consequences for
coastal development and use.
• Avoidance or mitigation of the impacts of natural hazards through intelligent siting and
design of infrastructure, based on ongoing scientific research.
The recommended approach towards achieving these objectives was outlined in the State Coastal
Planning Policy SPP No. 2.6 (WAPC 2013), which identified setbacks as a primary technique for the
mitigation of coastal hazards. The focus of the policy is coastal hazard assessment, management and
adaptation planning. The SPP 2.6 provided guidelines for the <Jssessment of development setbacks
and gave a suggested method of assessment for multiple shore types. The shore type most relevant
for Sunday Island Bay is discontinuous rocky coasts (Clause 4.6.3 of Schedule One).
SPP2.6 provides a simple technique in Schedule One for the evaluation of setback allowances for
physical processes, includes:
• HSD Horizontal Shoreline Datvm: active limit of shoreline under storm activity, which for
'Area 2' (WAPC 2013 Figure 1) is the peak steady water level (no runup) for the 100-year
recurrence interval storm.
• Sl Acute Erosion Allowance: cross-shore erosion associated w ith impact of a severe storm
sequence, with consideration of longshore erosion.
• S2 Chronic Erosion Allowance : horizontal erosion due to progressive loss of coastal
sediment, within 100 years. Projected using aerial photography with 1972 the earliest
available at Sunday Island Bay. Calculated as 100 times the historic annual rate of erosion.
• 53 Sea Level Allowance : coastal recession associated with climate change induced sea level
rise {Figure 16 of DoT 2010) . On a sandy coast this shou ld be 100 times the adopted sea level
rise value of 0.9m over a lOO-year timeframe or 90 metres.
• Uncertainty: <Jn additional 0.2m per year allowance for uncertainty on s<Jndy coasts.
• S4 Storm Surge Inundation Allowance: peak stead water level plus wave run up for a tropical
cyclone storm with a one-in-five hundred probability of being equalled or exceeded in any
given year.
A general case for calculation of an allowance for coastal processes Is described by SPP 2.6 Schedule
One, which is applicable to sandy coasts. This method of calculation is formu laic rather than process
based or landform-based, and in most cases is dominated by 53, with the application of a Bruun ratio
of 100:1 to sea level projections (Bruun 1962). The policy allows for consideration of adaptation
planning for sites located within the erosion or inundation hazard areas. Adaptation planning
requires an understanding of both likely and possible future scenarios, which may be separately
assessed using realistic and conservative models for coastal change.
239-01-RevO Wardle- Dirk Hartog Sunday Island Bay 3

Damara WA Pty Ltd
3. Default Assessrnent of Schedule One A simple assessment of setbacks for coastal hazards is based on existing datasets, default or
assumed values in Schedule One of SPP2.6 (WAPC 2013; Section 2), to determine the feasibility of
development on the site. Default values for Sl, 52, 53 and uncertainty have been applied (Table 1).
The HSD should represent the active limit of shoreline activity under a storm with a 100-year ARI
water level, excluding run up. For adjacent areas of Den ham (Wallace & Boreham 1990) and Monkey
Mia (MP Rogers & Associates 2004) the 100 year ARI event peak steady water level has been
estimated at +2.Sm AHD. This value has been used for this simple assessment as it was the only
available value for the area. lt was estimated through comparison of short water level datasets
collected simultaneously at Carnarvon and Denham in the 1980s, noting that data from Tropical
Cyclone Herbie (1988) was not captured. This level is based on the assumption that water levels at
Denham are 1.3 times larger than at Carnarvon. Refining the analysis of water levels during tropical
cyclones may change the HSD value, based on estimates of central pressure, track curvature and
speed, radius of maximum winds and coincidence with high tides (Damara WA 2009; Section 5.1) .
Table 1: Components of SPP2.6 Schedule One and possible refinements
Default (m) Refinement HSD Horizontal shoreline +2.5m AHD Estimate site-specific 100-year inundation peak
datum, limit of (Wallace & steady water levels (no runup) . shoreline in storm Doreham 1990) activity
51 Acute storrn response 40 Relatively sheltered area for waves. Estimate local wave forcing and water level conditions, and simulate storm response in the numerical model SBEACH.
52 Long-term response 20 Split into sections to account for rotation at the bay extents with minimal movement in the centre.. The extent is considered in terms of the rock control and Is likely to be tending to 0 as it fluctuates around a mean.
53 Sea-level rise response 90 Site does not require 100-year planning timeframe for 100 years as units are designed for retreat or removill (2070 is
0.4m, or 40m). Uncertainty 0.2m/year which Is 20 Determine If this is necessary on a site-specific
20m over 100 years. assessment. Could be removed based on providing more certainty through landform analysis.
$4 500-yr ARIInundatlon +4m AHD Estimate site-specific 500-year inundation levels event. Peak steady (PSWl + runup) . No properties are at an elevation water level + runup. <+4mAHD.
Set-back HSD + Sl +52+ 53+ 170m from uncertainty +2 .5m AHD
The allowance for inundation considers a 500-year recurrence interval tropical cyclone water level,
including run up and projected sea level rise. A simple estimate of +4m AHD is used to incorporate an
additional 0.3m water level compared to the lOO-year water level, O.Sm for extra sea level rise and a
0. 7m wave runup. This value provides a simple initial estimate to determine extent of site
susceptible to inundation hazard.
239-01-RevO Wardle- Dirk Hartog Sunday Island Bay 4
Damara WA Pty Ltd
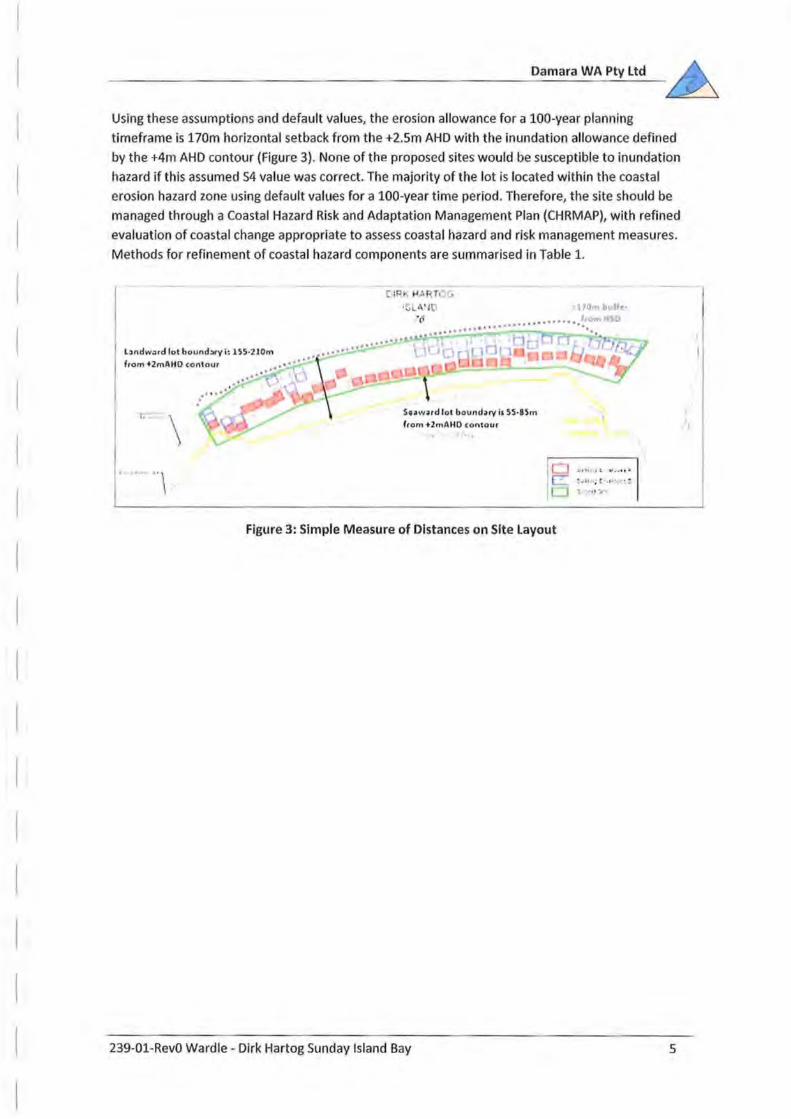
Using these assumptions and default va lues, the erosion allowance for a 100-year planning
timeframe is 170rn horizontal setback from the +2.5rn AHD with the inundation allowance defined
by the +4m AHD contour (Figure 3). None of the proposed sites would be susceptible to inundation
hazard if this assumed S4 value was correct. The majority of the lot is located within the coastal
erosion hazard zone using default va lues for a 100-year time period. Therefore, the site should be
managed through a Coastal Hazard Risk and Adaptation Management Plan (CHRMAP), with refined
evaluation of coastal change appropriate to assess coasta l hazard and risk management measures.
Methods for refinement of coastal hazard components are summarised in Table 1.
~ ~ , . r
S,•w•rd Jol bOUIHl~ty iJ !i5·85m from UmAiiD (Onlour
Figure 3: Simple Measure of Distances on Site Layout
239-01-RevO Wardle- Dirk Hartog Sunday Island Bay
ltJ. bull • s
:.'l , ! 11 ~ .. ,, .. ..
5
Damara WA Pty Ltd
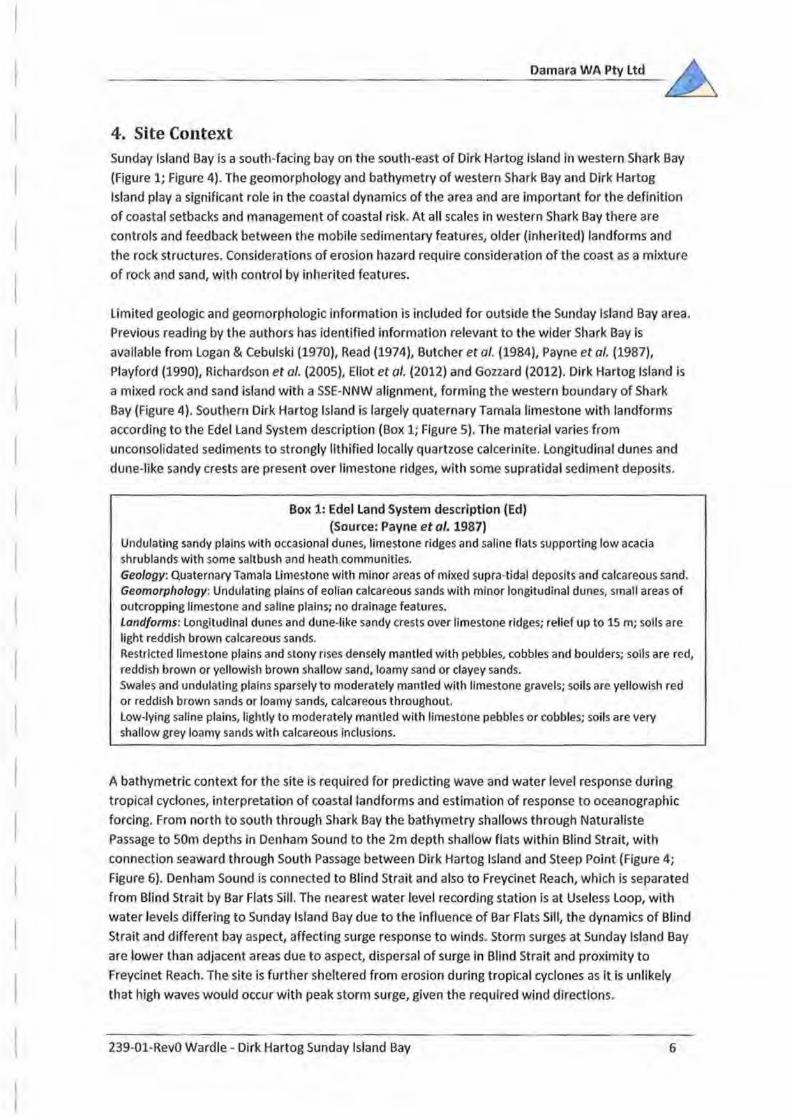
4. Site Context Sunday Island Bay is a south-facing bay on the south-east of Dirk Hartog Island in western Shark Bay
{Figure 1; Figure 4) . The geomorphology and bathymetrv of western Shark Bay and Dirk Hartog
Island play a significant role in the coastal dynamics of the area and are important for the definition
of coastal setbacks and management of coastal risk. At all scales in western Shark Bay there are
controls and feedback between the mobile sedimentary features, older (inherited) landforms and
the rock structures. Considerations of erosion hazard require consideration of the coast as a mixture
of rock and sand, with control by inherited features.
Limited geologic and geomorphologic information is included for outside the Sunday Island Bay area.
Previous reading by the authors has identified information relevant to the wider Shark Bay is
available from Logan & Cebulski (1970), Read {1974), Butcher et al. (1984), Payne et al. {1987),
Playford (1990), Richardson et al. (2005), Eliot et al. {2012) and Gozzard (2012). Dirk Hartog Island is
a mixed rock and sand island with a SSE-NNW alignment, forming the western boundary of Shark
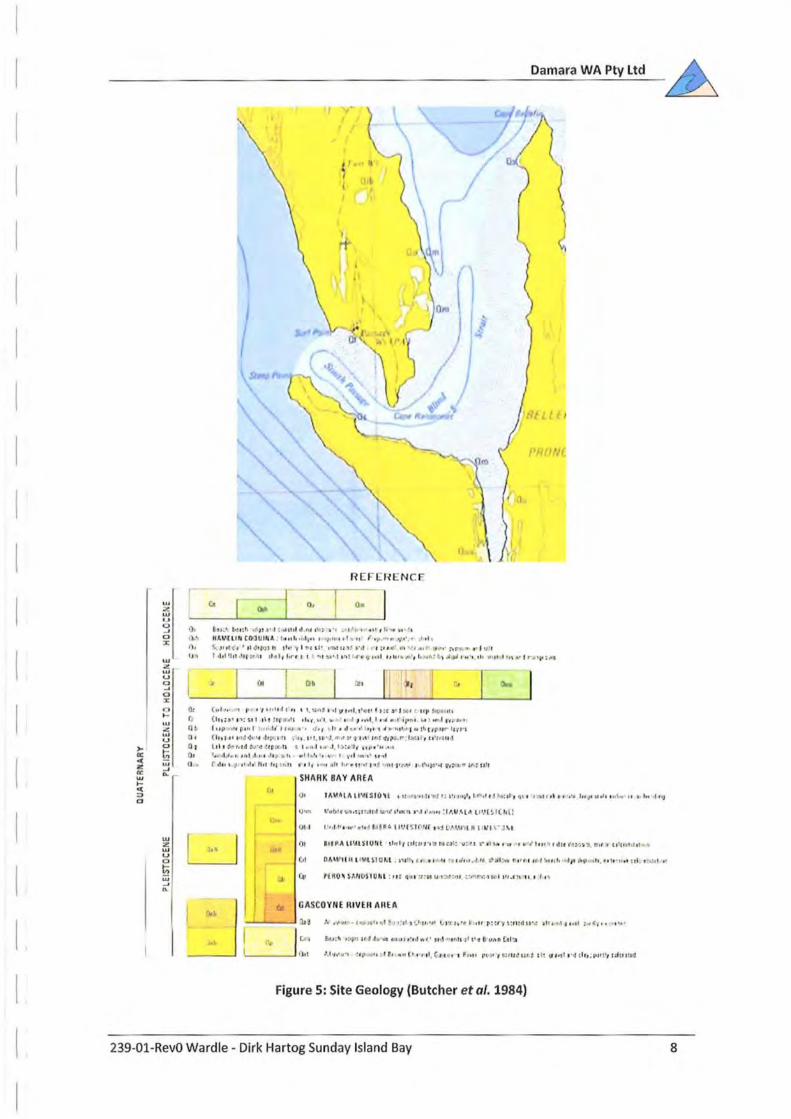
Bay (Figure 4). Southern Dirk Hartog Island is largely quaternary Tamala limestone with landforms
according to the Edel Land System description (Box 1; Figure 5). The material varies from
unconsolidated sediments to strongly lithified locally quartzose calcerinite . Longitudinal dunes and
dune-like sandy crests are present over limestone ridges, with some supratidal sediment deposits.
Box 1: Edelland System description (Ed) (Source: Payne et al. 1987)
Undulating sandy plains with occasional dunes, limestone ridges and sa line flats supporting low acacia shrublands with some saltbush and heath communities. Geology: Quaternary Tamala Limestone with minor areas of mixed supra· tidal deposits and calcareous sand. Geomorpllology: Undulating plains of eolian calcareous sands with minor longitudinal dunes, small areas of outcropping limestone and saline plains; no drainage features. Landforms: Longitudinal dunes and dune-like sandy crests over limestone ridges; relief up to 15 m; soils are light reddish brown calcareous sands. Restricted limestone plains and stony rises densely mantled with pebbles, cobbles and boulders; soils are red, reddish brown or yellowish brown shallow sand, loamy sand or clayey sands. Swales and undulating plains sparsely to moderately mantled with limestone gravels; soils are yellowish red or reddish brown sands or loamy sands, calcareous throughout. Low-lying saline plains, lightly to moderately mantled with limestone pebbles or cobbles; soils are very shallow grey lo<~my sands with calcareous Inclusions.
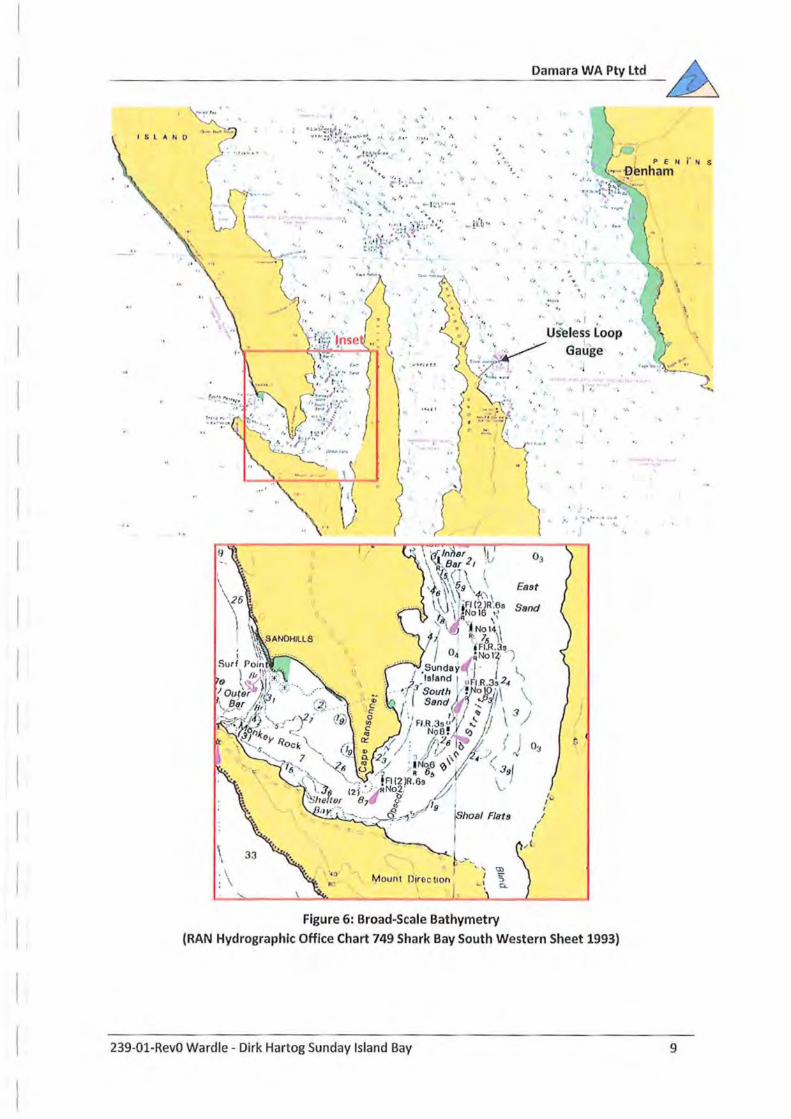
A bathymetric context for the si te is required for predicting wave and water level response during
tropical cyclones, interpretation of coastallandforms and estimation of response to oceanographic
forcing. From north to south through Shark Bay the bathyrnetry shallows through Naturaliste
Passage to 50m depths in Denham Sound to the 2m depth shallow flats within Blind Strait, with
connection seaward through South Passage between Dirk Hartog Island and Steep Point (Figure 4;
Figure 6). Denham Sound is connected to Blind Strait and also to Freycinet Reach, which is separated
from Blind Strait by Bar Flats Sill. The nearest water level recording stat ion is at Useless Loop, with
water levels differing to Sunday Island Bay due to the influence of Bar Flats Sill, the dynamics of Blind
Strait and different bay aspect, affecting surge response to winds. Storm surges at Sunday Island Bay
are lower than adjacent areas due to aspect, dispersal of surge in Blind Strait and proximity to
Freycinet Reach. The site is further sheltered from erosion during tropical cyclones as it is unlikely
that high waves would occur with peak storm surge, given the required wind directions.
239-01-RevO Wardle - Dirk Hartog Sunday Island Bay 6

Damara WA Pty ltd
lEG£.110
2~ ·
fNOIAN OCi iAN
• lO'
9
Figure 4: Bathymetry (Logan & Cebulski 1970)
The broader behaviour of the Sunday Island Bay coast has been considered in a wider sediment cell
context incorporating the controls of the banks either side of the channel (Figure 7; white dots). At
this scale, the longer-term sediment dynamics within Blind Strait and the adjacent banks have been
considered . However, for this setback assessment and adaptation planning the discussion is focused
on a finer scale sediment cell between the two headlands (Figure 7; yellow dots). The coast is
topographically contro lled on a broad scale by the peninsulas, islands, broader bathymetric structure
and the sand flats within Blind Strait; and on a local scale by rock features either side of the bay,
foredunes, relict longitudinal dunes, local bathymetry including terraces and platforms, and subtidal
rock outcrops (Figure 7; Figure 8) .
239-01-RevO Wardle - Dirk Hartog Sunday Island Bay 7
,.. a: <( z tr:
"' ,_ <t ::> 0
"' ""' ul u 0
~ 111
...
UJ 2: ul u
I? [ H N .
•" , ,, ...... , Hl.li.'lliNCOl U1144 I tt h u.t, . , 1 •t•"' ' " .. '' ,~ , ~ . .- .. -,·•' • l t h
I J ~- ) I ll ( I ' t 1 4 H •H h " -' 'V I c \ I' l"nl tl .. ~ l ' d I ! I I IJ I . I .• u •• •• :'• P • • ~ I '!1 11
Damara WA Pty ltd
IJ l•lt lflll ll( 't•l t l l ~ t,lor t l I '"' I ' •t 1 1'•f~ t;, ht l flh lf~ , , 1, t ~t. ,. ,,,•, '" .., ,, l tf'\ f ~.tt ":A:S
0: lu l,. ' f' • 'I t to U le '' 1 1, • n r I t
( lh;t t i ~! UI t \ :r .l.tU dot , u ' l t , , ,.,ff , .J ,.t i •111 I Ht olt t.t• •
t ••9 ,u pwl ... ' ' t f' • , • • s#, 1t . '' • • •' '" , 1. ,. ,, _.. , .., 1••r1r ,, ,.. 1, ,., ., (lh l t•t•l~•l •t ·Jn•. l lt ,, , ttt , u •J,~r. 'J' "' tn:q11) ... ,.._1.~t.1 1 1 u 'utut l tlt ~to td ! r;l' I P H So 1 .. u l 1o l, l)!t11 il•_, • ' u • t
1,. oi.Jo 1 I I 1 I I f ," " ... tl • '• ' o \ I t f \ t U t l
r oh t I 'I t lol l fit I hi ~· h l I it I If ')If f•r •t ' ol )1 ;i f ) 11" ... ~ 11 t"''tt''o ( ftlo .. V.: U 1f
SHI\AI< 81\ V /\flEA
GA COY liE IUVUI A Ill A
l l I l t t\ 11 o' l fu U 1 u o\-. H t loo •I I•J
Figure 5: Site Geology (Butcher et al. 1984)
239-01-RevO Wardle- Dirk Hartog Sunday Island Bay 8
ISLAND
\ . \
\
.. : '· "· ,. ... ...- 1:! ', ... , .. • •• "'<t, .. • ~.... • •
. .. . .. >.~ .::·r·~ .~ .. ,, .. ...
..... ~ • t ., • . • ..
·-.. .. ~L
.. . )
.• 61 ,, ,, , .
\ . .'
!' -.r
I Mount O~roc lion
.. ·-.. '' . '
Damara WA Pty Ltd
-...
·~ '·' . . • Useless Loop
' · ··~·· · Gauge ' .
s- ;-• ~ '
.. ' ~ I 5
~ ' 0..
\
(
I ,
.. . "'; , .. .. · .. ;'
Figure 6: Broad-Scale Bathymetry
(RAN Hydrographic Office Chart 749 Shark Bay South Western Sheet 1993)
239-01-RevO Wardle- Dirk Hartog Sunday Island Bay
j' N S
9

Damara WA Pty Ltd
Figure 7: Focal Sediment Cells for Investigation (Source: landgate 2002)
Broader cell between white dots for longer time-scales and focal cell for investigation in yellow
dots. The right Image shows relict channel (black line) connected to terrace and with flood tide
shoal in the lagoon. longitudinal dunes (grey dotted line) subsequently activated and shifted
sediment landward.
Interpretation of land forms suggests a traditional approach to predicting coastal response to sea
level rise may not apply at this site. There is a disconnection from the onshore landforms to the
dynamics of the channel and adjacent banks in Blind Strait. Coastal response to sea level rise may
incorporate sediment movement onto the banks adjacent to the channel, changing levels on the
terrace, beach rotation and potential accretion in longitudinal dunes . . In a previous time period
sediment was moved onshore demonstrated by infill of the relict channel connected to the terrace,
with a flood tide delta within the inlet (Figure 7); with subsequent movement of material onshore via
the longitudinal dunes. lt is anticipated these changes would have occurred during the previous sea
level highstand (around 2,000 years ago) . The existing longitudinal dunes presently restrict the
capacity for coastal retreat at the site, with historic movement only occurring in the foredune plain
to seaward (Figure 8; Figure 9) .
239-01-'RevO Wardle- Dirk Hartog Sunday Island Bay 10
Damara WA Pty ltd
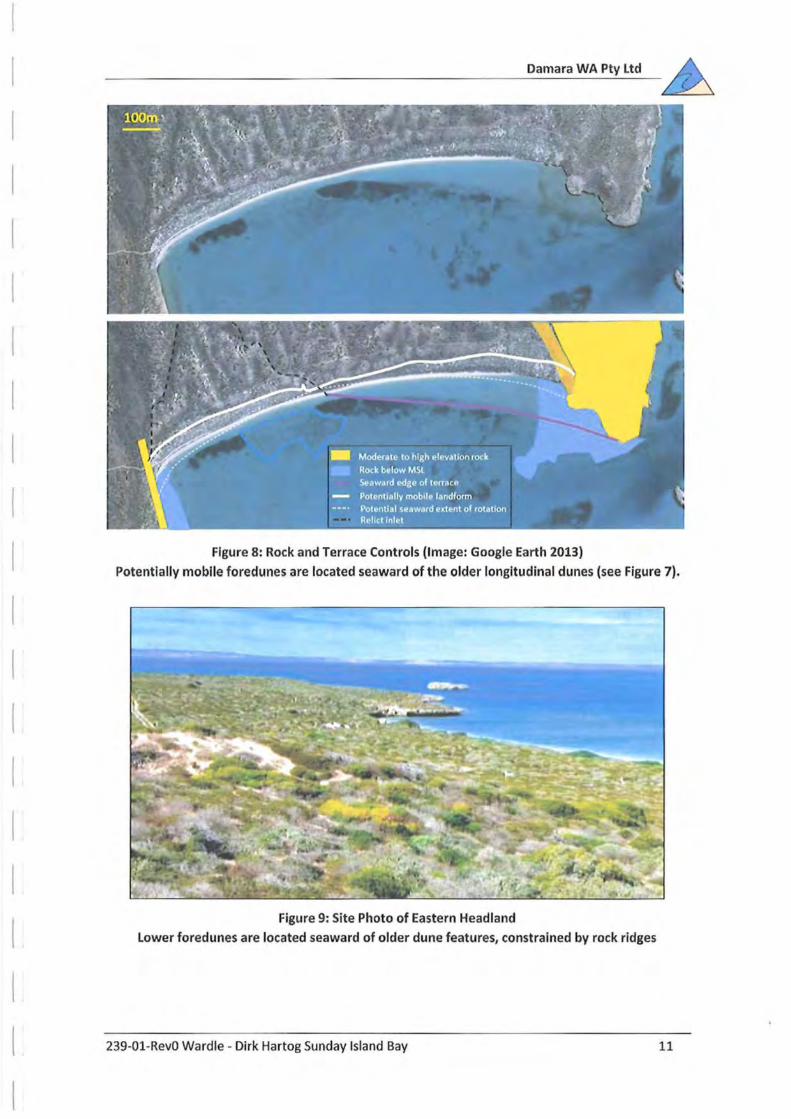
Figure 8: Rock and Terrace Controls (Image: Google Earth 2013)
Potentially mobile foredunes are located seaward of the older longitudinal dunes (see Figure 7).
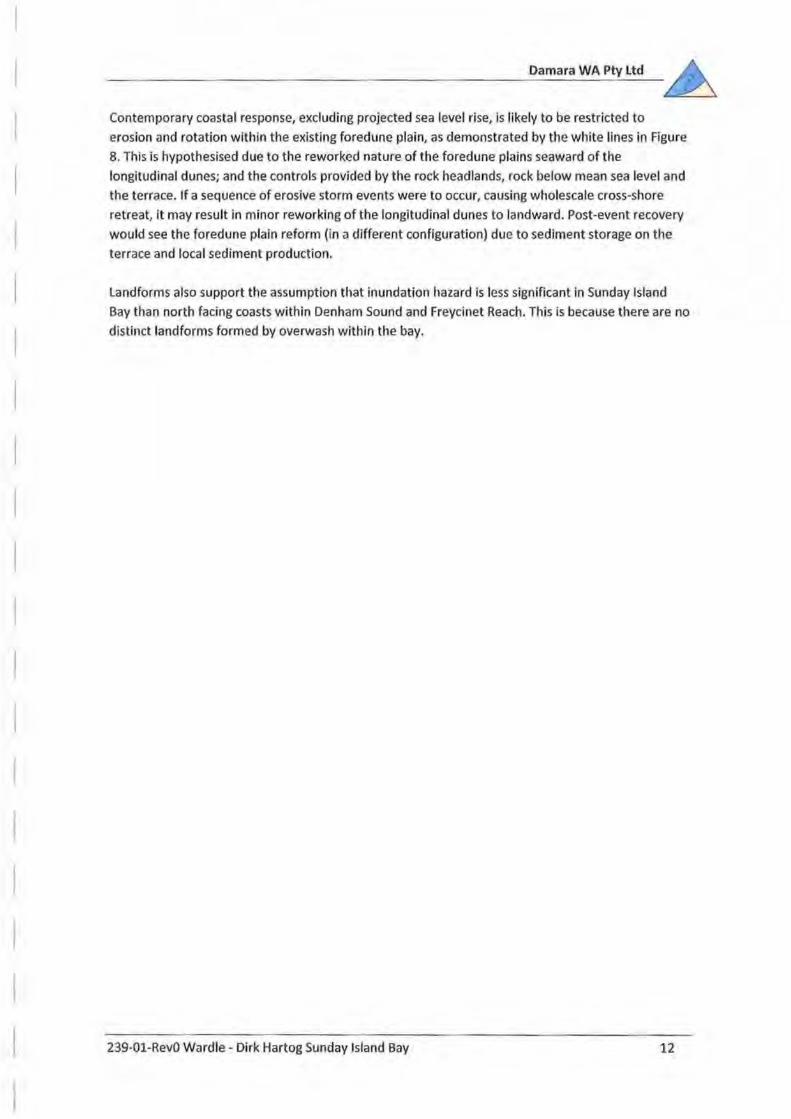
Figure 9: Site Photo of Eastern Headland
lower foredunes are located seaward of older dune features, constrained by rock ridges
239-01-RevO Wardle - Dirk Hartog Sunday Island Bay 11
Damara WA Pty ltd
Contemporary coastal response, excluding projected sea level rise, is likely to be restricted to
erosion and rotation within the existing foredune plain, as demonstrated by the white lines in Figure
8. This is hypothesised due to the reworked nature of the foredune plains seaward of the
longitudinal dunes; and the controls provided by the rock headlands, rock below mean sea level and
the terrace. If a sequence of erosive storm events were to occur, causing wholescale cross-shore
retreat, it may result in minor reworking of the longitudinal dunes to landward. Post-event recovery
would see the foredune plain reform (in a different configuration) due to sediment storage on the
terrace and local sediment production.
Landforms also support the assumption that inundation hazard is less significant In Sunday Island
Bay than north facing coasts within Denham Sound and Freycinet Reach. This is because there are no
distinct landforms form ed by overwash within the bay.
239-01-RevO Ward le- Dirk Hartog Sunday Island Bay 12
Damara WA Pty ltd
5. Revised Schedule One for Adaptive Hazard Assessment The cornponents of Schedule One of SPP2.6 have been revised from default setback allowances, to
provide a more locally-relevant assessment of coastal change that may support adaptive decision
making. Several key assumptions were required to compensate for data limitations.
5.1. STORM EVENT (HSD, S1 AND S4)
locally relevant assessments of the HSD, acute storm allowance ($1) and inundation allowance (54}
require consideration of a tropical cyclone event and the associated extreme waves and water
levels . The evaluation of extreme water levels for Sunday Island Bay has used information developed
for Selection of Design Cyclones for Coastal Development Approval Assessments (Damara WA 2009)
regarding tropica l cyclone intensity, scale and coincidence with tidal conditions. This analysis
suggests characteristics for 'direct hit' design storms, coincident with a tidal level of Mean Higher
High Water, which is l.Om C01 (RAN Hydrographic Office Chart 749) .
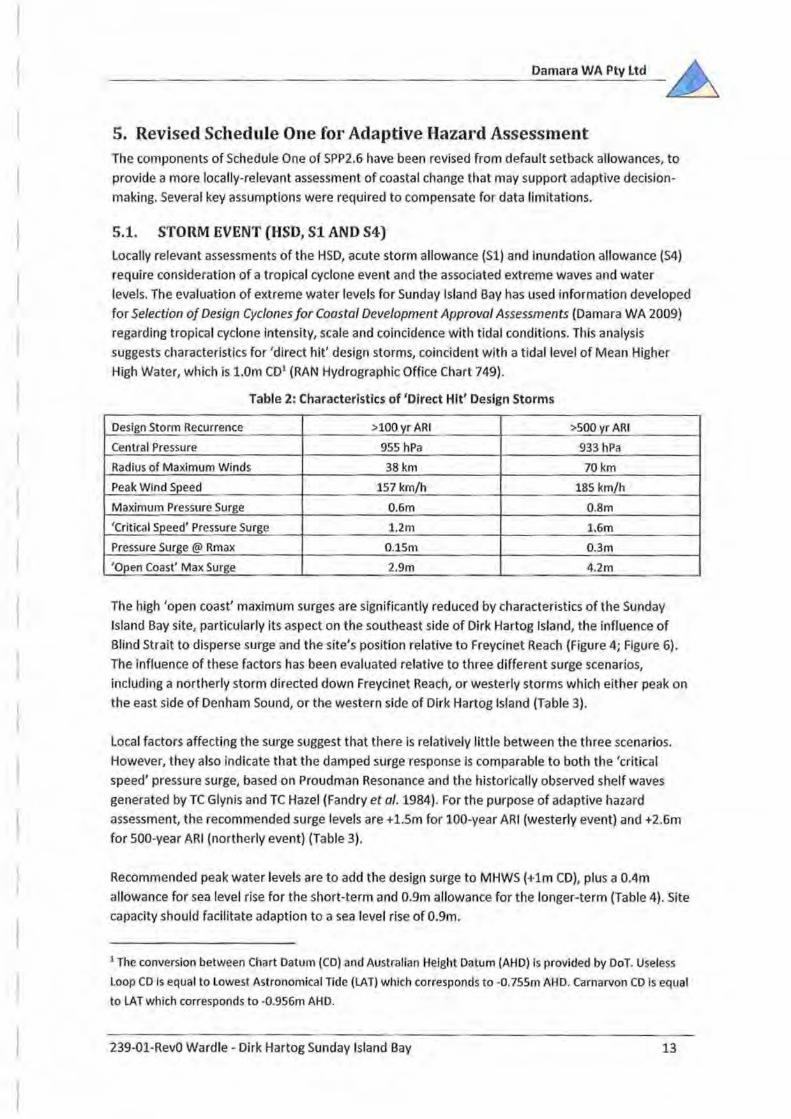
Table 2: Characteristics of 'Direct Hit' Design Storms
Design Storm Recurrence >100 yr ARI >500 yr ARI
Central Pressure 955 hPa 933 hPa
Radius of Maximum Winds 38km 70km
Peak Wind Speed 157 krn/h 185 km/h
Maximum Pressure Surge 0.6m 0.8m
'Critical Speed' Pressure Surge 1.2m 1.6m
Pressure Surge @ Rmax O.lSm 0.3m
'Open Coast' Max Surge 2.9m 4.2m
The high 'open coast' maximum surges are significantly reduced by characteristics of the Sunday
Island Bay site, particularly its aspect on the southeast side of Dirk Hartog Island, the influence of
Blind Strait to disperse surge and the site's position relative to Freycinet Reach (Figure 4; Figure 6) .
The influence of these factors has been evaluated relative to three different surge scenarios,
including a northerly storm directed down Freycinet Reach, or westerly storms which either peak on
the east side of Denham Sound, or the western side of Dirk Hartog Island (Table 3).
local factors affecting the surge suggest that there is relatively little between the three scenarios.
However, they also indicate that the damped surge response is comparable to both the 'critical
speed' pressure surge, based on Proud man Resonance and the historically observed shelf waves
generated by TC Glynis and TC Hazel (Fandry et al. 1984). For the purpose of adaptive hazard
assessment, the recommended surge levels are +l.Sm for 100-year ARI (westerly event) and +2.6m
for 500-year ARI (northerly event) (Table 3) .
Recommended peak water levels are to add the design surge to MHWS (+lm CD), plus a 0.4m
allowance for sea level rise for the short-term and 0.9rn allowance for the longer-term (Table 4) . Site
capacity should facilitate adaption to a sea level rise of 0.9m.
1 The conversion between Chart Datum (CD) and Australian HeJght Datum (AHD) is provided by DoT. Useless
Loop CD Is equal to Lowest Astronomical Tide (LAT) which corresponds to -0. 755m AHD. Carnarvon CD Is equal
to LAT which corresponds to -0.956m AHD.
239-01-RevO Wardle - Dirk Hartog Sunday Island Bay 13

Damara WA Pty ltd
Table 3: Evaluation of Local Storm Surge Scenarios
Scenario Northerly Event Westerly Event -A Westerly Event - B
Peak Surge Location Freycinet Reach Den ham Dirk Hartog Island
Coast Shape Factor 2.0 1.0 1.0
Required Fetch 140km 70km Rmax
500yr Peak Surge SSm 3.8m 4.2m
lOOyr Peak Surge 2.8m 2.4m 2.9m
SIB Position 60km 33km 60% of Blind Strait
SIB Factor (wind setu(ij 0.43 0.47 0.40
SOOyr SIB Surge 2.6m 2.1m 2.2m
100yr SIB Surge 1.3m 1 .3m l.Sm
Table 4: Water Levels associated w ith a Tropical Cyclone Event
100-yr ARI 500-yr ARI
m CD mAHD m CD mAHD
Required Capacity Short-term 2.9 2.1 4.0 3.2
Long-term 3.4 2.6 4.5 3.7
5.1.1. Hoa·izontal Shoreline Datum (HSD)
Using this information, the HSD is +2.1m AHD representative of the 100-yr ARI water level with a
0.4m vertical sea level rise component and no wave runup. This is represented by the +2m AHD
contour on the available topographic contours, with the horizontal discrepancy of the O.lm vertical
difference likely to be In the same order as the accuracy of the contours themselves.
This value is O.Sm lower elevation than the estimate included in Section 3.
5.1.2. Inundation Allowance (S4 + SLR)
The allowance for inundation is the sum of the present risk of storm surge inundation {54) and the
predicted extent of sea level rise. The potential for dune breaching was not considered at this site
because the dunes do not demonstrate a decrease in elevation to landward, and therefore exceed
100m3 cross-section area. The long-term 500-yr ARI value of +3.7m AHD in Table 4 represents the
peak steady water level plus predicted extent of sea level rise (0.9m), but excludes wave run-up.
Wave run-up is estimated using analytical formulae (Mase 1989) and standard values due to the
limited datasets available. Wave run-up formulae on beaches require input information on beach
slope, wave height and wave period. Wave conditions have been estimated using a local wind
hindcast across the effective fetch (Figure 10), giving conservative significant wave heights (Hs) of
2.1m and wave periods (Tp) of 3.2s. These va lues are conservative as they were generated using a
lOO-year ARI wind of 72.6 ms·1 extracted from AS1170.2 for region D (p.13, Section 3, Regional
Winds) including a 1.1 factor of safety multiplier {Standards Australia 2002) . For comparison, the
highest wind speed recorded at Den ham station was 20.1 ms·1 for the period 1988 to 2010 (Bureau
of Meteorology datasets), suggesting the design wind used significantly exceeds the highest
measured wind speed.
239-01-RevO Ward le - Dirk Hartog Sunday Island Bay 14
Damara WA Pty Ltd
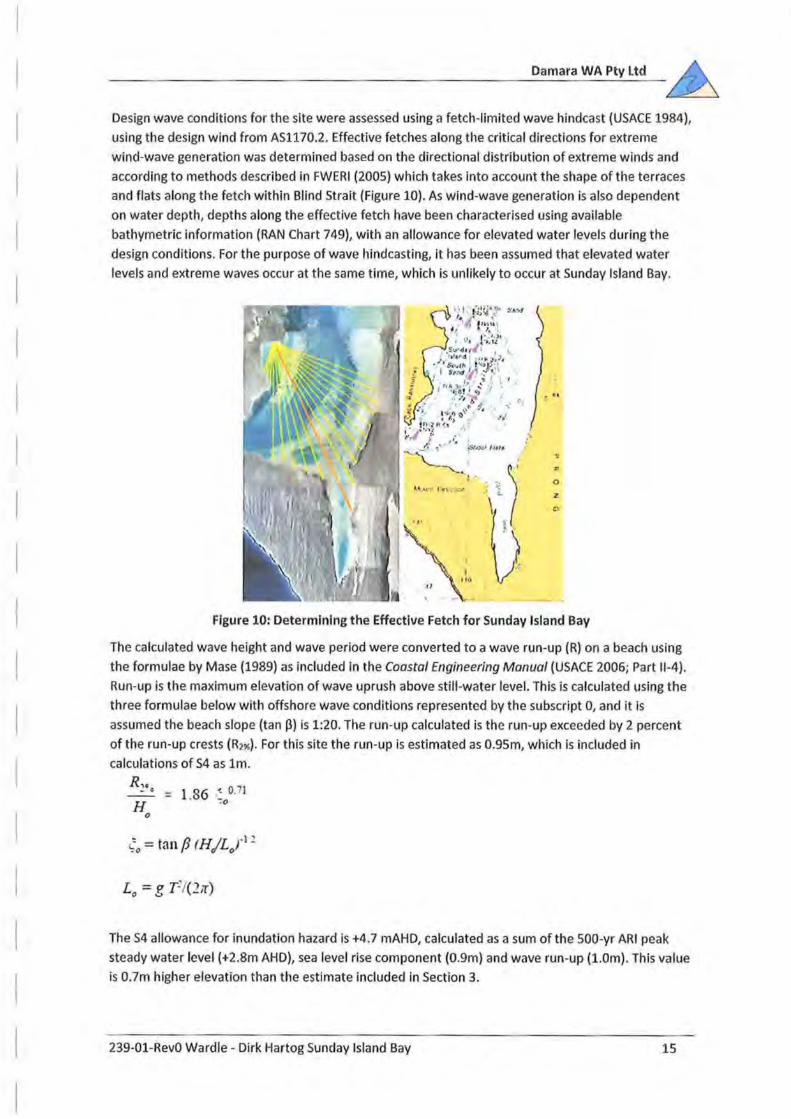
Design wave conditions for the site were assessed using a fetch-l imited wave hindcast {USACE 1984),
using the design wind from AS1170.2 . Effective fetches along the critical directions for extreme
wind-wave generation was determined based on the directional distribution of extreme winds and
according to methods described in FWERI (2005) which takes into account the shape of the terraces
and flats along the fetch within Blind Strait (Figure 10}. As wind-wave generation is also dependent
on water depth, depths along the effective fetch have been characterised using available
bathymetric information (RAN Chart 749), with an allowance for elevated water levels during the
design conditions. For the purpose of wave hindcasting, it has been assumed that elevated water
levels and extreme waves occur at the same time, which is unlikely to occur at Sunday Island Bay .
. .. , .~ ....
,$1-' I ••
0
z
Figure 10: Determining the Effective Fetch for Sunday Island Bay
The calculated wave height and wave period were converted to a wave run-up (R) on a beach using
the formulae by Mase {1989) as included in the Coastal Engineering Manual (USACE 2006; Part 11-4).
Run-up is the maximum elevation of wave uprush above still -water level. This is calculated using the
three formulae below with offshore wave conditions represented by the subscript 0, and it Is
assumed the beach slope (tan P) is 1:20. The run-up calculated is the run-up exceeded by 2 percent
of the run-up crests {R2%)- For this site the run-up is estimated as 0.95m, which is included in
calculations of 54 as 1m.
R • ~ = 1 86 ~ O. I H · 7o
0
The 54 allowance for inundation hazard is +4 .7 mAHD, calculated as a sum of the 500-yr ARI peak
steady water level (+2.8m AHD), sea level rise component (0.9m) and wave run-up (l.Om). This value
is 0.7m higher elevation than the estimate included in Section 3.
239-01-RevO Wardle - Dirk Hartog Sunday Island Bay 15
Damara WA Pty ltd
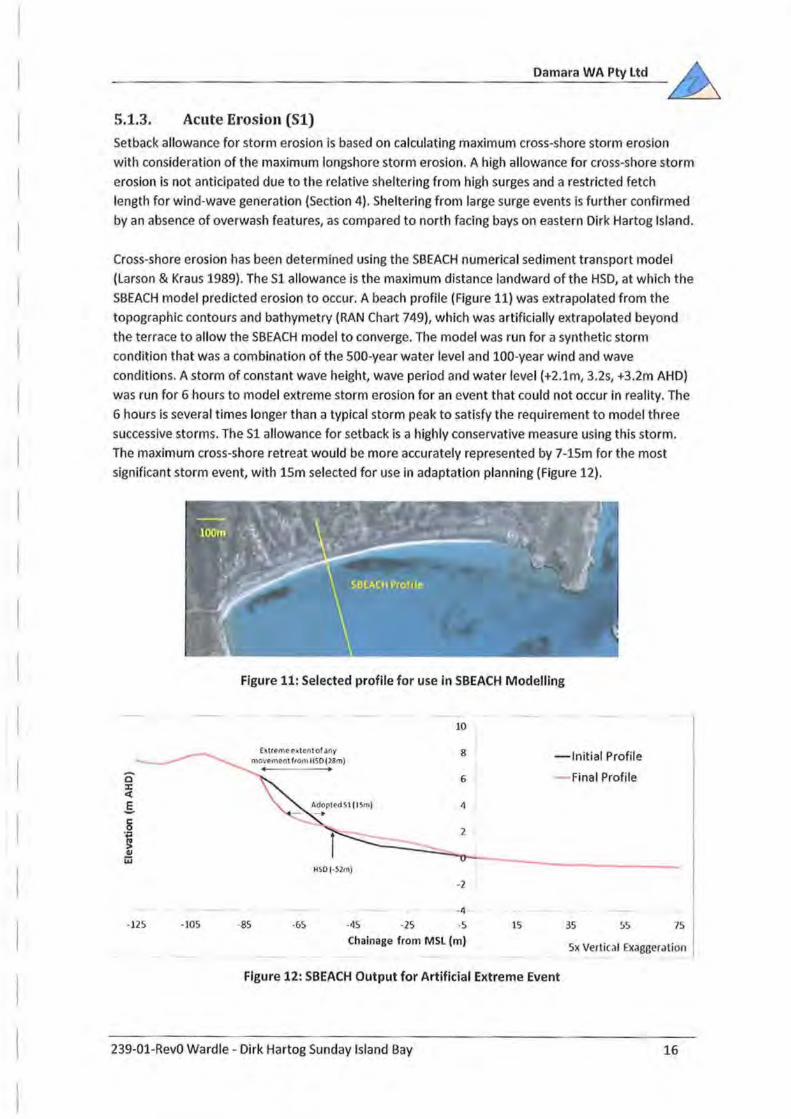
5.1.3. Acute Erosion (Sl)
Setback allowance for storm erosion is based on calculating maximum cross-shore storm erosion
with consideration of the maximum longshore storm erosion. A high allowance for cross-shore storm
erosion is not anticipated due to the relative sheltering from high surges and a restricted fetch
length for wind-wave generation {Section 4). Sheltering from large surge events is further confirmed
by an absence of overwash features, as compared to north facing bays on eastern Dirk Hartog Island.
Cross-shore erosion has been determined using the SBEACH numerical sediment transport model
(Larson & Kraus 1989). The Sl allowance is the maximum distance landward of the HSD, at which the
SBEACH model predicted erosion to occur. A beach profile (Figure 11) was extrapolated from the
topographic contours and bathymetry (RAN Chart 749), which was artificially extrapolated beyond
the terrace to allow the SBEACH model to converge. The model was run for a synthetic storm
condition that was a combination of the 500-year water level and 100-year wind and wave
conditions. A storm of constant wave height, wave period and water level (+2.1m, 3.2s, t3.2m AHD)
was run for 6 hours to model extreme storm erosion for an event that could not occur in reality. The
6 hours is several times longer than a typical storm peak to satisfy the requirement to model three
successive storms. The Sl allowance for setback is a highly conservative measure using this storm.
The maximum cross-shore retreat would be more accurately represented by 7-lSm for the most
significant storm event, with 15m selected for use in adaptation planning (Figure 12).
-125 · 105
Figure 11: Selected profile for use in SBEACH Modelling
-85
E tremoo tontof any mov•m•nt from 1150 t 1Sm)
·65 · •15 -25
10
8
6
-2
-4
-5 15
-Initial Profile
Final Profile
35 55 75 Chainage from MSL (m)
Sx Vertical xaggeralion
Figure 12: SBEACH Output for Artificial Extreme Event
239-01-RevO Wardle - Dirk Hartog Sunday Island Bay 16

Damara WA Pty Ltd
This synthetic event could never occur due to the h11possibility of the coincidence of high waves and
high surge at the site from a tropical cyclone .
The longshore response to a storm would cause apparent beach rotation within the bay. The
magnitude of this longshore response is not included in the 51 allowance as it is incorporated within
the 52 allowance below through consideration of potential land form response.
5.2. CHRONIC EROSION (SZ)
The allowance for historic shoreline movement trends is recommended to be based on the review of
available shoreline records, preferably at five -yearly intervals. The earliest aerial photograph
available from Landgate was 1972, with no detailed historic bathymetry available for comparison.
The traditional approach for determining the S2 setback allowance is based on analysis of vegetation
line movements over the time period of available aerial photography. Vegetation lines are a proxy
for coastal profile change and therefore should be interpreted with care (Camfield & Morang 1996;
Boak & Turner 2005). In many approaches it depends on the length of the photographic record,
condition of the first vegetation line from the most recent extreme storm and on the time of year of
the aerial photography. The time of the year of aerial photography within a semi-enclosed bay may
not capture the seasonal fluctuations in beach position. lt was considered that vegetation line
mapping for this site may be unnecessary given the small changes observed, with most changes
observed in beach width which is dependent on the water level at the time of the photography.
Long-term shoreline change was interpreted from four aerial photographs including the most recent
(2013) and earliest (1972-georectified), as well as two other years where orthophotographs were
available (2002, 2007) with further visual checks of GoogleEarth historic imagery (Figure 13). This
analysis suggested a relatively stable coast, with variation in vegetation line and beach width at the
eastern extent of the site, to a total of Gm across the time-period. The total beach width has reduced
by approximately 3-4m, with losses of 12m beach width at the eastern extent of the bay.
Some of the recent rotation observed in the bay may be attributed to a local surge of ~30cm
associated with a strong La Nifia from 2009-2013 (Figure 14). The inter-annual relationship between
mean sea level and climate fluctuations is suggested by a strong correlation between annual average
water level and SOl- the Southern Oscillation Index (Pattiaratchi & Buchan 1991; Figure 14). The SOl
is determined by the barometric pressure difference between Darwin and Hawaii, and has been
demonstrated as a reasonable indicator of El Nino or La Nif)a cl imatic conditions. The sea level
relationship to SOl indicated by Figure 14 occurs along the entire Western Australian coast
(Pariwono et al. 1986; Pattiaratchi & Buchan 1991; Feng et al. 2004). High mean sea levels in Shark
Bay also occur due to thermal expansion of warmer water which accumul<:~tes within the bay. The
response in Shark Bay to higher sea surface temperatures is larger than in south-west WA. Beach
recovery is anticipated as the SOl returns to El Nino conditions and lower sea surface temperatures .
Sediment on the terrace can be migrated onshore during lower mean sea level conditions.
239-01-RevO Ward le - Dirk Hartog Sunday Island Bay 17

Damara WA Pty Ltd
Figure 13: Historic Aerial Imagery 1972-2013 (Sources: Landgate and GoogleEarth)
239-01-RevO Wardle - Dirk Hartog Sunday Island Bay 18
Damara WA Pty Ltd
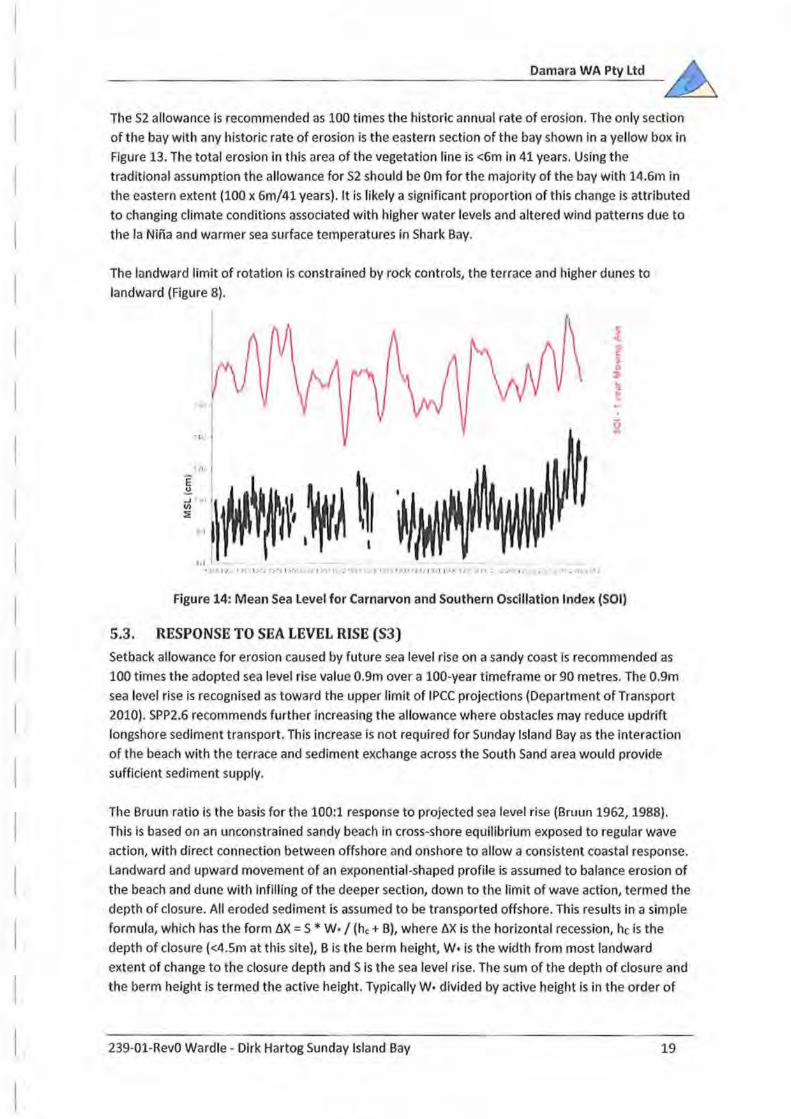
The 52 allowance is recommended as 100 times the historic annual rate of erosion. The only section
of the bay with any historic rate of erosion is the eastern section of the bay shown in a yellow box in
Figure 13. The total erosion in this area of the vegetation line is <6m in 41 years. Using the
traditional assumption the allowance for S2 should be Om for the majority of the bay with 14.6m in
the eastern extent (100 x 6m/41 years). lt is likely a significant proportion of this change is attributed
to changing climate conditions associated with higher water levels and altered wind patterns due to
the la Nina and warmer sea surface temperatures in Shark Bay.
The landward limit of rotation is constrained by rock controls, the terrace and higher dunes to
landward (Figure 8).
,,,
l r
• • ' ' f t • I I • • 1 1 1 I • J, 1 1 , • t • , 1 l
Figure 14: Mean Sea level for Carnarvon and Southern Oscillation Index (SOl)
5.3. RESPONSE TO SEA LEVEL RISE (S3)
Setback allowance for erosion caused by future sea level rise on a sandy coast is recommended as
100 times the adopted sea level rise value 0.9m over a lOO-year timeframe or 90 metres. The 0.9m
sea level rise is recognised as toward the upper limit of IPCC projections (Department of Transport
2010). SPP2.6 recommends further increasing the allowance where obstacles may reduce updrift
longshore sediment transport. This increase is not required for Sunday Island Bay as the interaction
of the beach with the terrace and sediment exchange across the South Sand area would provide
sufficient sediment supply.
The Bruun ratio Is the basis for the 100:1 response to projected sea level rise (Bruun 1962, 1988).
This is based on an unconstrained sandy beach in cross-shore equilibrium exposed to regular wave
action, with direct connection between offshore and onshore to allow a consistent coastal response.
Landward and upward movement of an exponential-shaped profile is assumed to balance erosion of
the beach and dune with infilling of the deeper section, down to the limit of wave action, termed the
depth of closure. All eroded sediment is assumed to be transported offshore. This results in a simple
formula, which has the form !:!.X= S * W· I (he+ B), where flX is the horizontal recession, he Is the
depth of closure (<45m at this site), B is the berm height, W•ls the width from most landward
extent of change to the closure depth and S is the sea level rise. The sum of the depth of closure and
the berm height is termed the active height. Typically w. divided by active height is in the order of
239-01-RevO Wardle - Dirk Hartog Sunday Island Bay 19
Damara WA Pty Ltd
50-100, which results in common application of the further simplified formula !JX = 100 S. The model
relies upon a balance of seaward sediment transport during storm events against landward
transport under ambient conditions. An equivalent Bruun model at the site is 65:1 based on depth of
closure of -4.5m2, berm height attributed as +2m AHD (HSO) and width of active zone from the HSD
to the first channel of 480m.
The Bruun conceptual model has reduced validity in Shark Bay, where the presence of lithified
former shorelines provides considerable control on coastal response to changing environmental
conditions. At Sunday Island Bay the coast is perched upon a rock platform, constrained between
two rock shorelines, adjacent to a broad te rrace and is disconnected to traditional offshore features.
The sandbanks and the low energy beuch terraces are characteristic of non-equilibrium conditions,
although the previously presence of seagrass beds suggests change is gradual. The underlying rock,
and higher elevation rock at the bay extents, limits the extent of retreat that can occur with losses
distributed across the bay and the terrace. Coasts with segment ed structures, with a flat sea bed in
front of a steeper beach face, typically respond geometrically (Komar et al. 1995) to increased water
levels and waves by raising the beach berm level and landward movement of the beach face. This
gives small ratios of coastal response to sea level change, often in the order of 30:1 or less. This is
particularly relevant to Sunday Island Bay with a likely 'ongoing sediment supply from seagrass banks,
eroding Tamala limestone and from transport along the banks.
The beach will respond through rotation and retreat of low-elevation landforms. lt is anticipated
that in periods of rapid sea level rise, such as the 30cm surge that has occurred between 2008 and
2012 (Figure 14), sediment will be eroded from the beachface and distributed on the terrace.
As noted above, the 53 allowance is likely to represent a conservative estimate of both the
magnitude of sea level rise and the relative coastal response to such change. Applying realistic
est imates of these factors, the response to sea level rise may be as little as 26m by 2100, although if
higher values of these factors occur, then 26m erosion could occur by 2055. In order to provide a
minimal time frame of >50 years before the need for adaptation may be possible, then a 40m
setback allowance is recommended, based upon a 0.4m sea level rise (by 2070) and 100:1 ratio for
coastal response (Figure 15, Table 5}. lt is proposed to provide further adaptive capacity to
subsequent sea level rise and erosion by designing the buildings for ease of re location, and definition
of alternative building envelopes further landward . Relocation of buildings would be based upon
coastal retreat to a trigger level, as specified in Section 5.5.
Table 5: Coasta l Response to Sea Level Rise
Time Frame Sea level Rise Response Ratio Coastal Retreat likelihood
2070 0.2m 65:1 13rn High
2070 0.4m 65 :1 26m Moderate
2070 0.4m 100:1 40m Low
2100 0.4m 65:1 26m High
2100 0.9m 65 :1 58 m Moderate
2100 0.9m 100:1 90m low
2 Using Hallermeier (1981) with extreme wind speeds >100 year ARI, which would generate a wave height
greater than that exceeded for 12 hours in any one year, and therefore a larger closure depth than reality.
239 -01-RevO Ward le- Dirk Hartog Sunday Island Bay 20

Damara WA Pty Ltd
. I
t" lil l ) ;·
2! () / Qi
§. I)E (.1 ... ·c .. 0 O.·i -> ~ , (11
Ol VI
(t
1) 0
...
.-. ... ._,
=~ ·-· ~ ,_., ,_ ,-, .-,
"· ... , <'.
Y11ars
Figure 15: Sea level Rise Allowance Time Series {Source: DoT 2010)
lt is pos.sible increased sed iment mobilisation under an increased sea level, in combination with
dune destabilisation, could result in activation of longitudinal dunes on the site (Figure 7). There are
numerous examples of these dunes on Dirk Hartog Island and in Shark Bay. Any beach access should
avoid a north-south alignment to avoid activating these dunes.
5.4. UNCERTAfNTY
An allowance for uncertainty is recommended as 0.2m/yr, or 20m total, to be added to the other
erosion allowances when developing a setback (WAPC 2013}. However, because the focus for this
section is to obtain an accurate predictor for adaptation planning, this allowance has been
neglected. Reasons for doing so include the rock control at the site, evidence of landform behaviour,
the sheltered location from combined high surge and w<Jve conditions, as well as fetch restricted
conditions for wave forcing (Sections 4 and 5.1). A minimum setback to the landward extent of the
landforms exhibiting rotation behaviour accounts for uncertainty.
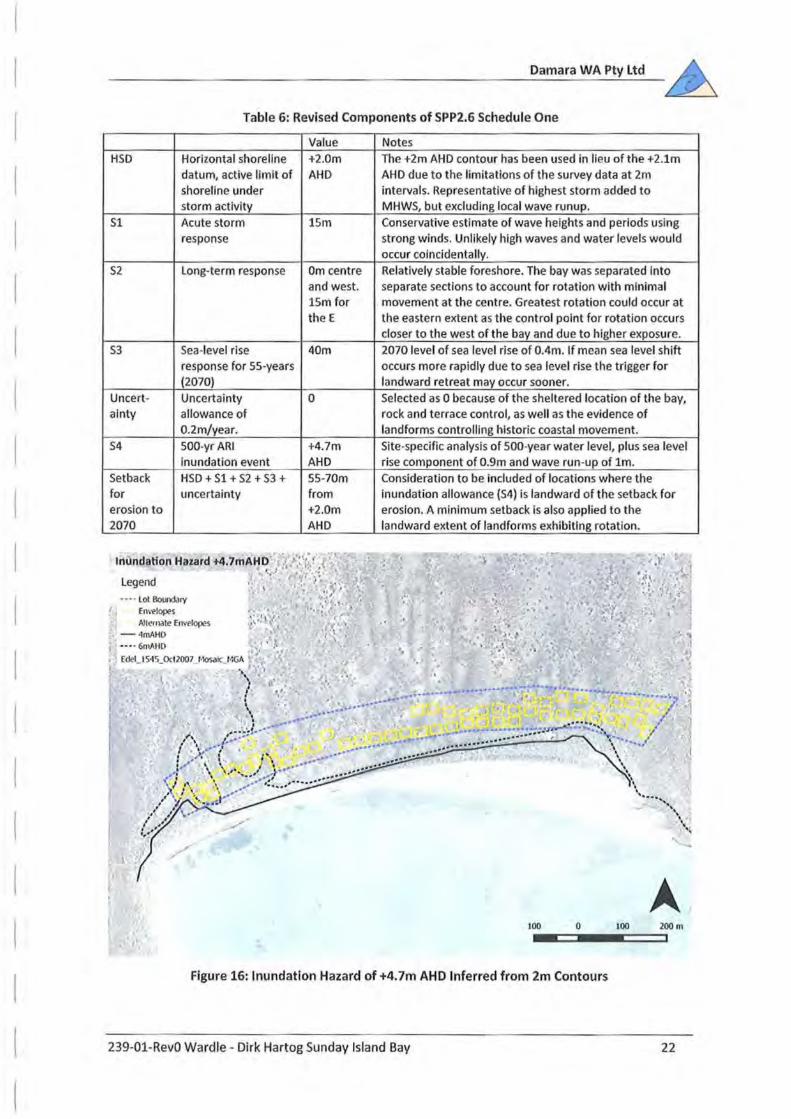
5.5. REVISED ALLOWANCES FOR EROSION AND INUNDATION
A formulaic application of Schedule One in SPP2.6 with Sl allowance of 15m and projected sea level
rise to 2070 would produce erosion hazard setbacks to 2070 of 55 to 70m from the HSD of +2.0m
AHD, with local higher setback at the western extent to the +4.7m AHD for inundation hazards
(Table 6; Figure 16; Figure 17). The areas potentially susceptible to inundation hazard have been
inferred from interpolation of the 2m contours of +4m AHD and +Gm AHD (Figure 16). One envelope
should be moved to avoid being located within the erosion or inundation hazard lines according to
this policy (Figure 17). No sites are located in an erosion hazard area, with Sites 2, 3 and 4 requiring
confirmation that they are outside the inundation hazard area. Site 4 requires a new alternate
envelope to be developed if it is located at an elevation less than +4.7m AHD.
The setback allowance to 2110 would be 105 to 120m from the +2.0m AHD contour using 51 of 15m.
This zone is used as the basis for considering any required adaptation sequencing in a CHRMAP.
This approach does not use the existing landform information to determine setback. A revised
approach incorporating landforms with a buffer is therefore considered ..
239-01-RevO Ward le- Dirk Hartog Sunday Island Bay 21
HSD
S1
52
S3
Uncert-ainty
54
Setback for erosion to 2070
• t /
Damara WA Pty ltd
Table 6: Revised Components of SPP2.6 Schedule One
Value Horizontal shoreline +2.0m datum, active limit of AHD shoreline under storm activity Acute storm 15m response
Long-term response Om centre and west . 15m for theE
Sea-level rise 40m response for 55-years (2070)
Uncertainty 0 allowance of 0.2m/year.
500-yr ARI +4.7m inundation event AHD
HSD + Sl + S2 + 53 + 55-70m uncertainty from
+2.0m AHD
Notes
The +2m AHD contour has been used in lieu of the +2.1m AHD due to the limitations of the survey data at 2m intervals. Representative of highest storm added to MHWS, but excluding local wave runup.
Conservative estimate of wave heights and periods using strong winds. Unlikely high waves and water levels would occur coincidentally. Relatively stable foreshore. The bay was separated into separate sections to account for rotation with minimal movement at the centre. Greatest rotation could occur at the eastern extent as the control point for rotation occurs closer to the west of the bay and due to higher exposure. 2070 level of sea level rise of 0.4m. If mean sea level shift occurs more rapidly due to sea level rise the trigger for landward retreat may occur sooner. Selected as 0 because of the sheltered location of the bay, rock and terrace control, as well as the evidence of landforms controlling historic coastal movement. Site-specific analysis of 500-year water level, plus sea level rise component of 0.9m and wave run -up of lm. Consideration to be included of locations where the inundation allowance (54) is landward of the setback for erosion. A minimum setback is also applied to the landward extent of landforms exhibiting rotation.
A 100 200 m
-==--c:::=:=:~ 0 100
Figure 16: Inundation Hazard of +4. 7m AHD Inferred from 2m Contours
239-01-RevO Wardle - Dirk Hartog Sunday Island Bay 22
Legend • • • HSO (2111Ai i0)
I -- HSO +51 (15rn) -·- HSO +SI ( ISm)+ S2 •
- Erosi(l(> 5elhack Poltcy 2070 (S I ISm) f ••.• lol llouncldry :
Ermlopes Alternate Envelopes Envel~ to I·IOve (Poltcy)
Edel _ 1 5'1 5_0ct2007_1·1o~i<_I · IGA
Damara WA Pty ltd
100 0 100
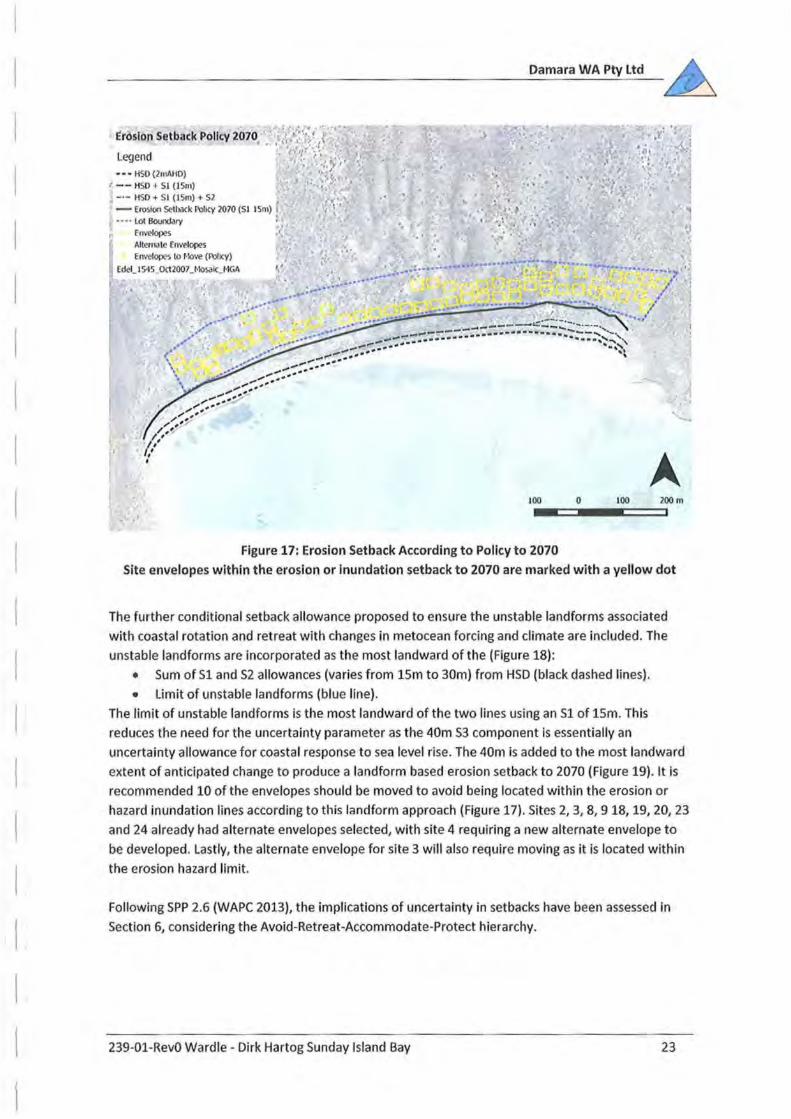
Figure 17: Erosion Setback According to Policy to 2070
A 200m
Site envelopes within the erosion or inundation setback to 2070 are marked with a yellow dot
The further conditional setback allowance proposed to ensure the unstable landforms associated
with coastal rotation and retreat with changes in metocean forcing and climate are included. The
unstable landforms are incorporated as the most landward of the (Figure 18):
• Sum of 51 and 52 allowances (varies from 15rn to 30m) from HSD (black dashed lines) .
• limit of unstable landforms (blue line) .
The limit of unstable landforms Is the most landward of the two lines using an S1 of 15m. This
reduces the need for the uncertainty parameter as the 40m 53 component Is essentially an
uncertainty allowance for coastal response to sea level rise. The 40m is added to the most landward
extent of anticipated change to produce a landform based erosion setback to 2070 (Figure 19). it is
recommended 10 of the envelopes should be moved to avoid being located within the erosion or
hazard inundation lines according to this landform approach (Figure 17). Sites 2, 3, 8, 9 18, 19, 20, 23
and 24 already had alternate envelopes selected, with site 4 requiring a new alternate envelope to
be developed. lastly, the alternate envelope for site 3 will also require moving as it is located within
the erosion hazard limit.
Following SPP 2.6 (WAPC 2013), the implications of uncertainty in setbacks have been assessed in
Section 6, considering the Avoid-Retreat-Accommodate-Protect hierarchy.
239-01-RevO Wardle- Dirk Hartog Sunday Island Bay 23

Damara WA Pty ltd
Method of Generating Landwa~d: · l itil~'~( · Unstable Landforms or HSD+Si'tS2 '1"~. i~ ·-·
• • • ·~· • , ,', if; I •
Legend ( • • • HSO (2111AHO) -- tiSD t SI (15111) -·- HSD +SI ( 15111) +52
1 - UnstaUie Landfoun Umll
~ Eclel_1 S4S_Oct2007 _1·10sa.c_I•IGA ,
···" .·J.c. . ..... .
__ . _ _.------:.:::::::::.: .... ·-·-· ----- -------·--·--·----- --, ' ....... ...- -:::.-=-;#'·-------- ··· · -,"::"~, __ ......... -; •• -·- 't
I' I
..,.,..,.,._ .. - ~-., .... ---_,..,. .... .. ,.-- .... ,, , .... , .. ., ...... -:, .. :,/ , .. ,, __ ..
( /.-~
//,, .... . . ,,
,' I
100 0 100
Figure 18: Method of Generating landward limit of Landforms or HSD+Sl+S2
Erosion Setback Landfor~s 20'70:~·. :·:·\. ~ · • .... •• • t • •• :·.·! 1
Legend ·( · 't: : · •. ;.:··. I • u f I
- · - · Lot Boundary ''.,~ ... ,., f - Erosion Setbock L.)r\dforms 2070 5115111 : ' .J-. i ,(;.
Envelopes to 1·10\'e (larldfOimS) • , • • \ Envelopes , · s ~ ; ; .. Alternate Erwelq
fdei_ I5'1S_Oct2007 _t•losar<_t·IGA
'•
100 0
Figure 19: Recommended Erosion Setback Based on landforms to 2070
239-01-RevO Wardle - Dirk Hartog Sunday Island Bay
100
A 200 m
A 200m
24

Damara WA Pty Ltd
6. Recommendations A major part of Lot 304 freehold area is located seaward of a demarcation line derived from
Schedule One of SPP 2.6 (WAPC 2013). This line distinguishes between areas that may be considered
wholly avoiding coastal hazard over the next 100 years (landward of the line) and those areas that
may possibly be affected by coastal hazards (seaward of the line). The Schedule One calculation is a
simple method, with limited consideration of coastal processes, and therefore indicates allowances
for a conservative coastal setback, rather than an estimate of anticipated coastal response.
Development seaward of the demarcation line is not prohibited, but SPP 2.6 recommends that such
developments be managed through a Coastal Hazard Risk Management and Adaptation Plan
(CHRMAP), which acknowledges the potential risk and identifies pathways for their management.
Guidelines for the application of a CHRMAP have been developed by the Department of Planning,
which indicate the need to distinglJish between likely and possible coastal hazard outcomes. Further,
SPP 2.6 acknowledges the constraints of applying setback allowances derived from projected sea
level rise to existing freehold land. To this end, the policy allows consideration of adaptation to sea
level rise as a variation to the general case. A preferential hierarchy is defined, following the
sequence of Avoid-Retreat-Accommodate-Protect.
Evaluation of possible coastal hazards corresponding to the Schedule One setback allowance
indicates that the site effectively avoids coastal hazards to 2070 (Figure 17). Due to the narrow
nature of the Lot 304 freehold area, it is not possible to wholly Avoid coastal hazard to 2110, without
purchasing additional land area. Instead, the proposed approach is to Avoid moderate or high
likelihood hazards, and mitigate low likelihood hazard through Planned Retreat.
The strategy of Planned Retreat requires an estimate of the time frame or conditions under which
the retreat would be required, which therefore should consider the difference between best
estimates of coastal change and the conservative estimate developed through application of SPP 2.6
Schedule One.
Based upon rea listic estimates of coastal ch ange due to sea level rise, a setback of 71m from the
+2m AHD contour acts to Avoid coastal hazards with high or moderate likelihood to beyond 2110.
This corresponds to 56m of coastal retreat and 15m buffer for storm erosion.
Under higher scenarios of sea level rise and coastal response, 56m of coastal retreat could occur by
2084. However, evaluation of retreat practicalities of would need to occur prior to this, including
recognition of the likely effectiveness of building relocation. The recommended trigger for this
evaluation is coastal retreat of 41m, which gives allowance for two severe storm sequences, and is
not projected to occur until 2070 under high response scenarios.
Any beach access should avoid a north-south alignment to avoid activating any dunes.
Modify Layout
lt is recommended the layout be modified according to the erosion and inundation hazard
assessment. If the landform erosion setback allowance to 2070 was incorporated the site layout
should be altered by:
239-01-RevO Wardle- Dirk Hartog Sunday Island Bay 25

Damara WA Pty ltd
• Moving sites 2, 8, 9, 18, 19, 201 23 and 24 to the alternate envelope already mapped.
• Creating a new alternate envelope for site 3 that Is further landward of the landform-based
erosion hazard line to 2070.
• Either moving site 4 further landward or confirming the elevations are >Sm AHD at that
location.
This is a total of 10 site envelopes that require moving.
This is dependent on acceptance of 1) the landform approach; 2) neglecting the uncertainty
allowance; and 2) apply a sea level rise component only to 2070 (40m rather than 90m). Triggers for
coastal retreat are included in the text above as part of a CHRMAP approach.
239-01-RevO Wardle- Dirk Hartog Sunday Island Bay 26

Damara WA Pty ltd
7. References Boak EH & Turner IL. (2005) Shoreline Definition and Detection: A review. Journal of Coastal
Research, 21 (4): 688-703.
Bruun P. (1962) Sea-level rise as a cause of shore erosion. Journal Waterways and Harbours Division,
American Society of Civil Engineers, 88: 117-130.
Bruun P. (1988) The Bruun Rule of erosion by sea-level rise: a discussion of large-sca le two- and
three-dimensional usages. Journal of Coastal Research, 4: 627-648.
Butcher BP, van de Graaff JE & Hocking RM. (1984) Shark Bay - Edel W.A. 1:250 000 Geological Series
Explanatory Notes. Western Australia Geological Survey.
Camfield F & Morang A. (1996} Defining and interpreting shoreline change. Ocean & Coastal
Management, 32 (3): 129-151.
Damara WA Pty Ltd . (2009) Selection of Design Cyclones for Coastal Development Approval
Assessments. Draft Report to the Western Australian Department ofTransport. Report 89-
01-01 Draft.
Department ofTransport. (2010} Sea Level Change in Western Australia. Application to Coastal
Planning. Discussion Paper.
Eliot I, Gozzard B, Eliot M, Stul T and McCormack G. (2012) The Coast of the Shires of Shark Bay to
Exmouth, Gascoyne, Western Australia: Geology, Geomorphology & Vulnerability. Damara
WA Pty Ltd and Geological Survey of Western Australia for the Department of Planning and
Department of Transport.
Fandry C, Leslie L & Steedman R. (1984) Kelvin-Type Coastal Surges Generated by Tropical Cyclones.
Journal of Physical Oceanography, 14: 582-593.
Federal Waterways Engineering and Research Institute: FWERI. (2005) Principles for the Design of
Bank and Bottom Protection for Inland Waterways, Prepared by Federal Waterways
Engineering and Research Institute (Bundesanstalt fUr Wasserbau), Karlsruhe, Germany,
Bulletin No. 88, August 2005.
Feng M, Li Y & Meyers G. (2004) Multfdecadal variations of Fremantle sea level: footprint of climate
variability in the tropical Pacific. Geophysical Research Letters, 31, L16302,
doi:10.1029/2004GL01994 7.
Gozzard JR. (2012) WACoast- Gascoyne. Geological Survey of Western Australia, Digital Dataset.
Hallermeier RJ . (1981} Seasonal Limit of Significant Sand Transport by Waves: An Annual Zonation for
Secrsonal Profiles. Coastal Engineering Technical Aid No. 81-2. United States Army Corps of
Engineers, Coastal Engineering Research Center.
Komar PO, Carpenter D & McDougal WG. (1995) The Application of Beach and Dune Erosion Models
to the High-Energy Oregon Coast. Report to the Oregon Department of land Conservation and
Development.
Larson M & Kraus NC. (1989) SBEACH: Numerical Model for Simulating Storm-induced Beach Change;
Report 1. Empirical Foundation and Model Development. Technical Report CERC-89~9-RPT- 1,
Vicksburg, Mississippi: U.S. Army Engineer Waterways Experiment Station, Coastal
Engineering Research Cent.er.
239-01-RevO Wardle - Dirk Hartog Sunday Island Bay 27
Damara WA Pty ltd
logan BW & Cebulski DE. (1970) Sedimentary environments of Shark Bay, Western Australia.
Memoirs of the American Association of Petroleum Geo/ogists,13 : 1-37.
M a se H. (1989) Random Wave Run up Height on Gentle Slope, Journal of Waterway, Port, Coastal
and Ocean Engineering, 115(5): 649-661.
MP Roger.s & Associates. (2004a) Monkey Mia Dolphin Resort Expansion: Ocean Flooding &
Development Levels. Report R130 Rev 0. Appendix f In: Bowman Bisham Gorham. Monkey
Mia Dolphin Resort Expansion Public Environmental Review.
Pariwono J, Bye J & lennon G. (1986) Long-period variations of sea·level in Australasia. Geophysical
Journal of the Royal Astronomical Society, 87: 43-54.
Pattiaratchi C & Buchan S. (1991) Implications of long-term climate change for the leeuwin Current.
Journal of the Royal Society of Western Australia, 74: 133-140.
Payne Al, Curry PJ & Spencer GF. (1987) An inventory and condition survey of rangelands in the
Carnarvon Basin, Western Australia. Technical Bulletin No. 73, Department of Agriculture and
Food, Perth, 478p.
Playford PE . (1990) Geology of the Shark Bay area Western Australia, in Research in Shark Bay:
Report of the France-Australe Bicentenary Expedition Committee, eds Berry PF, Bradshaw SD
& Wilson BR, Western Australian Museum: 13-32.
Read JF. (1974) Carbonate bank and wave-built platform sedimentation, Edel Province. Shark Bay,
Western Australia. In: BW. Logan et al. (Editors), Evolution and Oiogenesis of Quaternary
Carbonate Sequences, Shark Bay, Western Australia. Memoirs of the American Association
of Petroleum Geology. 22: 1-60.
Richardson l, Mathews E & Heap A. (2005) Geomorphology and Sedimentology of the South West
Planning Area of Australia: Review and synthesis of relevant literature in support of Regional
Marine Planning. Geoscience Australia Report Record, 2005/17.
Royal Australian Navy: RAN. (1993) RAN Hydrographic Office Chart 749 Shark Bay South Western
Sheet.
Standards Australia (2002) Structural design actions. Part 2: Wind actions. AS/NZS 1170.2.
United States Army Corps of Engineer~ : USACE. (1984) Shore Protection Manual. Waterways
Experiment Station, Corps of Engineers, Coastal Engineering Research Center.
United States Army Corps of Engineers: USACE. (2003) Chapter 4- Surf Zone Hydrodynamics, In:
Coastal Engineering Manual, Part 11 - Chapter 4, EM 1110-2-1100 (Part 11).
Wallace D & Boreham P. (1990) Predictions of Extreme Water levels Due to Storm Surge at Den ham . In: Department of Marine and Harbours. Carnarvon Fascine Predevelopment Study. Report No. DMH 02/90.
Western Australian Planning Commission: WAPC. (2001) Coastal Zone Management Policy for
Western Australia.
Western Australian Planning Commission : WAPC. (2013) Stotement of Planning Policy 2.6: State
Coastal Planning Policy. Prepared under Part Three of the State Planning and Development
Act 2005, Perth.
239-01-RevO Wardle- Dirk Hartog Sunday Island Bay 28

30411.299 ha
6
8
4
2
10
12
14
16
18
20
22
0
24
26
2
4
18
6
4
2
2
4
10
14
10
16
2
2
20
12
2
2
4
2 2
12
22
12
18
2
8
24
6
8
2
14
16
8
4
0
14
2
20
6
2
18
14
6
2
18
46
2
2
2
6
12
4
4
6
6
26
4
4
10
8
10
2
2
2
0
8
12
4
22
10
6
4
12
16
10
24
10
0
24
14
20
8
2
0
4
4
0
2
2
14
4
4
2
2
16
2
2
20
8
4
2
2
2
16
44
10
2
2
14
4
16
0
SHARK BAY
DIRK HARTOG ISLAND
SHIRE OF SHARK BAY
100 0 100 200 300 400Metr es
HeadingRefer to this map as a Smartplan Tenure Map of :
1:5,000Sca le:
Surveyed BoundaryUnsurveyed BoundaryGrouped Lot BoundaryRoad FrontageUnsurveyed Road FrontageSurveyed Water MarkUnsurveyed Water M ark
CADASTRAL BOUNDARIES ADMINISTRATION BOUNDARIESLand DistrictLocalit yTownsiteLocal Government
SUBIACO LOCALITY
SWAN DISTRICT
Authority (LGA)
PERTH TOWNSITE
SHIRE OF MOUNT MAGNET
Types of InterestsE = Easement; Int = Interest;TP = Tree Plantation;PP = Prof it A Prende;CR = Carbon Right;CC burden = Carbon Covenant burden;CC benefit= Carbon Covenant benefit
InterestsTENURELot on SurveyCrown AllotmentCrown ReserveUnal located Crown LandLeaseMarine Park
Closed RoadState ForestTi mber ReserveRoadSURVEY INFORMATIONL 3114/1194
137264
UCLR 33853
SUES RDSUES RD OR
CLOSED ROADF 14
O 148 /25
Area 1012m or 2.1457ha2MARINE PARK 4
CULTUREAirport/Landing GroundBridge or CrossingRailway LineRailway Stat ion
o
!(
HYDROGRAPHICRiver or WatercourseLake or Dam
Our Ref : Job XXXX 11/12
Univer sal T ran svers e M erca tor.Horizo ntal: Geog rap hical - Ge ocen tric Da tum of Au stralia 199 4 ( GDA94) Gr id - Ma p Gr id Austr alia 1 994 (M GA94) Zo ne XXVe rtical: Au stra lian He ight Datum 19 71.Gesm ar u sing Wester n Aust ralian Prim ary T rig ono met ric T rave rse s, Stan dar d Sur veys a nd L evelling .+/- 1.0 millime tre at m ap s cale f or a rea s/bo und arie s tha t hav e no t be en s patia lly upg rad ed ( thistran slates to 2 me tres at 1 :2 0 00 a nd 250 met res at 1 :250 000 ).+/- 0.2 met res in spa tially up gra ded ur ban are as.+/- 2.0 met res in spa tially up gra ded ru ral a rea s.+/- 10.0 me tre s in sp atially u pgr ade d p astor al/r emo te a rea s.On th e Spa tial Cad astr al Dat aba se (SCDB) from La ndg ate Pu blic Plans and To pog rap hic Dat aset s at sc ales va rying fro m 1 :1 0 00 to 1: 500 000 .Latitu de a nd longit ude are sho wn in d egr ees , min utes and seco nds.Map Grid of Au stralia (M GA94) coo rdin ates are shown in m etr es Cadas tral a nd Ten ure info rm ation sour ced fro m th e Spa tial Cad astr al Dat aba se (SCDB).Ad ministr ative bou nda ries are sou rced fro m th e L andg ate Admin istrat ive Bou ndar ies Da tase t.Top ogr aph ical da ta so urc ed fr om the PSM A Data set.Road Name s sou rced fr om L and gat e Roa d Cen tre lin e Da taset .Coastlin es an d sh ore lines a re in ter pre ted fro m ae rial p hot ogr aph y or reco rd ed fr om gro und sur veys.Loca l Au tho rities t erm inat e at Low Wa ter Ma rk un less o ther wise sp ecified .Pa stor al Le ases term inat e 40 me tre s abo ve Hig h Wate r M ark unle ss oth erwise spe cified.Island s sho wn ar e Un allocat ed Cr own Lan d (UCL ) u nless othe rwise specifie d.
PRO JECTIO NDIMENSION DATUMS
GEODETIC CO NTROLHORIZO NTAL ACCURACY
COMPILATIO NGRATICULE VALUESGRID VALUESDATA SOURCES
MAP USER INFO RMATION
DISCLAIM ERTh is map is a p icto r ial rep resen ta tion of Landgat e
dat ase ts and is int ende d t o be a n ove rv iew o f general geospati al in fo rma tion.
Wh ile La ndga te has made eve ry ef fo rt to ensure the ac curac y a nd complet eness , it doesnot g ive any guaran te e o r t ake re sponsib ilit y f or erro rs o r omissi ons in the i nf orma tion.
Reliance shou ld on ly be p lac ed on the o r iginal surve y doc uments hel d a t Landgate . Thisma p may no t s how al l in fo rmat ion av aila ble in the o rig inal s urvey document s. Landgat e
does not ac cep t a ny liab ilit y f or any loss or damage incurred as a resu lt of the use o rrel iance upon the in fo rmat ion in th is ma p.
Hydrographic fea tu re s shown ma y not nec ess arily dep ict ex act cadas tral boundaries .Roads a nd trac ks s hown ma y not ne ces sarily imply publ ic r ight of way .
Grid North
Locality Map:

SUNDAY ISLAND BAY
SHARK BAY
DIRK HARTOG ISLAND
SHIRE OF SHARK BAY
11.299 ha304
6
84
2
10
12
14
16
18
2022
0
24
26
8
18
12
2
6
2
16
2
20
1010
4
2
4
4
6
2
4
2
6 2
2
16
4
12
2
8
16
44
4
14
10
20
18
2
2
2
2
8
18
22 2
6
6
2
2
12
2
16
14
6
24
6
10
4
2
10
6
8
8
4
12
4
4
10
4
2
12
10
6
14
0
2
14
14
20
8
222
4
0
0
2
2
12
4
4
2
2
14
2
2
18
8
4
2
2
16
4
10
2
2
14
416
0
722000
722000
722500
722500
723000
723000
723500
723500
7108
500
7108
500
7109
000
7109
000
113°14'0"
113°14'0"
113°13'30"
113°13'30"-26
°7'30
"
-26°7
'30"
100 0 100 200 300 400Metres
DISCLAIMERThis map is a pictorial representation of Landgate
datasets and is intended to be an overview of general geospatial information.While Landgate has made every effort to ensure the accuracy and completeness, it doesnot give any guarantee or take responsibility for errors or omissions in the information.Reliance should only be placed on the original survey documents held at Landgate. Thismap may not show all information available in the original survey documents. Landgate
does not accept any liability for any loss or damage incurred as a result of the use orreliance upon the information in this map.
Hydrographic features shown may not necessarily depict exact cadastral boundaries.Roads and tracks shown may not necessarily imply public right of way.
1:5,000Scale:
Grid North
Locality Map
Carnarvon
Kalbarri
LOT 304Sunday Island Bay
Refer to this map as a Skyview Map of:
Map Produced: 6 September 2012
Our Ref: Job 0400/12-13© Western Australian Land Information Authority 2011
www.landgate.wa.gov.au
Location Products & Serv ices, Operations, LandgateTel: (08) 9273 7181
Universal Transverse Mercator.Horizontal: Geocentric Datum of Australia 1994.Vertical: Australian Height Datum 1971.Map Grid of Australia (MGA) values are shown in metres.Longitude & latitude values are shown in degrees, minutes and seconds.Orthophoto sourced from SkyView WA ortho-rectified mosaics.Cadastral and Tenure information sourced from the Spatial CadastralDatabase (SCDB) of Western Australia.
MAP USER INFORMATION
PROJECTIONDIMENSION DATUMS
GRID VALUESGRATICULE VALUESDATA SOURCES
CADASTRAL BOUNDARIESSurveyed BoundaryUnsurveyed BoundaryGrouped Lot BoundaryRoad FrontageUnsurveyed Road FrontageSurveyed Water MarkUnsurveyed Water MarkLot Number 52
CADASTRAL HORIZONTAL ACCURACY+/- 1.0 millimetre at map scale for areas/boundaries that have not been spatially upgraded (this t ranslates to 2 metres at 1:2 000 and 250 metres at 1:250 000).+/- 0.2 metres in spatially upgraded urban areas.+/- 2.0 metres in spatially upgraded rural areas.+/- 10.0 metres in spat ially upgraded pastoral/remote areas.
Edel 1545October 20070.501270 dpi1:25 000 +/- 10m
ORTHOPHOTO MOSAIC INFORMATIONMosaic Name:Date F lown:Ground Pixel Size (Metres):Scanned at (dpi):Capture Scale:Accuracy:


