
1
Supplementary Information
Mechanochemical functionalization of disulfide linked hydrogels
Junmin Lee,a Meredith N. Silberstein,c Amr A. Abdeen,a Sang Yup Kim,b and Kristopher A. Kilian*a
aDepartment of Materials Science and Engineering and Micro and Nanotechnology Laboratory, and bDepartment of Aerospace Engineering and Beckman Institute for Advanced Science and Technology, University of Illinois at Urbana-Champaign, Urbana, IL 61801, USAcDepartment of Mechanical and Aerospace Engineering, Cornell University, Ithaca, New York 14853, USA
Electronic Supplementary Material (ESI) for Materials Horizons.This journal is © The Royal Society of Chemistry 2016

2
Experimental Section
Materials: All materials including laboratory chemicals and reagents were purchased from Sigma unless
otherwise noted. Tissue culture plastic (12 well plates) and glass coverslips (18 mm circular) were purchased
from Fisher Scientific. Thiol-terminated four-armed poly(ethylene glycol) (PEG4SH, MW 5000) was
purchased from JenKem. Cell culture media and 0.25% trypsin were purchased from Gibco. Rabbit anti-
Paxillin was purchased from Abcam (ab32084) and Mouse anti-Vinculin was purchased from Sigma (V9131).
Maleimide and fibrinogen fluorescein were purchased from Fisher Scientific (62245) and (F13191),
respectively. Fluoresceinamine was purchased from Sigma (Fluka-32615)) 4,6-diamidino-2-phenylindole
(DAPI), Alexa488-phalloidin, Tetramethylrhodamine-conjugated anti-rabbit IgG antibody, and Alexa Fluor
647-conjugated anti-mouse IgG antibody and were purchased Invitrogen.
Preparation of hydrogels: Disulfide hydrogels were fabricated as previously described.20 Briefly, 10 wt %
solution of PEG-4SH (dissolved in D.I. water) was mixed with 30% hydrogen peroxide (1% final
concentration) and sodium iodide (1mM concentration). To make bulk gels, the solution (100 μl was
injected into a 1cc/1mL syringe of which front end was cut to make gels with a cylinder shape. After desired
time, gels were gently taken out and put in D.I. water. To fabricate gels on a cover slip, the solution (15 μl)
was injected between a hydrophobic treated glass slide (bottom) and a 3-(Trimethoxysilyl)propyl
methacrylate (TMSPM) treated coverslip (top, 10 min with TMSPM and then baked at 95°C for 2 h). After
polymerization, gels were gently detached from the hydrophobic-treated glass and put in D.I. water.
Poly(ethylene glycol) diacrylate (PEGDA) of average molecular weight 10,000 was synthesized as described
previously26 . Briefly, dried PEG (Sigma-Aldrich) in dissolved in dichloromethane was reacted with a 3x
equivalence of acryloyl chloride and trimethylamine overnight at room temperature. Potassium carbonate
was then added for 1.5 hours. The PEGDA was filtered, extracted with cold ether and lyophilized. PEGDA
hydrogels were formed from 10% PEGDA solutions using 0.05% 2-Hydroxy-4′-(2-hydroxyethoxy)-2-
methylpropiophenone as a UV activated initiator. The gels were formed as described above under ~ 5
mW/cm2 UV crosslinker (Spectronics) for 10 minutes. For combinations of PEGDA and PEG-4SH, the 10%
3
PEGDA & PEG-4SH solution were mixed at different ratios and initiators were added. The mixtures were
gelled in the UV crosslinker for 10 minutes and then left for 2 hours to gel.
Gel density measurement: Gels were dried and then the dry gel densities were measured in weighting bottles
with hexane (nonpolar solvent)27. Briefly, the empty bottle weight (m0) and the weight of the bottle filled
with the solvent (m1), dry gel (ms), or both solvent and dry gel together (m2) were measured. The density of
dry gels was calculated with the following equation:
𝜌𝑠 =𝑚𝑠
𝑚1 ‒ 𝑚2 + 𝑚𝑠𝜌𝐿
where ρS and ρL are the dry gel density and the solvent density, respectively.
Gel swelling measurement: Gels were dried in a vacuum oven for 48 h and the weight of the dried gels (W0)
was measured. The dry gels were immersed in D.I. water at room temperature (~ 22°C) until swelling
equilibrium was attained. The weight of swelling-saturated gels (Wt) was determined after the removal of
the surface water. The swelling ratio was calculated with the following equation:
𝑆𝑤𝑒𝑙𝑙𝑖𝑛𝑔 𝑟𝑎𝑡𝑖𝑜 =𝑊𝑡 ‒ 𝑊0
𝑊0
The swelling ratios of all the prepared hydrogels were measured and compared.
Compression Testing: For 3D bulk gels, DMA tests were performed using RSA 3 (TA instrument) with
parallel plates of 25 mm in diameter. Prepared gel specimens were cut to the size of 5.5 – 6.5 mm in
diameter and 2.5 – 4.5 mm in length and placed on the bottom plate, and the top plate was closed until the
preload of 2 g was applied. Quasi-static compression was applied to the specimen with the ramping rates of
1 – 50 μm /sec until failure. The buckling of specimen was carefully controlled during the compression to
avoid any premature failure. For 2D gels fabricated on cover slips, compression was performed with
patterned or non-patterned polydimethylsiloxane (PDMS, Polysciences, Inc.) stamps. To generate patterned
surfaces, PDMS stamps were made by polymerization upon a patterned master of photoresist (SU-8,
MicroChem) fabricated using UV photolithography through a laser printed mask. Maleimide and acrylate-

4
fibrinogen fluorescein were employed to conjugate maleamide or acrylate groups to broken disulfide bonds
in the gels (For cell culture, 25 μg/ml of acrylate fibronectin in PBS was used). Acrylation of fibrinogen was
performed by conjugation of pendant amines with NHS-acrylate (10:1 ratio) in carbonate buffer of pH 9 with
1M NaCl for 4 hours28. Diluted Maleimide or acrylate-fibrinogen fluorescein in D.I. water (or acrylate
fibronectin in PBS) were pipetted onto patterned or non-patterned stamps for 30 min and dried with air.
Fluorescein or Proteins were transferred from stamps to the surface of gels by micro-contact printing with
compression (over 50 g for 30 min). Patterned gels were rinsed at least ten times and left for 1 day for
fluorescence imaging or cell cultures.
Tensile strain testing: Disulfide hydrogels were fabricated on Au sputtered PDMS as described above. PDMS
were fabricated with mixing Sylgard 184 silicone base and curing agent in a 10:1 ratio by weight. The mixture
was degassed to remove any bubbles in vacuum for 2 hours and poured over a flat Petri dish. The PDMS
was then baked at 75°C for 3 hours. After cooling, the PDMS was easily peeled and cut to 2 cm (length) x
1cm (width). Au was sputtered onto the exposed central region of 1 cm x 1 cm (Figure S4). The gels on the
Au-sputtered PDMS were stretched in a uniaxial direction by 0-40% strain.
Fluorescence imaging and Image Analysis after compression test: Immunofluorescence microscopy was
conducted using a Zeiss Axiovert 200 M inverted research-grade microscope (Carl Zeiss, Inc.) or an LSM
700 (Carl Zeiss, Inc.) which is a four laser point scanning confocal with a single pinhole. Immunofluorescent
images from the immunofluorescence microscopy or the LSM 700 were analyzed using ImageJ; the
fluorescence intensities of compressed (0-40%) gels were measured to compare different levels of
fluorescence depending on the degree of compression. All results were confirmed at least three times. The
relative intensity of the fluorescence was determined by comparing each intensity value to the average
intensity of zero compression.
Modeling of disulfide gel compression: The disulfide gel model was implemented as a vumat (user defined
material) within a finite element framework (Abaqus). The material was modeled based on our previous
work on elastomers29 with the simplification of assuming entirely chemical crosslinks (no network slip

5
allowed). The disulfide disassociation was modeled according to transition state theory assuming a linear
decrease in the energy barrier with force. The percent of intact disulfide bonds along a particular
orientation was taken to directly determine the percent of intact polymer chains along that orientation. The
initial crosslink density was fit to the mechanical response of the gel under monotonic compression. As is
standard in the literature the gel is assumed to be nearly incompressible. The disulfide bond energetic
parameters were then fit to the monotonic compression data at three strain rates. The percent of broken
disulfides for the experiments with the 30s hold at constant strain (stress relaxation) were then predicted
from these monotonic parameters.
Cell source and culture: Human MSCs isolated from bone marrow were purchased from Lonza. Cells were
tested for positive expression of CD29, CD44, CD105, and CD166 and negative expression of CD14, CD34,
and CD45 by flow cytometry (http://www.lonza.com). Mouse embryonic fibroblasts (MEFs) and murine B16
melanoma cancer cell lines (B16F0 and B16F10) were purchased from ATCC. Purchased cells were cultured
and then expanded. Cells were frozen in cryopreservation media (10% DMSO in Dulbecco's Modified Eagle's
Medium (DMEM)) with passage 2 and thawed and cultured in low glucose DMEM (1 g/mL) for MSCs or
high glucose for MEFs and B16s media supplemented with 10% fetal bovine serum (Invitrogen), and 1%
penicillin/streptomycin. Cells were passaged around 80-90% confluency. Media was changed every 3 or 4
days and cells were fixed after cultured for 5 days.
Immunocytochemistry: Cells cultured on the patterned or non-patterned surfaces for 5 days were fixed with
4% paraformaldehyde (Alfa Aesar) for 20 min. 0.1% Triton X-100 in PBS was used for 30 min to permeabilize
cells and these cells were blocked with 1% bovine serum albumin (BSA) for 15 min and then labeled with
primary antibodies in 1% BSA in PBS (1:500 dilution) for 2h at room temperature (~20 °C). Surfaces were
rinsed three times and then secondary antibody labeling was conducted in 2% goat serum contained 1%
BSA in PBS for 20 min at a humid incubator (5% CO2 and 37 °C) with 4,6-diamidino-2-phenylindole (DAPI,
1:2500 dilution), Alexa488-phalloidin (1:200 dilution), Tetramethylrhodamine-conjugated anti-rabbit IgG
antibody (1:200 dilution), and Alexa Fluor 647-conjugated anti-mouse IgG antibody (1:200 dilution).
Surfaces were rinsed three times and then mounted on a glass slide to conduct immunofluorescence

6
microscopy by using a Zeiss Axiovert 200M inverted research-grade microscope (Carl Zeiss, Inc.). ImageJ
was employed to count cell numbers and measure cell area.
Statistical analysis: Error bars represent standard deviation (SD) and data was obtained from 3 independent
experiments unless otherwise specified. For statistical analysis, two-tailed p-values from unpaired t-test for
comparing two groups were employed and values of P < 0.05 were considered statistically significant.
REFERENCES
(26) Aydin, D.; Louban, I.; Perschmann, N.; Blümmel, J.; Lohmüller, T.; Cavalcanti-Adam, E. A.; Haas, T. L.; Walczak, H.; Kessler, H.; Fiammengo, R.; Spatz, J. P. Langmuir 2010, 26 (19), 15472–15480.
(27) Chern, J. M.; Lee, W. F.; Hsieh, M. Y. J. Appl. Polym. Sci. 2004, 92 (6), 3651–3658.(28) Shoemaker, S. G.; Hoffman, A. S.; Priest, J. H. Appl. Biochem. Biotechnol. 1987, 15 (1), 11–24.(29) Silberstein, M. N.; Cremar, L. D.; Beiermann, B. A.; Kramer, S. B.; Martinez, T. J.; White, S. R.; Sottos,
N. R. J. Mech. Phys. Solids 2014, 63, 141–153.

7
Table S1. Density of different concentrations (5-20%) of disulfide hydrogels with different gelation time.
Table S2. Swelling of (5-20%) disulfide hydrogels with different gelation time.

8
Figure S1. Swelling properties of polymer blend hydrogels. (a) Swelling ratio of the gels with different concentrations of 4arm-PEG-thiols (gelation for 3 h) and different portion of PEGDA and 4arm-PEG-thiols. (b) Representative laser scanning confocal microscope images and fluorescence intensity of fluoresceine-5-maleimide across different swelling ratios.
0 10 20 30 40 50 600.00
0.05
0.10
0.15
0.20
0.25
Poly
mer
Cha
in F
orce
(nN
)
% Compression
Highest forceLowest force
Figure S2. Simulation of polymer chain force for disulfide hydrogels to predict the force-strain required for disulfide bond rupture.

9
MIXED GELPEGDA & PEGSH
(0 min)
PEGDAONLY
PEGSHONLY
MIXED GELPEGDA & PEGSH
0 hour
0.5 hour
1 hour
3 hour
24 hour
48 hour
acrylates peaks related to Michael addition
Figure S3. Nuclear magnetic resonance spectroscopy (NMR) confirmation of the kinetics of crosslinking with the pure and mixed gels to assess the formation of thioethers via Michael addition at different time points. NMR spectra were obtained with the polymers in D20. Spectra were referenced with the D2O peak as 4.67ppm. Spectra was obtained for mixing of the polymers at various timepoints from the same tube and normalized to total area.
0 15 300
150
300
450
600
Stre
ss (k
Pa)
% Compression
100% PEGDA50% PEGDA & 50% S-S25% PEGDA & 75% S-S
100% S-S (10%, MW10,000)100% S-S (10%, MW5,000)
45 60 75 90
45 48 51255075
100
% Comp.
S (k
Pa)
Figure S4. Plot of the stress-strain curve for the gels with different portion of PEGDA and 4arm-PEG-thiols and different molecular weight of 4arm-PEG-thiols.

10
40
45
50
55
Failu
re S
trai
n
MW5,000
MW10,000
N=5(a) (b)
Figure S5. (a) Simulation of the stress-strain curve for the disulfide gels with different degree of cross-linking in the dry polymer without changing the volume fraction of water in the hydrated. (b) Average failure strain (N=5) for the gels with different molecular weight (5,000 & 10,000 Da) of 4arm-PEG-thiols.
Figure S6. Tension initiates disulfide bond rupture in hydrogels. (a) Schematic illustrating the process of fabricating disulfide gels on PDMS sputtered with Au and application of tensile stress. Representative optical images of gels on the device. (b) Fluorescence intensity of fluoresceine-5-maleimide during tensile testing with accompanying simulation (c) representative laser scanning confocal microscope images of disulfide hydrogels across degrees of tensile strain.
11
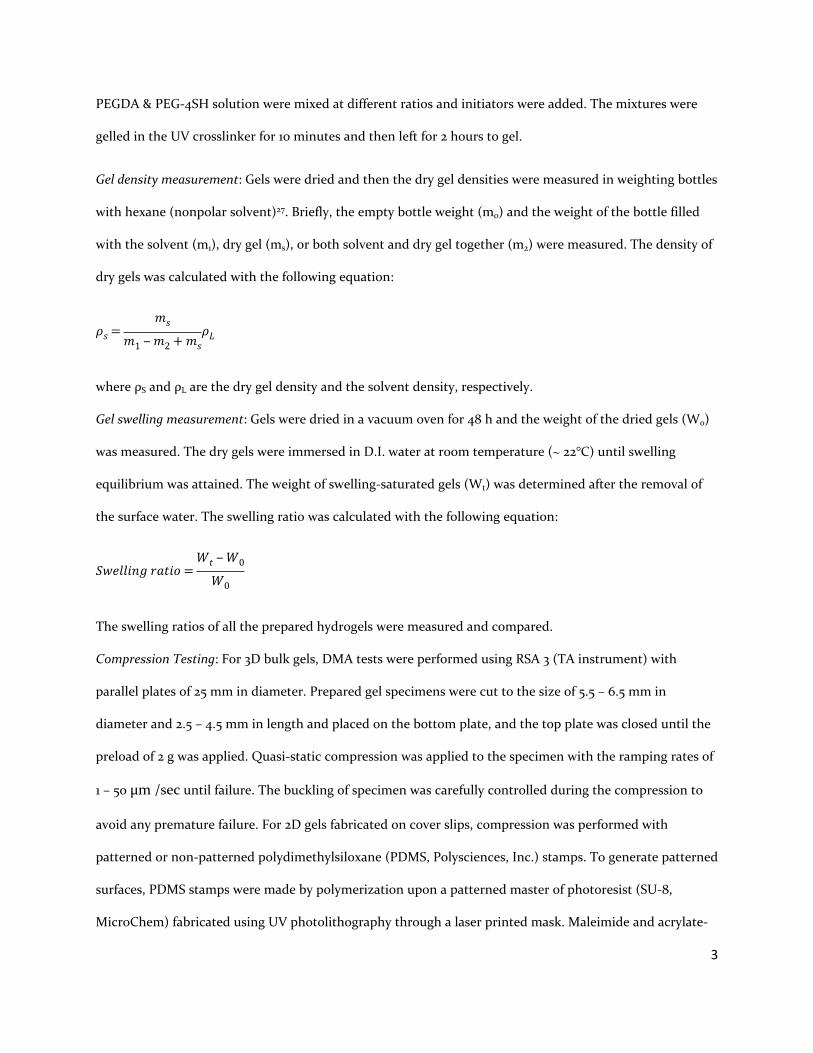
Maleimide-FL Amide-FL
w/o triton X-100 w/ 0.1% triton X-100 w/ 100% triton X-100
50 μm
100 μm
(a)
(b)
Figure S7. Ruptured disulfide bonds via compression lead to chemical reaction. (a) Representative immunofluorescence microscopy images of patterns through compression with fluorescein-5-maleimide and fluoresceinamine for 30 min. (b) Immunofluorescence images of gels with or without treatment of Triton X-100 after compression with acrylate fibrinogen fluorescein.


