
The Pennsylvania State University
The Graduate School
SUPPORTING COLLABORATIVE INFORMATION ANALYSIS
USING INTERACTIVE VISUALIZATION: A DESIGN
RESEARCH
A Dissertation in
Information Sciences and Technology
by
Dong Chen
c� 2021 Dong Chen
Submitted in Partial Fulfillmentof the Requirementsfor the Degree of
Doctor of Philosophy
May 2021

The dissertation of Dong Chen was approved by the following:
John M. CarrollDistinguished Professor of Information Sciences and TechnologyDissertation AdviserChair of Committee
Alan MacEachrenProfessor of GeographyA�liate Professor of Information Sciences and TechnologyDirector of GeoVista Center
Xiaolong ZhangAssociate Professor of Information Sciences and Technology
Mary Beth OliverDonald P. Bellisario Professor of Media StudiesCo-Director of Media E↵ects Research Laboratory
Mary Beth RossonProfessor of Information Sciences and TechnologyDirector of Doctoral Programs

iii
Abstract
Collaborative information analysis is a form of sensemaking that involves modeling
and representation of complex information space through synchronous and asynchronous
team interactions over extended periods. The e↵ectiveness of collaboration determines
team performance, which directly impacts the justice of decisions made or solutions
proposed. E↵ective collaboration is challenging because extra e↵orts are required to
develop and maintain team awareness on top of information analysis task, which itself
demands a high need for cognition.
A large number of researches have been conducted to support collaboration and
information analysis separately. For example, numerous tools and techniques have been
developed to facilitate the processing and visualization of information analysis, but
the majority are designed for individual use rather than for collaborative use. On the
other hand, collaborative tools, also known as groupware, are developed to improve
team e↵ectiveness, yet they often lack support for advanced information modeling and
representation. A gap exists between the two research areas, a design space yet to be
explored when a team is engaged in collaboratively analyzing a set of data. Simply
applying design implications from both areas together should not work because we must
address the tension of need for cognition between them. To some extent, the task of
collaborative information analysis is a di↵erent activity from either. People are engaged
in a di↵erent workflow and face new challenges, which this research tries to understand
and support.

iv
Evaluating e↵ective tool support for collaborative information analysis is another
multifaceted and complex problem. Researchers often reduce the complexity of the
analytic task for the sake of ease of measurement. In practice, it is challenging to model
complex analytic scenarios in lab studies, which span only a couple of hours. Meanwhile,
real cases and professional analysts are often limited to access in reality. However, the level
of task complexity directly determines the need for cognition in analysis and influences
the collaboration strategy teams will employ. This research addresses the challenge of
empirical evaluation and targets situations in which professionals need to both analyze
complex information and collaborate.
My research starts with a task analysis of an example of collaborative information
analysis in the real world: an undergraduate course of Intelligence Analysis at Pennsylvania
State University. I described student analysts’ workflow and their team behavior with
current tooling. Specifically, the study observes that structured techniques are frequently
employed but lack serious collaborative support. Based on the observation, five design
objectives are proposed for a better collaborative tool. These objectives drive the design
and development of a new tool out from this dissertation, CAnalytics, an integrated
analytic workspace that supports real-time collaborative data annotation for information
modeling and collaborative data visualization for information analysis.
CAnalytics is evaluated in two classroom studies, in which students are being
trained to become professional information analysts. I did a quantitative analysis of
system logs and student reports, as well as a qualitative analysis of questionnaires. The
first study emphasizes the assessment of integrating structured information modeling
and visualization in a single collaborative workspace. I analyze di↵erent team behaviors
v
in multiple dimensions and their interaction with team performance. The second study
focuses on supporting a higher-order information analysis activity, i.e. collaborative
hypothesis development, using a structured approach. Both studies contribute to the
understanding of analysts’ team behavior in collaborative information analysis and the
role of computing tools in support of both collaboration and information handling.
In summary, this dissertation contributes an understanding of how analysts use
computing tools for collaboratively analyzing information in the real world. The research
produces a collaborative visualization tool that leverages structured techniques from the
intelligence community as well as design knowledge of team awareness from the CSCW
(Computer-Supported Collaborative Work) community. The classroom studies evaluate
design choices and help identify emerging design challenges. The dissertation ends with
design implications and proposes that structured techniques and collaboration be enablers
for each other.
vi
Table of Contents
List of Tables . . . . . . . . . . . . . . . . . . . . . . . . . . . . . . . . . . . . . . x
List of Figures . . . . . . . . . . . . . . . . . . . . . . . . . . . . . . . . . . . . . xi
Acknowledgments . . . . . . . . . . . . . . . . . . . . . . . . . . . . . . . . . . . xiv
Chapter 1. Introduction . . . . . . . . . . . . . . . . . . . . . . . . . . . . . . . . 1
1.1 Introduction . . . . . . . . . . . . . . . . . . . . . . . . . . . . . . . . 1
1.1.1 Motivation . . . . . . . . . . . . . . . . . . . . . . . . . . . . 1
1.1.2 Problem . . . . . . . . . . . . . . . . . . . . . . . . . . . . . . 3
1.1.3 Research methods . . . . . . . . . . . . . . . . . . . . . . . . 4
1.1.4 Dissertation structure . . . . . . . . . . . . . . . . . . . . . . 4
Chapter 2. Literature Review . . . . . . . . . . . . . . . . . . . . . . . . . . . . . 6
2.1 Task of Collaborative Information Analysis . . . . . . . . . . . . . . 6
2.1.1 Modeling the task of information analysis . . . . . . . . . . . 7
2.1.2 Structured techniques . . . . . . . . . . . . . . . . . . . . . . 12
2.2 Collaboration and Awareness . . . . . . . . . . . . . . . . . . . . . . 18
2.3 Technology to Support Collaborative Information Analysis . . . . . . 22
Chapter 3. CAnalytics: Tool Supporting
Collaborative Information Analysis . . . . . . . . . . . . . . . . . . . 28
3.1 Task Analysis . . . . . . . . . . . . . . . . . . . . . . . . . . . . . . . 28

vii
3.1.1 Major activities: data annotation, data analysis, and hypothe-
sis development . . . . . . . . . . . . . . . . . . . . . . . . . . 29
3.1.2 Collaboration . . . . . . . . . . . . . . . . . . . . . . . . . . . 32
3.2 Design Objectives . . . . . . . . . . . . . . . . . . . . . . . . . . . . . 33
3.2.1 Objective 1. Provide an integrated, dynamic analytic workspace 34
3.2.2 Objective 2. Support structured data annotating and visual-
ization techniques . . . . . . . . . . . . . . . . . . . . . . . . 34
3.2.3 Objective 3. Support information sharing and team awareness 35
3.2.4 Objective 4. Support collaborative hypotheses development . 35
3.2.5 Objective 5. Capture team behavior . . . . . . . . . . . . . . 36
3.3 CAnalytics Features . . . . . . . . . . . . . . . . . . . . . . . . . . . 37
3.3.1 An integrated workspace: annotation, visualization, and hy-
pothesis . . . . . . . . . . . . . . . . . . . . . . . . . . . . . . 38
3.3.2 Multiple coordinated views of annotated evidence . . . . . . . 39
3.3.3 Information sharing and team awareness . . . . . . . . . . . . 41
3.3.4 User activity log . . . . . . . . . . . . . . . . . . . . . . . . . 43
3.3.5 Collaborative hypothesis development . . . . . . . . . . . . . 43
3.4 Implementation . . . . . . . . . . . . . . . . . . . . . . . . . . . . . . 45
3.4.1 Managing team analytic states . . . . . . . . . . . . . . . . . 45
3.4.2 Conflict resolution . . . . . . . . . . . . . . . . . . . . . . . . 50
3.4.3 View restoration and sharing . . . . . . . . . . . . . . . . . . 50
3.5 Summary . . . . . . . . . . . . . . . . . . . . . . . . . . . . . . . . . 51

viii
Chapter 4. The First Classroom Study . . . . . . . . . . . . . . . . . . . . . . . 53
4.1 Problem Statement . . . . . . . . . . . . . . . . . . . . . . . . . . . . 53
4.2 System . . . . . . . . . . . . . . . . . . . . . . . . . . . . . . . . . . . 53
4.3 Classroom Settings . . . . . . . . . . . . . . . . . . . . . . . . . . . . 54
4.4 Data collection and analysis . . . . . . . . . . . . . . . . . . . . . . . 57
4.5 Results . . . . . . . . . . . . . . . . . . . . . . . . . . . . . . . . . . . 58
4.5.1 Filtering vs. Accretion . . . . . . . . . . . . . . . . . . . . . . 59
4.5.2 Situational logic vs. Comparison . . . . . . . . . . . . . . . . 61
4.5.3 Inferential connection vs. Factual discrete . . . . . . . . . . . 64
4.5.4 Interleaving data annotation and analysis . . . . . . . . . . . 67
4.5.5 Collaboration and awareness . . . . . . . . . . . . . . . . . . 69
4.5.6 Interaction with team performance . . . . . . . . . . . . . . . 72
4.6 Discussion . . . . . . . . . . . . . . . . . . . . . . . . . . . . . . . . . 75
4.6.1 Sca↵old a structured interleaved workflow . . . . . . . . . . . 76
4.6.2 Represent uncertainty in collaborative analysis . . . . . . . . 79
4.6.3 Build collapsible views for multi-level modeling . . . . . . . . 81
4.6.4 Share views as team resource . . . . . . . . . . . . . . . . . . 81
4.6.5 Distinguish visible vs. valuable contributions . . . . . . . . . 82
4.7 Summary . . . . . . . . . . . . . . . . . . . . . . . . . . . . . . . . . 83
Chapter 5. The Second Classroom Study . . . . . . . . . . . . . . . . . . . . . . 85
5.1 Problem Statement . . . . . . . . . . . . . . . . . . . . . . . . . . . . 85
5.2 CAnalytics v2: supporting collaborative hypothesis development . . 87

ix
5.3 Use case demonstration . . . . . . . . . . . . . . . . . . . . . . . . . 90
5.4 Classroom study setting . . . . . . . . . . . . . . . . . . . . . . . . . 90
5.5 Data collection and analysis . . . . . . . . . . . . . . . . . . . . . . . 93
5.6 Result . . . . . . . . . . . . . . . . . . . . . . . . . . . . . . . . . . . 93
5.6.1 Confirming result from study one . . . . . . . . . . . . . . . . 93
5.6.2 Feedback on hypothesis development tool . . . . . . . . . . . 95
5.7 Discussion . . . . . . . . . . . . . . . . . . . . . . . . . . . . . . . . . 99
5.8 Summary . . . . . . . . . . . . . . . . . . . . . . . . . . . . . . . . . 101
Chapter 6. Discussion and Conclusion . . . . . . . . . . . . . . . . . . . . . . . . 103
6.1 Design research . . . . . . . . . . . . . . . . . . . . . . . . . . . . . . 103
6.2 Classroom study . . . . . . . . . . . . . . . . . . . . . . . . . . . . . 106
6.3 Analyst in control . . . . . . . . . . . . . . . . . . . . . . . . . . . . 108
6.4 Collaboration, structured technique, and the role of computing tools 110
6.5 Education in collaborative information analysis . . . . . . . . . . . . 112
6.6 Summary . . . . . . . . . . . . . . . . . . . . . . . . . . . . . . . . . 114
Appendix A. Team analysis report template . . . . . . . . . . . . . . . . . . . . 117
Appendix B. Pre-survey . . . . . . . . . . . . . . . . . . . . . . . . . . . . . . . 118
Appendix C. Mid-survey . . . . . . . . . . . . . . . . . . . . . . . . . . . . . . . 119
Appendix D. Post-survey . . . . . . . . . . . . . . . . . . . . . . . . . . . . . . . 120
Bibliography . . . . . . . . . . . . . . . . . . . . . . . . . . . . . . . . . . . . . . 123

x
List of Tables
3.1 Sample Information Extraction and Weighting table . . . . . . . . . . . 31
3.2 Specification of user activities . . . . . . . . . . . . . . . . . . . . . . . . 43
4.1 User reported awareness . . . . . . . . . . . . . . . . . . . . . . . . . . . 71
5.1 A demonstration of collaborative hypothesis development in CAnalytics V2 91

xi
List of Figures
2.1 Pirolli and Card’s Think Loop Model . . . . . . . . . . . . . . . . . . . 9
2.2 Wheaton’s multiphasic model of information analysis process) . . . . . . 10
3.1 Participant reported intelligence analysis workflow . . . . . . . . . . . . 30
3.2 CAnalytics user interface . . . . . . . . . . . . . . . . . . . . . . . . . . 37
3.3 Annotation in document view . . . . . . . . . . . . . . . . . . . . . . . 39
3.4 Utility for location annotation . . . . . . . . . . . . . . . . . . . . . . . 40
3.5 Hypothesis development with linked views . . . . . . . . . . . . . . . . 44
3.6 State management in a dynamic system. . . . . . . . . . . . . . . . . . . 46
3.7 Diagrams showing two state management approaches. a) Event-driven
approach: each interface component manages its own state and updates
itself driven by events. b) My approach: a central state manager takes
care of all events and notifies interface components whenever there is a
need to update. . . . . . . . . . . . . . . . . . . . . . . . . . . . . . . . . 47
3.8 Event flow in a collaborative system. . . . . . . . . . . . . . . . . . . . . 49
4.1 Classroom setting . . . . . . . . . . . . . . . . . . . . . . . . . . . . . . . 56
4.2 Survey responses (box shows Q1-Q3 and median; ends of whiskers show
maximum and minimum) . . . . . . . . . . . . . . . . . . . . . . . . . . 59
4.3 Network artifact comparison: filtering (a) vs. accretion (b) . . . . . . . 60

xii
4.4 Pie charts showing di↵erent labor division strategies. Each pie chart
corresponds to annotations created by one team member. (a) Document-
based collaboration. Each pie chart shows the documents a team member
annotated, color coded by document ID. It is clear from the graph that
the three team members work on di↵erent documents. (b) Entity-based
collaboration. Each pie chart shows the entity types a team member
created, color coded by entity types. It is clear that the three team
members create di↵erent entity types across documents. . . . . . . . . 61
4.5 Graph showing the timeline of one team creating annotations. Each row
corresponds to one team member. Each bar represents an annotation,
color coded by document ID. The red blocks highlights the periods when
teammates worked on the same documents simultaneously. . . . . . . . . 63
4.6 Network artifact comparison: separate clusters (a) vs. connected clusters
(b). The parts highlighted in red squares in (b) are key evidence that
connects clusters . . . . . . . . . . . . . . . . . . . . . . . . . . . . . . . 64
4.7 Three di↵erent representations of uncertainty for entity relationships . . 66

xiii
4.8 (a) Visualization of interaction logs of Team 107. Each row of colored
marks indicates the sequence of top-level activities a participant performed.
(b) State transition diagram of interaction logs of Team 107. Each node is
an activity, whose size represents the time spent on it (M: data modeling;
A: data analysis; H: hypothesis development; C: coordination); a link
represents a switch from one activity to another, whose width encodes
the number of switches. We see highly frequent transitions between data
modeling and data analysis . . . . . . . . . . . . . . . . . . . . . . . . . 68
4.9 The relationship between collaboration characteristics and team perfor-
mance. . . . . . . . . . . . . . . . . . . . . . . . . . . . . . . . . . . . . . 74
5.1 The improved timeline in CAnalytics V2 displays events schematized
by people. Selection on the left overview panel zooms the view into a
specific range of time. Selection on the right detailed view selects events
that overlap with a time range and applies a filter to other views (e.g.
map, table and network) to narrow down data relevant to the selected
events. This tool helps find alibi of suspects and identify correlation of
events/time with other pieces of information. . . . . . . . . . . . . . . . 88
5.2 The second classroom study setting . . . . . . . . . . . . . . . . . . . . . 90
6.1 Task-artifact co-evolution structured with design methodology from Car-
roll and Rosson (1992) . . . . . . . . . . . . . . . . . . . . . . . . . . . 105
6.2 Structured techniques, collaboration, and tooling . . . . . . . . . . . . . 113

xiv
Acknowledgments
I would like to express my deepest appreciation to Dr. John M. Carroll, my
advisor, for his support and guide during my doctoral program. He brought me into the
world of Human-Computer Interaction and has been continuously inspiring me to be
innovative and curious of the unknown.
My thanks also go to my committee members, Dr. Alan MacEachren, Dr. Luke
(Xiaolong) Zhang, and Dr. Mary Beth Oliver. Their constructive criticism helps improve
the quality of this research significantly.
The classroom studies of this research were conducted in the course by Col. Jake
Graham and Dr. Luke (Xiaolong) Zhang. I would like to thank them for providing me
with such a great research opportunity. This research will not be possible without their
support.
Finally, I want to thank my wife, Bing Wang, and my son, Leo Chen, for their
love, patience, and belief in me.
This material is based upon work supported by the National Science Foundation,
under Award No. 1450893, 2014-2015. It was also supported by assistantships at Penn-
sylvania State University. Any opinions, findings, and conclusions or recommendations
expressed in this publication are those of the author and do not necessarily reflect the
views of the awarding agencies.
1
Chapter 1
Introduction
1.1 Introduction
1.1.1 Motivation
Collaborative information analysis is a form of sensemaking wherein a team
analyzes a complex information space of facts and relationships to identify and evaluate
causal hypotheses. It is conducted in various domains and its e↵ectiveness is critical
to the justice of the resulting decision and conclusion. A common example is crime
investigation (Kirk 1953); a variety of putative facts are assembled, including financial
records, witness observations and interviews, and social connections of various sorts among
persons of interest, from which investigators collaboratively assess means, motives, and
opportunities, articulate and investigate further hypotheses and deductions, and develop
one or more theories of the crime. One of the challenges is the volume of information
and the level of sophistication of relationships among the information, which could easily
go beyond the capacity of individual human cognition.
Collaboration is critical in such complex tasks. E↵ectiveness of collaboration
determines team performance, and thus the justice of decisions made or solutions proposed.
Researchers have repeatedly found evidence of low performance of distributed groups
compared to face-to-face groups (as reviewed in Olson and Olson (2000)). They have
attributed the performance issues to extra e↵orts required to maintain awareness (Heath
2
et al. 2002; Gutwin and Greenberg 1998a) for distributed groups. To collaborate e↵ectively,
people need to know a lot about their collaborators: where they are, what they are
looking at, what they are working on, what they recently did, what they are planning to
do, what they know, what skills they have, who they know that might know something,
and so forth. None of the information, however, is intuitively available in distributed
settings.
Indeed, many deficits exist that could result in disruptions in the flow of com-
munication within distributed groups (Carroll et al. 2009): field of view diminished,
facial expressions are limited, the possibility to use gestures is reduced, sharing of tools
and artifacts is constrained, and exchanged information could be delayed. Further, in
the case of miscommunication, it is di�cult to repair, or even discover the resulted
misunderstanding. Even worse, the challenges become more salient as the range and
complexity of the task expand.
Collaborative information analysis tools, also known as Information analytical
groupware (Grudin 1994), are designed to facilitate analytic collaboration and collab-
orative sensemaking. Numerous tools have been developed in the research community.
However, these works often focus on amplifying individual cognitive abilities (e.g. Stasko
et al. (2008); Bier et al. (2008)), or collaboration with relatively simple tasks (for example,
trip planning). Most of them lack complex serious empirical evaluation studies (Goyal
and Fussell 2016; Convertino et al. 2011), or do not include a full-featured supporting
tool (Carroll et al. 2013; Borge et al. 2012). The state-of-the-art analytic tools that are
currently widely used, such as IBM Analyst’s Notebook (IBM 2017), and PARC ACH
(PARC 2017), are designed for individual use only.

3
1.1.2 Problem
This dissertation describes and discusses a design research that developed and
evaluated groupware for supporting collaborative information analysis.
A critical challenge for information analysts is building a structured preliminary
data model and ensuring that the data model is employed e↵ectively in hypothesis
development and evaluation (Wongsuphasawat et al. 2019; Kandel et al. 2012). This is
an open challenge. Standard structured techniques often do not support it at all; for
example, Analysis of Competing Hypotheses (ACH) assumes that data has been modeled,
and that relevant evidence can be adduced appropriately to various hypotheses, but
provides no structured support for either (van Gelder 2008). My work aims to build an
integrated environment which bootstraps a structured approach following which analysts
can build data model and develop hypotheses in one place.
Another challenge is to develop and maintain team awareness while engaging in a
cognitively demanding task. The concept of awareness has been a major focus in the field
of Computer-Supported Collaborative Work (CSCW) (Steinmacher et al. 2013; Carroll
et al. 2009; Heath et al. 2002). Research has investigated many aspects of awareness, its
role, and measurement, but its interaction with information analysis, more specifically,
usage of structured techniques is less examined. Support for structured techniques are
often designed for individuals, and its employment in collaboration is less researched
(Heuer 2009). This study focuses on awareness support in applying structured techniques.
Finally, the study aims to understand computer-supported collaborative work in a
close-to-reality environment. Many studies look into the usage of low-fidelity tools and
4
usage in a controlled lab experiment over a short period. It remains unclear whether
insights gained from those low-fidelity tools can be applied to more advanced interactive
tools. This is especially true for collaborative tools, because tools and teams often develop
into a new system over time, and can behave quite di↵erently as the system develops more
awareness (Stahl 2006). While new tools bring about new a↵ordances, they inevitably
introduce extra constraints. The new a↵ordances and constraints of the tool shape the
way users approach a task, and even completely transform the task itself (Carroll and
Campbell 1989). This research examines how analysts employ high-fidelity groupware in
their collaboration and observes their behavior in a natural environment, in particular,
in a classroom setting.
1.1.3 Research methods
To address the problem, I started with a task analysis (Schraagen et al. 2000) of
collaborative information analysis by observing team behaviors in an intelligence analysis
course at Pennsylvania State University. Based on the design requirements, I developed
a fully functional tool, CAnalytics, which supports collaborative information modeling
and analysis. The tool is then evaluated in two intelligence analysis classroom studies.
Each study is analyzed with qualitative and quantitative research methods. Results and
design implications are reported at the end of each study.
1.1.4 Dissertation structure
Chapter 2 models the task of information analysis, and explores popular structured
techniques. It then turns to a review of research on awareness in collaboration. The
5
chapter ends with a survey of available tools for supporting collaborative information
analysis.
Chapter 3 introduces CAnalytics, a collaborative visualization tool I designed and
developed for information analysis. I started with a task analysis and defined five design
objectives of CAnalytics. The chapter then highlights the major features of the system
and critical implementation details.
Chapters 4 and 5 present two classroom studies that investigate the design and
evaluation of CAnalytics. Study One focuses on evaluating the design of an integrated
collaborative workspace and the way the structured technique is performed. Study Two
examines collaborative hypothesis development. Each study yields design implications
for the field.
Finally, Chapter 6 reflects on the research method and lessons learned from the
result.

6
Chapter 2
Literature Review
2.1 Task of Collaborative Information Analysis
Collaborative information analysis is a form of sensemaking wherein a team
analyzes a complex information space, assertions involving people, places, transactions,
and events with varying relevance to the analysts’ concerns from sources with varying
credibility and reliability. In general, analysts seek to identify relationships beyond
facts that are literally specified in the original data. Taking a broad view of the task,
collaborative information analysis happens in a wide range of group activities that are
data intensive. Di↵erent forms of collaborative information analysis tasks are actively
explored in various research domains. For example, collaborative information seeking (CIS)
(Shah 2014) is capturing increasing attention as complementary to traditional individual
information seeking. Beyond simply searching and collecting information, researchers
note that CIS requires participants to also analyze and understand information (Paul and
Reddy 2010), which is similar to what we address here. Also, the visualization community
investigates interactive visualization techniques to assist collaborative analysis, known
as collaborative visual analytics (Isenberg et al. 2011), in which a team relies on the
“use of computer-supported, interactive, visual representations of data with the common
goal of contributing to joint information processing activities” (p. 312). Further, Web

7
2.0 techniques make “social data analysis” possible, wherein any people can upload and
share a dataset, and gain collective insights (Morton et al. 2014b).
Other examples of collaborative information analysis include intelligence analysis
where professional analysts integrate evidence and expertise to support hypotheses
(Heuer 1999; Prue et al. 2014), scientific collaboration in which researchers piece together
established theories and new findings to explain a phenomenon (Farooq et al. 2009), crisis
management where stakeholders share crisis context and resource distribution to make
rescue plans (Tomaszewski and MacEachren 2012; Convertino et al. 2011), healthcare
services where doctors share a patient’s information and make diagnostic decision (Reddy
and Jansen 2008), casual trip plans where a family synthesizes information about tourist
resorts and plans the route, and many other scenes.
To address the challenge of cognitive load and collaboration, we target information
analysis tasks that involve complex data. Specifically, we investigate in the domain of
Intelligence Analysis.
2.1.1 Modeling the task of information analysis
Given the similarity of information analysis in di↵erent domains, researchers have
proposed conceptual models to characterize the practice. These models abstract user
behavior patterns and help researchers think of these tasks on a high level, thus guiding
the design of supporting tools. Pirolli and Card’s (Pirolli and Card 2005) Think Loop
Model (Figure 2.1) is a well-cited model characterizing information analysis activities.
The model describes the iterative process of information foraging and sensemaking in
which raw evidence is successively aggregated, filtered, and synthesized into the most

8
reasonable hypothesis. In the model, analysts first identify and collate relevant information
from external data sources. From this collection, they then organize an evidence file of
propositions that can be used to make inferences. They next integrate evidence into
problem-oriented schemata. These schemata are used to articulate hypotheses, which
are evaluated to determine the best story of the information. The model is a bottom-up
process of structure building, but also includes a local feedback loop at each stage. Thus,
analysts can reconsider propositions in the evidence file, asking how they are related, or
a given hypothesis, asking what schemata it rests upon. While the Think Loop Model
identifies various leverage points for information analytic tools (especially in the area of
visual analytics), Pirolli and Card acknowledged that the model was only a starting point
to investigate the domain. Many problems remain unanswered by the model. For example,
the model is targeted at individual information analysis and does not account for the
social process in collaborative information analysis: How do analysts share their evidence
files? How do analysts synthesize their information schema? How do analysts negotiate
their hypotheses? Besides, the model stands from a data-centric view, describing how
data transforms and flows, rather than the way analysts work and transition (Kang
and Kiesler 2012). The work processes, however, are important to develop a useful and
usable system that can be integrated in real practice and ultimately transform the current
practice.
While Pirolli and Card’s model suggests a linear-like model, Wheaton (2011)
addressed a parallel, or multi-phased model. He conceptualized the process as four
functions: conceptual modeling, data collection, data analysis, and report production.
The four functions are not in sequence, but all begin almost immediately. Throughout

9
Fig. 2.1. Pirolli and Card’s Think Loop Model
the course of the analysis, the dominating function could shift at some point, and the
amount of time spent on each function could change. Similar patterns were observed in
Borge et al.’s study (2012). They observed behaviors of reading, sharing, synthesizing,
interpreting, decision making, and receiving new information, yet no linear pattern or
order of flow from one behavior to the other is observed. The workflow seems very flexible.
Similar findings were reported in Herrmann et al’s study (2013).
Several empirical studies are conducted to contribute to a deeper understanding
of the process of collaborative information analysis. For example, Chin Jr et al. (2009)
observed practices of five professional intelligence analysts. Their report serves as an
important source of truth because most professional analysts are inaccessible due to
the classification level of the content they address. They reported analysts first made
annotations in their source materials to highlight purported facts about people, places,

10
Fig. 2.2. Wheaton’s multiphasic model of information analysis process)
and events, then they constructed various artifacts to hold and present facts, and finally,
they tried to identify patterns or connections among facts.
Kang and Stasko (2012a) chose intelligence analysts in training as the research
target at a compromise of di�culty of accessing intelligence analysis professionals. They
conducted a longitudinal observational field study of an analysts’ training course. They
summarized that the analysis process covered four phases overall: conceptual model
construction, information collection, information analysis, and production. Their observa-
tion highlighted a number of misconceptions designers might have about the intelligence
analysis. For instance, intelligence analysis was more of an exploratory activity than an
answer-finding process. Analysts might not have a specific hypothesis in mind; instead,
they were like “cutting a path through the jungle that’s never been explored” (Kang and
Kiesler 2012, p.145), and did not necessarily know where they were going. Also, analysts

11
did not rely on a specific analytic tool; they tried out various techniques and strategies
to solve a problem.
Another type of empirical study is a laboratory experiment, in which ordinary
people are usually recruited to perform a controlled task, either with a low-fidelity
prototype (e.g. paper and pen) or existing commercial analytic tools. The premise is
that observations of people’s interactions with non-digital artifacts can help reveal the
basic work processes and thus inform functions digital tools should support. People’s
interactions with familiar tools would reflect the way they understand and think about
the problem at hand. For instance, Borge et al. (2012); Carroll et al. (2013) developed
a crime investigation scenario and recruited college students to investigate into the
case as groups. They identified six primary activities: 1) reading/searching intelligence
reports, 2) sharing information, 3) synthesizing information, 4) interpreting information,
5) making final decisions, and 6) receiving new information. With paper and pen,
participants spontaneously created graphic artifacts to aid reasoning and memory. Most
frequently seen artifacts included tables, lists, calendars, maps, node-link graphs, and
text annotations. When comparing performance across groups, researchers found that in
better-performed teams, participants had a higher proportion of “push” acts, in which
people voluntarily shared information with partners without being asked to. Also, groups
tended to perform better when they created artifacts to synthesize and schematize findings,
in addition to simply recording facts. Besides, high-performance teams were usually not
dominated by an individual. Collaborators contributed their expertise without block and
shifted authority as needed. Besides, Isenberg et al. (2008) conducted a paper-based
experiment and observed participants’ temporal sequence of processes in analysis. They

12
derived a framework characterizing the analysis activities, which consists of browse, parse,
discuss collaboration style, establish task strategy, clarify, select, operate, and validate.
Specifically, they noted that as opposed to many models, no typical temporal ordering of
the sequence was evident. Analysts approach the problem with di↵erent strategies and
workflows depending on the problem and the group dynamics. Similarly, Robinson (2008)
observed groups of expert geographers and disease biologists working on a collaborative
synthesis task with paper artifacts. Findings from these laboratory experiments also
contribute to the understanding of group behavior in information analysis and inform
the design of future systems.
2.1.2 Structured techniques
Structured techniques are often adopted in information analysis. Compared to
casual analysis, which often relies on experience and intuition, structured analysis provides
a systematic, transparent method to approach the analytic process. The rationale behind
structured techniques is e↵ectively encapsulated by Heuer’s claim (Heuer 1999, p.31):
Intelligence analysts should be self-conscious about their reasoning process.
They should think about how they make judgments and reach conclusions,
not just about the judgments and conclusions themselves.
Structured techniques externalize internal thought in a systematic and transparent
manner so that they can be shared, extended, and critiqued by other analysts. Thus
understanding structured techniques and their application in the state-of-the-art is critical
in designing and supporting collaborative information analysis.

13
However, due to the complexity of these techniques and limited support of tech-
nology, the practice of structured techniques is often simplified or even abandoned (Chin
Jr et al. 2009; Wright et al. 2006). It is an open question to address the tension between
the benefit of structured technique and time cost in implementation. This section reviews
three structured techniques that have been widely used in the intelligence community
and their challenges.
Analysis of competing hypotheses Analysis of competing hypotheses (ACH) (Heuer
1999) emphasizes a rational, transparent process of analysis. The general steps of ACH
are designed for systematic assessment of all hypotheses and evidence. These steps include
identifying a complete set of hypotheses, identifying all relevant evidence, assessing the
diagnostic value of each piece of evidence against each hypothesis, and drawing conclusions
of the likelihood of hypotheses. The principle of ACH is to refute rather than confirm
alternatives. ACH guarantees an appropriate analytic process and increases the chance to
avoid common analytical pitfalls. Studies by Lehner et al. (2008) and Lord et al. (1979)
demonstrate the function of ACH in reducing confirmation bias, the tendency to seek
and interpret evidence in favor of a theory perceived most likely a priori. PARC ACH
(PARC 2017) is an implementation of ACH, facilitating hypothesis and evidence input
and assessment.
Yet ACH has several pitfalls. For example, ACH does not provide a measure of
uncertainty among hypotheses. E↵orts have been made to combine ACH with probability
reasoning systems, such as pairing with Bayesian Network (Karvetski et al. 2013) or
Bayesian statistical model (Duncan and Wilson 2008). My research di↵ers from these

14
e↵orts in that I employ a human-centered design approach and investigate how technology
could assist teams of human analysts in applying structured techniques e↵ectively.
Gelder van Gelder (2008) listed five problems of ACH from a practitioner’s
experience. For example, ACH treats evidence as an individual entity, forcing analysts
to assess the value on its own with each hypothesis. In practice, however, evidence
diagnosticity is often mediated by other propositions; judgment of one item of evidence is
based on the judgment of several other items. The rigid matrix structure of ACH does not
allow for the factoring of these mediating propositions. Also, the ACH matrix represents
hypotheses in a “flat” structure: each hypothesis is entered individually across the top
row. In many cases, a more flexible representation of hypotheses is needed. For example,
a general hypothesis can have sub-hypotheses, and two seemingly distinct hypotheses
at the beginning of analysis might evolve into another alternative in a later stage. Such
a hierarchical structure of hypotheses is unlikely to be represented in ACH. Besides,
the judgment of the consistency of evidence with each hypothesis is decontextualized.
Analysts have to make a judgment on whether each item of evidence is consistent or
inconsistent with hypotheses, but the supporting evidence for that judgment is not
represented or documented anywhere. The issue, known as data provenance, is critical in
information analysis (Chin Jr et al. 2009). Lack of data provenance makes it di�cult to
ground a judgment, resolve group decision conflict, or correct mistakes.
In addition, I observed several deficiencies of ACH in my observation of student
analysts performing ACH in class when I worked with instructors in the Security and Risk
Analysis program. For example, manual e↵orts are required in generating and updating
views of data. Analysts have to manually copy and paste evidence from a document into
15
cells of ACH matrix. This is not only a redundant e↵ort but also subject to errors in the
process. This also results in a missing connection between evidence in the matrix and
the source of evidence in the original document. It is di�cult to review the credibility or
reliability of a piece of evidence later. Besides, information analysis is a dynamic process:
analysts tend to re-interpret and re-assess evidence iteratively. Once evidence is changed,
analysts have to manually change the evidence in the ACH matrix as well, which again
increases the chance of error.
Besides, ACH demands a high expertise bar for analysts. Users are required to
identify a complete set of mutually exclusive hypotheses at the very beginning, which is
di�cult for people with little expertise and experience in the domain. Further, hypotheses
tend to evolve as analysis proceeds. A hypothesis valid in the beginning may no longer
be of value later, or two seemingly separate hypotheses in an early stage of analysis could
be combined in a way to better explain the situation later on. The assumption ACH
makes that all hypotheses and evidence are identified and set in the very beginning limits
the dynamic development of analysis.
This research proposes to address these problems by employing a more flexible
approach and leveraging several other structured techniques. The developed tool integrates
information gathering with information analysis so that analysts can develop hypotheses
based on their generated data models and the insights can be traced back to the context
where data models were created. Building on the data models, the tool leverages such
structured techniques as link analysis and evidence marshaling to assist analysts in
hypothesis discovery and development.

16
Link analysis Much of the data in intelligence analysis can be represented in link
form, as a collection of connected nodes. Examples include contact reports (two people
witnessed together at a specific time and place), phone calls, and financial transactions.
Link analysis enables analysts to see the bigger picture of connections, and also reveal
patterns that might otherwise remain unnoticed. Link analysis helps analysts answer
questions such as “who is central in this organization?”, “What role does an individual
appear to be playing in an event?”, “How is this event related to other events?”, etc.
Link analysis is a popular structured technique employed in the intelligence
community. In their empirical study of professional intelligence analysts, Chin Jr et al.
(2009) emphasized the importance of link analysis in the reasoning process. They observed
that analysts created graphs by hand drawing facts and relationships, or used Microsoft
PowePoint to construct the network. A number of specialized tools are available, including
i2 Analyst’s Notebook (IBM 2017). These tools provide node-link visualizations and
facilitate storing, modifying, organizing, and querying links. But these tools are designed
for individual use only. For collaboration, participants have to either be physically
co-located and share the same screen, or screen capture the visualization and manually
share it through other tools.
Another issue of link analysis tools, similar to PARC ACH, is that analysts
have to duplicate data from the document space to the analytic space; they have to
manually construct entities and relationships in a separate tool, which, again, is not only
time-consuming but also might introduce unnecessary errors and lose data provenance.
Moreover, a criminal network is often characterized as dynamic rather than static
(Sparrow 1991). The relationships between entities often have a temporal distribution.

17
For example, a person who is trivial in an organization might become critical later, or in
a specific event period. This dynamic network feature often fails to be reflected in link
analysis tools due to their lack of temporal data structure.
The developed tool employs multiple coordinated views. It displays temporal
data in a timeline, spatial data in a map view, and relationship data in a node-link
graph. Views are coordinated, meaning that change in any one view will cause a change
in another view. Thus analysts can investigate the criminal network during a specific
time range when applying a temporal filter on the timeline, or network within a specific
geographic area when applying a spatial filter on the map.
Evidence marshaling Evidence marshaling is a common technique to tie the evidence
to hypotheses and assertions. The technique connects bits of information together
and provides a big picture of the story. It is an important step in Pirolli and Card’s
sensemaking model (Pirolli and Card 2005). Without tool support, analysts often do a
simple, informal marshaling in their minds. With an elaborate computer-based method,
analysts can coordinate events along a timeline, or organize evidence into stories about
typical topics (e.g. what, when, where, who, and how).
Several tools are designed to support evidence marshaling. For example, Entity
Workspace (Bier et al. 2010) displays an entity-based view of documents. Users can
organize their entity-based evidence into collapsible stories. Jigsaw (Gorg et al. 2014)
implemented a ShoeBox tool for evidence marshaling and note-taking. Users can record
hypotheses and connect them with supporting or contradicting evidence. However, they
eventually abandoned the design because it “was just too complex and did not allow

18
analysts to take free-style notes in the way they would do on paper” (Gorg et al. 2014, p.
342). As an alternative, they designed Tablet, a simplified tool for evidence marshaling,
which essentially is a networking tool linking entities as well as the interpretation of
entities. An advantage of the Tablet is that it becomes more flexible and users can do a
free-style note-taking much like on paper. Another recent tool is SAVANT (Goyal and
Fussell 2016), in which participants could make sticky notes anywhere in the dashboard,
and connect notes as their sensemaking process proceeds. They also include a hypothesis
window, allowing users to explicitly enter their hypotheses and supporting or refuting
evidence. Similar to the result of Jigsaw, however, their user study indicates that the
interface is too complex and discourages users from using it. Sandbox (Wright et al. 2006)
takes the metaphor of paper and analysts can arrange information within the workspace to
their need. Rich interactions are designed to facilitate information manipulation. However,
the authors conducted only a limited user study, thus there is insu�cient evidence to
determine whether or not the approach supports the analytic process e↵ectively.
2.2 Collaboration and Awareness
While several attempts, as discussed above, have been made to implement support
for various structured techniques, most of them are designed for individual use only.
However, prior work (Chin Jr et al. 2009; Warner et al. 2008) emphasized that the work
of information analysis at non-trivial scales is fundamentally collaborative, and that
the single person operating the software is a bottleneck to the team process. A report
from National Intelligence (Director of National Intelligence 2008) states that intelligence
analysis increasingly becomes a collaborative enterprise, with the focus shifting “from

19
traditional emphasis on self-reliance toward more collaborative operations ”. This is a
major change from the traditional concept of intelligence analysis as largely an individual
activity.
Structured techniques are reported to be best utilized in a group e↵ort so that
collaborative insights could be built (Heuer 1999). The transparency of structured
techniques ensures that divergent or conflicting perspectives among analysts are heard
and seriously considered early in the analytic process. For example, ACH is often used
in team collaboration because ACH leaves an audit trail showing what hypotheses were
identified, what evidence was used, and how they were interpreted. If teammates disagree,
the ACH matrix could highlight the source of disagreement, and be used to ground
further team discussion. Te@mACH is a recent advance in ACH technology, developed
by Globalitica, LLC, in 2010. It is designed as a collaborative version of PARC ACH. It
allows distributed analysts to work on the same ACH matrix simultaneously. Other tools
for supporting structured techniques, however, mostly remain a single-user application.
With single-user applications, teams of analysts have to rely on external view
sharing tools (Greenberg 1990) or manually share notebooks and screenshot graphs. This
has the consequence that the tools are employed only at specific points in an analysis,
often only in the early stages during which analysts are working on their own. Indeed,
the use of these tools directly diminishes a team’s activity awareness, requiring repeated
manual resynchronizing to identify redundant or missing pieces of information, analyzes
of information, and analytic hypotheses. This can be mitigated through maintaining and
pooling individual analysis reports using Google’s real-time editing tool set, Google Doc,
Google Sheets, Google Calendar, etc. These tools enable collaborative document editing,

20
and provide a revision history list of changes made to a document by each collaborator,
supporting awareness of teammates’ contributions. However, the Google tools themselves
are not integrated; each tool manages its own data representation. Thus an event report
in Google Doc cannot be exported to Google Calendar or Google Map. Non-existent or
weak support for coordinating multiple visual representations could undermine activity
awareness. We found this to be a specific source of problems in our study of spontaneously
created physical visualizations in the information analysis task (Carroll et al. 2013).
Vision 2015 also notes a shift “away from coordination of draft products toward
regular discussion of data and hypotheses early in the research phase”. This emphasizes
the importance of close coupling collaboration in the analytic process, as opposed to simple
coordination as the final step. A key enabler of such e↵ective and close collaboration is
activity awareness, a critical concept for research in computer-supported collaborative
work (CSCW). In prior work Carroll and his team (Carroll et al. 2003, 2011) developed a
conceptual framework, conducted design research investigations of software tools Carroll
et al. (2003, 2009); Ganoe et al. (2003), carried out field studies (Ganoe et al. 2003;
Schafer et al. 2008), and made controlled experimental studies (Convertino et al. 2008,
2009, 2011). That body of work produced several results: Activity awareness can be
measured, though this entails methods beyond those traditionally employed in awareness
research, including conversation analysis (Sacks and Je↵erson 1995) and artifact analysis
(Fleming 1974; Pearce 1994). Activity awareness grows with the development of reciprocal
knowledge about, experience with, and trust of partners. It is facilitated when the sharing
of collaborator-specific knowledge is implemented as an explicit, public and documented
interaction within the collaborative activity; indeed, activity awareness can be increased

21
beyond measured levels in face-to-face interactions (Convertino et al. 2011), a rare result
in computer-supported cooperative work (CSCW) sometimes referred to as “beyond
being there” (Hollan and Stornetta 1992). The growth of activity awareness qualitatively
changes coordination strategies that partners adopt (for example, early in a collaboration,
members pull information from partners by voicing their needs and concerns to the
team, but subsequently, as team members become more aware of the responsibilities and
roles of other members, they selectively push information to fellow members). Thus,
becoming a team does not merely speed up or improve coordination; it changes what
coordination means and what members do to coordinate. Activity awareness engages
active and meta-cognitive strategies for improving team cognition, for example, through
negotiating and sharing ad hoc representational artifacts (Carroll et al. 2013). Finally,
activity awareness can be e↵ectively supported with interactive tools, and the benefits of
supporting it can be measured.
More nuanced team behavior is reported in empirical studies. For example, Chin
Jr et al. (2009)’s study observed that the analysts preferred to review the original source
material. Analysts had distinctive and strong beliefs about the artifacts they created
themselves, yet claimed they would not trust another analyst’s artifacts, although they
believed they could achieve better results by collaborating with others. In another study,
Kang and Stasko (2011) found that analysts worked as a team throughout the process
and the degree of collaboration di↵ers depending on the type of task. These findings
reveal details of team behavior and are useful in understanding and designing for better
collaboration features.

22
2.3 Technology to Support Collaborative Information Analysis
As outlined before, a number of tools have been developed to support information
analysis. For example, the Analyst’s Notebook (IBM 2017) and ACH (PARC 2017)
are widely used in intelligence analysis areas. However, these tools were developed for
individual use only. Prior work demonstrated that the work of information analysis at
non-trivial scales is fundamentally collaborative. In practice analysts have to manually
share notebooks or graphs to coordinate their work.
As the need of support for collaborative information analysis is capturing increasing
attention, more technologies are being developed. Most of the tools take advantage of
visualization techniques and display awareness information in a visual way. This is not
hard to understand since the human visual channel has a high bandwidth and can take
in a large amount of information in a short time. Visualization can e�ciently capture
user attention and represent awareness information in a concise and vivid way. Fussell
and her colleagues (Balakrishnan et al. 2010; Goyal et al. 2013; Goyal and Fussell 2016)
have done a series of controlled, comparative laboratory experiments investigating the
e↵ect of visualization on collaboration. They found that groups using visualization tools
had better performance and shared visualization increased group discussion. Various
visualization techniques have been designed to facilitate di↵erent facets of awareness, and
most of them fall into the categories below:
- Who are collaborators. Knowledge of the existence of potential collaborators
and their skills and expertise is important. Forsen et al. (2009) proposed the concept of
Pinpoint, an interactive visualization radially presenting colleagues that are most closely

23
related and a↵ords browsing, filtering, and further exploration of the networks of the
organization. Marlow and Dabbish (2015) examined the e↵ect of visualization on the
attitude towards peer collaborators. They found that di↵erent details of visualization of
work history have a di↵erent impact on behaviors and attitudes towards collaborators,
which further influence group engagement.
- What are they doing. While it is easy to know what collaborators are doing in
face-to-face settings, e.g. pointing at a figure, walking towards a whiteboard, etc., such
signals are nonexistent in distributed collaboration and have to be explicitly supported
by technology. Therefore Stefik et al. (1987) introduced WYSIWIS (What You See Is
What I See), in which collaborators share the same view. While this design ensures
everyone looks at the same thing, it blocks production as only one person has control of
the view at one turn. A relaxed-WYSIWIS design (Gutwin and Greenberg 1998b) was
then proposed, which enables team members to have control of their own view while
having a miniature overview of partner’s workspace, known as radar view (Gutwin et al.
1996). Radar view conveys information not only about what collaborators are doing,
but also where they are working on. Greenberg et al. (1996) also proposed the idea
of telepointer, where participants can see the mouse cursor of their colleagues. They
then further augmented telepointers with traces that represent the previous motion of
the remote cursor. This provides a bit of context of the cursor and makes the mouse
gestures easier to interpret. Similarly, Hajizadeh et al. (2013) attempted to support
awareness of collaborator’s activities by visualizing their brushing actions. They found
that persistent selection, which adds a “fading-away” e↵ect to past selections, gets people
more aware of collaborators’ activities. MacEachren et al. (2001) proposed a “watcher”

24
window that includes a schematic display of collaborators, their actions, and the tools
being used. Such techniques are often applied in synchronous collaboration, attempting
to help collaborators stay aware of what others are doing by embodying a remote gesture
in visualization.
- What have they done. People may not be active in a team for all the time. When
they come back it is important to know what collaborators have done and what changes
they have made. In their approach to visualizing the change of data, Schumann et al.
(2013) used color to encode when a node was created. They also provided a replay function
to show the evolution. Similarly, Edwards and Mynatt (1997) visualized the history as a
non-linear tree and argued that the design enabled transition from loosely-coupled work
to tightly-coupled collaboration. In the context of collaborative Web search, Paul and
Reddy (2010) posited that displaying users’ search history avoids duplicated e↵orts and
increases team performance.
- Information sharing. Making sure everyone in the group has access to all
information and is aware of the existence of the information is essential for collaborative
information analysis. Participants can implicitly share information. For example, Goyal
et al. (2014) examined the consequence when user-generated notes are automatically
shared with other teammates. They found that participants remembered more clues
about the task and participants perceived the tool more useful when implicit sharing is
available. However, users may not want to share everything. They also need more control
over what to share and what to keep private (Mahyar and Tory 2013). Convertino et al.
(2011) designed an explicit but low-cost sharing mechanism through a “Copy-To” button.
Analysts could create geo features on their private map and only share those features they

25
wanted to onto a public map by manually clicking on the button. The function grants
users explicit control over their acts but requires extra e↵orts. Nobarany et al. (2012)
attempted to combine the advantages of explicit and implicit sharing. They introduced
the concept of “obscurity of privacy” and posited that information in a public space can
still maintain some level of privacy, depending on the availability of the information to
others, awareness of the availability, and the amount of attention it receives. In their
system, users can mark a piece of information as private, public, or published. Private
information is only accessible to the author. Public information is visible to all group
members but does not show up on a highlighted position. Published pieces are not only
visible to the group but also highlighted. The e↵ect of this more sophisticated sharing
mechanism, however, required further research, according to the authors.
- Insight sharing. Sharing insights enables people to build on the endeavors of
teammates and get aware of what others are thinking or why they are doing that. In the
project of Many Eyes (Viegas et al. 2007), a social visual analytic platform where people
can collectively analyze data and share visualizations, the primary way to exchange
ideas is through the comment system, where users can see other people’s comment on
a specific state of visualization. Another social platform, sense.us (Heer et al. 2008),
supports doubly-linked discussion, which means that comments and visualizations are
bi-linked: a comment is attached with a visualization (same as Many Eyes), and a specific
visualization is linked to comments if anyone has already commented on that state.
Annotation is a widely used technology to externalize analysts’ insights. For exam-
ple, Xiao (2008) asked participants to annotate the rationale when they are performing an
act, and found these annotations help other people understand why their colleagues did

26
that. Hopfer and MacEachren (2007) designed a geospatial annotation mechanism, which
attached annotation to a specific area of the visualization. This provides the annotation
with clearer context. Dorn et al. (2015) went further and constrained an annotation with
a temporal dimension. Their system allowed students to annotate on a specific position
of a video at a specific time point. The system helped instructors know better about
students’ puzzles and problems.
However, tools supporting information analysis are often targeted at a single phase
of activity, and thus not supporting the whole workflow. For example, research e↵orts have
been made to understand information collection and modeling (Shah 2014; Jansen and
Rieh 2010), but little support is provided to extend these models to analysis. Techniques
such as Information Extraction and Weight (IEW) helps structure data evidence but
o↵ers no structure to turn the evidence to hypothesis development. Similarly, tools
supporting the activity of data analysis assume data has been modeled. For example,
Analysis of Competing Hypotheses (ACH) assumes that data has been modeled, and that
relevant evidence can be adduced appropriately to various hypotheses, but provides no
structured support for either. Analytic tools such as interactive visualization emphasize
presenting data in insightful means but provides no utility to data re-modeling. Ware
(2012) warned of the “asymmetry in data rates” (p.382), pointing out that visual analytic
tools emphasized data flowing from systems to users far more than from users to systems.
Functionalities are mostly designed to adjust data representation rather than modeling,
which are in fact equally important. Similar calls were made in other data intensive task
domains as well. For example, in interactive machine learning, researchers (Chen et al.
2016; Amershi et al. 2015) call for an all-in-one environment in which machine learning
27
practitioners can iteratively refine training data and evaluate model performance through
visualization in one place. My work aligns with these e↵orts and contributes to the design
and evaluation of an integrated workspace in supporting information analysis tasks.
Another gap in the research of collaborative analytic technology is the lack of
rigorous empirical evaluations. Little is known about how analysts in the real world will
employ these technologies in their work processes, and how their work processes will be
transformed by these technologies. This study tries to investigate e↵ects of technologies
on di↵erent facets of activity awareness, and to examine the group processes that make
the e↵ects happen.

28
Chapter 3
CAnalytics: Tool Supporting
Collaborative Information Analysis
3.1 Task Analysis
We investigated the design needs for collaborative information analysis in three
ways. First, we examined existing works that already conducted empirical user studies
of information analysts, particularly the works by (Chin Jr et al. 2009; Carroll et al.
2013; Pirolli and Card 2005; Kang and Stasko 2012b,a). These works summarize the
design needs for supporting collaboration and analytics, as well as empirical user data in
support of their arguments. Among them, we used the works by Carroll and his colleagues
(Carroll et al. 2013; Borge et al. 2012; Borge and Carroll 2014) as the most important
guidelines because their paper prototype study context was most close to our study. In
their study, they observed 22 teams investigating a crime scenario using paper and pen.
Teams of participants spent four hours analyzing 222 propositions embedded in a set
of problem documents. This study sheds light on team process patterns, collaboration
breakdowns, and possible technical support teams need. We reused their experiment
materials in our second user study.
Besides, I worked closely with the Red Cell Analytics Lab at Pennsylvania State
University for over one year. The lab is an instructor-directed student club that is
designed to give students experience in analyzing real-world problems to prepare students

29
for the professional world by helping them develop structured analysis skills and critical
thinking capabilities. We worked with a fresh student analyst who had just begun to
learn the skills and two senior analysts who had more than two years of experience. We
met about once every two weeks, observing what and how they performed analytics
and having informal interviews in terms of why and pain points. We also talked to the
lab director, Colonel Jake Graham, who had rich in-person experience in professional
intelligence analysis and now a professor teaching analytic skills at Pennsylvania State
University.
Finally, We also observed an intelligence analysis course instructed by Colonel Jake
Graham. In the course, students learned theories of analysis (e.g. bottom-up analysis
vs. top-down analysis, and concepts of hypothesis, assumption, and evidence), analytic
techniques (e.g. Analysis of Competing Hypotheses (ACH) (Heuer 1999) and Link Analysis
(Sparrow 1991)), as well as the state-of-the-art tools to support the implementation of
those techniques (e.g. PARC ACH (PARC 2017) and Analyst’s Notebook (IBM 2017).
Below we summarized our findings.
3.1.1 Major activities: data annotation, data analysis, and hypothesis de-
velopment
On a high level, we observed three categories of activities: data modeling, data
analysis, and hypothesis generation. A typical workflow is shown in Figure 3.1. Analysts
received a collection of documents periodically. The documents included police reports,
social media collections, news reports, video summaries, and other textual data. Analysts

30
must extract useful information from these documents, connect these pieces of information,
make hypotheses of event indicators and warnings.
Fig. 3.1. Participant reported intelligence analysis workflow
Upon receiving the documents, analysts would read through and mark critical
information. With pen and paper, they highlighted text and made annotations. They
would extract these items and organize them in an “Information Extraction and Weighting”
table (3.1). In the table, they investigated each item’s face value and alternative value
against analytic problems. With computer support, they created “entities” in i2 Analyst’s
Notebook, a popular software product by IBM for data analysis and investigation. These
entities were data objects that described critical attributes and properties. Analysts
connected these entities by marking relationships between them. Some frequently seen
relationships included ownership, organizational belonging, and phone contact. Location
was a special type of entity. To represent the spatial information, analysts replicated
the location entities in Google Earth. One interesting detail was that analysts manually
exported the location icons used in Analyst’s Notebook and imported them into Google
Earth. The purpose was to keep consistent the representations in di↵erent tools.

31
Table 3.1. Sample Information Extraction and Weighting table
Another special entity type was “event”, which included a temporal attribute.
Event time was important for sequence analysis. Analysts added the start time and the
end time of an event, and the repeated date and time if it was a recurring event.
With the modeled data, analysts tried to find connections and patterns through
data visualization. They used Analyst’s Notebook network tool to map out the entities
and their relationships. The timeline tool in Analyst’s Notebook displayed the sequential
relationship and overlaps between events. They also used Google Earth and identified
spatial relationships among events. To share and keep record of supporting views, they
took screenshots and saved in a Microsoft Word document as evidence files.
Based on these evidence files, analysts generated and recorded hypotheses. These
hypotheses are in the form of text, but often refer to supporting evidence, either an entity
or a visualization of relationships between entities. To compare hypotheses, they often
employed the technique of Analysis of Competing Hypotheses (ACH). ACH lays out a full
set of hypotheses and examines each item of evidence of its diagnostic value against each
hypothesis. Instead of finding supporting evidence, analysts sought evidence to refute
hypotheses and decided which hypothesis was “least unlikely”. The final delivery was

32
an intelligence report, in which analysts composed their hypothesis and all supporting
evidence.
Note that we describe the three activities in a linear fashion for the sake of writing,
but analysis could be performed in any order, and most commonly, in an iterative
approach.
One problem in the workflow is a breakdown between activities. Systems that
support intelligence analysis are aimed at a single activity and therefore only support
part of the overall analysis workflow. This imposes a clear boundary between each of
these activities on the analysts. For example, IEW helps structure evidence modeling,
but does not extend the utilization of evidence to hypothesis generation; ACH assumes
that data has been modeled, and that relevant evidence can be adduced appropriately
to various hypotheses, but provides no structured support for either. The unintended
boundary between phases has the consequence that data modeled in one software cannot
be e↵ectively utilized in hypothesis development in another system. And analysts have
to hando↵ information between software systems, often by replicating the data in the
new system, making it di�cult to revisit and revise the data model in the other system.
3.1.2 Collaboration
Intelligence analysis is fundamentally a collaborative activity because the task can
easily become complicated enough that no single individual could handle it. Collaborative
intelligence analysis then becomes not only a mental process, but also a group process
that involves the management of team resources (tooling, teammate expertise, etc.),
teammate goals and motivations, and partner’s contemporary and past activities.

33
Most tools supporting intelligence analysis, however, are not designed for collabo-
rative use. We observed several pain points in participants’ collaboration. For example,
participants were unable to contribute simultaneously. Working on the same file would
cause conflict. Collaborators had to wait when one teammate was working on the tool.
This was known as production blocking (Diehl and Strpebe 1987), in which individual
performing a task became a bottleneck of the team process. To work around the issue,
participants often divided their work by tools: each person picked a tool and then
created and analyzed an artifact with the tool on their own. This had the consequence
that findings and hypotheses be made without integrating collective e↵orts and diverse
knowledge. Participants shared their findings only after they already had a conclusion,
which was obviously opposed to collaboration.
Analysts coordinated work outside the tool, by manually sharing documents or
graphs through email or cloud storage service (e.g. Dropbox). As shown in Figure 3.1,
analysts manually took screenshots of views and copied them into Microsoft Word. This
has the consequence that multiple views exist in distributed locations, adding a burden
to the analyst’s limited cognition. Analysts could easily overlook certain aspect when
they were evaluating hypotheses. The interactive views become static images, making it
impossible for collaborators to further explore. Worse, if the data model changes, analysts
must manually update the views, resulting in multiple versions of views.
3.2 Design Objectives
Based on the task analysis, five design objectives are proposed for the collaborative
analytic tool.

34
3.2.1 Objective 1. Provide an integrated, dynamic analytic workspace
While functions can be provided to support a single analytic activity (i.e. data
annotation alone, or data visualization alone, and indeed a lot of tools exist to support
either activity separately), a critical design objective is to integrate these functions in a
single workspace. This is more than simply putting together multiple functions; rather,
a smooth transition should be enabled between activities. The goal should be achieved
in at least two aspects: (1) the same data pool and structure is utilized in all analytic
activities. Data created in data annotation can be visualized in analysis, and utilized in
hypothesis development; (2) The system provides a consistent user experience in di↵erent
activities. Analysts should be confronted with a consistent user interface and interaction
throughout the process.
3.2.2 Objective 2. Support structured data annotating and visualization
techniques
Our design should allow for a structured approach to modeling and analyzing data.
Analysts spend a large amount of time and e↵ort annotating critical information from
text documents. The essence of an annotation is to turn a set of unstructured, noisy data
into structured, useful information while preserving its source. The tool should provide a
computational method that facilitates the annotation process so that analysts can focus
on information itself rather than the logistics.
The annotated data objects should then allow for a structured analysis of patterns
from multiple aspects through visualization. For example, temporal visualization helps
analysts keep track of the temporal evolution of events. Spatial visualization helps identify

35
patterns in the same area. Interactions should be provided so that analysts can coordinate
and arrange these views into a bigger picture. These closely presented views form into a
proximity-based projection (Kang et al. 2014), where each view presents a related insight.
Analysts can easily navigate these evidence views and marshal them together to support
hypothesis development (Pirolli and Card 2005).
3.2.3 Objective 3. Support information sharing and team awareness
Collaboration is a process of management of team resources and group process.
And a pre-requirement for group management is to stay aware of it. The tool should
enable real-time data sharing and explicit awareness support. Analysts should be able
to share source documents, annotated data objects, patterned views, and hypotheses
and insights in real-time. Partners can verify who identified and shared the information
and can validate against the source document. One’s activities should be transparent to
teammates so that everyone is aware of what their teammate is doing.
3.2.4 Objective 4. Support collaborative hypotheses development
A more advanced objective is to enable hypothesis development and particularly
collaborative development on a team basis. While simply sharing each teammate’s
hypotheses is beneficial, its positive impact is limited to an extent as it is not completely
leveraging the various expertise of a team. Where instead, the combining and evolving
of hypotheses from and by multiple members of the team (where the evidence that the
hypothesis is based on is included in the hypothesis object) creates an environment
where the team is more than just a sum of its parts. It should help analysts to share

36
their insights/hypotheses with supporting visualization early in the process. To impart
knowledge, visualizations conveniently improve the understanding of complex problems.
When users are exploring the visualization and find insight, they will be able to share the
insight together with the grounding visualization. The visualization will be interactive
rather than a static screenshot, keeping the ad hoc visualization state. Insofar as stating
unknowns is a di�cult task, at least making what analysts do know more explicit and the
assumptions that they made increases a large amount of transparency in their analysis
3.2.5 Objective 5. Capture team behavior
Other than assisting analysts in accomplishing the task more e�ciently, I develop
the tool as an instrument to gain a deeper understanding of team behavior. The computing
tool can capture and log all interactions analysts have made. While log analysis itself is
an ongoing research topic (Yi et al. 2007; Guo et al. 2016), these interaction data provide
a promising window into which researchers can identify insights in analysis patterns on
both an individual level and a team level. Compared to video recording, computing logs
with careful design preserve user interaction data in a good structure and make it ready
for data analysis without the hassle of human annotating. Log analysis is also easier to
scale up to analysis of longer-term interactions than video analysis (e.g. in Study One,
we have 73 persons (25 teams), each person working for about 6 hours, adding up to 428
hours!)

37
Fig. 3.2. CAnalytics user interface
3.3 CAnalytics Features
CAnalytics is a web application that aims to provide an integrated workspace
environment wherein teams of analysts identify, visualize, integrate, and assess facts from
multiple sources. The interface is shown in Figure 3.2. The design is informed by the
cognitive task analysis described beforehand. The system evolved over time. We tagged
it as two versions, corresponding to the two classroom studies I have done. Most of the
features are available in both v1 and v2, unless noted separately. in v2 we added a couple
of new features focusing on hypothesis development, which we will discuss below.
A use case of applying CAnalytics to an intelligence analysis project: https:
//youtu.be/2eE92My09Yo. A demo of real-time view sharing is available at https://
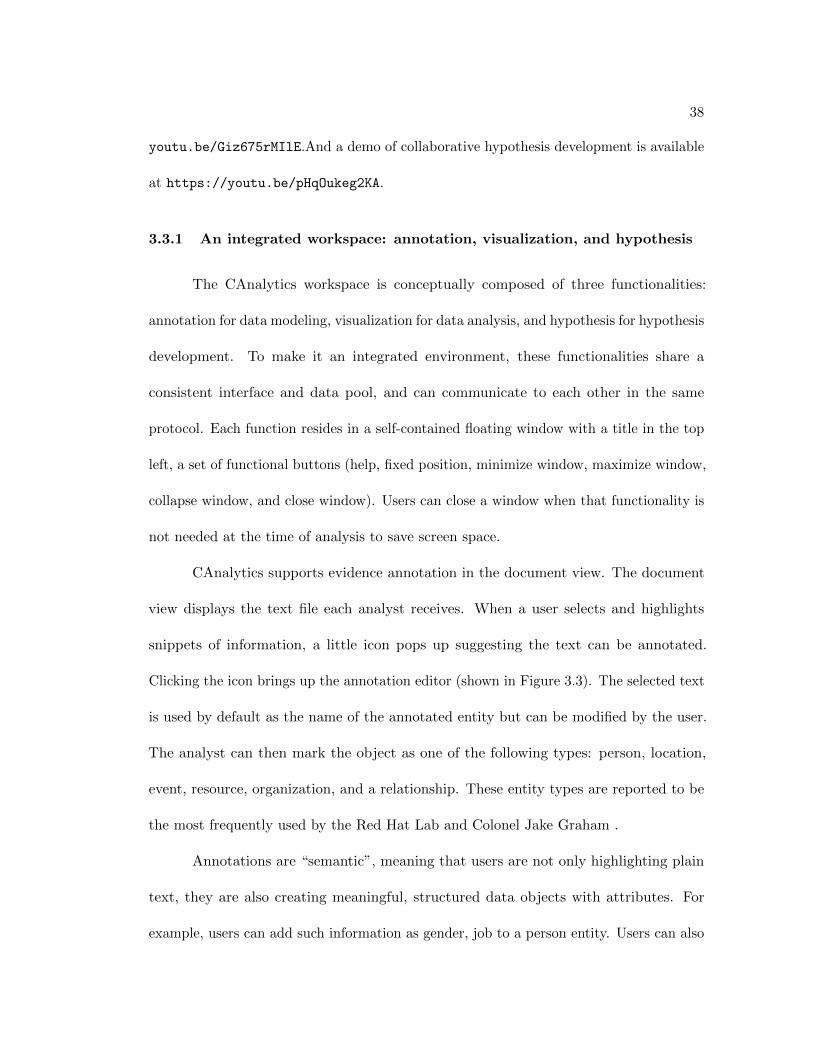
38
youtu.be/Giz675rMIlE.And a demo of collaborative hypothesis development is available
at https://youtu.be/pHqOukeg2KA.
3.3.1 An integrated workspace: annotation, visualization, and hypothesis
The CAnalytics workspace is conceptually composed of three functionalities:
annotation for data modeling, visualization for data analysis, and hypothesis for hypothesis
development. To make it an integrated environment, these functionalities share a
consistent interface and data pool, and can communicate to each other in the same
protocol. Each function resides in a self-contained floating window with a title in the top
left, a set of functional buttons (help, fixed position, minimize window, maximize window,
collapse window, and close window). Users can close a window when that functionality is
not needed at the time of analysis to save screen space.
CAnalytics supports evidence annotation in the document view. The document
view displays the text file each analyst receives. When a user selects and highlights
snippets of information, a little icon pops up suggesting the text can be annotated.
Clicking the icon brings up the annotation editor (shown in Figure 3.3). The selected text
is used by default as the name of the annotated entity but can be modified by the user.
The analyst can then mark the object as one of the following types: person, location,
event, resource, organization, and a relationship. These entity types are reported to be
the most frequently used by the Red Hat Lab and Colonel Jake Graham .
Annotations are “semantic”, meaning that users are not only highlighting plain
text, they are also creating meaningful, structured data objects with attributes. For
example, users can add such information as gender, job to a person entity. Users can also

39
make reference to other entities; for example, users can name people who were involved
in an event. Utilities are provided to assist in such input. Figure 3.4 shows the editor of
location annotation. A place name-based search utility is provided to help find the place
and geographic coordinates as users type. The location entity is then added to the right
place in the map automatically.
Fig. 3.3. Annotation in document view
3.3.2 Multiple coordinated views of annotated evidence
CAnalytics supports multiple views for data visualization. Each view provides a
means to schematize data, and thus an analytic perspective to understand data: Timeline
organizes data by time, so analysts can do time-sensitive analysis, such as the sequence
of events and overlap between events. The map visualizes evidence by location; analysts
40
Fig. 3.4. Utility for location annotation
can do spatial analysis over evidence, understanding the proximity of events. Node-link
graph demonstrates the entities and relationships; connected entities are pulled closer
by links and form into a cluster. This helps analysts easily decide the role of an entity:
if an entity has a lot of connections in a big cluster, it is likely that it plays a leading
role in the event. Finally, Table displays entity attributes and allows analysts to examine
entities in detail.
These views are generated automatically from user-created annotations. As shown
in Figure 3.2, when an annotation is created in the document module, with attribute
information about time, location, participants, and their relationships, a new event
is created in the timeline module, a new location is created in the map module, and
new people are created in the node-link graph module with a typed edge representing

41
relationships among the people (or new edges are added to existing nodes). Di↵erent
views are coordinated; that is, when users do a filter on a piece of information in
one view, related information in other views will be highlighted. Filtering on di↵erent
views/schematization provides di↵erent analytic strategies; e.g. timeline o↵ers filtering by
time, the map o↵ers filtering by location, and node-link graph o↵ers filtering by related
data objects. Based on the default view of the evidence, users can continue to schematize
it. For example, users can drag the nodes in the node-link graph to make clusters. Users
can also create a relationship in the graph by drawing a link between two nodes and
input relationship attributes.
3.3.3 Information sharing and team awareness
Annotations are immediately shared with collaborators. CAnalytics supports
real-time collaborative editing, similar to Google Tools. Users can open several concurrent
editors to collaboratively edit multiple annotations. Views are shared together with
hypotheses. Team members will then be able to understand the hypothesis right in that
visualization context. They can also leverage that visualization and continue exploring
by reorganizing the view, to challenge, confirm, or refine the shared hypothesis. In this
way, the team is leveraging each other’s e↵orts and co-developing hypotheses beyond
simply sharing. CAnalytics has a number of awareness features, including animation of
data change, a notification system, a design I named “tool coordinator”, a messaging
tool, and a history tool. As mentioned before, annotations and data objects created by
collaborators are immediately shared, and updated in the views. A fade-in and fade-out
animation in the views indicates the creation and deletion action by collaborators. A
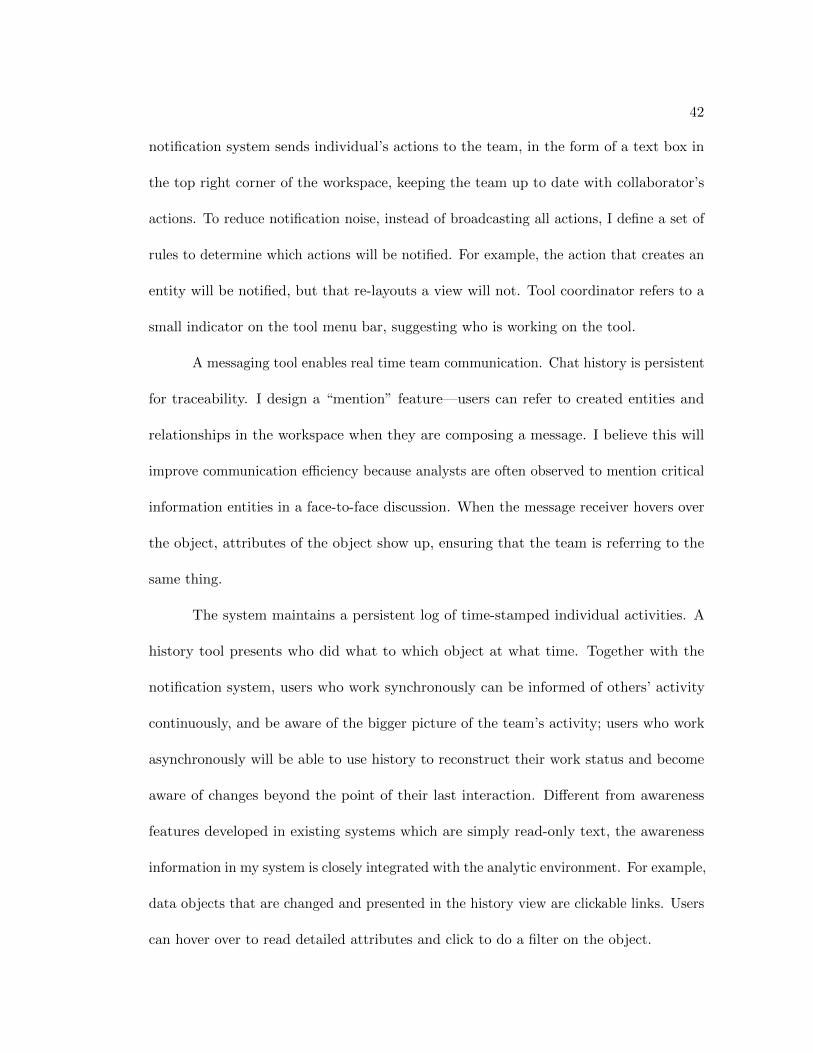
42
notification system sends individual’s actions to the team, in the form of a text box in
the top right corner of the workspace, keeping the team up to date with collaborator’s
actions. To reduce notification noise, instead of broadcasting all actions, I define a set of
rules to determine which actions will be notified. For example, the action that creates an
entity will be notified, but that re-layouts a view will not. Tool coordinator refers to a
small indicator on the tool menu bar, suggesting who is working on the tool.
A messaging tool enables real time team communication. Chat history is persistent
for traceability. I design a “mention” feature—users can refer to created entities and
relationships in the workspace when they are composing a message. I believe this will
improve communication e�ciency because analysts are often observed to mention critical
information entities in a face-to-face discussion. When the message receiver hovers over
the object, attributes of the object show up, ensuring that the team is referring to the
same thing.
The system maintains a persistent log of time-stamped individual activities. A
history tool presents who did what to which object at what time. Together with the
notification system, users who work synchronously can be informed of others’ activity
continuously, and be aware of the bigger picture of the team’s activity; users who work
asynchronously will be able to use history to reconstruct their work status and become
aware of changes beyond the point of their last interaction. Di↵erent from awareness
features developed in existing systems which are simply read-only text, the awareness
information in my system is closely integrated with the analytic environment. For example,
data objects that are changed and presented in the history view are clickable links. Users
can hover over to read detailed attributes and click to do a filter on the object.

43
3.3.4 User activity log
I designed the log schema based upon the work by Yi et al. (2007) and capture
the task the user intends to accomplish rather than their mouse movement. Actions are
categorized under the three top-level activities supported by the system: data modeling,
visual analysis, and hypothesis development. More detailed actions, their definitions, as
well as application-specific actions are shown in Table 3.2.
Table 3.2. Specification of user activities
3.3.5 Collaborative hypothesis development
All the above features are included in CAnalytics for the first classroom study.
In study two, I developed CAnalytics2. A major addition is a structured approach to
supporting collaborative hypothesis development.

44
Fig. 3.5. Hypothesis development with linked views
In study one with CAnalytics V1, teams put down their hypotheses and notes in
a shared note editor. The editor is similar to Google Doc, where text is synchronously
shared. Hypotheses are shared in plain text, and no structured support is provided. As
will be discussed in more details in the next chapter, my first study suggests participants
easily lost track of hypothesis development, and it was challenging to re-validate a
hypothesis because the context in which it was created was gone.
In CAnalytics V2, a hypothesis tool is developed as shown in Figure 3.5. At any
time during the process of making annotations or analyzing visualization, analysts can
create a hypothesis (with a textual note). In the meantime, the system will automatically
record the ad hoc visualization state of all windows, including the data, layout, filtering
conditions,etc., and save it together with the hypothesis. The hypothesis is shared with
collaborators together with the bound visualization. Teammates who are interested

45
in a specific hypothesis statement can restore the linked visualization. They can then
continue to interactively explore the graph from which the statement was derived, either
validating or deputing the previous hypothesis, or finding further evidence to propose a
new hypothesis. Watch the video demo at https://youtu.be/pHqOukeg2KA.
3.4 Implementation
3.4.1 Managing team analytic states
A particular challenge in implementing CAnalytics is e↵ective management of
dynamic states that occur throughout the information analysis process. Rather than
simply displaying a static set of data as in many visualization systems, data and views
in CAnalytics keep updating as analysts collect evidence, re-arrange views, and develop
hypotheses. Each change generates a new “state” in the analytic system, which is
like a “shot” of system dynamics that determine how a system looks like. Managing
the dynamically changing states is particularly important in collaborative analysis as
states of all analyst’s system should always keep synchronized; otherwise, a coordination
breakdown could occur.
Aligned with the three major activities in information analysis, I create state
managers for each activity, as shown in Figure 3.6. A data manager is in charge of the
raw documents, user-created entities and relationships, and annotations that indicate in
which part of a document is an entity created. A view manager controls the contemporary
visualization state in the system. It includes a global view state and a local view state.
The global state controls factors that a↵ect all the views in the system. For example, a
46
Fig. 3.6. State management in a dynamic system.
filter applies to all views so that the same subset of data is shown across views. A highlight
determines which entities are on focus and underscore them in their representation. A
local view state manages each individual visualization, including the position of the view
in the workspace, the view extent, the zooming level, etc. Finally, the hypothesis state
manager controls the current active hypothesis, as well as a path of hypotheses it builds
upon. The path keeps track of the development of hypotheses and enables analysts to
trace back.
User interactions drive the change of system states. These interactions are modeled
as events and controlled by a manager. Depending on the type of events, the system
includes a log manager, which saves events as system logs and team activity history, and
a sync manager, which broadcasts events to the other systems in the team.
After defining state managers and event managers, another challenge is to connect
them to function as a dynamic system. A common implementation is event-driven: each
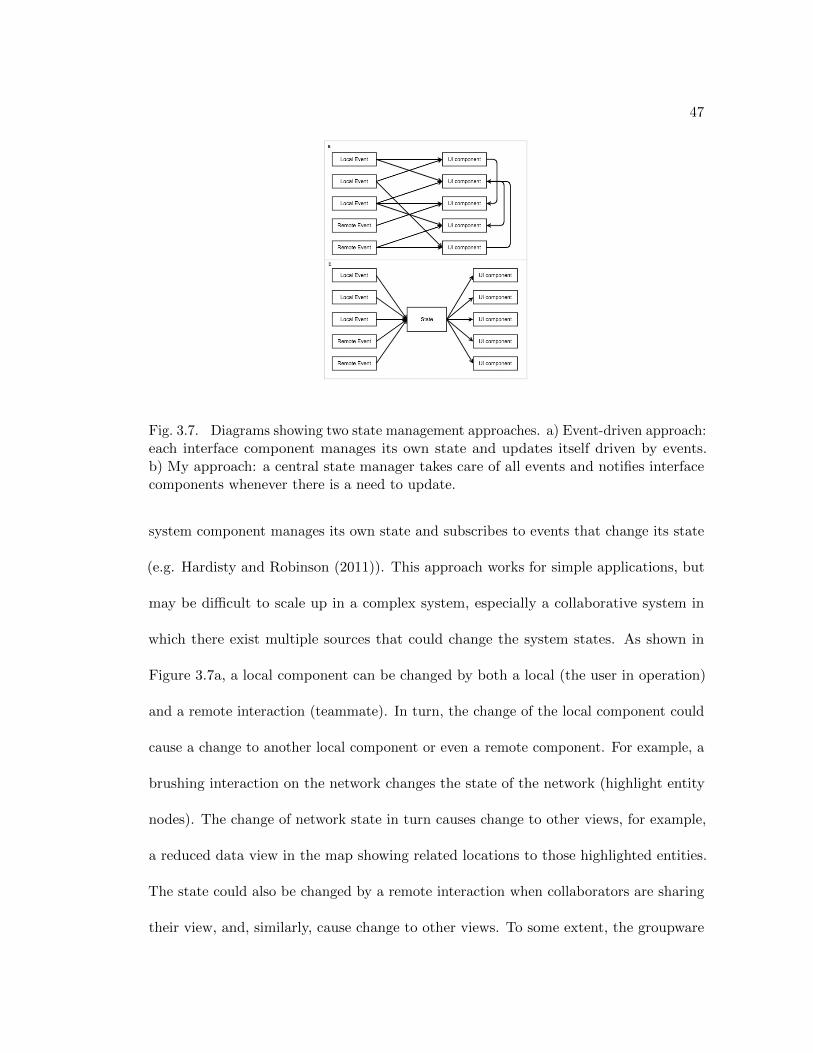
47
Fig. 3.7. Diagrams showing two state management approaches. a) Event-driven approach:each interface component manages its own state and updates itself driven by events.b) My approach: a central state manager takes care of all events and notifies interfacecomponents whenever there is a need to update.
system component manages its own state and subscribes to events that change its state
(e.g. Hardisty and Robinson (2011)). This approach works for simple applications, but
may be di�cult to scale up in a complex system, especially a collaborative system in
which there exist multiple sources that could change the system states. As shown in
Figure 3.7a, a local component can be changed by both a local (the user in operation)
and a remote interaction (teammate). In turn, the change of the local component could
cause a change to another local component or even a remote component. For example, a
brushing interaction on the network changes the state of the network (highlight entity
nodes). The change of network state in turn causes change to other views, for example,
a reduced data view in the map showing related locations to those highlighted entities.
The state could also be changed by a remote interaction when collaborators are sharing
their view, and, similarly, cause change to other views. To some extent, the groupware

48
developer no longer understands what changes a view, and the state of the groupware
would become out of control.
To address the issue, I employed a state-centered approach to make state control
more structured and clear. As Figure 3.7b shows, an event manager takes control of all
events, whether they are local or remote events. The event manager dispatches events to
di↵erent event handlers and makes changes to a central state manager. Whenever the
state changes, the state manager sends a signal to related interface components, notifying
them to update the view. This approach centralizes the management of states, and the
central state becomes the “single source of truth” 1. All user interfaces (including the ad
hoc user and teammates) subscribe to the state so that they will always be consistent.
A typical event flow is demonstrated in Figure 3.8. An event is triggered by a user
interaction. The event is sent to the Event Manager for processing. Depending on the
nature of the event, the event manager may do three things. The event could change
the local state directly (could be data, view, and hypothesis). The event is also sent to
the history manager. It is saved as a system log for research purposes. There are also a
set of rules that decide if the event is of interest to analysts. If it is, it is also saved as
part of team history. Finally, the event is also passed to the sync manager if considered
necessary. The sync manager then broadcasts the event to other systems in the team so
that it can make exactly the same change in their state.
The system employs a standard three-layer web application architecture. The
frontend is the application running in a browser that end users interact with directly.
It is implemented in Javascript and HTML. I use PostgreSQL as the database. The
1Single source of truth: https://en.wikipedia.org/wiki/Single_source_of_truth
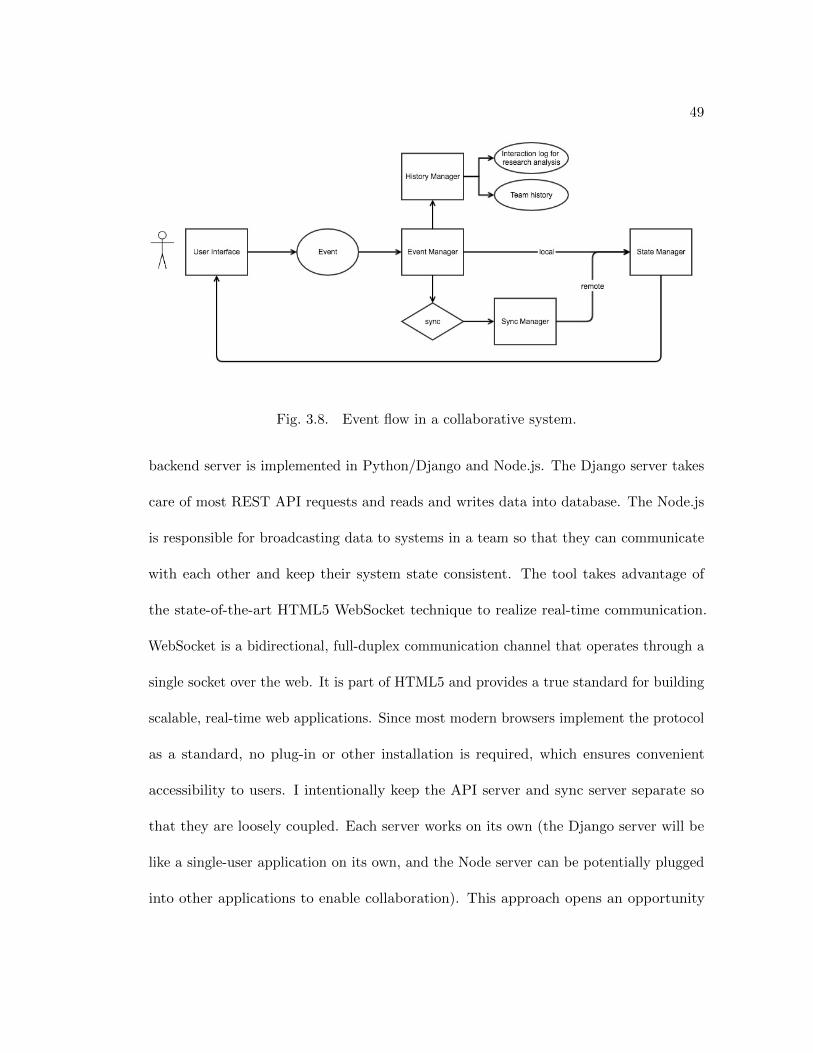
49
Fig. 3.8. Event flow in a collaborative system.
backend server is implemented in Python/Django and Node.js. The Django server takes
care of most REST API requests and reads and writes data into database. The Node.js
is responsible for broadcasting data to systems in a team so that they can communicate
with each other and keep their system state consistent. The tool takes advantage of
the state-of-the-art HTML5 WebSocket technique to realize real-time communication.
WebSocket is a bidirectional, full-duplex communication channel that operates through a
single socket over the web. It is part of HTML5 and provides a true standard for building
scalable, real-time web applications. Since most modern browsers implement the protocol
as a standard, no plug-in or other installation is required, which ensures convenient
accessibility to users. I intentionally keep the API server and sync server separate so
that they are loosely coupled. Each server works on its own (the Django server will be
like a single-user application on its own, and the Node server can be potentially plugged
into other applications to enable collaboration). This approach opens an opportunity

50
to develop the Node server into a service that provides a more general collaborative
functionality to standalone applications in the future.
3.4.2 Conflict resolution
An important consideration in supporting collaboration is conflict resolution. A
potential issue in CAnalytics is the addition of multiple annotations to the same text.
CAnalytics supports multiple annotations by stacking them and marking the author and
creation time of each annotation. The same issue may exist when users add multiple
relationships to two entities. The node-link graph in CAnalytics resolves the issue
by displaying multiple labeled links between two nodes (as in the node-link graph in
Figure 3.2). Therefore analysts can identify the potential conflicts and try to resolve
them. It is also possible that it does not conflict at all. It may be two possible hypotheses
due to uncertainty. In either case, this approach helps analysts identify potential issues.
3.4.3 View restoration and sharing
Views in CAnalytics are handled as global views and local views. Global views
refer to the window of each visualization, including which windows are open, the size of
the window, and its position. Global views are saved and shared in JSON format.
Local views are more complicated as they include all the nodes and paths in a
visualization. Positions of individual nodes are saved in order to restore the view to
the same layout the next time. This means a large amount of data will potentially be
downloaded and parsed when individuals intend to restore an existing view. This is still
fine (though it probably would take a longer time), yet presents a challenge for real-time

51
sharing. If we share the whole view state node by node in real-time, we need to pass a lot
of data for each frame, and several frames per second for smooth animation. Obviously,
this is not optimal. Instead of state sharing, I adopt event sharing. Only attributes of
an event, for example, type of event (e.g. ’click’, ’scroll’), the target of the event (which
node is the event applied to), are shared. When partners receive the event, the event is
applied to the visualization. Since each event has a deterministic e↵ect, the partner will
see the same animation and result of the visualization as the event source. By sharing
only events and ensuring event e↵ects are deterministic, we make real-time view sharing
a smooth experience.
3.5 Summary
To understand how teams will work with a collaborative analytic tool, a fully
functional system is needed. To meaningfully inform the design process, I started with a
task analysis of collaborative information analysis. I worked with a lab that specializes
in Intelligence Analysis and conducted an observational study of an undergraduate
course that teaches Intelligence Analysis. I observed three repeated activities: data
wrangling/modeling, data analysis, and hypothesis development. To answer an analytic
question, analysts transform and map data from raw documents to another format, and
feed it to a corresponding downstream analysis, based on which hypotheses are formed
and reported. While collaboration is essential, it is often blocked by the limit of tools:
teams either have no synchronous writing access to the same file or simply put together
individual findings in the end.

52
Based on my observation, I defined five design goals and developed CAnalytics,
a Web application that integrates structured data annotation, visual analysis, and
hypothesis development in one place while supporting information sharing in real-time.
The chapter walks through its features, explains major technical challenges, and describes
the implementation details.
In the next two chapters, I will present two classroom studies I conducted in two
Intelligence Analysis courses at Pennsylvania State University. The purpose of these
studies is to demonstrate how well the integration of structured techniques and awareness
support could fit within the real application domain and how teams would behave in a
natural environment.

53
Chapter 4
The First Classroom Study
4.1 Problem Statement
The first classroom study aims to evaluate our design Objectives One, Two, Three,
and Five listed in Section 3.2; that is, the study explores:
1. the e↵ectiveness of supporting information analysis with an integrated workspace;
2. the e↵ectiveness of structured data annotation and visualization;
3. the e↵ectiveness of supporting activity awareness of the tool;
5. and how teams behave with the computing tool support.
Below I will describe the classroom study setting including the timeline of the
study, participants involved, and data I collected. The chapter then reports the results
from the study, followed by discussions over the results.
4.2 System
The system, CAnalytics, used in this study includes all features described in
Section 3.3 except for the hypothesis tool. To sum up, CAnalytics includes an integrated
workspace for data annotation and visualization, and enables real time sharing of user
created data objects. It also includes a shared notepad which a team uses to put down
their note and hypothesis.

54
4.3 Classroom Settings
The setting for this study was an undergraduate course in an intelligence training
program at Pennsylvania State University. The program was designed to train students to
become professional intelligence analysts. A key requirement of the course is to emphasize
hands-on practice on team-based intelligence analysis.
During the first ten weeks of the course students learned several analytic techniques,
including IEW (a technique to extract evidence and assess their values), ACH (a technique
to evaluate multiple hypotheses against evidence), timeline analysis and network analysis,
as well as state-of-the-art tools to implement these techniques, including Analyst’s
Notebook and PARC ACH. Students also practiced applying these techniques in two
hands-on projects before the study. Students follow a typical “waterfall” workflow: they
start with IEW to extract evidence from documents and model them into a structured
format. With that data available, they start building analytic artifacts such as an ACH
Matrix in PARC ACH, and a timeline and a network graph in Analyst’s Notebook.
Sometimes the process is not necessarily sequential, and they want to jump back to edit
data when building analysis. Yet since the tools are separate and data within the tools
are not sharable, the annotation activity and analysis activity are largely isolated.
Most tools in use lack serious collaboration support (except that some teams use
Google Doc to construct an IEW table). Analysts were unable to contribute simultane-
ously, an issue known as production blocking (Diehl and Strpebe 1987). Students often
divide their work by tools: each person picks a tool, creates and analyzes an artifact with
that tool on their own, and puts individual analysis together towards the end. This had

55
the consequence that findings and hypotheses were made without integrating collective
e↵orts and diverse knowledge. Analysts coordinated work by manually sharing documents
or graphs through email or cloud storage service (e.g. Dropbox), resulting in a scattered
placement of results, requiring repeated manual resynchronizing to identify redundant
or missing pieces of information, analysis of information, and analytic hypotheses. In
summary, the students in the study had learned and practiced with tools with a lack of
support for collaboration and were aware of the shortcomings.
Of the 98 students enrolled in the course (from two sections), 73 consented to
participate in the study. All of the 73 students majored in the program of Security and Risk
Analysis. Most (75%) of them were in the third academic year (M = 3.06 years, SD = .44),
indicating that participants in the study had relatively advanced experience and knowledge
in intelligence analysis. Participants’ age ranged from 19 to 28 (M = 20.4, SD = 1.18).
77% of the participants were male.
Students were given a tutorial on CAnalytics a week before the project began.
The features of CAnalytics were introduced without enforcing or implying any strategic
usage. Students then accomplished a small case analysis at their own pace. During the
week of the actual study, one author was constantly available to help with any technical
issues. Although students were encouraged to make full use of CAnalytics, to ensure
a natural environment students were always free to employ any other tools that they
believed useful.
The study began on the 10th week of the course and lasted for one week. The
analysis that students performed on the tool was an investigation of a series of bank
robberies. The case and materials were fabricated by the course instructor. Teams

56
Fig. 4.1. Classroom setting
were provided a set of documents pertaining to seven robberies, including police reports,
witnesses reports, video records, and news media. The analysis was designed to be
open-ended, meaning that there was no single, definitive answer. The instructor explained
that the task was to simulate real world scenarios, in which analysts always reasoned
in the circumstances of uncertainty, ambiguity, and complexity. The instructor told the
students that he expected the analysis to take around 6 hours, including in-class and
outside-class work. At the end of the project students were required to submit a team
report, describing their hypotheses, assumptions, conclusions, and supporting evidence.
When in class, students used a 27-in Macintosh desktop (as shown in Figure 4.1. Students
could use any equipment when outside class.
Students were randomly assigned into 25 teams (23 three-person teams and 2
two-person teams). Research suggests that group size is an important factor in group
collaboration, and two-person teams might behave di↵erently from three-person teams.
Thus data from the two-person teams were excluded from my analysis in this paper. Also,
from the log (and confirmed by their questionnaire), I found that one team made little

57
use of CAnalytics and opted for other tools (Google Doc). Hence their data were also
excluded. The final data report includes the result from 22 teams.
4.4 Data collection and analysis
Several data collection approaches were employed. A post-study questionnaire
(Appendix E) were administrated. The questions used a 7-point likert scale and included
7 items measuring an individual’s self-reported awareness, 7 items for communication
quality, 6 items for collective e�cacy, and 3 items for perceived performance (Convertino
et al. 2011). I also used NASA-TLX (Hart and Staveland 1988) to measure cognitive
load. The questionnaire also included open-ended questions asking how the tool helped
or impeded their work.
User interactions were captured with system logs. Instead of simply logging low-
level events like mouse clicks and keyboard strokes, meaningful actions such as creating
an annotation and deleting an entity were recorded. The full log schema is listed in
Section 3.3.4.
Finally, team reports were reviewed and graded as an indicator of team performance.
Since the task was open-ended, there was no single right answer. An assessment rubric
was constructed together with the course instructor by listing all possible hypotheses and
evidence from the documents, with a full score of 16. I and another researcher graded
the reports independently. If the grades di↵er by less than 2, an average is set as the
final grade (14 out of 22 reports). Otherwise (the rest 8 reports), the two graders review
the reports together and make an agreement.

58
Multiple methods were used to analyze the collected data. Artifact analysis
(visualizations and annotations people created) was performed. The premise is that
artifacts teams create to support their work activity can be a window into their cognitive
and collaborative process (Carroll et al. 2013). Since all user data is stored in the system,
user-created artifacts could be restored and compared the di↵erences across teams. User’s
interaction logs were pulled and visualized in sequence, in an attempt to identify patterns
within a team and across teams.
Qualitative analysis was performed over answers from the open-ended questions.
An open coding approach was employed in development of the coding schema. I iteratively
went through the data and added emerging themes to the schema. The believability of
the result is achieved by data triangulation among user logs and their created artifacts.
Each interpretation is followed by users’ quoted comments. The repeatedly identified
themes produce convincing interpretation output in the study.
Finally, statistic analysis was conducted over survey scales and team performance
(as measured by report grades). The analysis attempted to capture factors that account
for team performance variance quantitatively. The result is reported below.
4.5 Results
Over the week, teams created 1805 entities and 1529 relationships in total. The
number of entities teams created ranged from 24 to 223 (M = 82, SD = 39.9), and the
number of relationships ranged from 7 to 237 (M = 69.5, SD = 51.0), showing a large
variety. The big range was related to di↵erent team data modeling strategy, which will
be discussed in detail later. While teams could work on the project any time, we found

59
three intensive usage sessions from the interaction log: two were in class and one was
before the team report deadline, outside of class.
CAnalytics was generally well-received by the students. An overview of the related
survey items (shown in Figure 4.2) shows that students positively rated all aspects of the
tool except cognitive load, towards which they had a close to neutral feeling, which is
understandable as the tool does not necessarily reduce the complexity and load of the
task.
Fig. 4.2. Survey responses (box shows Q1-Q3 and median; ends of whiskers showmaximum and minimum)
4.5.1 Filtering vs. Accretion
In examining participants’ created data objects, we noted a distinction between
filtering and accretion strategies, similar to what was reported in the paper prototype

60
Fig. 4.3. Network artifact comparison: filtering (a) vs. accretion (b)
study (Carroll et al. 2013). Filtering is the selective modeling of data and adding to an
artifact. Users must decide what information is relevant, and thus what is to be excluded,
as well as what granularity of information is to model. Filtering requires more team
coordination because teammates must reach a common ground of the current problem as
well as information needed to answer the problem. Figure 4.3a is an example of network
built with filtering strategy. It only represented key information of robberies.
Accretion is an attempt to comprehensively represent the problem by including all
information in an artifact. Users extract as many facts as they can from the document,
regardless of its immediate relevance to the problem. Accretion requires less coordination
as it is relatively mechanical note-taking. A disadvantage of accretion is that it can be
time-consuming to model all details and the produced artifact could be fairly complex.
An example is Team 108, who modeled every step the suspects took, which resulted in far
more entities (223) than the average (82) and a more cluttered network view (Figure 4.3b).
This accounted for the large range of entities created. Users also realized the problem.
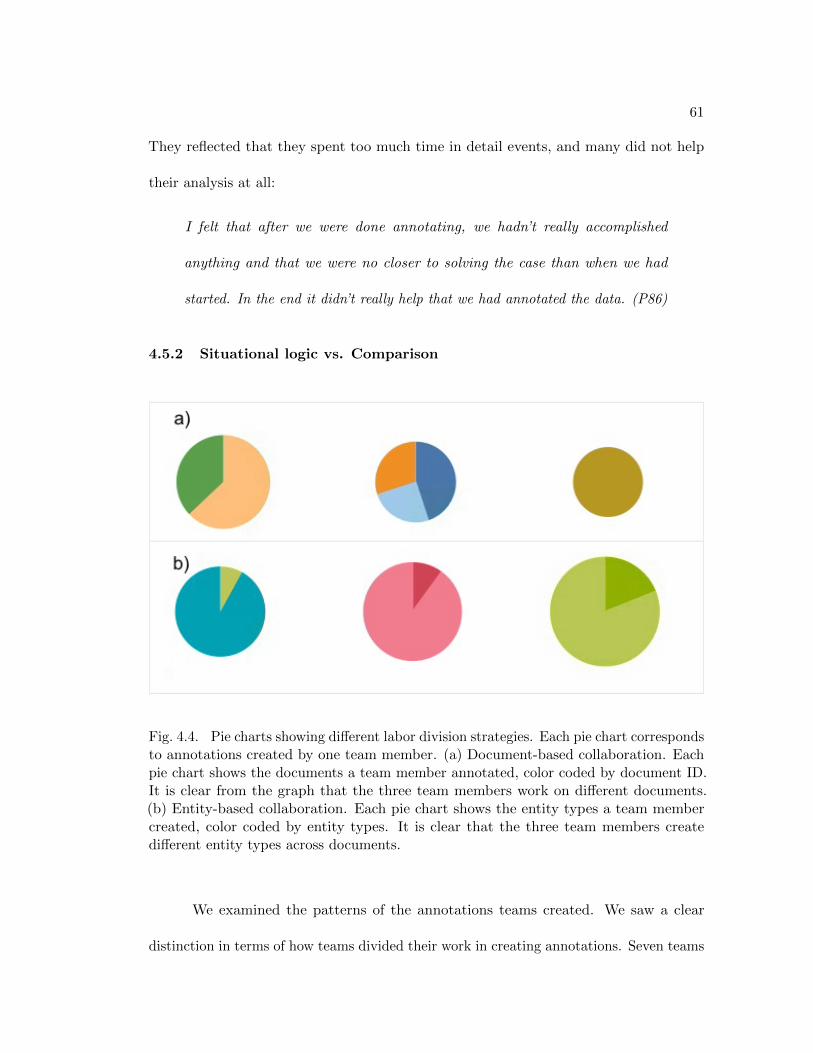
61
They reflected that they spent too much time in detail events, and many did not help
their analysis at all:
I felt that after we were done annotating, we hadn’t really accomplished
anything and that we were no closer to solving the case than when we had
started. In the end it didn’t really help that we had annotated the data. (P86)
4.5.2 Situational logic vs. Comparison
Fig. 4.4. Pie charts showing di↵erent labor division strategies. Each pie chart correspondsto annotations created by one team member. (a) Document-based collaboration. Eachpie chart shows the documents a team member annotated, color coded by document ID.It is clear from the graph that the three team members work on di↵erent documents.(b) Entity-based collaboration. Each pie chart shows the entity types a team membercreated, color coded by entity types. It is clear that the three team members createdi↵erent entity types across documents.
We examined the patterns of the annotations teams created. We saw a clear
distinction in terms of how teams divided their work in creating annotations. Seven teams

62
created annotations with a document-based pattern: each teammate focused on their
own set of documents and made concrete detailed annotations. (as shown in Figure 4.4a).
Individuals consider the known facts of the current document and seek to identify the
cause-e↵ect relationships of this document. We take the term situational logic from
(Heuer 1999) to describe this pattern, in which teams start hypotheses “with concrete
elements of the current situation, rather than with broad generalization that encompasses
many similar cases” (p.32). The team relied on partners to identify and share useful
information within their assigned documents. The downside of this strategy is when an
individual fails to identify or convey evidence in the document, the team may overlook or
misunderstand the information altogether.
Four teams followed a di↵erent strategy. Instead of dividing by documents, they
divided work by entity types: each individual went through all documents but only
focused on and annotated entities of certain types, e.g. teammate A only annotated
persons and teammate B annotated locations (as shown in Figure 4.4b). This is known as
a comparison strategy (Heuer 1999). When analysts recognize two entities as comparable,
they use the known entity to fill gaps in their understanding of the present entity. They
build connections between two entities, make analysis of similarities and distinctions.
Di↵erent from situational logic, comparison interprets the present evidence in the context
of precedent elements in other documents, and they could examine entity patterns across
multiple documents simultaneously. The challenge is of course to decide whether two
entities are truly comparable. There is a tendency to conclude two entities are equivalent
simply based on the fact that they are equivalent in some aspects. When individuals fail

63
to convey the assumptions made in the comparison, it could mislead the whole team’s
reasoning.
The rest (eleven) of the teams did not show specific labor division patterns.
Teammates were reading and annotating the same document concurrently. Concurrent
analysis of a document was challenging if not impossible with paper documents or
traditional tools but is possible because the groupware allows them to see new annotations
by others in real time and to build on top of other’s annotation. Figure 4.5 shows an
example where one team worked on the same document simultaneously. The three team
members exhibited high synchronicity in which document to analyze, which we believe
was not by accident. This has the advantage that teammates are always on the same
page and can discuss hypotheses throughout the analysis process. A problem with this
approach is scaling. It demands a lot of individual e↵orts since each teammate is required
to analyze all documents and entities and constantly switch between individual work and
collaboration work. As data size increases and analysis time tightens, the team may not
a↵ord this approach.
Fig. 4.5. Graph showing the timeline of one team creating annotations. Each rowcorresponds to one team member. Each bar represents an annotation, color coded bydocument ID. The red blocks highlights the periods when teammates worked on the samedocuments simultaneously.

64
4.5.3 Inferential connection vs. Factual discrete
Fig. 4.6. Network artifact comparison: separate clusters (a) vs. connected clusters (b).The parts highlighted in red squares in (b) are key evidence that connects clusters
When examining the network artifacts participants created, a clear distinction
exists in the shape of clusters. Networks from eight teams consist of discrete clusters
(Figure 4.6a): Nodes within a cluster are connected. They are factual entities and
relationships extracted from one single robbery case. Each cluster is self-contained,
with no links in between. In contrast, six other teams created networks that consist of
connected clusters. Nodes and links within a cluster are similar to ones in the discrete
cluster, but these clusters are connected through an inferential link (Figure 4.6b, marked
in red in the graph).
The di↵erences in network artifacts relate to how teams annotated and represented
entities in documents, especially in circumstances of incomplete, ambiguous information.
For example, we have the following document snippets:
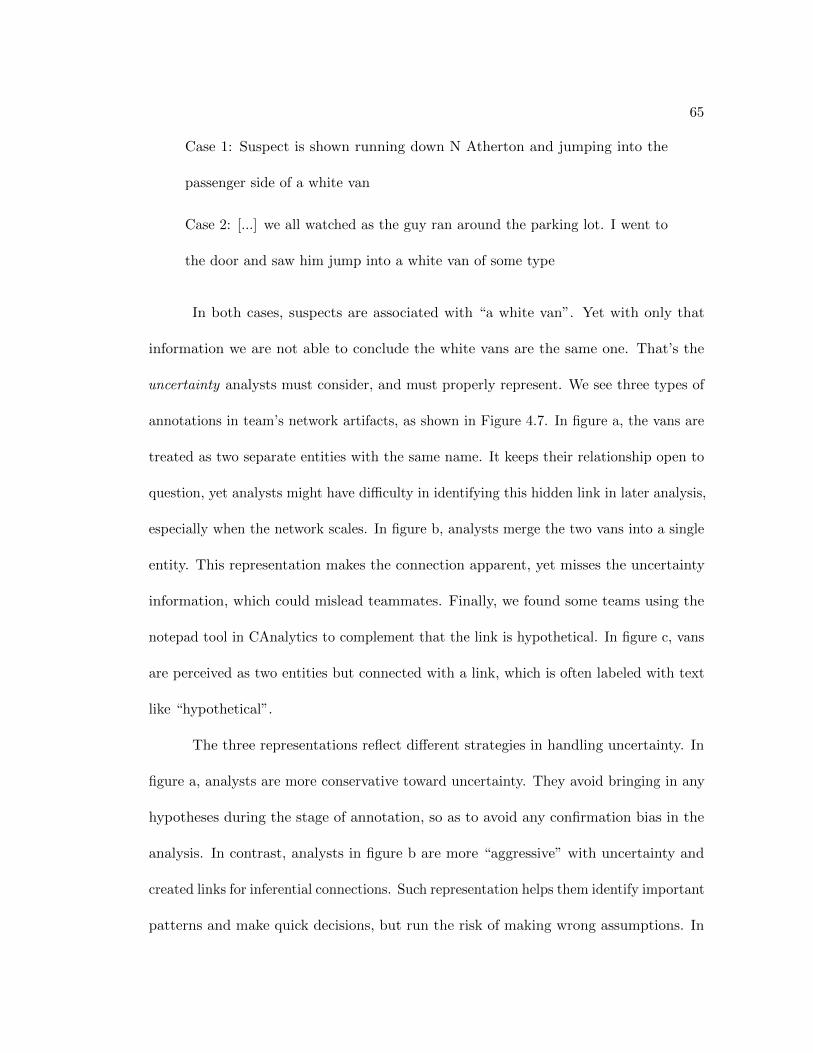
65
Case 1: Suspect is shown running down N Atherton and jumping into the
passenger side of a white van
Case 2: [...] we all watched as the guy ran around the parking lot. I went to
the door and saw him jump into a white van of some type
In both cases, suspects are associated with “a white van”. Yet with only that
information we are not able to conclude the white vans are the same one. That’s the
uncertainty analysts must consider, and must properly represent. We see three types of
annotations in team’s network artifacts, as shown in Figure 4.7. In figure a, the vans are
treated as two separate entities with the same name. It keeps their relationship open to
question, yet analysts might have di�culty in identifying this hidden link in later analysis,
especially when the network scales. In figure b, analysts merge the two vans into a single
entity. This representation makes the connection apparent, yet misses the uncertainty
information, which could mislead teammates. Finally, we found some teams using the
notepad tool in CAnalytics to complement that the link is hypothetical. In figure c, vans
are perceived as two entities but connected with a link, which is often labeled with text
like “hypothetical”.
The three representations reflect di↵erent strategies in handling uncertainty. In
figure a, analysts are more conservative toward uncertainty. They avoid bringing in any
hypotheses during the stage of annotation, so as to avoid any confirmation bias in the
analysis. In contrast, analysts in figure b are more “aggressive” with uncertainty and
created links for inferential connections. Such representation helps them identify important
patterns and make quick decisions, but run the risk of making wrong assumptions. In

66
general, figure c appears to be more reasonable. It represents the connection while
preserving the uncertainty, yet requires more annotation e↵orts.
Fig. 4.7. Three di↵erent representations of uncertainty for entity relationships
However, it does not mean these teams believe these cases are irrelevant. In fact,
these teams still discussed connections between robberies in their report. It turned out
that these teams documented possible relationships in the notepad tool in the form of free
text, separate from the network graph. That is, these teams distinguished information
content and synthesized them in di↵erent artifacts.
By comparing these two types of networks, we found that links within a cluster
were typically factual relationships modeled from raw documents (e.g. a white van was
witnessed at a location), and links between clusters were often inferences beyond literally
documented (e.g. a white van at location A is the same van witnessed at location B).
Teams creating separate clusters represented only facts in the network and held evidence
of uncertainty in a separate artifact. One advantage of distinguishing facts and inferences
is that teams can always be aware of assumptions made when making a conclusion. And
since all inferences are held in one place, teams are forced to confront them and review
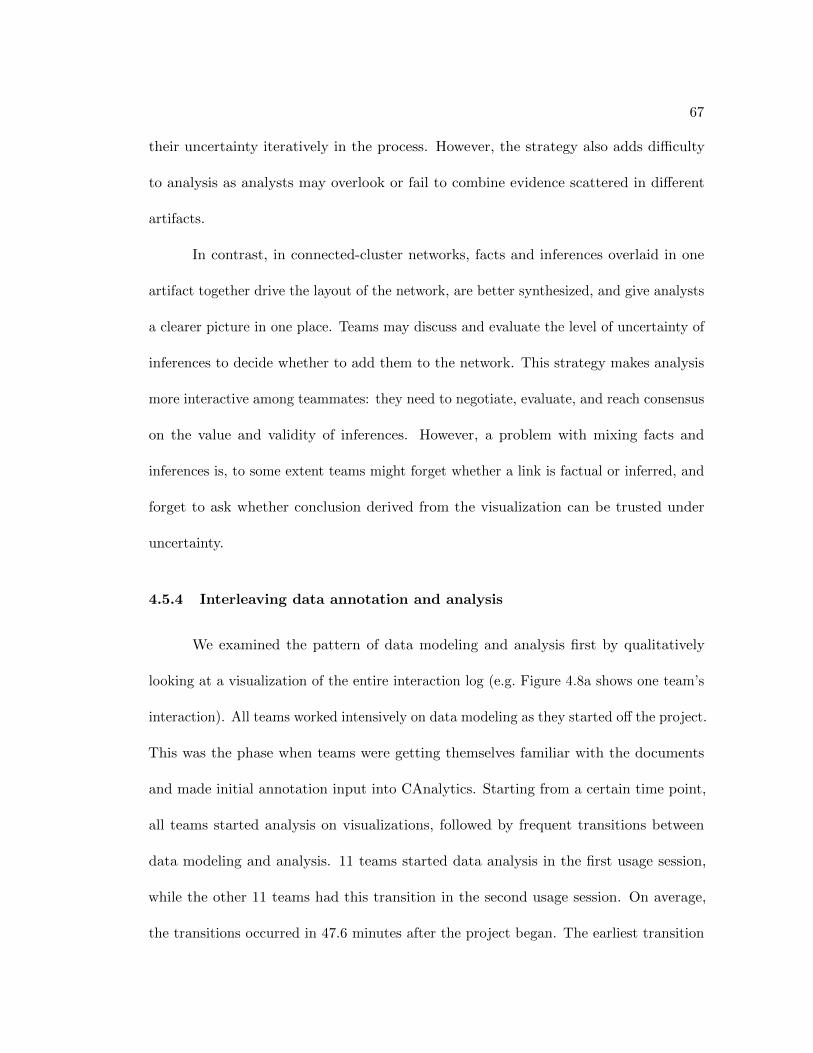
67
their uncertainty iteratively in the process. However, the strategy also adds di�culty
to analysis as analysts may overlook or fail to combine evidence scattered in di↵erent
artifacts.
In contrast, in connected-cluster networks, facts and inferences overlaid in one
artifact together drive the layout of the network, are better synthesized, and give analysts
a clearer picture in one place. Teams may discuss and evaluate the level of uncertainty of
inferences to decide whether to add them to the network. This strategy makes analysis
more interactive among teammates: they need to negotiate, evaluate, and reach consensus
on the value and validity of inferences. However, a problem with mixing facts and
inferences is, to some extent teams might forget whether a link is factual or inferred, and
forget to ask whether conclusion derived from the visualization can be trusted under
uncertainty.
4.5.4 Interleaving data annotation and analysis
We examined the pattern of data modeling and analysis first by qualitatively
looking at a visualization of the entire interaction log (e.g. Figure 4.8a shows one team’s
interaction). All teams worked intensively on data modeling as they started o↵ the project.
This was the phase when teams were getting themselves familiar with the documents
and made initial annotation input into CAnalytics. Starting from a certain time point,
all teams started analysis on visualizations, followed by frequent transitions between
data modeling and analysis. 11 teams started data analysis in the first usage session,
while the other 11 teams had this transition in the second usage session. On average,
the transitions occurred in 47.6 minutes after the project began. The earliest transition

68
occurred in 14 minutes after the team started the project, and the last team had the
transition around 104 minutes, later in the second session. We also found performance
di↵erences among teams that started analysis early and those late. Teams that started
analysis in session one had higher performance (M = 8.6) than teams that started from
session two (M = 6.7), although the di↵erence was not statistically significant.
The fact that participants returned to making annotations after analysis indicated
that they did not wait to start analysis till they had finished modeling. Indeed, the
activity of data modeling and data analysis were highly interleaved throughout the project
(as shown by the interleaving color bar in Figure 4.8a). Participants switched from one
activity to the other activity frequently. The state transition diagram (Figure 4.8b)
demonstrates the interleaving in an aggregated way, in which we encode the number of
transitions as the width of a link. This result confirms our design expectation that data
modeling and analysis should not be supported as separate staged activities, and that an
integrated environment should streamline the workflow.
Fig. 4.8. (a) Visualization of interaction logs of Team 107. Each row of colored marksindicates the sequence of top-level activities a participant performed. (b) State transitiondiagram of interaction logs of Team 107. Each node is an activity, whose size representsthe time spent on it (M: data modeling; A: data analysis; H: hypothesis development;C: coordination); a link represents a switch from one activity to another, whose widthencodes the number of switches. We see highly frequent transitions between data modelingand data analysis
69
4.5.5 Collaboration and awareness
One recurring theme in the subject feedback we collected was that the collaboration
features were helpful for solving the problem. In the survey 88% of the students positively
rated their group awareness. Participants appreciated that the tool complemented
traditional analytic tools, describing CAnalytics as Analyst’s Notebook with real-time
synchronization features similar to Google Docs, or described it as Google Doc with
added visual analytics. To quote one participant, “CAnalytics is like an analysts notebook
that multiple people could work on at once [. . . and] an analysts version of a Google Doc”
(P65).
Participants reflected that they could now contribute simultaneously without
concerns of interference and could have everything in one place instead of manually
sharing documents via a cloud service.
It was much easier to coordinate as a team with CAnalytics because we could
all work on the same system at the same time. Without CAnalytics, we were
forced to do the work separately and compile all the work onto one system
after we had finished. (P156)
Students also reported that being able to see teammate’s status made the task
more motivating and engaging:
During class I wasn’t sure if my teammates were doing work for that class
or another thing but then seeing their dot [tool indicator] switch between
applications on the software and updates pop up on my screen I knew they
were doing work for 231. (P141)

70
The fact that you can see what other teammates are doing and they can see
what you are doing creates a sense of accountability in terms of separating
the workload. (P51)
The motivating e↵ect of awareness might account for, at least partially, the fact
that teams were participating equally. We measured the equality of participation in
terms of the number of created entities and time spent on CAnalytics. We refer to Olson
et al. (2017) in calculating equality: one minus the variance of proportions times 100 (for
better readability). Thus the score ranges from .67 (when only one person contributes in
a three-member team) to 1.00 (when everyone participated exactly equally), and a higher
score indicates higher balanced participation. The resulted equality of created entities
and time was .96 and .99 on average respectively. This indicates participants contributed
fairly evenly.
Another repeated theme was the awareness features helped assure all teammates
were executing the team plan. Participants reflected on their experience that a common
team breakdown was a misunderstanding of the team plan, and that they did not
realize the misunderstanding until everyone had spent significant e↵orts finishing their
“perceived” job. CAnalytics made plan execution assured because they could always
see where teammates were working and what they were generating; and if anything
unexpected happened, they could communicate immediately rather than at the end of
the project.
Participants reported many other instances of awareness they realized using
CAnalytics. We categorized them based on the element of awareness, or the essential
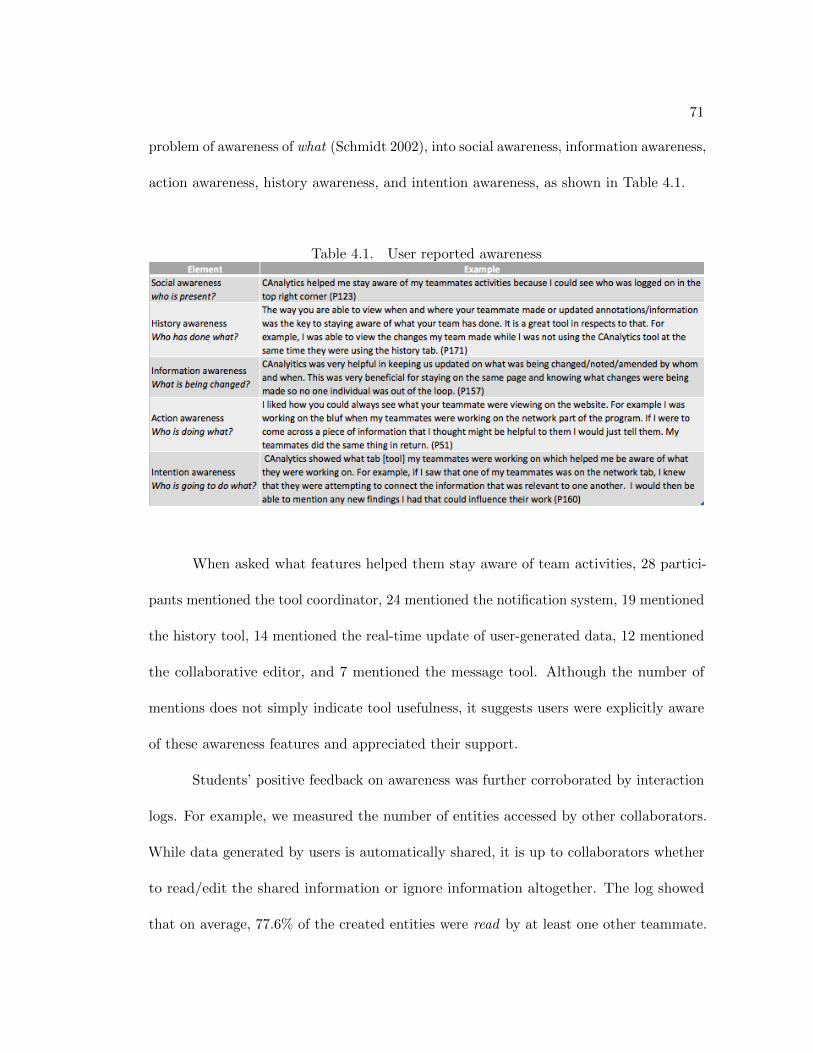
71
problem of awareness of what (Schmidt 2002), into social awareness, information awareness,
action awareness, history awareness, and intention awareness, as shown in Table 4.1.
Table 4.1. User reported awareness
When asked what features helped them stay aware of team activities, 28 partici-
pants mentioned the tool coordinator, 24 mentioned the notification system, 19 mentioned
the history tool, 14 mentioned the real-time update of user-generated data, 12 mentioned
the collaborative editor, and 7 mentioned the message tool. Although the number of
mentions does not simply indicate tool usefulness, it suggests users were explicitly aware
of these awareness features and appreciated their support.
Students’ positive feedback on awareness was further corroborated by interaction
logs. For example, we measured the number of entities accessed by other collaborators.
While data generated by users is automatically shared, it is up to collaborators whether
to read/edit the shared information or ignore information altogether. The log showed
that on average, 77.6% of the created entities were read by at least one other teammate.
72
Further, I measured how many entities were edited by collaborators, a phenomenon I argue
requires higher awareness, because the collaborator must not only realize the creation of
the entity, but also understand its content. We defined peer editing, manipulated as the
ratio of editing peer-created entities over editing self-created ones. I found that all teams
edited collaborator’s entity objects, with a peer editing value equal to .83 (SD = .45).
The result suggests that individuals had little di�culty accessing or modifying partner’s
created data objects.
One major critique is the lack of support for sharing intermediate analytic insights.
Insight is revealed and contextualized by a specific arrangement of views, e.g. a reduced
data view of interest through filter, a highlighted entity representing the analytic focus, and
a clustering layout of network to demonstrate a specific relationship. While teammates
share the same data pool, they are likely to have di↵erent views of data, and thus
di↵erent interpretations toward the data. A dynamic view together with its interpretation
represents user’s intermediate analytic status. Sharing these insights could inspire team
analysis (Gotz and Zhou 2009). With CAnalytics, participants complaint that they
could not easily make such communications. The team could “be looking at the same
information but arranged in completely di↵erent ways” (P131).
4.5.6 Interaction with team performance
To systematically evaluate factors that influenced team performance, a multiple
linear regression model was conducted between team performance as the dependent vari-
able and team collaboration characteristics (i.e. equality of entities and time respectively,
peer editing, number of entities created, shared entities, switch time from data modeling

73
to analysis) as independent variables. A team is treated as a system (Henman 2003) and
team-level relationships are modeled. The relationship of individual level variables (e.g.
survey items) could not be simulated with regression directly because data within a team
was interdependent. The analysis was performed using R (R Core Team 2016).
The result is shown in Figure 4.9. The regression model was found to be statistically
significant (F (5, 16) = 4.58; p < .01), with an R squared equal to .59, meaning 59%
of the variability in team performance was explained by the model. Five team-level
variables contributed significantly to the prediction of team performance. The model
suggested that balanced contribution of entities predicted higher team performance scores
(� = 45.79, p < .05), but balanced participation time did not show such e↵ect. More peer
editing led to better performance (� = 3.89, p < .01), implying that analysts should be
encouraged to model data as a team, and to remodel other’s entity objects as needed.
Longer elapsed time before a team started analysis (switch time in the figure) predicted
lower performance (� = �.05, p < .05), which suggested that teams should shorten the
time of pure data modeling and start analysis earlier. A larger number of entities teams
created also predicted higher performance (� = .03, p < .05). This can be interpreted
that teams providing su�cient model input did benefit from system support. However,
I am not ready to claim more entities are always better because we should also be
cautious that entities irrelevant to the team problem bear no value to team analysis, as
discussed beforehand. Somewhat surprisingly, the number of shared entities negatively
predicted performance (� = �8.99, p < .05). I considered this might also relate to the
issue of entity value: sharing entities without relevance to the team problem leads to
reduced team e�ciency and creates distraction, which in turn would lead to worse team

74
performance. Another possibility is that teammates may not necessarily access all entities
their partners created. The theory of Transactive Memory (Wegner 1987) suggests that
teammates do not have to know everything in the team but should know “who knows
what”. Individuals specialize in their own field (e.g. one specializes in event analysis
while another in social relationship examination) and reach for collaborators when other
knowledge is needed. In such cases, common knowledge in shared entities would actually
be redundant. Individuals should stay aware of the creator of an entity, but not necessarily
the content of every entity.
Fig. 4.9. The relationship between collaboration characteristics and team performance.
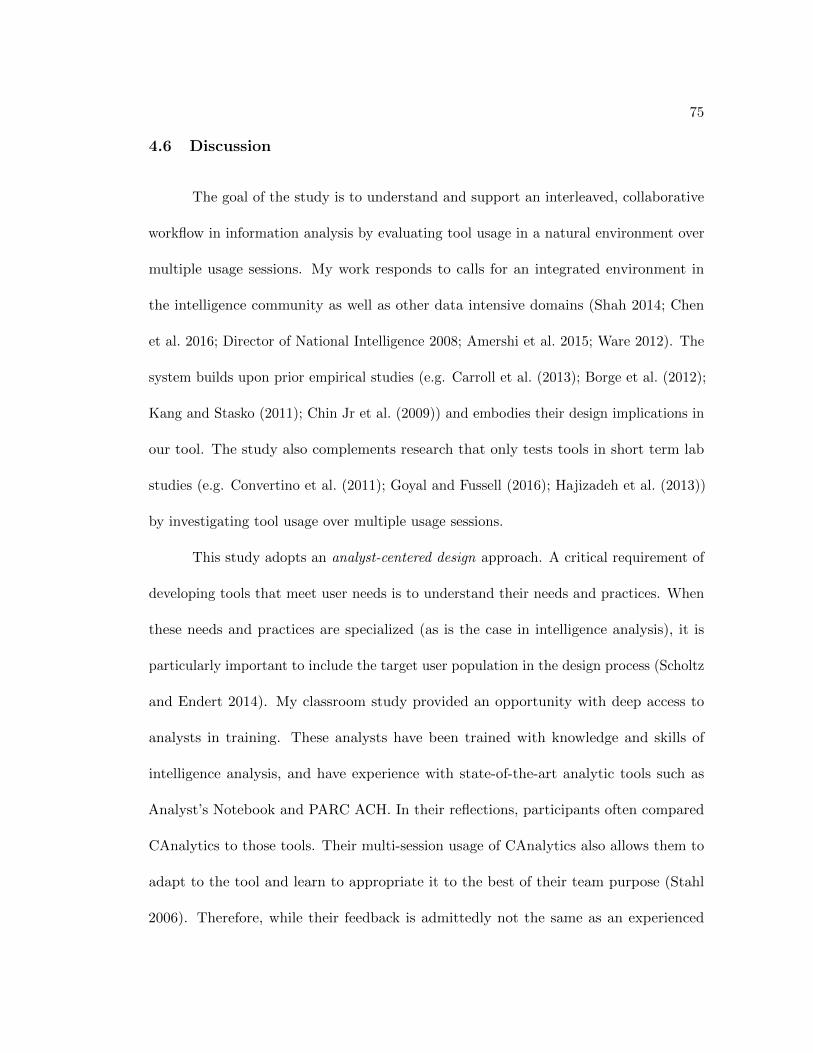
75
4.6 Discussion
The goal of the study is to understand and support an interleaved, collaborative
workflow in information analysis by evaluating tool usage in a natural environment over
multiple usage sessions. My work responds to calls for an integrated environment in
the intelligence community as well as other data intensive domains (Shah 2014; Chen
et al. 2016; Director of National Intelligence 2008; Amershi et al. 2015; Ware 2012). The
system builds upon prior empirical studies (e.g. Carroll et al. (2013); Borge et al. (2012);
Kang and Stasko (2011); Chin Jr et al. (2009)) and embodies their design implications in
our tool. The study also complements research that only tests tools in short term lab
studies (e.g. Convertino et al. (2011); Goyal and Fussell (2016); Hajizadeh et al. (2013))
by investigating tool usage over multiple usage sessions.
This study adopts an analyst-centered design approach. A critical requirement of
developing tools that meet user needs is to understand their needs and practices. When
these needs and practices are specialized (as is the case in intelligence analysis), it is
particularly important to include the target user population in the design process (Scholtz
and Endert 2014). My classroom study provided an opportunity with deep access to
analysts in training. These analysts have been trained with knowledge and skills of
intelligence analysis, and have experience with state-of-the-art analytic tools such as
Analyst’s Notebook and PARC ACH. In their reflections, participants often compared
CAnalytics to those tools. Their multi-session usage of CAnalytics also allows them to
adapt to the tool and learn to appropriate it to the best of their team purpose (Stahl
2006). Therefore, while their feedback is admittedly not the same as an experienced

76
professional, their feedback does provide a deeper insight into strengths and weaknesses
of the tool than average users.
The study provides encouraging results. Participants appreciated an integrated
environment where they could share raw documents, evidence snippets, views of evidence
and hypotheses in one place. They liked the fact that they could contribute simultaneously
without blocking or interfering each other. Another collaborative tool is to keep teammates
aware of each other’s activities. Staying aware of teammates not only helps establish a
common ground for planning team strategy, but also ensure everyone is following the
plan as expected. Moreover, results suggest the awareness features provide positive
social facilitation (Zajonc 1965): individuals found the task motivating and engaging
with awareness of each other’s activity. I also measured collaboration characteristics
that impacted team performance, and found that balanced contribution, peer editing,
and earlier switching from modeling to analysis predicted higher team performance.
Most importantly, I documented the interleaved workflow enabled by the integrated
environment, and explored momentum in modeling and analysis behaviors that drove the
activity switching. Below I will discuss design implications that could potentially enable
a better collaborative experience in information analysis tasks.
4.6.1 Sca↵old a structured interleaved workflow
A typical misconception about information analysis is that data modeling and
data analysis are two staged activities. This is akin to the waterfall software development
model, which features a sequential process that flows downwards through the phases of
requirement conception, software design and implementation, and testing and maintenance.
77
Critics have argued against this approach and instead called for an iterative design process
that leads to reframe user requirements, redesign, redevelopment, and retesting.
The result demonstrates a similar iterative and dynamic process in information
analysis. The result is striking especially because the participants have been trained with
tools that impose a waterfall model. They could have followed their old waterfall practice
with my tool, yet instead all teams spontaneously switched to an iterative manner. I
projected that modeling on multiple granularities drives analysis on di↵erent levels, and
uncertainty in analysis pushes analysts back to collecting additional data.
Realizing that, we probably could shape analysis into a more interleaved workflow
with a more structured approach. Annotation is a process in which analysts are construct-
ing their own version of information space on the basis of information provided by the
document. The resulted representation of annotation will strongly influence their analysis.
Meanwhile, analysis generates hypotheses which will frame how analysts perceive their
data. The gap between hypotheses and facts then drives analysts to annotate a new
version of information space. Structured techniques such as IEW and ACH help users
perform analysis in a systematic and transparent manner in each well defined activity, yet
fall short in guiding analysts in switching between the two activities (Kang and Stasko
2011). My system implements a structured modeling through annotation and a structured
analysis by visualizing data in multiple views. By sharing the same data structure and
consistent user interface, we enable a smooth switching between the two stages. The
result suggests the role of multilevel modeling and analysis uncertainty in driving the
switch. Based on that, there exist design opportunities to enable a more interleaved
flow. For example, we can build a more structured sca↵olding process to bridge modeling

78
and analysis. When a user adds a new data object, the system could suggest possible
connections to existing evidence in the context of an appropriate level of views, which
is likely to help analysts discover new patterns. When a user creates a new hypothesis
with uncertainty, the system could highlight associated evidence, which would prompt
the analyst to re-examine the data and look for more data. Such sca↵olding provides
a basic structure to link stages of analytic activities that analysts can take on without
imposing a specific fixed workflow.
A smoothier interleaved workflow could also be made by increasing team awareness
of partner’s modeling and analysis. That is, uncertainty in one’s analysis not only
motivates oneself to data modeling, but also drives partners (who are aware of the what
and why of the uncertainty) to collect more data. Similarly, one’s modeling could influence
and drive partner’s analysis, given the partner is fully aware of what is modeled and how
the new data connects to the level of existing data. Such “team-level” interleaving could
make teamwork more interactive and close coupling, but also requires support of higher
awareness, especially of hypothesis uncertainty and data model context. Improved design
for multi-granularity modeling, uncertainty representation, as well as team awareness of
these features opens up possibilities for coordinating interleaving at the team level. I will
discuss these design implications in further detail in the following paragraphs.
Iterative data annotating activities indicate analysts must be in control of the
data modeling process. Depending on the questions and hypotheses in the analyst’s
mind, an analyst may want to model di↵erent types of evidence. Therefore the analyst
should always be in control of evidence modeling, while the computational method only
facilitates data modeling, e.g. ease data input, hide complexity of format structuring.

79
4.6.2 Represent uncertainty in collaborative analysis
The finding suggests that uncertainty in collaborative analysis requires deeper
understanding and brings more design challenges and opportunities than in traditional
data visualization. Uncertainty is prevalent in data. For example, the credibility and
reliability of evidence vary depending on its source (witness reports vs. police reports)
and collection means (video vs. narrative). Most research e↵orts focus on uncertainties
explicit in data and how to represent them (Pang et al. 1997; Zuk 2008), but there are
other sources of uncertainty as well. For example, multiple interpretations might be
equally plausible towards the same piece of information. Such uncertainty, also known as
ambiguity (Nowak et al. 2020), arises when individuals create annotations based on their
own knowledge and experience. In case of collaborative data analysis, teammates become
a source of uncertainty when they share annotations and hypotheses with uncertainty.
It is often easier (and people are more inclined) to represent information of certainty,
but that of uncertainty tends to be lost or vague due to the lost of the context (Prue
et al. 2014). This proposes new research questions: how to allow and encourage analysts
to represent uncertainty? How to represent collaborator-generated uncertainty together
with data-bearing uncertainty? Shall we distinguish them or treat them equally?
In addition to representing uncertainty, reasoning with uncertainty poses new
challenges (MacEachren 2015). Nuance exists in understanding and reasoning with
uncertainty among teammates. Collaborators make their own evaluation of uncertainty,
based upon their unique knowledge, experience, role, as well as trust in the source
teammate (Chin Jr et al. 2009). It is critical that teammates are aware of the existence of
80
uncertainty when they share their sensemaking, and reach a team-level agreement of the
information gap. Graves (2000) characterized intelligence analysis as a progression where
the analyst’s certainty grows over time. And we can probably describe collaborative
information analysis as a progression where a team of analysts establish awareness of
certainty, and achieve a growing team agreement of certainty.
While uncertainty poses a big challenge to analysts, I perceive it as a design
opportunity at the same time to identify emerging needs for team collaboration. When
uncertainty arises, team attention should be obtained and teammates should communicate
and establish an agreement on the representation of the uncertainty. Tools should be
designed to make uncertainty easy to be represented, shared and discovered, and even
proactively identify and notify uncertainty in team communication.
In my study observation, teams spontaneously employed two di↵erent approaches:
1) represent uncertainty on top of data and 2) separate uncertainty from data. In fact
the research community does not have an agreement whether it is better if uncertainty is
visualized or suppressed, or under what conditions it is better (MacEachren et al. 2005).
We should probably provide users with control in deciding how to display uncertainty.
For example, users can filter by uncertainty so that they can choose to consider only
evidence of certainty, or to review all inferences and decide what extra data is needed to
consolidate them. A a richer graphic language is needed to encode uncertainty in the
analytic view (Bertin 1983) and to make reference to uncertainty in team discussion.

81
4.6.3 Build collapsible views for multi-level modeling
I observed that analysts built data models in multiple granularities and coordinated
among multiple levels of details. For example, analysts jumped from digging into details
of a single event, to comparing between two events, and to overviewing all robberies as
a complete story. When sharing these data, a critical requirement is to represent them
in an appropriate context in order to ensure teammates understand them correctly. A
collapsible data view could be a solution to accommodate such multi-level modeling. This
can help draw teammate’s attention to a specific item while keeping the global context
available. Analysts can focus on a certain level of detail at a time while conveniently
switching between levels. A collapsible view also reduces the problem of cluttered view
when data volume increases. and when analysts dig into greater details (e.g. representing
suspect’s all actions to identify patterns of common actions in two robberies). An analyst
can overview all robberies and only unfold detailed actions when investigating into a
specific robbery.
4.6.4 Share views as team resource
View sharing provides an anchor for team communication and is important for
sharing and understanding analytic result (Morton et al. 2014a) and. A common approach
to view sharing is to enable a public view which always keeps synchronized for all
teammates (Convertino et al. 2011; Greenberg 1990). However, a single public view
does not meet the need in dynamic information analysis. Analysts often share multiple
views in an iterative workflow. Most views are for evidence keeping, and some views are

82
more important that may be repeatedly used in a report. Other views may be reused by
teammates and further developed.
I propose that views should be treated as a team resource. Just like data, views
can be sharable, extensible, and reusable. For example, an analyst can save their current
view as a shared resource when they feel it useful to collaborators. Other people can reuse
the view to their need. To facilitate the reuse of views, Nobarany et al. (2012) designed a
recommendation system to help discover possible useful views from teammates. Shared
views should be interactive rather than static images, so that analysts can perform all
interactions including filtering and highlighting, and are able to evolve the view with
collective team e↵orts, a critical requirement emphasized in Carroll et al. (2013).
A public workspace to which partners can refer sets up a common ground for dis-
cussion. Synchronous groupware used to impose “what you see is what I see” (WYSIWIS)
(e.g. Stefik et al. (1987)), in which all team members share the same view. However, this
design blocks production as only one member is able to control the workspace in one
turn. Relaxed-WYSIWIS is thus proposed in contrast to the previous strict-WYSIWIS,
allowing people to navigate the workspace independently (Gutwin and Greenberg 1998b).
Indeed, in observation of empirical teamwork, participants were found to keep private
notes while contributing to shared note-taking (Borge et al. 2012).
4.6.5 Distinguish visible vs. valuable contributions
Finally, I noted cases where teams created far more entities than needed with
an accretion strategy. Strikingly, while similar data modeling strategy was reported in
the paper prototype study (Carroll et al. 2013), users with CAnalytics seemed far more

83
tempted to accretively add information, with far more entities and cluttered views. For
example, the team with most entities created triple the number of entities as other teams
did in the study, much more than the di↵erence in the paper prototype study. Why
did this happen? I guess both the context of classroom study and the system design
contributed. Unlike in the lab study where teams are temporarily assembled, teams
in a class evaluate peers either consciously or unconsciously and value how themselves
are being evaluated. Such social pressure motivates individuals to make contributions,
and indeed to make visible contributions, more than valuable contributions. That is,
participants noticed that their work activity was visible to their partners, and accordingly
prioritized doing more visible work over doing less visible work. In some cases, this led to
a new problem of easy and less valuable contributions that were highly visible - such as
creating and therefore sharing data entities that were not particularly important, and
subsequently made data models seem cluttered. For example, creating and therefore
sharing an entity gets immediately notified to the team whereas weighing the importance
and relevance of an entity goes silent in the system. We need to investigate approaches
to making significant contributions more visible, or perhaps making it more immediately
visible that less important contributions are indeed less important.
4.7 Summary
This chapter presents a classroom study where junior undergraduate students
were learning intelligence analysis, had experienced traditional analytic techniques and
tools, and then employed CAnalytics in their course project. Through artifact analysis,

84
qualitative analysis, and quantitative analysis, I identified various team behaviors, in-
cluding filtering and accretion, situational logic and comparison, inferential connection
and factual discrete. Based on the result I discussed a collection of design guidelines,
including advocating for an integrated environment for interleaved data analysis work-
flows, representing uncertainty from various sources, build collapsible views to facilitate
reasoning on di↵erent levels of details, treating views as team resources to be even more
flexible just simply public views and private views, and encourage contributions in quality
than in quantity. This study confirms the e↵ect of four of the five design goals described
in Section 3.2. In the next chapter, I will describe the second classroom study, which
focuses on evaluating the fourth design goal–supporting hypothesis development.

85
Chapter 5
The Second Classroom Study
5.1 Problem Statement
Study One demonstrates a positive impact on team behavior of an integrated
analytic workspace and a structured approach of data annotation and visualization. In
Study Two, I want to explore the impact of a more structured approach to collaborative
hypothesis development.
Analysts generate multiple hypotheses and find evidence to confirm or disconfirm
them. A common technique to evaluate hypotheses is Analysis of Competing Hypotheses
(ACH) (Heuer 1999). ACH emphasizes a rational, transparent process of hypothesis
analysis. The steps include identifying a complete set of hypotheses, identifying all
pieces of evidence, assessing the diagnostic value of each piece of evidence against each
hypothesis, and drawing conclusions of the likelihood of hypotheses. ACH guarantees an
appropriate analytic process and increases the chance to avoid common analytical pitfalls
such as confirmation bias.
In practice, however, students rarely came up with a complete set of hypotheses in
the very beginning. Instead, they began with reading documents and got familiar with the
suspects. They would propose a hypothesis in the process of extracting and marshaling
evidence. They would share their hypothesis with teammates or document them in a note.
With evidence accumulating, the team collaboratively refines the existing hypotheses and

86
proposes alternative hypotheses. The process was iterative, with hypotheses constantly
being refined and evolved.
ACH demands a high expertise bar as well as prior knowledge of the situation
being investigated. Analysts are required to identify a complete set of mutually exclusive
hypotheses at the very beginning, which is di�cult for people with little expertise and
knowledge in the domain. Further, hypotheses tend to evolve as analysis proceeds. A
hypothesis valid in the beginning may no longer be of value later, or two seemingly
separate hypotheses in an early stage of analysis could be combined in a way to better
explain the situation later on. The assumption ACH makes that all hypotheses and
evidence are identified and set in the very beginning limits the dynamic development of
analysis.
I believe that analysts should not only share their hypotheses but should also
collaboratively develop and refine their hypotheses. ACH tends to treat hypotheses as
complete, well-defined objects. Analysts decide a set of alternatives and evaluate the
evidence against them. In reality, however, hypotheses tend to change and evolve as
analysts collect more information and gain a deeper understanding of the situation. Hy-
potheses that might be valid at the beginning of a process, may come to be inappropriate,
or incorrect as the analysis progresses. While simply sharing hypotheses is beneficial
to analysis teams, its positive impact is limited to an extent as it is not completely
leveraging the various expertise of a team. Where instead, the combining and evolving
of hypotheses from and by multiple members of the team (where the evidence that the
hypothesis is based on is included in the hypothesis object) creates an environment where
the team is more than just a sum of its parts.

87
In this study, I improved CAnalytics with support for structured hypothesis
development. Another classroom study was conducted to evaluate its function and to
observe how analysts were using the tool. Similar to the last chapter, this chapter details
the classroom setting and reports the result, followed by a discussion.
5.2 CAnalytics v2: supporting collaborative hypothesis development
Based on feedback from study one, I developed CAnalytics V2 and made several
improvements. A major change is to enable a structured approach to hypothesis develop-
ment, as described in Section 3.3.5. I developed a hypothesis development panel. When
the user creates a hypothesis, the current state of views are automatically captured, saved
and bound to the hypothesis. Each hypothesis includes a statement as well as a link to
the view. The view includes the data, the filters applied to the data, as well as state of
the visualization, including the zoom level, element positions, graph window size, etc.
The exact view could be restored to what it was like when the hypothesis was created.
The hypothesis is shared with the team immediately. Teammates could “clone” the
view and use it as a context to understand and further investigate the source hypothesis.
Since the view is interactive rather than a static screenshot, collaborators can apply new
filters and turn to a di↵erent focus, and develop a new hypothesis, whether supporting or
refuting the original one. The system builds a thread structure based on how the view is
“inherited”. For example, if the view used in Hypothesis A is re-arranged on the “clone”
of the view from Hypothesis B, A and B are in the same hypothesis thread. However, if
A and B are using di↵erent views, or analysts believe they are di↵erent stories, A and B
will be in two threads.

88
Other than the sharing hypothesis feature, CAnalytics V2 includes several other
improvements, including:
Timeline schematization Timeline is an important tool for analyzing the chronology
of events. Yet the timeline in study one contains too much information to be useful.
Based on user’s feedback, events are further schematized by people (Figure 5.1), so that
analysts can easily examine the availability of suspects during a critical event period.
Given that the scenario spans a long period of time, an “overview and detail” visualization
technique is adopted. Analysts can zoom into event details while keeping the big picture
in view.
Fig. 5.1. The improved timeline in CAnalytics V2 displays events schematized by people.Selection on the left overview panel zooms the view into a specific range of time. Selectionon the right detailed view selects events that overlap with a time range and applies a filterto other views (e.g. map, table and network) to narrow down data relevant to the selectedevents. This tool helps find alibi of suspects and identify correlation of events/time withother pieces of information.

89
Capability to restore deleted data In Study One we noticed that participants
removed data that were not relevant to their hypothesis to reduce noise. For example,
if they had excluded the possibility of a suspect, it made sense to remove the suspect
from the visualizations. However, I found that it often happened that analysts refuted
their hypotheses and rewound back to the original evidence. Going back and forth in the
evidence is a frequent operation although analysts do not need all pieces of evidence all
the time.
In CAnalytics V2, instead of “deleting” a data object, analysts can “archive” an
object. Archived data are hidden in visualization such as the network and the map, but
are still accessible in the data table. They were grayed out and ranked in the end, but
were searchable and could be “restored” if needed.
Animated change Another subtle improvement is adding animated change made by
teammates. For example, when an analyst is deleting an object, collaborators can easily
miss that person’s intention to delete the object and even the deletion action itself. One
design solution is to make small actions larger. In this case, I use animation to make
the delete action more prominent. This could be done by adding a visual e↵ect atop the
deleted object to emphasize that it has been selected, and then adding an animation to
the actual delete event to make it more salient, where it perhaps grows in size for a few
seconds before shrinking to nothing (Greenberg and Rounding 2001). Similar animation
is applied to adding a data object and editing an object.

90
5.3 Use case demonstration
To demonstrate the usage of the collaborative hypothesis development feature
in CAnalytics V2, a use case is run in Table 5.1. The full video is available at https:
//youtu.be/pHqOukeg2KA.
5.4 Classroom study setting
Fig. 5.2. The second classroom study setting
CAnalytics was deployed in SRA 468, a course in the major of Security and
Risk Analysis at Pennsylvania State University. The course was designed to teach
senior undergraduate students about the application of visual analysis in the domain of
intelligence analysis.
91
Table 5.1. A demonstration of collaborative hypothesis development in CAnalytics V2
Analyst A is analyzing data that is relevant to suspect Jeff, Alex, Lisa, Tom, and Baldric. Analyst A selects on the timeline view the time range when the theft happened. The timeline view highlights the events that overlaps this time range, and other views narrow down data relevant to the events. For example, the network view shows Lisa went to New York and Alex and Baldric were having lunch during the theft.
Analyst A made two hypotheses that exclude Lisa and Alex/Baldric from the suspects. The current view is saved automatically with the hypothesis.
Analyst B logs into the system and sees Analyst A’s hypotheses. He wants to dive deeper into her hypothesis and thus clicks “clone the view” of her hypothesis about Alex and Baldric.
The exact view when Analyst A made her hypothesis is restored. Analyst B continues to explore the view. He opens the map view and checks the locations of the events on focus (theft, Alex/Baldric’s lunch event, and Lisa’s New York event). The map shows the location of the theft (Rec Hall) is close to their lunch (IST).
Analyst B makes a comment under Analyst A’s hypothesis, reporting his findings. Similarly, his view is also automatically saved with his comment.
Analyst A sees their hypotheses as a threaded discussion.

92
The study began in the later phase of the course, when students had learned
about common techniques of visual analytics, such as time series analysis, tree-based
data analysis, and network analysis, as well as popular visualization tools like ArcGIS
and Tableau. With such equipment of basic visualization knowledge, from Nov 7 to Nov
18, I introduced CAnalytics and asked students to use the tool to solve a complex task.
Students were first given a tutorial and followed step-by-step instructions to use
CAnalytics features to solve a simplified task. The students then had two full classes
to do the project, each class lasting for 50 minutes. Due to the complexity of the task,
students were asked to work for extra hours outside class.
The task used in the study was a fabricated laptop theft scenario. The task was
applied and validated in earlier user studies (Carroll et al. 2013; Borge et al. 2012). The
task consists of 222 pieces of information, involving social media data, bank transactions,
suspect interviews, and other records. Teammates were randomly assigned one of the
three roles and were responsible for a unique set of documents: a Web Analyst had social
media data and would contribute mostly on social relationships; a Record Analyst had
archival information about suspects’ daily schedules and could contribute by providing
locations of suspects when the theft occurred; and an Interview Analyst had interview
data from people of interest and could contribute by identifying the motivation of suspects.
To reach the right conclusion, teams had to share their unique information su�ciently.
Students were told not to share documents directly but that they could share their
information by creating data annotations in CAnalytics.
Of the 42 students enrolled in the course, 30 consented to the study and 21 (7
teams) finished the study (submitted reports for both phase 1 and phase 2 tasks). In my
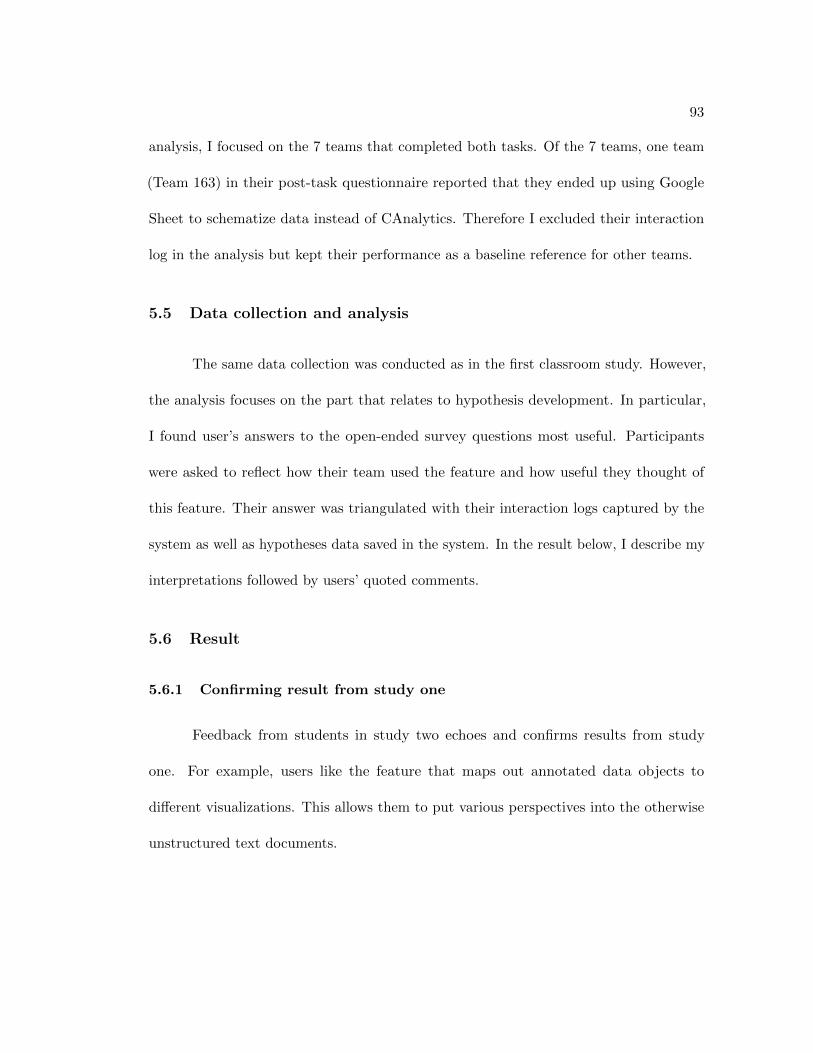
93
analysis, I focused on the 7 teams that completed both tasks. Of the 7 teams, one team
(Team 163) in their post-task questionnaire reported that they ended up using Google
Sheet to schematize data instead of CAnalytics. Therefore I excluded their interaction
log in the analysis but kept their performance as a baseline reference for other teams.
5.5 Data collection and analysis
The same data collection was conducted as in the first classroom study. However,
the analysis focuses on the part that relates to hypothesis development. In particular,
I found user’s answers to the open-ended survey questions most useful. Participants
were asked to reflect how their team used the feature and how useful they thought of
this feature. Their answer was triangulated with their interaction logs captured by the
system as well as hypotheses data saved in the system. In the result below, I describe my
interpretations followed by users’ quoted comments.
5.6 Result
5.6.1 Confirming result from study one
Feedback from students in study two echoes and confirms results from study
one. For example, users like the feature that maps out annotated data objects to
di↵erent visualizations. This allows them to put various perspectives into the otherwise
unstructured text documents.

94
We feel that this service was helpful in that we could visually see the relation-
ships that we mapped out as well as add our own parts to it without needing
to email them to each other or having multiple networks.(P178)
Users also mentioned the usage of the new timeline. They appreciate the capability
to match individual events against critical events; thus they can quickly target data of
interest. The multiple tracks in the timeline view also encourage them to use the filter
feature.
It helped because we were able to see who was where at what times so when
the crimes were taking place we knew who was near the crime or who was
busy etc.(P150)
The main tool used to help eliminate subjects was by using the filter tool to
see what suspects were not at the location of the thefts at the times for each
incident (P188)
Users rated highly of the collaboration features. They feel the idea of sharing one
common analytic artifact changes the way they collaborate.
This di↵ers because I can actually see what my team is doing as they are
doing it, but we can also alter the information and that would change the
entire network. Changing the network and altering information also updated
and altered my own information, which was something new compared to the
other tools I have used
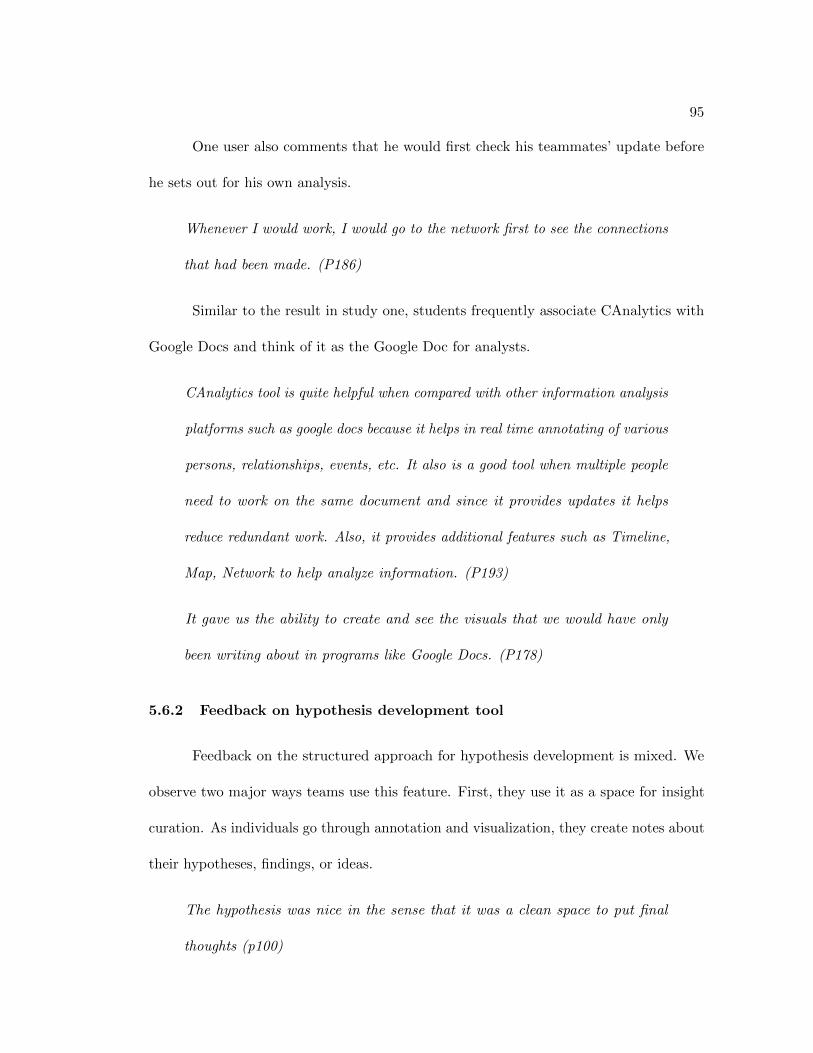
95
One user also comments that he would first check his teammates’ update before
he sets out for his own analysis.
Whenever I would work, I would go to the network first to see the connections
that had been made. (P186)
Similar to the result in study one, students frequently associate CAnalytics with
Google Docs and think of it as the Google Doc for analysts.
CAnalytics tool is quite helpful when compared with other information analysis
platforms such as google docs because it helps in real time annotating of various
persons, relationships, events, etc. It also is a good tool when multiple people
need to work on the same document and since it provides updates it helps
reduce redundant work. Also, it provides additional features such as Timeline,
Map, Network to help analyze information. (P193)
It gave us the ability to create and see the visuals that we would have only
been writing about in programs like Google Docs. (P178)
5.6.2 Feedback on hypothesis development tool
Feedback on the structured approach for hypothesis development is mixed. We
observe two major ways teams use this feature. First, they use it as a space for insight
curation. As individuals go through annotation and visualization, they create notes about
their hypotheses, findings, or ideas.
The hypothesis was nice in the sense that it was a clean space to put final
thoughts (p100)

96
As we went throughout our work we noted any important information and
relationships that we found in the raw data to create hypotheses (P183)
These ideas then become a resource to which they refer when they compose their
final report. This can be a useful feature as it helps analysts to focus on high level
hypotheses instead of relooking at underlying data and visualizations.
I read through the hypothesis and used that to form my answers to the questions.
(p183)
Secondly, participants use it to narrow down analysis and direct the team to focus
on analyzing a particular aspect. When one team member creates a hypothesis, partners
look into that hypothesis, retrieve the context where that hypothesis was generated, and
help validate it connecting with their own knowledge.
It helped us focus and narrow in on an event and suspect.(P191)
I confirmed the results by filtering out the maps, networks, and tables to
confirm the conclusion. (P188)
When my teammate shared a hypothesis about where some of the suspects
work, I responded by using that hypothesis and applying it to my own analysis
to see if I can make a connection between the hypothesis and the theft. (P198)
On the other hand, participants in one team commented that the way a hypothesis
is generated does not follow their workflow. They reflect that when they find something
interesting during their analysis, they would share it immediately with teammates
(verbally).

97
We all agreed with each other when we posted hypotheses because we worked
together the whole time (p100)
We wrote it together so we didn’t really respond to it.(p150)
This team discusses possible hypotheses and comes up with a most reasonable one
together. In other words, the team works closely in a synchronous manner to generate a
hypothesis that everyone would agree on. This di↵ers from the model the tool design
was based on, which encourages frequent turn-around in developing a hypothesis; each
turn-around would be more asynchronous between which teammate would spend time
assessing the validity of the last hypothesis. This closer approach to generating hypotheses
seems prevalent as several teams mention the mismatch between the tool design and
their workflow. This result is interesting as it is in contrast with the feedback on data
annotation and visualization, for which the tool supports a similar structured technique.
Participants mostly like those features as “they reduced the e↵orts to frequently keep
updated with the team”. I will extend exploration into this contrast in the discussion
section.
One student mentions the scalability issue. When the team creates too many
hypotheses, it becomes less e�cient to continue developing these hypotheses.
we enjoyed making hypothesis together, and the tool quickly got out of hand
when we all just tried tossing in info (P204)
It is true that the tool currently does not include any feature to search or manage
hypotheses yet. The display is also not optimized for a large number of hypotheses. The
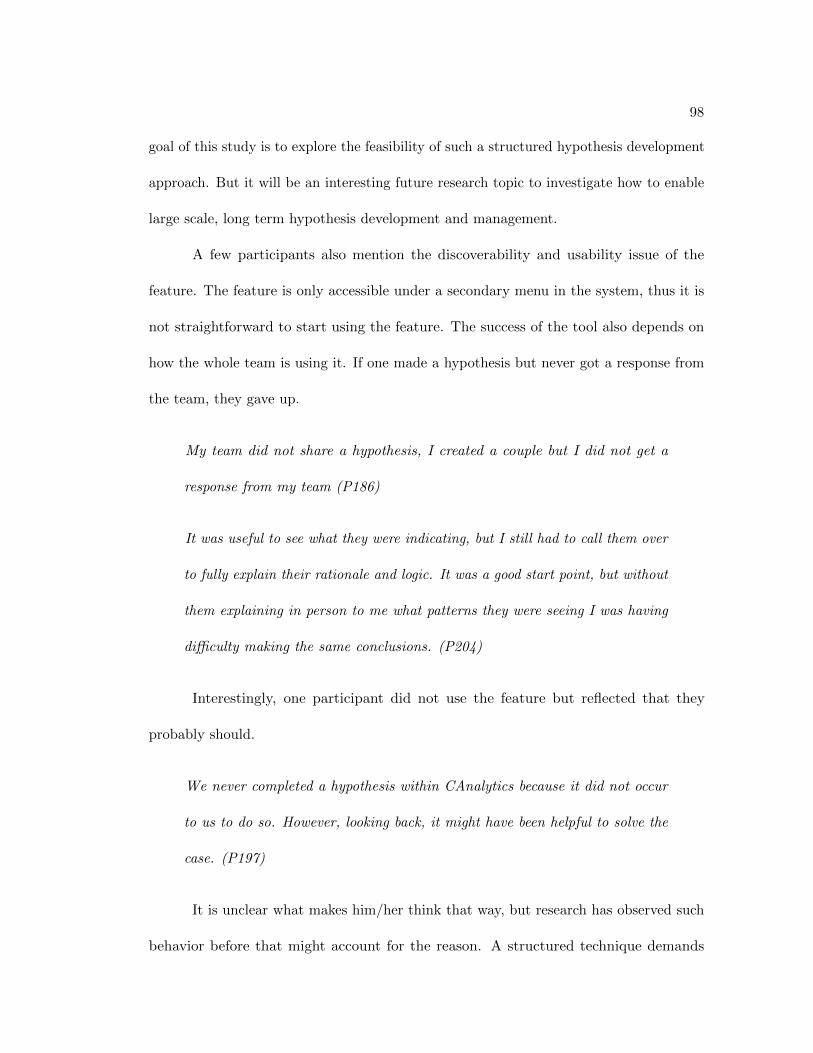
98
goal of this study is to explore the feasibility of such a structured hypothesis development
approach. But it will be an interesting future research topic to investigate how to enable
large scale, long term hypothesis development and management.
A few participants also mention the discoverability and usability issue of the
feature. The feature is only accessible under a secondary menu in the system, thus it is
not straightforward to start using the feature. The success of the tool also depends on
how the whole team is using it. If one made a hypothesis but never got a response from
the team, they gave up.
My team did not share a hypothesis, I created a couple but I did not get a
response from my team (P186)
It was useful to see what they were indicating, but I still had to call them over
to fully explain their rationale and logic. It was a good start point, but without
them explaining in person to me what patterns they were seeing I was having
di�culty making the same conclusions. (P204)
Interestingly, one participant did not use the feature but reflected that they
probably should.
We never completed a hypothesis within CAnalytics because it did not occur
to us to do so. However, looking back, it might have been helpful to solve the
case. (P197)
It is unclear what makes him/her think that way, but research has observed such
behavior before that might account for the reason. A structured technique demands

99
more e↵ort as users must explicitly externalize their thought, which takes more time
than verbally communicating with teammates. Externalization, however, in the long run,
benefits the team as they have an artifact for team reference.
5.7 Discussion
The design goal of CAnalytics V2 is to support higher-level collaborative sense-
making while confirming the positive e↵ect of integrating low-level data annotation and
visualization e↵orts established in study one. Information analysis can be roughly divided
into three key levels (Pirolli and Card 2005; Kang et al. 2014): (1) identifying critical
evidence; (2) organizing evidence into a schema; and (3) generating hypotheses based on
evidence schema. Accordingly, CAnalytics provides data annotation, data visualization,
and hypothesis threading tool for each level. Study one has suggested a positive impact
with the integration of data annotation and visualization. Study two aims to provide
a linkage between hypothesis development and data visualization and investigates the
feasibility in a collaborative setting.
While collaboration occurred throughout the project, its degree of closeness varied
depending on the phase of analysis. When teams set out the project, they usually had
a close discussion on how they were going to tackle the problem strategically and how
they would divide their work. This is often known as strategic coordination, or functional
collaboration (Kang and Stasko 2011). CAnalytics does not have a feature to explicitly
support this, but we do observe participants discussing over the messaging tool.

100
In our observation, teams then divided up the work and worked on their part
individually. They still collaborated by sharing evidence they annotated, but the collabo-
ration was looser because it was mostly content sharing without a need for deep discussion.
The real time sharing feature provided by CAnalytics helped facilitate collaboration.
We observed a stronger demand for close collaboration in hypothesis development
than in data annotation or visualization. We speculate that collaboration in higher
level sensemaking requires a higher volume of information to be exchanged. While data
annotation activities share only a piece of annotation, hypothesis development requires
the sharing of a rich amount of evidence and schema at a high frequency. And based on
the evidence, there can more than one direction analysts can draw from. The team needs
a more synchronous, closer channel to exchange their ideas. This is probably why they
preferred to discuss over hypotheses together and compose hypothesis collectively.
This nuance in collaboration closeness suggests accounting for the di↵erent needs
in our group design. Teammates in loosely coupled collaboration are weakly dependent
on one another and can function autonomously, often without the need for immediate
clarification or negotiation with others. Yet analysts in closely-coupled collaboration
have high frequency of turn-arounds and high density information exchange, and thus
a multi-channel communication is preferred. Groupware systems that are designed to
support both couplings must address these di↵erences.
Another goal of this research is to explore alternatives to existing structured
techniques such as Analysis of Competing Hypotheses (ACH). There are several key
di↵erences in our approach to hypothesis development.

101
First, it takes less e↵ort to start generating a hypothesis. ACH asks analysts to
cover a wide range of hypotheses in the very beginning; therefore it demands experience
and knowledge. It takes serious commitment to come up with all possible scenarios and
often is intimidating enough to drive away junior analysts. In contrast, our approach
is opportunistic. As analysts annotate key evidence in documents, they can create a
hypothesis whenever they see a connection between two pieces of evidence. It makes
analysts easier to get started and gain momentum to continue.
Second, the hypothesis development process is integrated with evidence annotation
and analysis. Analysts can provide an associated visualization state for each hypothesis,
and that visualization provides the full context with which partners can validate the
hypothesis. Lacking context is often a critique of ACH (van Gelder 2008) because each
evidence/hypothesis is treated on its own.
Third, hypotheses can be more flexibly structured. The matrix structure in ACH
assumes hypotheses are isolated and are on a single level. It asks all hypotheses to be
entered individually on the top row of the matrix. In reality, however, hypotheses can be
more or less abstract or general. A hypothesis can have sub-hypotheses, and a hypothesis
can be built upon another one. The threading structure in our approach allows for a
more flexible way to develop hypotheses. A sub-thread can support, refute, or extend the
parent thread.
5.8 Summary
This chapter presents the second classroom study where senior undergraduate
students were learning to apply visual analytic techniques on intelligence analysis and

102
employed CAnalytics in their course project. With a focus on qualitative analysis of
participants’ answers, we confirmed results from the first study. Further, we identified
di↵erent ways teams used the hypothesis development feature. While some teams
used it as a collective insight curation space, other teams used it to direct the next
collaboration opportunity. The result is followed by a discussion on design considerations
of collaboration closeness. In the next chapter, we will reflect on the two studies and
discuss the lessons we learned overall.

103
Chapter 6
Discussion and Conclusion
Design implications have been discussed at the end of each classroom study. This
section discusses the reflection on my overall dissertation research.
6.1 Design research
Groupware research presents di↵erent challenges from research on individual tools.
Groupware research involves dynamics between multiple individuals and such dynamics
are heavily shaped and mediated by the tool. The tool and the team function as a single
system in accomplishing a task. A single feature in the tool may change team behavior
altogether. In single-user tool research, a research method that is often employed is to
mock up features to test the user’s reaction and mock out other features that researchers
are not interested in. However, this method does not work for evaluating groupware. To
understand how groupware will influence team dynamics, the groupware must be fully
functional, with full capability to support team communication and coordination. The
team dynamics cannot be simulated.
Team dynamics take time to evolve. This includes the development of social
awareness, situation awareness, workspace awareness, and activity awareness. Such
awareness needs time to be established and maintained to a level where the team can start
work e↵ectively. This is also di↵erent from single-user research, in which user reaction
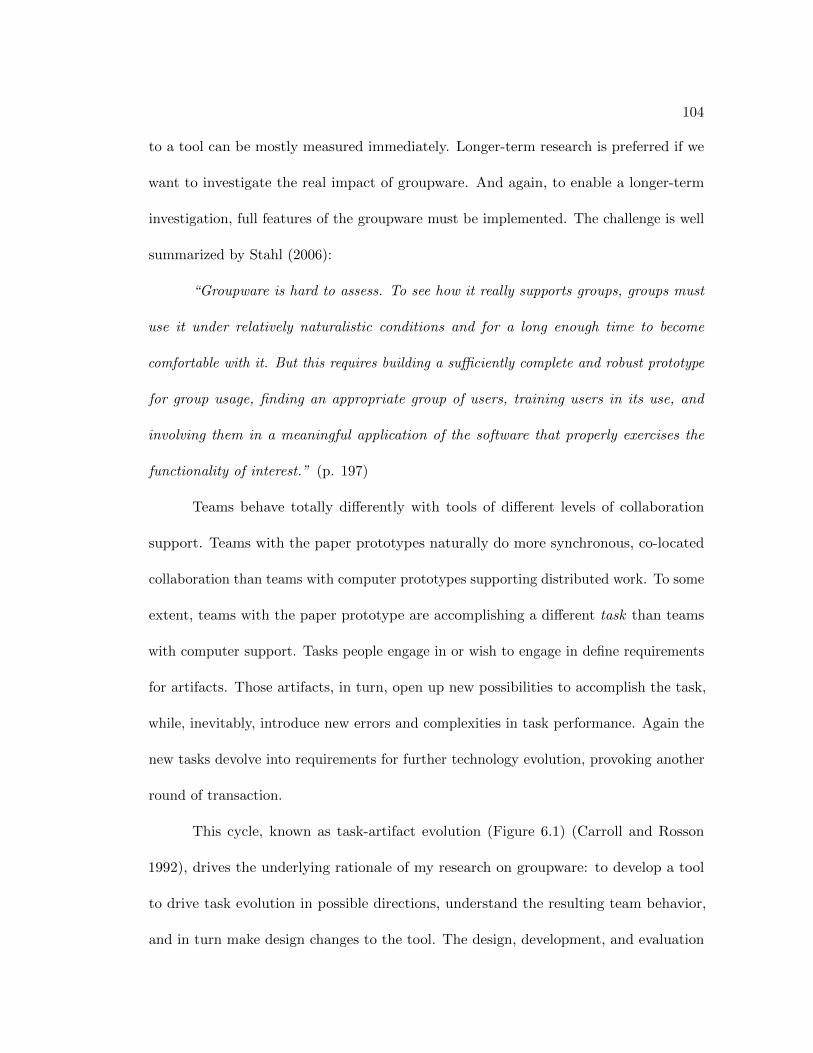
104
to a tool can be mostly measured immediately. Longer-term research is preferred if we
want to investigate the real impact of groupware. And again, to enable a longer-term
investigation, full features of the groupware must be implemented. The challenge is well
summarized by Stahl (2006):
“Groupware is hard to assess. To see how it really supports groups, groups must
use it under relatively naturalistic conditions and for a long enough time to become
comfortable with it. But this requires building a su�ciently complete and robust prototype
for group usage, finding an appropriate group of users, training users in its use, and
involving them in a meaningful application of the software that properly exercises the
functionality of interest.” (p. 197)
Teams behave totally di↵erently with tools of di↵erent levels of collaboration
support. Teams with the paper prototypes naturally do more synchronous, co-located
collaboration than teams with computer prototypes supporting distributed work. To some
extent, teams with the paper prototype are accomplishing a di↵erent task than teams
with computer support. Tasks people engage in or wish to engage in define requirements
for artifacts. Those artifacts, in turn, open up new possibilities to accomplish the task,
while, inevitably, introduce new errors and complexities in task performance. Again the
new tasks devolve into requirements for further technology evolution, provoking another
round of transaction.
This cycle, known as task-artifact evolution (Figure 6.1) (Carroll and Rosson
1992), drives the underlying rationale of my research on groupware: to develop a tool
to drive task evolution in possible directions, understand the resulting team behavior,
and in turn make design changes to the tool. The design, development, and evaluation
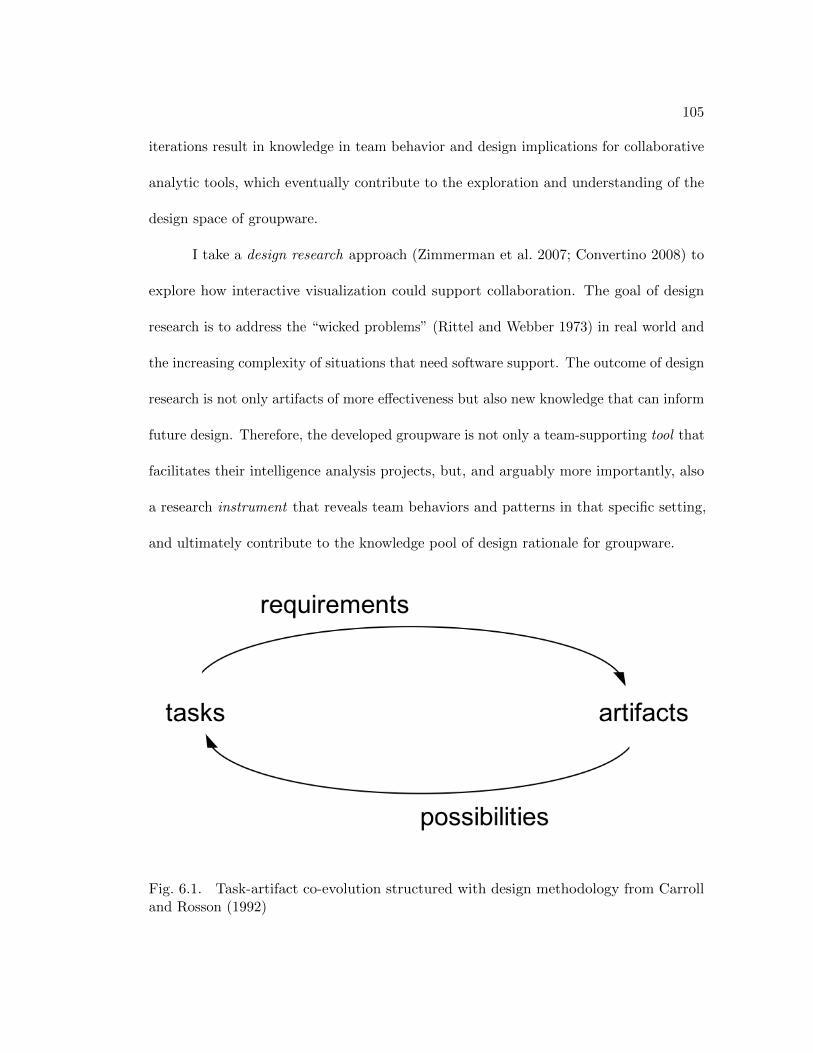
105
iterations result in knowledge in team behavior and design implications for collaborative
analytic tools, which eventually contribute to the exploration and understanding of the
design space of groupware.
I take a design research approach (Zimmerman et al. 2007; Convertino 2008) to
explore how interactive visualization could support collaboration. The goal of design
research is to address the “wicked problems” (Rittel and Webber 1973) in real world and
the increasing complexity of situations that need software support. The outcome of design
research is not only artifacts of more e↵ectiveness but also new knowledge that can inform
future design. Therefore, the developed groupware is not only a team-supporting tool that
facilitates their intelligence analysis projects, but, and arguably more importantly, also
a research instrument that reveals team behaviors and patterns in that specific setting,
and ultimately contribute to the knowledge pool of design rationale for groupware.
Fig. 6.1. Task-artifact co-evolution structured with design methodology from Carrolland Rosson (1992)

106
6.2 Classroom study
A critical requirement in design research is to understand the user’s needs and
practices. When these needs and practices are specialized, as is the case of Intelligence
Analysis, it is particularly important to include the target user population in the design
process, situate research in a complex work activity contexts, and directly investigate
interactions, experiences, and outcomes in those contexts. I take Intelligence Analysis
as a specialized, domain-specific task of information analysis. Therefore it is important
to understand analysts with domain knowledge, learn their practice, and observe their
reaction to tool features (Scholtz and Endert 2014). However, professional analysts are
hard to include in a long-term design cycle due to confidentiality and security issues. The
classroom study provided an opportunity with deep access to analysts in training. These
analysts have been trained with knowledge and skills of intelligence analysis, and have
experience with state-of-the-art analytic tools such as Analyst’s Notebook and PARC
ACH. In their reflections, participants often compared CAnalytics to those tools, as well
as the di↵erent teamwork experiences. Therefore, while their feedbacks are admittedly
not identical to experienced professionals, they do provide a deeper insight into the
strengths and weaknesses of the tool than ordinary users. In addition, the students are
young learners that are willing to employ new work practices supported by features in
tools. They are important parts of the future intelligence community. In this sense, their
practice can be treated as a view into the future of practice of the community (Martin
2014).

107
Studies in this research spanned multiple user sessions. This gave participants
time to learn to adapt to team functions and to appropriate the tool to best serve their
team purpose. Teams were able to explore di↵erent team strategies and to make changes
if they got stuck (Stahl 2006). For example, we noticed that two teams decided to change
the use of the tool halfway in their analysis. One team started with dividing work by case
documents but later decided members should annotate di↵erent entity types. Another
team started with an accretion strategy by annotating all entities and later discovered
that this strategy brought too much noise and decided to clean out irrelevant entities
(filtering strategy). Such change occurs as a consequence of increased awareness of team
functions and tool capabilities, which takes time to develop.
With deep access to these analysts, I can interpret and triangulate the data from
multiple sources. I qualitatively analyzed participants’ feedback to understand their
first-person experience and corroborated them with surveys and interaction logs. The
interaction logs provided us a detailed view of their analysis process and allowed us to
quantitatively characterize their team behavior. Finally, their analytic products, including
the visual artifacts and team reports, helped us distinguish team outcomes. In summary,
this research contributes to the study of computer-supported collaboration work with
valuable empirical data.
Yet classroom study also has limits. For example, many factors and variables
could exist that a↵ect team performance. The fact that these factors are often impossible
to model or control adds to the di�culty in data analysis (e.g. teammate absence). Also,
data collection is challenging because team interactions are not always accessible. Teams
can choose to work synchronously or asynchronously, and it is di�cult to predict when or

108
where the interaction of most interest is to occur. Verbal communication is not accessible,
which could be useful to infer team awareness as a complement to interaction logs. My
work identifies both positive evidence and problematic situations, and propose potential
solutions and possible hypotheses, yet rigorously evaluating these solutions and validating
hypotheses is beyond this study. Lab studies and case studies can be conducted in the
future to address these problems with greater control and deeper data access.
6.3 Analyst in control
Throughout my study I observed that analysts are constantly annotating new
data, restructuring existing annotations, archiving irrelevant data, and examining data
in visualization. This is an extension compared to many other visualization tools, with
which users are faced with pre-populated data and tasked with creating visual mappings
to identify hidden patterns behind the data. In Intelligence Analysis and many other
information analysis tasks, analysts frequently create and re-recreate data models to
serve their analysis as their hypothesis evolves.
Data modeling is often seen as a precondition to perform any visual analysis. Data
modeling transforms raw data to structured entities that are readable and processable
to software. The focus of Visual Analytics has been largely put on combining auto-
mated modeling with interactive visualizations to facilitate reasoning (Keim et al. 2010),
emphasizing the role of human in the loop of visualization and insight generation. In
practice, however, I find that data modeling is an iterative process that is intermingled
with visual analysis. New insights inspires analysts to re-model data either in a di↵erent
scope (horizontally) or in a di↵erent level of detail (vertically).

109
Horizontally, analysts annotate di↵erent parts of the data. For example, an
intelligence project typically includes data that consists of a series of critical events.
Analysis of the data though can focus on some of the events. Analysts decide which
events to look into first. As they come up with new hypotheses or need more data to
validate his hypothesis, they may continue annotating and visualizing other events.
Vertically, analysts annotate data to the level of detail they prefer at the moment
of their analysis. The same piece of a document can be annotated in di↵erent ways
according to the analyst’s need. For example, when the analysts are in the early phase of
the investigation and want to get an overview of all events, they can annotate an event
with time, place, and a brief summary. As they get more interested in a specific event,
they can add the people that were involved and tools/resources that were used in the
event. If the event becomes critical and needs to be compared with other events to find
patterns, analysts might annotate the step-by-step process how people did it in the event.
In contrast, if an event becomes irrelevant to the hypothesis, the analysts may remove its
details or the event altogether to avoid distraction.
Annotation is used to allow analysts to create and modify their data of interest.
This complements the popular approach which employs automated modeling such as
natural language processing (NLP) techniques to extract and model entities (Bier et al.
2010; Stasko et al. 2008). While algorithms for named entity recognition have improved
significantly, developers of the entity-based systems (Gorg et al. 2014) admitted that the
accuracy of automatic entity extraction is not su�cient to support human analysis. This
is especially true when the tasks are exploratory in nature, where the questions are ill-
defined and no training data is available (Thomas 2005). Besides, relationships identified

110
by algorithms are limited to explicit, defined rules, whereas identifying meaningful
relationships implicit in documents that are of more importance to analysts is not
possible. And perhaps the most problematic is the fact that the NLP processes data
without awareness of the problem the analysts have at hand.
I posit that information analysis is a progressive process, wherein analysts place a
varying priority on evidence depending on how they frame the problem (Heuer 1999).
Annotation allows for user control in the process, allows integrated source data objects
to be identified, and avoids the problems associated with automatic identification of
disaggregated people, locations, and times (Bier et al. 2008). Analysts can decide their
own information of interest and granularity that best suits their ad-hoc analytic needs.
The guide to visually exploring data “Overview first, zoom and filter, then details-on-
demand”, as proposed by Shneiderman (2003) describes how data should be presented on
screen. I suggest extending the guide to be “Overview first, model data, analyze, zoom
and filter, re-model, then details on demand”.
6.4 Collaboration, structured technique, and the role of computing
tools
Collaboration is, in essence, the development of content common ground and
process common ground within a team (Convertino et al. 2009). The content common
ground encompasses “I know that you know that I know what”. It is the result of
information sharing. The process common ground encompasses “I know that you know
that I know how”. This is the shared understanding across team members of the

111
procedures, rules, and manner in which collaboration will occur. The process common
ground helps teams achieve high awareness and result in content common ground.
The process common ground can be achieved with ad-hoc team discussion and
negotiation, or agreement on a predefined set of procedures. Structured technique is such
a predefined set of procedures, rules, and manner in information analysis. Structured
technique breaks down information analysis into a defined process of reasoning, and define
a set of procedures teammates agree upon before they start to collaborate on work. With
all analysts understanding the structured technique, it provides teams with a base process
common ground. Following the structured techniques, each team member has their
role and task. By implementing the technique, individuals focus on their own piece of
work, while understanding what and why teammates are working on, without constantly
re-coordinating and re-aligning team intentions and individual behaviors. Structured
technique has little dependency on the team attributes or individual experience, and thus
can be applied to various teams with relative ease. In that sense, It is a methodology of
common ground development that can be abstracted and generalized to collaboration
between other teams, to enable e↵ective teamwork.
Structured technique emphasizes the externalization of reasoning and preserve the
process that leads to the conclusion. The human mind is often blamed for its stateless
memory–people keep updated with the current thinking, but lose track of the last idea
even seconds ago. Information analysis typically takes an extended period of time, and
the final conclusion may di↵er completely from the original hypothesis. The situation
becomes even worse in collaborative work. People fail to recall arguments or evidence
from teammates. Structured technique helps organize information in a structured manner.

112
For example, my tool requires analysts to put facts and relationships in a structured form.
These representations can easily be shared across teammates. With real time sharing,
every creation or modification of externalization is streamed to teammates as partner’s
action along the course, contributing to the development of team awareness. Structured
technique preserves the path of reasoning, including the proposal of a hypothesis, evidence
favoring or against the hypothesis, and development of the hypothesis. Such information
provides references to team collaboration, anchors over which teams can discuss and
improve.
Structured technique is yet tedious to implement manually. It requires a lot of
e↵ort to externalize information and keep it organized. This is where computing tools
come in. Computers are e�cient at keeping consistent data structures and make cross-
referencing data entities straightforward. There are at least four functions computing
tools can support: 1) Keeping data input consistent from collaborators. Individuals
from di↵erent backgrounds and roles could have di↵erent input habits and formats. The
tool can enforce a format that complies with the structured technique. 2) Visualize
information. 3) Share information and team actions properly. 4) Identify opportunities
for collaboration.
6.5 Education in collaborative information analysis
An important direction of this research is to explore how such a collaborative
instrument could be employed to support collaborative learning in education. I studied an
introductory intelligence analysis course, but many other courses involve heavy information
analysis tasks, in which snippets of information must be annotated and analyzed with

113
Fig. 6.2. Structured techniques, collaboration, and tooling
respect to concepts, connections, weights of evidence, and pros and cons of opinions. This
is similar to generating and evaluating hypotheses in our case. Thus one could imagine
courses in business, new media, scientific studies, and those involving heavy literature
review adopting this tool similar to the case described here.
The goal is to shape students’ behavior towards more collaborative learning.
With traditional single-user tools, students often employ a divide-and-conquer strategy;
they divide their job responsibility, work individually on their own part, and put the
results together in the end for report submission. In my study, I observed that students
spontaneously conducted closer collaboration and enjoyed being able to contribute
simultaneously.
In addition to shaping the learning behavior of students, a collaborative supporting
tool can also change how an instructor teaches analytic skills. Anecdotal reflections from

114
the instructor in my classroom study emphasized the role of system support in instructor
intervention. During my classroom study, the instructor frequently went over to the
student’s desk and checked how they were doing. The instructor commented that he
valued students’ analytic process as much as their final report. His emphasis on analytic
process is consistent with the value of the intelligence community, who claimed that
analysts “should think about how they make judgments and reach conclusions, not just
about the judgments and conclusions themselves” (Heuer 1999). However, the process
is hard or costly to capture for assessment in reality. In the context of education, for
example, all students are conducting analysis at the same time. Without explicit support,
the instructor has limited supervision over the process.
The collaborative learning instrument is likely to provide an opportunity to get a
student’s analytic traces preserved and assessed because the system has already captured
and saved user interactions. These logs are currently saved for research purposes in my
study, but potentially they can be displayed to the instructor for assessment purposes.
Taking advantage of the system’s synchronization capability, student’s behavior can be
streamed to a “monitoring dashboard” in real time, from which the instructor could check
student’s progress and take early intervention if any team deviates from the expected
path.
6.6 Summary
This dissertation contributes an understanding of how analysts use groupware
to analyze complex datasets over extended periods. The research presents a design
process that identifies design requirements from task analysis, embodies requirements

115
into groupware prototypes, observes team behavior mediated by the tool, and then
repeats the process. Through a series of user studies, I investigated how we can better
support collaborative information analysis. To this end, I implemented and evaluated
two versions of a groupware tool to understand the e↵ects of these design considerations
on collaboration. Here is a brief review of the major contributions of the dissertation.
C1: A characterization of collaborative information analysis activities.
These activities include data modeling, visual analysis, and hypothesis development.
Structured techniques such as ACH and link analysis are often employed in the process.
Collaboration is often impeded by the limit of concurrency and manual sharing.
C2: A fully functional tool that supports collaborative information
analysis. Features of the tool include integrated support for data modeling, visual
analysis, and hypothesis development, a structured approach for data analysis activities,
team awareness support, and capture of high-level, semantic usage logs. The architectural
design and implementation can help future groupware overcome technical issues in
synchronicity enablement and complex state management.
C3: A characterization of analysts’ team behavior mediated by group-
ware over extended periods. Evaluation of the tool through two classroom studies
with analysts-in-training reveals various team behaviors such as filtering and accretion,
situational logic and comparison, inferential connection and factual discrete, as well as a
loose coupling in data modeling and close collaboration in hypothesis development. The
result highlights the importance of providing an integrated workspace that supports the
smooth transition of analytic activities.

116
C4: Design guidelines to improve collaborative information analysis
support. These guidelines include properly representing uncertainty both from data
and from teammates, building collapsible views for hierarchical data, treating views
as a team resource like data that are sharable, extensible, and reusable, distinguish
visible and valuable contributions to encourage high-quality participation, and supporting
multiple levels of collaboration closeness throughout the analysis lifecycle. It also calls
for a combination of structured technique and awareness technology to better support
collaborative information analysis.
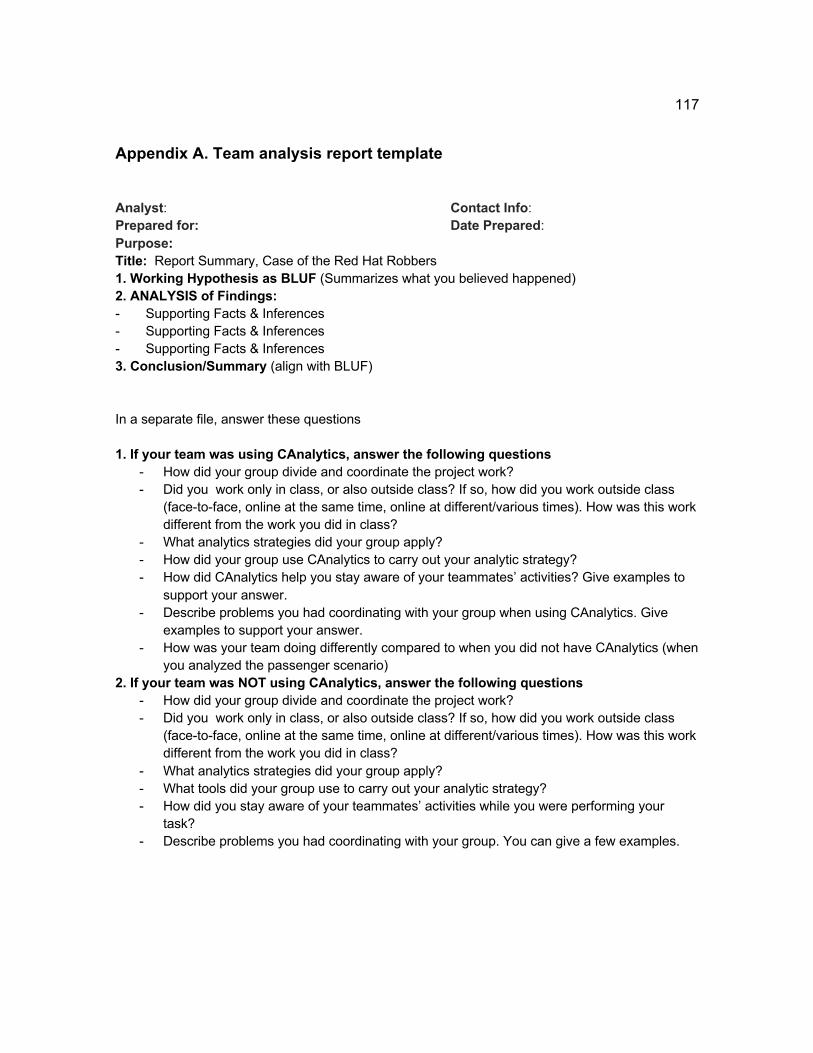
117
Appendix A. Team analysis report template Analyst: Contact Info: Prepared for: Date Prepared: Purpose: Title: Report Summary, Case of the Red Hat Robbers 1. Working Hypothesis as BLUF (Summarizes what you believed happened) 2. ANALYSIS of Findings: - Supporting Facts & Inferences - Supporting Facts & Inferences - Supporting Facts & Inferences 3. Conclusion/Summary (align with BLUF) In a separate file, answer these questions 1. If your team was using CAnalytics, answer the following questions
- How did your group divide and coordinate the project work? - Did you work only in class, or also outside class? If so, how did you work outside class
(face-to-face, online at the same time, online at different/various times). How was this work different from the work you did in class?
- What analytics strategies did your group apply? - How did your group use CAnalytics to carry out your analytic strategy? - How did CAnalytics help you stay aware of your teammates’ activities? Give examples to
support your answer. - Describe problems you had coordinating with your group when using CAnalytics. Give
examples to support your answer. - How was your team doing differently compared to when you did not have CAnalytics (when
you analyzed the passenger scenario) 2. If your team was NOT using CAnalytics, answer the following questions
- How did your group divide and coordinate the project work? - Did you work only in class, or also outside class? If so, how did you work outside class
(face-to-face, online at the same time, online at different/various times). How was this work different from the work you did in class?
- What analytics strategies did your group apply? - What tools did your group use to carry out your analytic strategy? - How did you stay aware of your teammates’ activities while you were performing your
task? - Describe problems you had coordinating with your group. You can give a few examples.

118
Appendix B. Pre survey Demographic 1. Gender 2. Age __________ 3. How much experience do you have working on the following teams (e.g. 3 months, 2 years)? a. Class-based teams (e.g. course project groups) _______ b. Business teams (e.g. internships, summer jobs) _______ c. Intelligence analysis teams (either in class, lab, or professional institutions) _______ d. Other teams. Please explain _________ 4. Please rate your level of agreement with each of the following statements on a scale of 1-7 · I prefer to work alone rather than in group · I enjoy working in a group situation Usability Rate at how you agree to the following statements on a scale of 1-7
1. I think that I would like to use this system frequently. 2. I found the system unnecessarily complex. 3. I thought the system was easy to use. 4. I think that I would need the support of a technical person to be able to use this system. 5. I found the various functions in this system were well integrated. 6. I thought there was too much inconsistency in this system. 7. I would imagine that most people would learn to use this system very quickly. 8. I found the system very cumbersome to use. 9. I felt very confident using the system. 10. I needed to learn a lot of things before I could get going with this system.
Open ended 1. What problems/bugs with the tool did you encounter? 2. What improvements of the tools do you desire? Your PSU email Note: this information will only be used to link together the responses that you provide for the various surveys administered in this study. The information will not be used for identification purpose.

119
Appendix C. Mid-survey Think about your work with your teammates today, and answer these questions
1. It was easy to find what my teammates had worked on in the collaborative space 2. I was always aware of what my teammates were doing while we were online 3. I was never aware of what my teammates were going to do next 4. My teammates had a definite sense of direction and purpose
The following questions ask you to comment on the performance of your teammates TODAY. First write the name of your teammates. Leave Teammate C blank if you only have two teammates. (This information is used for research only and will not be used for identification or grading purpose) Teammate A: Teammate B: Teammate C: Think about the performance of Teammate A TODAY, and rate how you agree to the following statements
1. S/he participated actively 2. S/he shared many ideas related to goals 3. S/he exhibited leadership skills 4. S/he reflected awareness of others' views and opinions 5. S/he built upon others' contributions
Think about the performance of Teammate B TODAY, and rate how you agree to the following statements
1. S/he participated actively 2. S/he shared many ideas related to goals 3. S/he exhibited leadership skills 4. S/he reflected awareness of others' views and opinions 5. S/he built upon others' contributions
Think about the performance of Teammate C TODAY, and rate how you agree to the following statements
1. S/he participated actively 2. S/he shared many ideas related to goals 3. S/he exhibited leadership skills 4. S/he reflected awareness of others' views and opinions 5. S/he built upon others' contributions

120
Appendix D. Post Survey
Awareness
1. It was easy to find what my teammates had worked on in the collaborative space 2. I was always aware of what my teammates were doing while we were online 3. I was never aware of what my teammates were going to do next 4. My teammates had a definite sense of direction and purpose 5. Over time, my teammates and I came to share more and more ideas about the problem 6. Over time, my teammates and I have developed our own ways of working together 7. Over time, my teammates and I became more capable of collaborating remotely than when
we started Collective efficacy
1. Our group can integrate the unique ideas of different members even though it could be easier to just pick one idea.
2. Our group can converge on a single idea even though each person tends to see things through the lens of their own experience and interests.
3. Members of our group can share ideas without fear of criticism from the group. 4. Our group can manage conflicts and differences of opinion constructively though
someone’s feelings could be hurt. 5. Members of our group can compromise when necessary even though everyone has their
own unique perspective. 6. Members of our group can establish and maintain awareness of partner activity although
this can require extra of time and effort. Group cohesion
1. I enjoyed communicating and sharing ideas with my teammates 2. I enjoyed collaborating with my teammates 3. I clearly felt part of a team after working with my teammates on the project 4. My teammates and I wasted a lot of time
Communication and common ground
1. I found it difficult to keep track of our conversation 2. It was hard to communicate effectively 3. I can think of a number of times when I did not understand the information I received from
my teammates 4. It is often necessary for me to go back and check the accuracy of information I received 5. I can easily go back and check the accuracy of information I received 6. I sometimes feel that others don’t understand the information they have received. 7. When people talk to each other in this group, there is a great deal of understanding
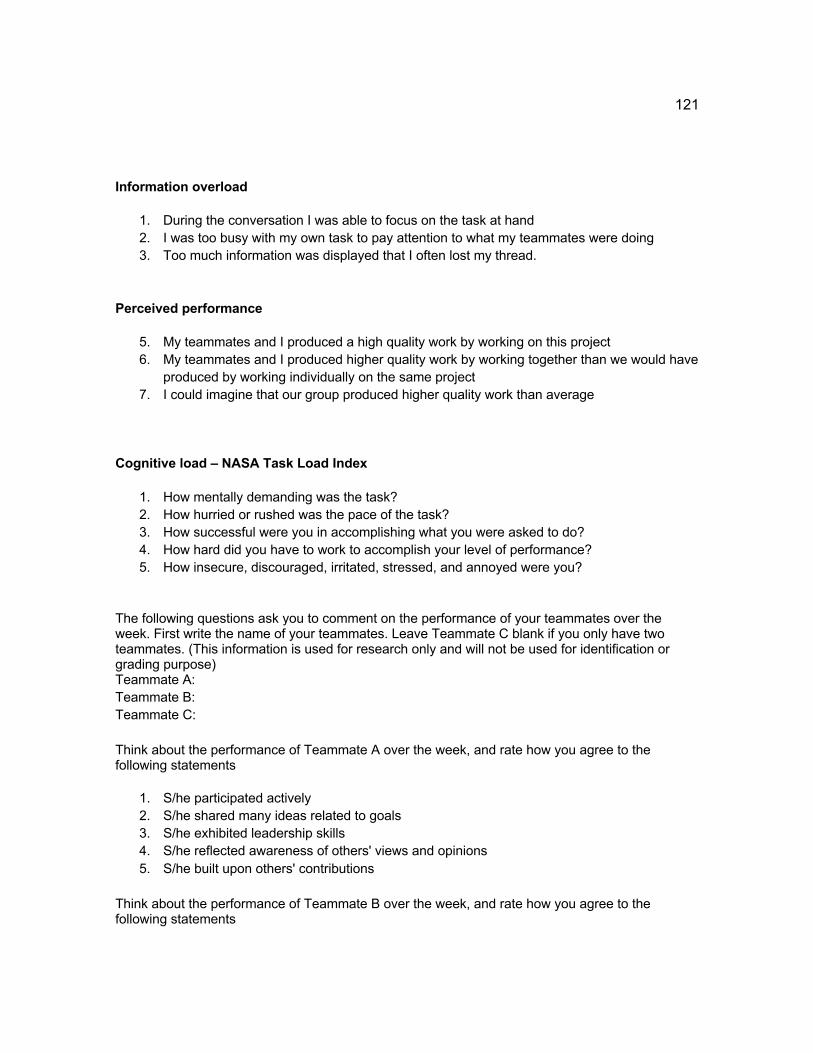
121
Information overload
1. During the conversation I was able to focus on the task at hand 2. I was too busy with my own task to pay attention to what my teammates were doing 3. Too much information was displayed that I often lost my thread.
Perceived performance
5. My teammates and I produced a high quality work by working on this project 6. My teammates and I produced higher quality work by working together than we would have
produced by working individually on the same project 7. I could imagine that our group produced higher quality work than average
Cognitive load – NASA Task Load Index
1. How mentally demanding was the task? 2. How hurried or rushed was the pace of the task? 3. How successful were you in accomplishing what you were asked to do? 4. How hard did you have to work to accomplish your level of performance? 5. How insecure, discouraged, irritated, stressed, and annoyed were you?
The following questions ask you to comment on the performance of your teammates over the week. First write the name of your teammates. Leave Teammate C blank if you only have two teammates. (This information is used for research only and will not be used for identification or grading purpose) Teammate A: Teammate B: Teammate C: Think about the performance of Teammate A over the week, and rate how you agree to the following statements
1. S/he participated actively 2. S/he shared many ideas related to goals 3. S/he exhibited leadership skills 4. S/he reflected awareness of others' views and opinions 5. S/he built upon others' contributions
Think about the performance of Teammate B over the week, and rate how you agree to the following statements

122
1. S/he participated actively 2. S/he shared many ideas related to goals 3. S/he exhibited leadership skills 4. S/he reflected awareness of others' views and opinions 5. S/he built upon others' contributions
Think about the performance of Teammate C over the week, and rate how you agree to the following statements
1. S/he participated actively 2. S/he shared many ideas related to goals 3. S/he exhibited leadership skills 4. S/he reflected awareness of others' views and opinions 5. S/he built upon others' contributions
Tool-specific
1. My teammates and I could easily assemble our findings in the notepad tool 2. The history tool keeps me aware of my teammates’ activities 3. The notification of teammates’ activities was useful as it kept me aware of what they were
doing 4. The notification of teammates’ activities was annoying and distracting. 5. I found the little icons on each tool window title bar useful because they kept me aware of
where my teammates were working on 6. Being able to refer to entities in the message tool (by typing ‘@’) makes the conversation
more effective. 7. I preferred to use the message tool than to talk to my teammates as I could refer to the
entities directly in the message tool Usability
1. I think that I would like to use this system for other information analysis tasks. 2. I found the system unnecessarily complex. 3. I thought the system was easy to use. 4. I think that I would need the support of a technical person to be able to use this system. 5. I found the various functions in this system were well integrated. 6. I thought there was too much inconsistency in this system. 7. I would imagine that most people would learn to use this system very quickly. 8. I found the system very cumbersome to use. 9. I felt very confident using the system. 10. I needed to learn a lot of things before I could get going with this system.

123
Bibliography
Saleema Amershi, Max Chickering, Steven M Drucker, Bongshin Lee, Patrice Simard,
and Jina Suh. ModelTracker : Redesigning Performance Analysis Tools for Machine
Learning. In Proceedings of the 33rd Annual ACM Conference on Human Factors in
Computing Systems, pages 337–346, 2015. ISBN 9781450331456.
A.D. Balakrishnan, S.R. Fussell, Sara Kiesler, and Aniket Kittur. Pitfalls of information
access with visualizations in remote collaborative analysis. In Proceedings of the
2010 ACM conference on Computer supported cooperative work, pages 411–420, 2010.
ISBN 9781605587950. doi: 10.1145/1718918.1718988. URL http://portal.acm.org/
citation.cfm?id=1718988.
Jacques Bertin. Semiology of graphics: diagrams, networks, maps. 1983.
Eric a. Bier, Stuart K. Card, and John W. Bodnar. Entity-based collaboration tools
for intelligence analysis. In 2008 IEEE Symposium on Visual Analytics Science and
Technology, pages 99–106. Ieee, oct 2008. ISBN 978-1-4244-2935-6. doi: 10.1109/
VAST.2008.4677362. URL http://ieeexplore.ieee.org/lpdocs/epic03/wrapper.
htm?arnumber=4677362.
Eric a Bier, Stuart K Card, and John W Bodnar. Principles and tools for collaborative
entity-based intelligence analysis. IEEE transactions on visualization and computer
graphics, 16(2):178–91, 2010. ISSN 1077-2626. doi: 10.1109/TVCG.2009.104. URL
http://www.ncbi.nlm.nih.gov/pubmed/20075480.

124
Marcela Borge and John M Carroll. Verbal Equity, Cognitive Specialization, and Perfor-
mance. In GROUP ’14 Proceedings of the 18th International Conference on Supporting
Group Work, pages 215–225, 2014.
Marcela Borge, Craig H. Ganoe, Shin-I Shih, and John M. Carroll. Patterns of team
processes and breakdowns in information analysis tasks. In Proceedings of the ACM
2012 conference on Computer Supported Cooperative Work - CSCW ’12, pages 1105–
1114, New York, New York, USA, 2012. ACM Press. ISBN 9781450310864. doi:
10.1145/2145204.2145369. URL http://dl.acm.org/citation.cfm?doid=2145204.
2145369.
John M Carroll and Robert L Campbell. Artifacts as psychological theories: The case
of human-computer interaction. Behaviour & Information Technology, 8(4):247–256,
1989.
John M. Carroll and Mary Beth Rosson. Getting around the task-artifact cycle: how
to make claims and design by scenario. ACM Transactions on Information Systems,
10(2):181–212, apr 1992. ISSN 10468188. doi: 10.1145/146802.146834. URL http:
//portal.acm.org/citation.cfm?doid=146802.146834.
John M. Carroll, Dennis C. Neale, Philip L. Isenhour, Mary Beth Rosson, and D.Scott
McCrickard. Notification and awareness: synchronizing task-oriented collaborative
activity. International Journal of Human-Computer Studies, 58(5):605–632, may 2003.
ISSN 10715819. doi: 10.1016/S1071-5819(03)00024-7. URL http://linkinghub.
elsevier.com/retrieve/pii/S1071581903000247.

125
John M. Carroll, Mary Beth Rosson, Umer Farooq, and Lu Xiao. Beyond being aware.
Information and Organization, 19(3):162–185, jul 2009. ISSN 14717727. doi: 10.1016/
j.infoandorg.2009.04.004. URL http://linkinghub.elsevier.com/retrieve/pii/
S147177270900013X.
John M. Carroll, Ieee Fellow, Hao Jiang, Mary Beth Rosson, Shin-i Shih, Jing Wang,
Lu Xiao, Dejin Zhao, and U S A Pennsylvania. Supporting Activity Awareness in
Computer-Mediated Collaboration. In International Conference on Collaboration
Technologies and Systems, pages 1–12, 2011.
John M. Carroll, Marcela Borge, and SI Shih. Cognitive artifacts as a window on
design. Journal of Visual Languages & Computing, 24(4):248–261, 2013. URL http:
//www.sciencedirect.com/science/article/pii/S1045926X13000207.
Dong Chen, Rachel K. E. Bellamy, Peter K. Malkin, and Thomas Erickson. Diagnostic
Visualization for Non-expert Machine Learning Practitioners : A Design Study. In
Visual Languages and Human-Centric Computing (VL/HCC), 2016 IEEE Symposium
on. IEEE, pages 87–95, 2016. ISBN 9781509002528.
George Chin Jr, Olga A. Kuchar, and Katherine E. Wolf. Exploring the analytical
processes of intelligence analysts. In Proceedings of the SIGCHI Conference on Human
Factors in Computing Systems, pages 11–20, 2009. ISBN 9781605582467. URL
http://dl.acm.org/citation.cfm?id=1518704.
Gregorio Convertino. Awareness and knowledge sharing in collaborative computing:
experimental methods. PhD thesis, Pennsylvania State University, 2008.

126
Gregorio Convertino, Helena M. Mentis, Mary Beth Rosson, John M. Carroll, Aleksandra
Slavkovic, and Craig H. Ganoe. Articulating common ground in cooperative work.
Number May 2014, page 1637, 2008. ISBN 9781605580111. doi: 10.1145/1357054.
1357310.
Gregorio Convertino, H.M. Mentis, Mary Beth Rosson, Aleksandra Slavkovic, and
John M. Carroll. Supporting content and process common ground in computer-
supported teamwork. Proceedings of the 27th international conference on Human
factors in computing systems, (1):2339–2348, 2009. doi: 10.1145/1518701.1519059.
URL http://dl.acm.org/citation.cfm?id=1519059.
Gregorio Convertino, Helena M. Mentis, Aleksandra Slavkovic, Mary Beth Rosson, and
John M. Carroll. Supporting common ground and awareness in emergency management
planning. ACM Transactions on Computer-Human Interaction, 18(4):1–34, dec 2011.
ISSN 10730516. doi: 10.1145/2063231.2063236. URL http://dl.acm.org/citation.
cfm?doid=2063231.2063236.
Michael Diehl and Wolfgang Strpebe. Productivity Loss In Brainstorming Groups :
Toward the Solution of a Riddle. Journal of personality and social psychology, 53(3):
497–509, 1987. doi: 10.1037/0022-3514.53.3.497.
Director of National Intelligence. Vision 2015: A Globally Networked and Integrated
Intelligence Enterprise. Technical report, 2008.
Brian Dorn, Larissa B Schroeder, and Adam Stankiewicz. Piloting TrACE : Exploring
Spatiotemporal Anchored Collaboration in Asynchronous Learning. In CSCW ’15

127
Proceedings of the 18th ACM Conference on Computer Supported Cooperative Work &
Social Computing, pages 393–403, 2015. ISBN 9781450329224.
Kristin A Duncan and Jonathan L Wilson. A Multinomial-Dirichlet Model for Analysis
of Competing Hypotheses. Risk analysis, 28(6):1699–1709, 2008.
WK Edwards and ED Mynatt. Timewarp: techniques for autonomous collaboration. In
Proceedings of ACM Conference on Human Factors in Computing Systems (CHI’97),
pages 218–225, Atlanta, GA, 1997. URL http://dl.acm.org/citation.cfm?id=
258710.
Umer Farooq, Craig H. Ganoe, John M. Carroll, and C. Lee Giles. Designing for e-science:
Requirements gathering for collaboration in CiteSeer. International Journal of Human
Computer Studies, 67(4):297–312, 2009. ISSN 10715819. doi: 10.1016/j.ijhcs.2007.10.
005.
E McClung Fleming. Artifact study: A proposed model. Winterthur Portfolio, 9:153–173,
1974.
Gunnar Forsen, Thomas Lundin, and Jonas Lowgren. Pinpoint: A design study in
interactive visualization for finding people in a large organization. Information Vi-
sualization, 9(2):141–151, 2009. ISSN 1473-8716. doi: 10.1057/ivs.2009.14. URL
http://ivi.sagepub.com/lookup/doi/10.1057/ivs.2009.14.
Craig H. Ganoe, Jacob P. Somervell, Dennis C. Neale, Philip L Isenhour, John M. Carroll,
Mary Beth Rosson, and D. Scott McCrickard. Classroom BRIDGE: Using Collaborative
Public and Desktop Timelines to Support Activity Awareness. Proceedings of the 16th

128
annual ACM Symposium on User Interface Software and Technology (UIST’03), 5(2):
21–30, 2003. doi: 10.1145/964696.964699. URL http://dl.acm.org/citation.cfm?
id=964699.
C. Gorg, Z. Liu, and J. Stasko. Reflections on the evolution of the Jigsaw visual analytics
system. Information Visualization, 13(4):336–345, jul 2014. ISSN 1473-8716. doi:
10.1177/1473871613495674. URL http://ivi.sagepub.com/lookup/doi/10.1177/
1473871613495674.
David Gotz and Michelle X Zhou. Characterizing users’ visual analytic activity for
insight provenance. Information Visualization, 8(1):42–55, 2009. ISSN 1473-8716.
doi: 10.1057/ivs.2008.31. URL http://ivi.sagepub.com/lookup/doi/10.1057/ivs.
2008.31.
Nitesh Goyal and Susan R Fussell. E↵ects of Sensemaking Translucence on Distributed
Collaborative Analysis. In CSCW ’16 Proceedings of the 18th ACM Conference on
Computer Supported Cooperative Work & Social Computing, 2016.
Nitesh Goyal, Gilly Leshed, and SR Fussell. E↵ects of visualization and note-taking
on sensemaking and analysis. In CHI ’13 Proceedings of the SIGCHI Conference on
Human Factors in Computing Systems, pages 2721–2724, 2013. ISBN 9781450318990.
URL http://dl.acm.org/citation.cfm?id=2481376.
Nitesh Goyal, Gilly Leshed, Dan Cosley, and Susan R. Fussell. E↵ects of Implicit Sharing
in Collaborative Analysis. In Proceedings of the Proceedings of the SIGCHI Conference

129
on Human Factors in Computing Systems, pages 129–138, 2014. ISBN 9781450324731.
URL http://www.cs.cornell.edu/{~}ngoyal/1470{_}Chi2014.pdf.
E. Graves. Depicting strategic warning: A new model for the age of information operations.
Technical report, 2000.
Saul Greenberg. Sharing views and interactions with single-user applications. COCS
’90 Proceedings of the ACM SIGOIS and IEEE CS TC-OA conference on O�ce
information systems, 11(2-3):227–237, 1990. ISSN 08940819. doi: 10.1145/91478.
91546. URL http://dl.acm.org/citation.cfm?id=91546{%}5Cnhttp://portal.
acm.org/citation.cfm?doid=91478.91546.
Saul Greenberg and Michael Rounding. The Notification Collage: Posting Information to
Public and Personal Displays. Proceedings of the SIGCHI Conference on Human Factors
in Computing Systems (CHI ’01), 3(3):514–521, 2001. doi: 10.1145/365024.365339.
URL http://portal.acm.org/citation.cfm?doid=365024.365339.
Jonathan Grudin. Computer-supported cooperative work: History and Focus. Computer,
27(5):19–26, 1994. URL http://www.computer.org/csdl/mags/co/1994/05/r5019.
pdf.
Hua Guo, Steven R. Gomez, Caroline Ziemkiewicz, and David H. Laidlaw. A Case Study
Using Visualization Interaction Logs and Insight Metrics to Understand How Analysts
Arrive at Insights. IEEE Transactions on Visualization and Computer Graphics, 22(1):
51–60, 2016. ISSN 10772626. doi: 10.1109/TVCG.2015.2467613.

130
Carl Gutwin and Saul Greenberg. E↵ects of awareness support on groupware usability.
In Proceedings of the SIGCHI conference on . . . , pages 511–518, 1998a. URL http:
//dl.acm.org/citation.cfm?id=274713.
Carl Gutwin and Saul Greenberg. Design for Individuals , Design for Groups : Tradeo↵s
Between Power and Workspace Awareness. In CSCW ’98 Proceedings of the 1998 ACM
conference on Computer supported cooperative work, pages 207–216, New York, NY,
USA, 1998b. URL http://dl.acm.org/citation.cfm?id=289495.
Carl Gutwin, Saul Greenberg, and Mark Roseman. Workspace awareness support with
radar views. In Conference companion on Human factors in computing systems common
ground - CHI ’96, pages 210–211, New York, New York, USA, 1996. ACM Press. ISBN
0897918320. doi: 10.1145/257089.257286. URL http://portal.acm.org/citation.
cfm?doid=257089.257286.
Amir Hossein Hajizadeh, Melanie Tory, and Rock Leung. Supporting awareness through
collaborative brushing and linking of tabular data. IEEE transactions on visualization
and computer graphics, 19(12):2189–97, dec 2013. ISSN 1941-0506. doi: 10.1109/TVCG.
2013.197. URL http://www.ncbi.nlm.nih.gov/pubmed/24051785.
Frank Hardisty and Anthony C Robinson. The geoviz toolkit: using component-oriented
coordination methods for geographic visualization and analysis. International Journal
of Geographical Information Science, 25(2):191–210, 2011.
Sandra G. Hart and Lowell E. Staveland. Development of NASA-TLX (Task Load Index):
Results of Empirical and Theoretical Research. Advances in Psychology, 52(C):139–183,

131
1988. ISSN 01664115. doi: 10.1016/S0166-4115(08)62386-9.
Christian Heath, Marcus Sanchez Svensson, Jon Hindmarsh, Paul Lu↵, and Dirk vom
Lehn. Configuring Awareness. Computer Supported Cooperative Work (CSCW), 11
(3-4):317–347, sep 2002. ISSN 0925-9724. doi: 10.1023/A:1021247413718. URL
http://link.springer.com/10.1023/A:1021247413718.
Je↵rey Heer, Jock D. Mackinlay, Chris Stolte, and Maneesh Agrawala. Graphical
histories for visualization: Supporting analysis, communication, and evaluation. IEEE
Transactions on Visualization and Computer Graphics, 14(6):1189–1196, 2008. ISSN
10772626. doi: 10.1109/TVCG.2008.137.
Linda D. Henman. Groups as Systems. In Randy Y. Hirokawa, S. Robert, Larry A.
Samovar, and Linda A. Henman, editors, Small group communication theory & practice:
An anthology, pages 3–7. Oxford University Press, New York, 8th edition, 2003. ISBN
978-0-19-533000-7.
Thomas Herrmann, Alexander Nolte, and Michael Prilla. Awareness support for com-
bining individual and collaborative process design in co-located meetings. Com-
puter Supported Cooperative Work, 22(2-3):241–270, 2013. ISSN 09259724. doi:
10.1007/s10606-012-9179-x.
Richards J Heuer. Psychology of intelligence analysis. Lulu.com, 1999.
RJ Heuer. The Evolution of Structured Analytic Techniques. Presentation to the
National Academy of Science, page 9, 2009. URL https://www.e-education.psu.
edu/drupal6/files/sgam/DNI{_}Heuer{_}Text.pdf.
132
Jim Hollan and Scott Stornetta. Beyond being there. In Proceedings of the SIGCHI
conference on Human factors in computing systems, pages 119–125, 1992.
S. Hopfer and a. M. MacEachren. Leveraging the potential of geospatial annotations
for collaboration: a communication theory perspective. International Journal of
Geographical Information Science, 21(8):921–934, sep 2007. ISSN 1365-8816. doi:
10.1080/13658810701377780. URL http://www.tandfonline.com/doi/abs/10.1080/
13658810701377780.
IBM. i2 Analyst’s Notebook, 2017. URL http://www-03.ibm.com/software/products/
en/analysts-notebook/.
P. Isenberg, N. Elmqvist, J. Scholtz, D. Cernea, and H. Hagen. Collaborative visualization:
Definition, challenges, and research agenda. Information Visualization, 10(4):310–326,
jul 2011. ISSN 1473-8716. doi: 10.1177/1473871611412817. URL http://ivi.sagepub.
com/lookup/doi/10.1177/1473871611412817.
Petra Isenberg, Anthony Tang, and Sheelagh Carpendale. An exploratory study of visual
information analysis. Proceeding of the twenty-sixth annual CHI conference on Human
factors in computing systems - CHI ’08, page 1217, 2008. doi: 10.1145/1357054.1357245.
URL http://portal.acm.org/citation.cfm?doid=1357054.1357245.
Bernard J Jansen and Soo Young Rieh. The seventeen theoretical constructs of information
searching and information retrieval. Journal of the American Society for Information
Science and Technology, 61(8):1517–1534, 2010. ISSN 1532-2890. doi: 10.1002/asi.21358.
URL http://dx.doi.org/10.1002/asi.21358.

133
Sean Kandel, Andreas Paepcke, Joseph M Hellerstein, and Je↵rey Heer. Enterprise data
analysis and visualization: An interview study. IEEE Transactions on Visualization
and Computer Graphics, 18(12):2917–2926, 2012.
R Kang and S Kiesler. Do collaborators’ annotations help or hurt asynchronous
analysis. In Proceedings of the ACM Conference on Computer Supported Cooper-
ative Work, CSCW, pages 123–126, 2012. ISBN 9781450310512. doi: 10.1145/
2141512.2141558. URL http://www.scopus.com/inward/record.url?eid=2-s2.
0-84858204541{&}partnerID=40{&}md5=db57ea891bd25aad9db852939038fe04.
R Kang, a Kane, and S Kiesler. Teammate inaccuracy blindness: when information
sharing tools hinder collaborative analysis. Proceedings of the 17th ACM conference on
Computer supported cooperative work & social computing, pages 797–806, 2014. doi:
10.1145/2531602.2531681. URL http://dl.acm.org/citation.cfm?id=2531681.
Y.-a. Kang and J. Stasko. Characterizing the intelligence analysis process through a
longitudinal field study: Implications for visual analytics. Information Visualization,
13(2):134–158, dec 2012a. ISSN 1473-8716. doi: 10.1177/1473871612468877. URL
http://ivi.sagepub.com/lookup/doi/10.1177/1473871612468877.
Youn-ah Kang and John Stasko. Characterizing the intelligence analysis process:
Informing visual analytics design through a longitudinal field study. In 2011
IEEE Conference on Visual Analytics Science and Technology (VAST), pages 21–
30. Ieee, oct 2011. ISBN 978-1-4673-0014-8. doi: 10.1109/VAST.2011.6102438. URL
http://ieeexplore.ieee.org/lpdocs/epic03/wrapper.htm?arnumber=6102438.

134
Youn-ah Kang and John Stasko. Examining the use of a visual analytics system for
sensemaking tasks: Case studies with domain experts. Visualization and Computer
Graphics, IEEE Transactions, 18(12):2869–2878, 2012b. URL http://ieeexplore.
ieee.org/xpls/abs{_}all.jsp?arnumber=6327293.
Christopher W. Karvetski, Kenneth C. Olson, Donald T. Gantz, and Glenn A. Cross.
Structuring and analyzing competing hypotheses with Bayesian networks for intelligence
analysis. EURO Journal on Decision Processes, 1(3-4):205–231, 2013. ISSN 2193-9438.
doi: 10.1007/s40070-013-0001-x.
Daniel Keim, Jorn Kohlhammer, Geo↵rey Ellis, and Florian Mansmann. Mastering
the information age: solving problems with visual analytics, volume 01. 2010. ISBN
9788578110796.
Paul L Kirk. Crime investigation; physical evidence and the police laboratory. 1953.
Paul Edward Lehner, Leonard Adelman, Brant A Cheikes, and Mark J Brown. Confirma-
tion bias in complex analyses. IEEE Transactions on Systems, Man, and Cybernetics-
Part A: Systems and Humans, 38(3):584–592, 2008.
Charles G. Lord, Lee Ross, and Mark R. Lepper. Biased assimilation and attitude
polarization: The e↵ects of prior theories on subsequently considered evidence. Journal
of Personality and Social Psychology, 37(11):2098–2109, 1979. ISSN 0022-3514. doi:
10.1037/0022-3514.37.11.2098. URL http://content.apa.org/journals/psp/37/
11/2098.

135
Alan M. MacEachren. Visual Analytics and Uncertainty: It’s Not About the Data.
EuroVis Workshop on Visual Analytics, 2015. doi: 10.2312/eurova.20151104.
Alan M MacEachren, Anthony Robinson, Susan Hopper, Steven Gardner, Robert Murray,
Mark Gahegan, and Elisabeth Hetzler. Visualizing Geospatial Information Uncertainty:
What We Know and What We Need to Know. Cartography and Geographic Information
Science, 32(3):139–160, 2005.
AM MacEachren, Isaac Brewer, and Erik Steiner. Geovisualization to me-
diate collaborative work: Tools to support di↵erent-place knowledge con-
struction and decision-making. In 20th International cartographic con-
ference, pages 6–10, 2001. URL http://pdf.aminer.org/000/239/533/
multi{_}user{_}collaborative{_}visual{_}program{_}development.pdf.
Narges Mahyar and Melanie Tory. Supporting Communication and Coordination in
Collaborative Sensemaking. Visualization and Computer Graphics, IEEE Transactions
on, 20(12):1633 – 1642, 2013.
Jennifer Marlow and Laura Dabbish. The E↵ects of Visualizing Activity History on
Attitudes and Behaviors in a Peer Production Context. In CSCW ’15 Proceedings of the
18th ACM Conference on Computer Supported Cooperative Work & Social Computing,
pages 757–764, 2015. ISBN 9781450329224.
Iulian Martin. Current training approaches in intelligence analysis. In The International
Annual Scientific Session Strategies XXI 2, 2014.
136
Kristi Morton, Magdalena Balazinska, Dan Grossman, Robert Kosara, and Jock Mackinlay.
Public Data and Visualizations: How are Many Eyes and Tableau Public Used for
Collaborative Analytics? In ACM SIGMOD, pages 17–22, 2014a.
Kristi Morton, Magdalena Balazinska, Dan Grossman, and Jock Mackinlay. Support the
Data Enthusiast: Challenges for Next-Generation Data-Analysis Systems. In Proceed-
ings of the VLDB Endowment,, volume 7, pages 453–456, 2014b. doi: 10.14778/2732279.
2732282. URL http://homes.cs.washington.edu/{~}kmorton/p446-morton.pdf.
Syavash Nobarany, Mona Haraty, and Brian Fisher. Facilitating the Reuse Process in
Distributed Collaboration: A Distributed Cognition Approach. In Proceedings of the
ACM 2012 conference on Computer Supported Cooperative Work, pages 1223–1232,
2012. ISBN 9781450310864. URL http://dl.acm.org/citation.cfm?id=2145388.
Stan Nowak, Lyn Bartram, and Pascal Haegeli. Designing for Ambiguity: Visual Analytics
in Avalanche Forecasting. pages 1–5, 2020. URL http://arxiv.org/abs/2009.02800.
Gary M Olson and Judith S Olson. Distance Matters. Human-Computer Interaction, 15
(2):139–178, 2000.
Judith S Olson, Dakuo Wang, Gary M Olson, and Jingwen Zhang. How People Write
Together Now: Beginning the Investigation with Advanced Undergraduates in a Project
Course. ACM Transactions on Computer-Human Interaction (TOCHI), 24(4):1–40,
2017. doi: 10.1145/3038919. URL http://dx.doi.org/10.1145/3038919.
Alex T. Pang, Craig M. Wittenbrink, and Suresh K. Lodha. Approaches to uncertainty
visualization. The Visual Computer, 13(8):370–390, 1997. ISSN 01782789. doi:
137
10.1007/s003710050111. URL http://citeseerx.ist.psu.edu/viewdoc/download?
doi=10.1.1.47.4128{&}rep=rep1{&}type=pdf.
PARC. ACH, 2017. URL http://www2.parc.com/istl/projects/ach/ach.html.
SA Paul and MC Reddy. Understanding together: sensemaking in collaborative
information seeking. In Proceedings of the 2010 ACM conference on Computer
supported cooperative work, pages 321–330, 2010. ISBN 9781605587950. URL
http://dl.acm.org/citation.cfm?id=1718976.
Susan M Pearce. Thinking about things. Interpreting objects and collections, pages
125–132, 1994.
Peter Pirolli and Stuart Card. The Sensemaking Process and Leverage Points for
Analyst Technology as Identified Through Cognitive Task Analysis. In Proceedings
of International Conference on Intelligence Analysis., pages 2–4, 2005. URL http:
//vadl.cc.gatech.edu/documents/2{_}{_}card-sensemaking.pdf.
Brian Prue, Michael Jenkins, Lauren D Stern, and Jonathan Pfautz. Overcoming limited
collaboration channels in distributed intelligence analysis: Visualization tools and
design seeds. In 2014 IEEE Joint Intelligence and Security Informatics Conference,
pages 17–24. IEEE, 2014.
R Core Team. R: A Language and Environment for Statistical Computing, 2016. URL
https://www.r-project.org/.
Madhu C. Reddy and Bernard J. Jansen. A model for understanding collaborative infor-
mation behavior in context: A study of two healthcare teams. Information Processing &

138
Management, 44(1):256–273, jan 2008. ISSN 03064573. doi: 10.1016/j.ipm.2006.12.010.
URL http://linkinghub.elsevier.com/retrieve/pii/S0306457307000313.
H. W J Rittel and Melvin M. Webber. Dilemmas in a general theory of planning. Policy
Sciences, 4(2):155–169, 1973. ISSN 00322687. doi: 10.1007/BF01405730.
Anthony C. Robinson. Collaborative synthesis of visual analytic results. In 2008
IEEE Symposium on Visual Analytics Science and Technology, pages 67–74. Ieee,
oct 2008. ISBN 978-1-4244-2935-6. doi: 10.1109/VAST.2008.4677358. URL http:
//ieeexplore.ieee.org/lpdocs/epic03/wrapper.htm?arnumber=4677358.
Harvey Sacks and Gail Je↵erson. Lectures on conversation. 1995.
Wendy A Schafer, John M Carroll, Steven R Haynes, and Stephen Abrams. Emergency
management planning as collaborative community work. Journal of Homeland Security
and Emergency Management, 5(1), 2008.
Kjeld Schmidt. The Problem with ’Awareness’. In Computer Supported Cooperative
Work (CSCW), pages 285–298, 2002.
Jean Scholtz and Alex Endert. User-centered design guidelines for collaborative software
for intelligence analysis. 2014 International Conference on Collaboration Technologies
and Systems (CTS), pages 478–482, 2014. doi: 10.1109/CTS.2014.6867610. URL
http://ieeexplore.ieee.org/lpdocs/epic03/wrapper.htm?arnumber=6867610.
Jan Maarten Schraagen, Susan F Chipman, and Valerie L Shalin. Cognitive task analysis.
Psychology Press, 2000.

139
Jana Schumann, Tanja Buttler, and Stephan Lukosch. An approach for asynchronous
awareness support in collaborative non-linear storytelling. Computer Supported Coop-
erative Work, 22(2-3):271–308, 2013. ISSN 09259724. doi: 10.1007/s10606-012-9162-6.
Chirag Shah. Collaborative information seeking. Journal of the Associa-
tion for Information Science and Technology, 65(2):215–236, 2014. doi: 10.
1002/asi. URL https://sils.unc.edu/sites/default/files/publications/
isss2008-final-report-v5d1.pdf{#}page=46.
Ben Shneiderman. The eyes have it: A task by data type taxonomy for information
visualizations. In The craft of information visualization, pages 364–371. Elsevier, 2003.
Malcolm K. Sparrow. The application of network analysis to criminal intelligence: An
assessment of the prospects. Social Networks, 13(3):251–274, 1991. ISSN 03788733.
doi: 10.1016/0378-8733(91)90008-H.
Gerry Stahl. Group cognition: Computer support for building collaborative knowledge.
Mit Press Cambridge, MA, 2006.
John Stasko, Carsten Gorg, and Robert Spence. Jigsaw: supporting investigative
analysis through interactive visualization. Information Visualization, 7(2):118–132,
2008. ISSN 1473-8716. doi: 10.1057/palgrave.ivs.9500180. URL http://ivi.sagepub.
com/lookup/doi/10.1057/palgrave.ivs.9500180.
Mark Stefik, Daniel G Bobrow, Gregg Foster, Stan Lanning, and Deborah Tatar. WYSI-
WIS revised: early experiences with multiuser interfaces. ACM Transactions on
Information Systems (TOIS), 5(2):147–167, 1987.

140
Igor Steinmacher, Ana Paula Chaves, and Marco Aurelio Gerosa. Awareness support in
distributed software development: A systematic review and mapping of the literature.
Computer Supported Cooperative Work, 22(2-3):113–158, 2013. ISSN 09259724. doi:
10.1007/s10606-012-9164-4.
James J Thomas. Illuminating the path: the research and development agenda for visual
analytics. IEEE Computer Society, 2005.
B. Tomaszewski and Alan M. MacEachren. Geovisual analytics to support crisis man-
agement: Information foraging for geo-historical context. Information Visualization,
11(4):339–359, sep 2012. ISSN 1473-8716. doi: 10.1177/1473871612456122. URL
http://ivi.sagepub.com/lookup/doi/10.1177/1473871612456122.
Tim van Gelder. Can we do better than ACH? Australian Institute of Professional
Intelligence O�cers News, 55, 2008.
Fernanda B. Viegas, Martin Wattenberg, Frank Van Ham, Jesse Kriss, and Matt McK-
eon. Many Eyes: A site for visualization at internet scale. IEEE Transactions on
Visualization and Computer Graphics, 13(6):1121–1128, 2007. ISSN 10772626. doi:
10.1109/TVCG.2007.70577.
Colin Ware. Information visualization: perception for design. Elsevier, 2012.
Norman Warner, Lisa Burkman, and H. C. Biron. Special Operations Reconnaissance
(SOR) Scenario: Intelligence Analysis and Mission Planning, 2008. URL http://
dodreports.com/ada483249.

141
Daniel M Wegner. Transactive memory: A contemporary analysis of the group mind. In
Theories of group behavior, pages 185–208. Springer, 1987.
K Wheaton. Wikis in intelligence. Unpublished manuscript, 2011.
Kanit Wongsuphasawat, Yang Liu, and Je↵rey Heer. Goals, Process, and Challenges of
Exploratory Data Analysis: An Interview Study. arXiv preprint arXiv:1911.00568,
2019.
William Wright, David Schroh, Pascale Proulx, Alex Skaburskis, and Brian Cort. The
Sandbox for analysis: concepts and methods. Proc. CHI ’06, pages 801–810, 2006.
doi: 10.1145/1124772.1124890. URL http://portal.acm.org/citation.cfm?id=
1124772.1124890.
Lu Xiao. THE EFFECTS OF RATIONALE AWARENESS IN HYBRID COLLABORA-
TIVE LEARNING ACTIVITIES. PhD thesis, 2008.
Ji Soo Yi, Youn Ah Kang, John Stasko, and Julie Jacko. Toward a deeper understanding of
the role of interaction in information visualization. IEEE transactions on visualization
and computer graphics, 13(6):1224–31, 2007. ISSN 1077-2626. doi: 10.1109/TVCG.
2007.70515. URL http://www.ncbi.nlm.nih.gov/pubmed/17968068.
Robert Boleslaw Zajonc. Social facilitation. Science, New Series, 149(3681):269–274,
1965.
John Zimmerman, Jodi Forlizzi, and Shelley Evenson. Research through design as a
method for interaction design research in HCI. In Proceedings of the SIGCHI conference
on Human factors in computing systems - CHI ’07, page 493, New York, New York,
142
USA, 2007. ACM Press. ISBN 9781595935939. doi: 10.1145/1240624.1240704. URL
http://portal.acm.org/citation.cfm?doid=1240624.1240704.
Torre Danna Zuk. Visualizing Uncertainty. PhD thesis, University of Calgary,
2008. URL http://citeseerx.ist.psu.edu/viewdoc/download?doi=10.1.1.47.
4128{&}rep=rep1{&}type=pdf.

VITA DONG CHEN 8149540602 | [email protected] | twitter/@imdongchen | medium/@imdongchen
Education
PhD, Informatics Pennsylvania State University 2012 – present
Research in Human Computer Interaction and data visualization.
Master, Earth Science Chinese University of Hong Kong 2011 – 2012
Scientific visualization of air pollution.
Bachelor, Geographic Information Science Zhejiang University 2007 – 2011
Publication
• Chen, D., Bellamy, R. K., Malkin, P. K., & Erickson, T. Diagnostic visualization for non-expert machine learning practitioners: A design study. In Visual Languages and Human-Centric Computing (VL/HCC), 2016 IEEE Symposium on (pp. 87-95).
• Chen, Dong. "A Classroom Study of Supporting Collaborative Information Analysis using Advanced Technology." Proceedings of the 34th ACM International Conference on the Design of Communication. ACM, 2016.
• Chen, Dong. "Supporting Collaborative Information Analysis with Interactive Visualization." Visual Languages and Human-Centric Computing (VL/HCC), 2016 IEEE Symposium on.
• Tuarob, Suppawong, Wanghuan Chu, Dong Chen, and Conrad S. Tucker. "TwittDict: Extracting Social Oriented Keyphrase Semantics from Twitter." ACL-IJCNLP 2015 (2015): 25.
Experience
PayPal
MTS1/Tech Lead 2017 – present
Leading and launched the tooling/platform for UI component reusability at PayPal.
GE Global Research Center
Intern May 2016 – Aug 2016
Designed and developed a web based visual storytelling tool with data-driven. System implemented with React/Redux and D3.js.
IBM Watson Research Center
Intern May 2015 – Aug 2015
Developed and evaluated an interactive visualization tool for machine learning model tuning based on interviews with ML practitioners. Tool implemented in D3.


