
Supporting Info
Fluorescent Si QD Decoration onto Flexible Polymeric
Electrospun Nanofibrous Mat for Colorimetric Sensing of
TNT
Osman Arslan1*
Zeynep Aytac2, Tamer Uyar
1,2*
1 UNAM-National Nanotechnology Research Center, Bilkent University, 06800, Ankara, Turkey
2 Institute of Materials Science & Nanotechnology, Bilkent University, Ankara, 06800, Turkey
*Corresponding authors: T.U. [email protected] , O.A. [email protected]
Electronic Supplementary Material (ESI) for Journal of Materials Chemistry C.This journal is © The Royal Society of Chemistry 2017

Figure S1 : XPS survey analysis of the Si QD-30 and Si QD-60 samples.

Figure S2 : UV absorption features of the fluorescent Si QD after 30, 60 and 90 minutes UV
treatment.
30 min 60 min
a b
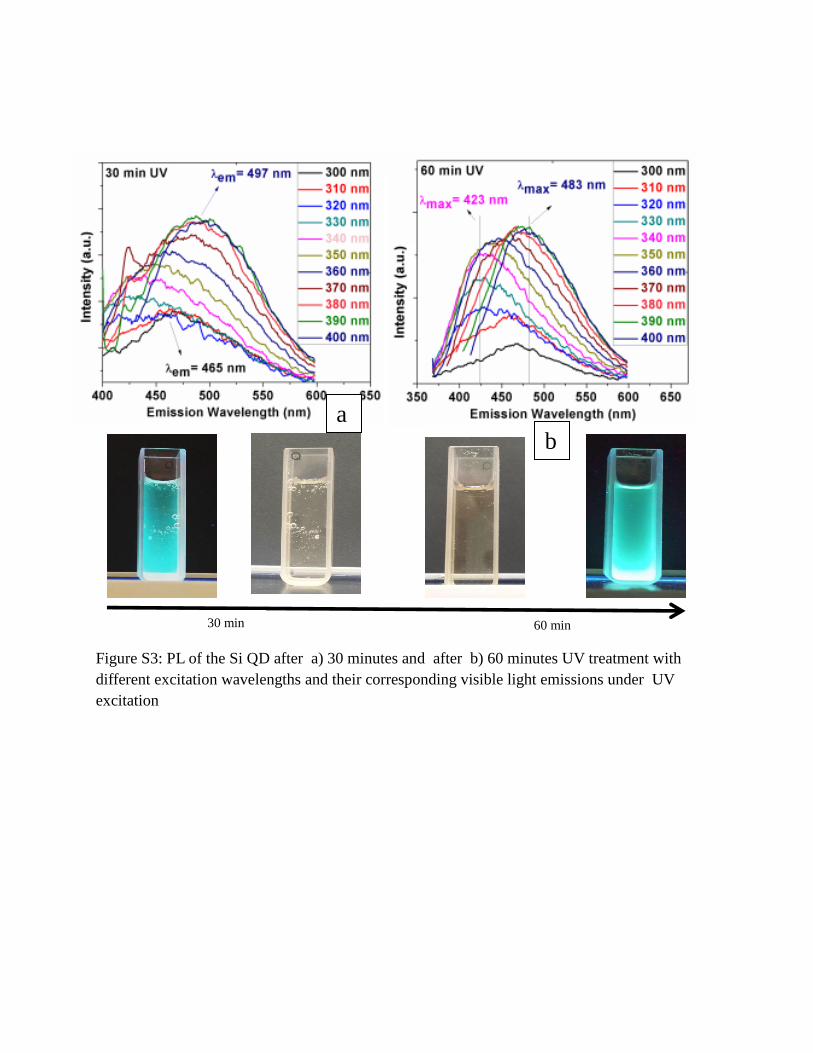
Figure S3: PL of the Si QD after a) 30 minutes and after b) 60 minutes UV treatment with
different excitation wavelengths and their corresponding visible light emissions under UV
excitation

Figure S4: a) Representative STEM images of the a) Si QD-90 b) Si QD-30 and c) Si QD-60.

Figure S5 : High resolution XPS analysis of the a) Si 2p peaks for and b) N 1s peaks.
a
b

Figure S6: 1H-NMR spectrum for the 90 minutes UV treated Si QD to detect their surface
characteristics.

Figure S7 : Deconvolution of the fluorescence peak for detecting the surface and size effects of
the Si QD.
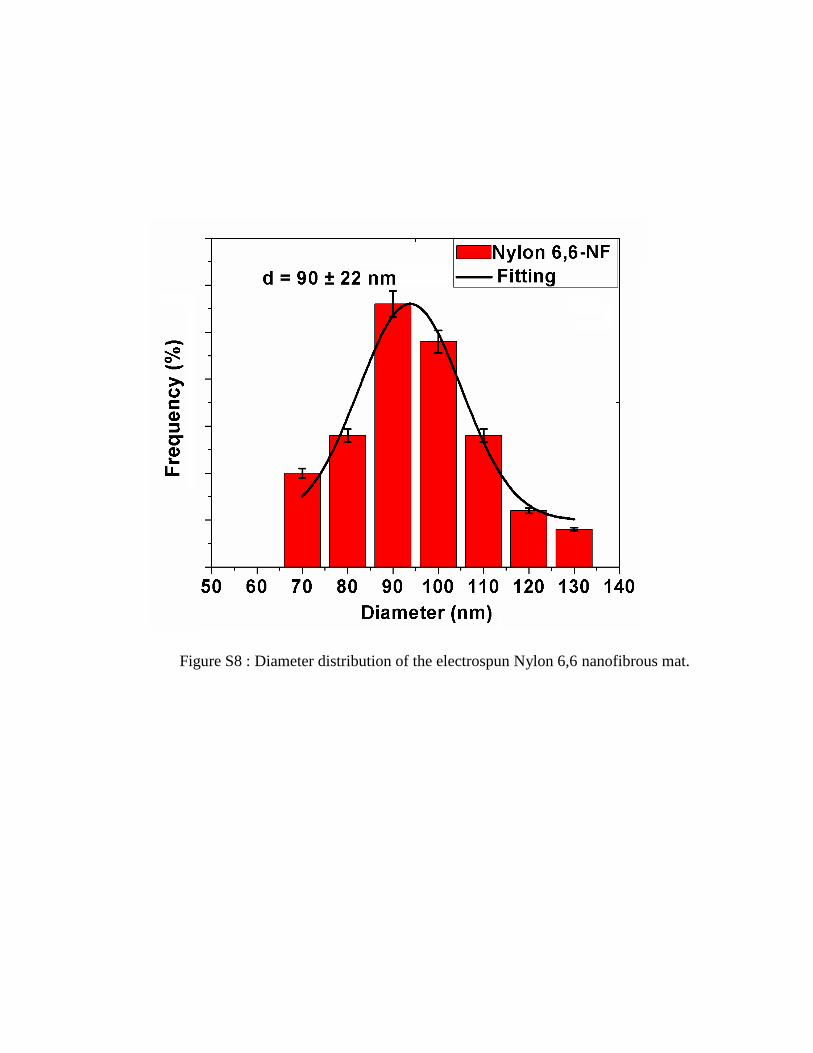
Figure S8 : Diameter distribution of the electrospun Nylon 6,6 nanofibrous mat.

Figure S9 : Quantitative EDX analysis of the three different decoration and curing
technique.

Figure S10 : FT-IR analysis and comparison for the Si QD-90 decoration onto the Nylon 6,6-NF
by impregnation and dip coating processes b) thermal analysis of the Si QD-90 decoration onto
the Nylon 6,6-NF by impregnation and dip coating processes
a b a

Figure S11 : Stern-Volmer plot for the different concentrations of the TNT b) Comparison
for the quenching efficiencies.
b a

Figure S12: a-b) Visual appearance of the dip coated Si QD-90 deposited nanofibrous mat under
UV light and visible light a) before TNT sensing, b) after TNT sensing, c) SEM image of the Si
QD-90 decorated Nylon-6-6-NF after TNT sensing.
,
c

Figure S13 : Extreme acidic and basic treatment and pH resistance of the Si QD decorated
Nylon 6,6-NF. Images of Si QD decorated Nylon 6,6 nanofibrous mat under visible light (top
images) and under UV light (bottom images)

Figure S14: Representative SEM image of the Si-90 containing SiO2 nanoparticles.

Figure S15 : a) PL quenching comparison for the PNP, TNT and pure toluene b) Comparison of
the sensing efficiencies tested with TNT, para nitro toluene (PNP)
a b


