Surviving the “Big Crunch” with insight-enabled decisions inside the plant gate
June 2, 2015
Copyright © 2015 Accenture All rights reserved.

2Copyright © 2015 Accenture All rights reserved.
Objectives
Review Accenture/ICIS survey results to understand how Chemical executives are preparing for the “Big Crunch” that often comes on the heels of a Big Bang
Preview specific actions that organizations are/should take to address OT gaps and drive Digital Plant improvements
Underscore the important role that Operational Technology (OT) will play in better positioning businesses and assets for the “Big Crunch”
Highlight industry factors that are indicative of a "Big Bang Disruption” for global chemical companies
3Copyright © 2015 Accenture All rights reserved.
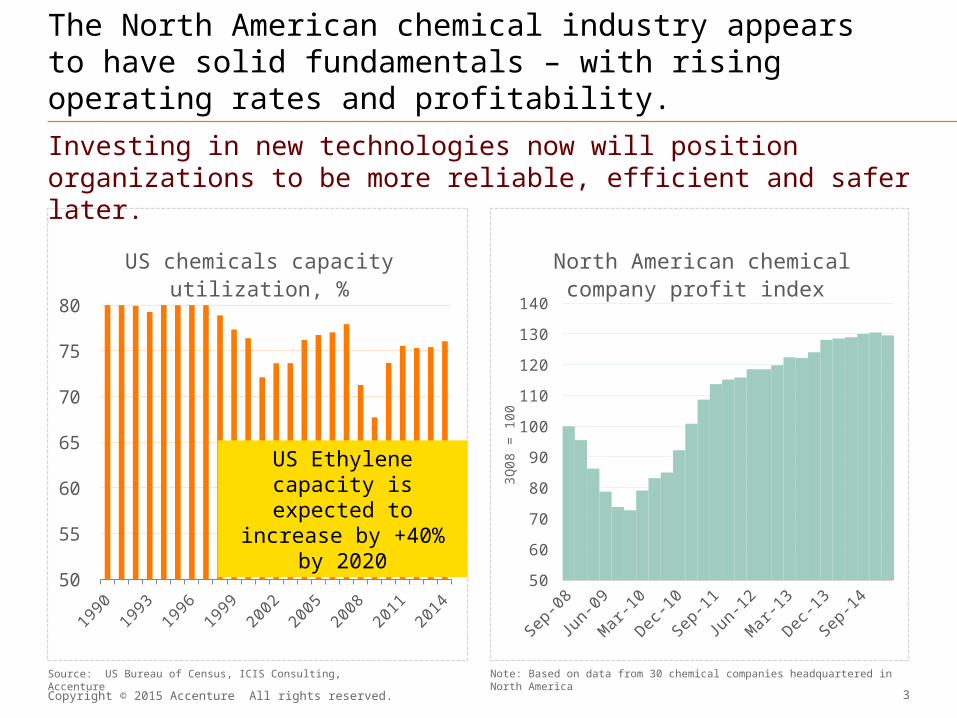
The North American chemical industry appears to have solid fundamentals – with rising operating rates and profitability.
Investing in new technologies now will position organizations to be more reliable, efficient and safer later.
2002
2004
2006
2008
2010
2012
2014
50
55
60
65
70
75
80
US chemicals capacityutilization, %
Source: US Bureau of Census, ICIS Consulting, Accenture Note: Based on data from 30 chemical companies headquartered in North America
US Ethylene capacity is expected to increase by
+40% by 2020
Mar
-09
Mar
-10
Mar
-11
Mar
-12
Mar
-13
Mar
-14
Mar
-15
50
60
70
80
90
100
110
120
130
140
North American chemical company profit index
3Q08
= 1
00

4Copyright © 2015 Accenture All rights reserved.
Despite higher utilization rates, many segments are also experiencing greater reliability issues & subsequent lost production.
Unplanned lost production for US ethylene (% of capacity)
Source: Mark W. Woods, Ethylene Strategies International, LP; 832-233-9593
Apr-10 Oct-10 Apr-11 Oct-11 Apr-12 Oct-12 Apr-13 Oct-13 Apr-14 Oct-14 Apr-150%
2%
4%
6%
8%
10%
12%
• In an effort to capture margin and push higher utilization rates, many organizations are deferring key maintenance activities
• Unfortunately immature maintenance and reliability practices result in reactive behavior
• Excessive sweating of the assets can lead costly unplanned shutdowns, higher operating losses and even disastrous consequences

Copyright © 2015 Accenture All rights reserved. 5
Survey results intuitively show that 88% of the respondents recognize the criticality of operational performance, but only 27% are making leading investments in drive improvement.
How critical is better operational performance in your segments?
What is your investment strategyin driving improvements
Focus on incremental improvement in proven technology and process controls/automation
Push industry leading advancements in technology and process controls/automation to make a "step change" improvement
Maintain "status quo" to minimize risk start-up risk
55%
27%
18%
Extremely important - Necessary for survival
Important - Necessary to be a leader in the industry
Somewhat important - Necessary to be an average performer
Not important
44%
44%
10%
2%
Source: Accenture/ICIS survey, Spring 2015
Copyright © 2015 Accenture All rights reserved. 6
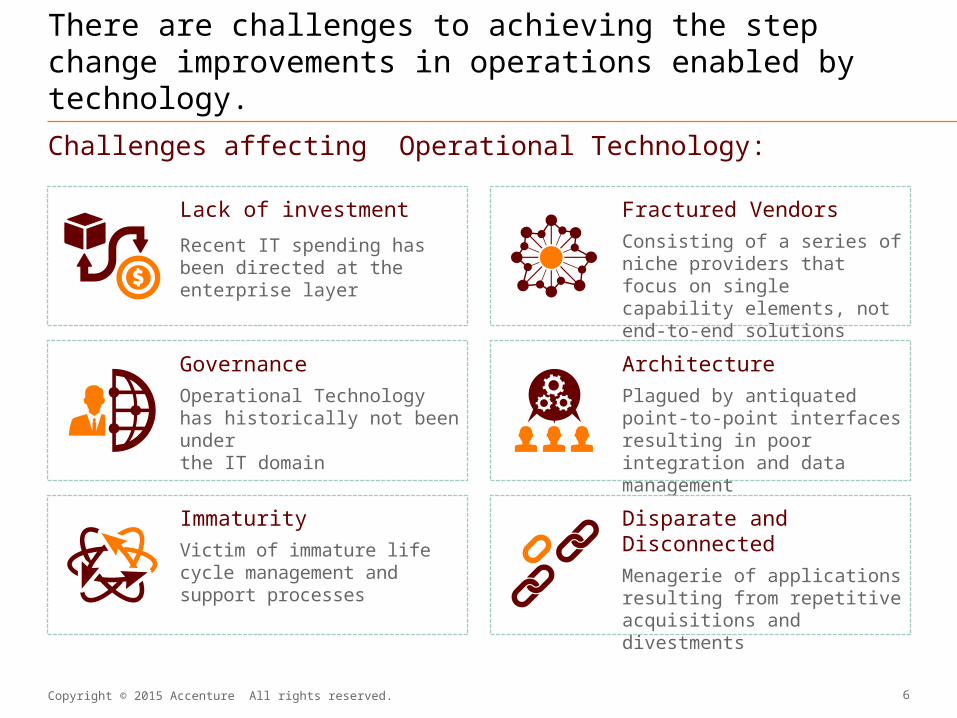
There are challenges to achieving the step change improvements in operations enabled by technology.
Challenges affecting Operational Technology:
Lack of investment
Recent IT spending has been directed at the enterprise layer
Fractured Vendors
Consisting of a series of niche providers that focus on single capability elements, not end-to-end solutions
Governance
Operational Technologyhas historically not been underthe IT domain
Immaturity
Victim of immature life cycle management and support processes
Architecture
Plagued by antiquated point-to-point interfaces resulting in poor integration and data management
Disparate and Disconnected
Menagerie of applications resulting from repetitive acquisitions and divestments

7Copyright © 2015 Accenture All rights reserved.
However, the chemical industry believes there is significant opportunity from operational improvement.
The estimated impact of operational ‘perfection’ on company’s bottom line
Less than 1% earnings improvement
1% to 3% earnings improvement
4% to 7% earnings improvement
8% to 10% earnings improvement
Greater than 10% earnings improvement
3%
21%
32%
21%
24%
Average 7.65%
*Based weighted average of 7.7% improvement of earnings level; Calculated based on global industry sales of $5.2 trillion with average operating margins of 12%..
$50billion*
Copyright © 2015 Accenture All rights reserved.
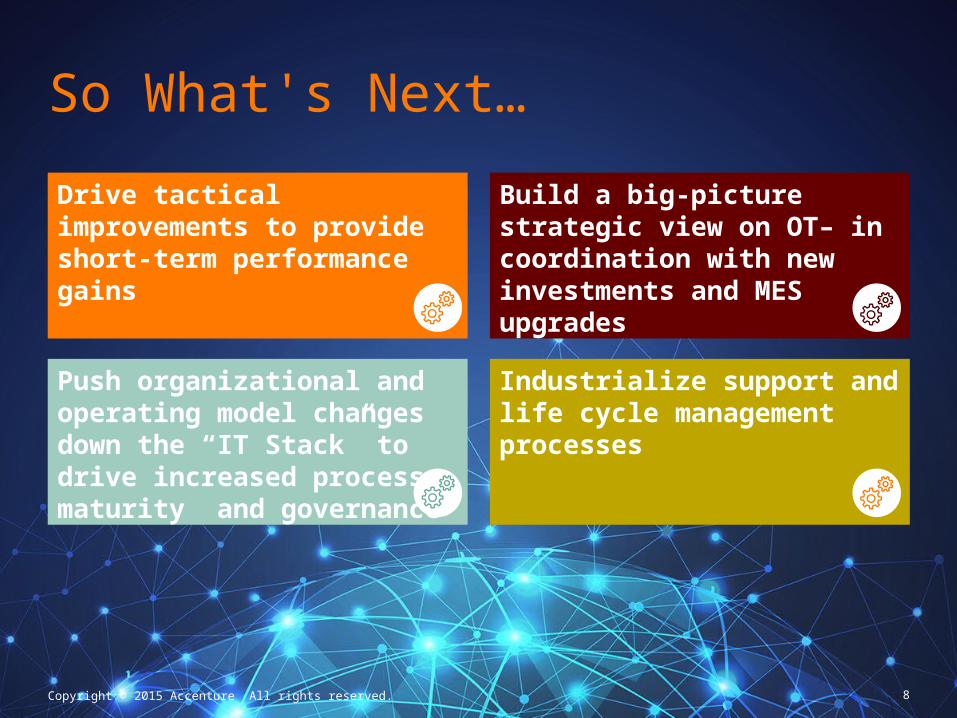
So What's Next…
8
Build a big-picture strategic view on OT– in coordination with new investments and MES upgrades
Push organizational and operating model changes down the “IT Stack” to drive increased process maturity and governance
Industrialize support and life cycle management processes
Drive tactical improvements to provide short-term performance gains

9Copyright © 2015 Accenture All rights reserved.
Digital Plant
Digital Foundation
Control Tower
Digital Workers
Digital Asset Management
Digital Operations
Talent Development & Learning
ISA-95 Lvl 2: Automation Systems
ISA-95 Lvl 1: Device I/O& Controls
ISA-95 Lvl 3: Manufacturing Ops & Control
Engineering Collaboration
OEM/MROSuppliers
Whse & ShippingContract
MFG
Contract MFG
The Digital Chemical Plant is coming.
Digital Supply Chain
FeedstockSupply
Digital Supply Chain
Sister SitesSister Sites
Offsite Pkg
Copyright © 2015 Accenture All rights reserved.
Read more:
The Digital Plant: Reaping the Rewards of Disruptionhttp://www.accenture.com/us-en/Pages/insight-digital-plant-reaping-rewards-disruption.aspx
Follow us:
10
@AccentureChems
Accenture Chemicals


